Embed Size (px)
Citation preview
Appendix D
STATISTICAL TABLES RELATING TO INCOME,EMPLOYMENT, AND PRODUCTION
CONTENTSNational income or expenditure: Page
D-l . Gross national product or expenditure, 1929-55 165D-2. Gross national product or expenditure in 1955 prices, 1929-55 166D-3. Gross national product or expenditure in 1947 prices, 1929-55 168D-4. Gross private and government product in current and 1955 prices,
1929-55 169D-5. The Nation's income, expenditure, and saving, 1953-55 170D-6. Personal consumption expenditures, 1929-55 171D-7. Gross private domestic investment, 1929-55 172D-8. National income by distributive shares, 1929-55 173D-9. Relation of gross national product and national income, 1929-55. . . . 174D-10. Relation of national income and personal income, 1929-55 175D-l l . Sources of personal income, 1929-55 176D-l2. Disposition of personal income, 1929-55 177D-l 3. Total and per capita disposable personal income and personal con-
sumption expenditures in current and 1955 prices, 1929-55 178D-l 4. Financial saving by individuals, 1939-55 179D-l5. Sources and uses of gross saving, 1929-55 180D-16. Income of the farm population, 1929-55 181
Employment and wages:D-l 7. Total population 14 years of age and over and the labor force,
1929-55 182D-l8. Employment and unemployment, by age, and by sex for 20-64 year
group, 1942-55 184D-l 9. Employed persons with a job but not at work, by reason for not
working, 1946-55 185D-20. Unemployed persons, by duration of unemployment, 1946-55 186D-21. Unemployment insurance programs, selected data, 1939 and 1946-55. 187D—22. Number of wage and salary workers in nonagricultural establish-
ments, 1929-55 188D-23. Average weekly hours of work in selected industries, 1929-55 190D—24. Average gross hourly earnings in selected industries, 1929-55 191D-25. Average gross weekly earnings in selected industries, 1929-55 192D-26. Labor turnover rates in manufacturing industries, 1930-55 193
Production and business activity:D-27. Industrial production indexes, 1929-55 194D-28. Farm production indexes, 1929-55 196D-29. Business expenditures for new plant and equipment, 1939 and
1945-56 197D-30. New construction activity, 1929-55 198D-31. New public construction activity, 1929-55 199D-32. New nonfarm housing starts, by source of funds and by type of struc-
ture, 1929-55 200
163
Digitized for FRASER http://fraser.stlouisfed.org/ Federal Reserve Bank of St. Louis
Production and business activity—Continued PageD-33. Private nonfarm housing starts and proposed home construction:
Government underwritten, 1935-55 201D-34. Sales and inventories in manufacturing and trade, 1939-55 202D-35. Manufacturers' new orders, sales, and inventories, 1939-55 203
Prices:D-36. Wholesale price indexes, 1929-55 204D-37. Wholesale price indexes by economic sector, 1947-55 206D-38. Consumer price indexes, 1929-55 208D-39. Indexes of prices received and prices paid by farmers, and parity
ratio, 1929-55 209Credit, money supply, and Federal finance:
D-40. Short- and intermediate-term consumer credit outstanding, 1929-55. . 210D-41. Instalment credit extended and repaid, 1946-55 211D-42. Mortgage debt outstanding, by type of property and of financing,
1939-55 212D-43. Loans and investments of all commercial banks, 1929-55 213D-44. Member bank reserves and Reserve Bank credit, 1929-55 214D-45. Deposits and currency, 1929-55 215D-46. Bond yields and interest rates, 1929-55 216D-47. Net public and private debt, 1945-55 218D-48. U. S. Government debt—volume and kind of obligations, 1929-55 . . . 219D-49. Estimated ownership of Federal obligations, 1939-55 220D-50. The farm balance sheet, 1940-56 221D-51. Government cash receipts from and payments to the public, calendar
years, 1946-55 222Corporate profits and finance:
D-52. Profits before and after taxes, all private corporations, 1929-55 223D-53. Relation of profits after taxes to stockholders' equity and to sales,
private manufacturing corporations, by industry group, 1947-50average and 1954-55 224
D—54. Relation of profits before and after taxes to stockholders' equity andto sales, private manufacturing corporations, by asset size class,1947-50 average and 1954-55 226
D-55. Sources and uses of corporate funds, 1946-55 227D-56. Current assets and liabilities of all corporations, 1951-55 228D—57. State and municipal and corporate securities offered, 1934—55 229D-58. Common stock prices and stock market credit, 1939-55 230D-59. Business population and business failures, 1929-55 231
International transactions:D-60. United States balance of payments, 1953-55 232D-61. United States balance of payments with individual areas, 1947 and
1953-55 233D-62. United States grants of military supplies and services, by areas, total
postwar period and fiscal years 1951-55 235D-63. United States grants and credits, excluding military supplies and serv-
ices, by areas, total postwar period and fiscal years 1954-55... 236D-64. United States merchandise exports and imports for consumption, by
leading commodities, 1936-38 average and 1950-55 237D-65. Estimated gold reserves and dollar holdings of foreign countries, 1928,
1937, and 1947-55 238
164
Digitized for FRASER http://fraser.stlouisfed.org/ Federal Reserve Bank of St. Louis
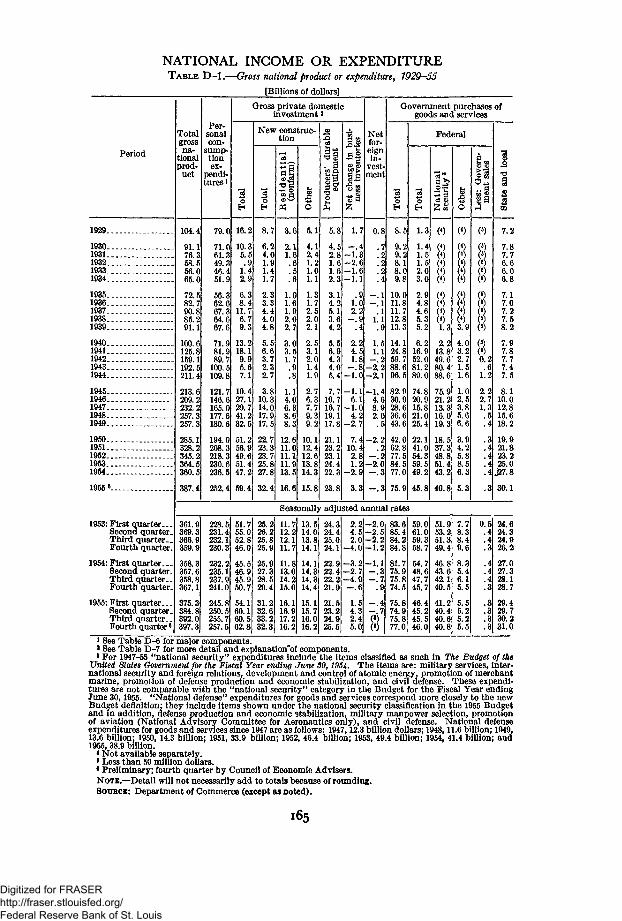
NATIONAL INCOME OR EXPENDITURETABLE D-l.—Gross national product or expenditure^ 1929-55
[Billions of dollars]
Period
1929.
1930.1931.1932.1933.1934.
1935.1936.1937.1938.1939.
1940.1941.1942.1943.1944.
1945.1946.1947.1948.1949.
1950..1951..1952..1953..1954..
1955 «..
1953: First quarter...Second quarter-Third quarter..Fourth quarter.
1954: First quarter...Second quarter-Third quarter..Fourth quarter.
1955: First quarter. __Second quarter.Third quarter..Fourth quarter6
Totalgrossna-
tionalprod-uct
104.4
91.176.58.556.065.0
72.582.790.885.291.1
100.6125.8159.1192.5211.4
213.6209.2232.2257.3257.3
285.1328.2345.2364.5360.5
387.4
Per-sonalcon-
sump-tionex-
pendi-tures i
79.0
71.061.349.346.451.9
56.362.667.364.667.6
71.981.989.7
100.5109.8
121.7146.6165.0177.6180.6
194.0208.3218.3230.6236.5
252.4
Gross private domesticinvestment2
16.2
10.35.5.9
1.42.9
6.38.4
11.76.79.3
13.218.19.95.67.1
10.427.129.741.232.5
51.256.949.651.447.2
59.4
New construc-tion
8.7
6.24.01.91.41.7
2.33.34.44.04.8
5.56.63.72.32.7
3.810.314.017.917.5
22.723.323.725.827.8
32.4
3.6
2.11.6.6.5.6
1.01.61.92.02.7
3.03.51.7
1.14.06.38.68.3
12.611.011.111.913.5
16.6
5.1
4.12.41.21.01.1
1.31.72.52.02.1
2.53.12.01.41.9
2.76.37.79.39.2
10.112.412.613.814.3
15.8
4i
5.8
4.52.81.61.62.3
3.14.25.13.64.2
5.56.94.34.05.4
7.710.716.719.117.8
21.123.223.124.422.3
23.8
Netfor-eignin-
vest-ment
1.7
- . 4- 1 . 3-2 .6-1 .6-1 .1
1.02.2
- . 9.4
2.24.51.8
- . 8-1 .0
-1 .16.1
-1 .04.2
-2 .7
7.410.42.81.2
-2 .9
0.8
.7
.2
.2
.2
.4
- . 1- . 1
.11.1
1.51.1
- . 2-2.2-2.1
-1.44.68.92.0.5
-2 .2.2
- . 2-2 .0
Government purchases ofgoods and services
8.5
9.29.28.18.09.8
10.011.811.712.813.3
14.124.859.788.696.5
82.930.928.636.643.6
42.062.877.584.577.0
75.9
Federal
1.3
1.41.51.52.03.0
2.94.84.65.35.2
6.216.952.081.289.0
74.820.915.821.025.4
22.141.054.359.549.2
45.8
881.32.2
13.849.680.4
75.921.213.316.019.3
18.537.348.851.443.2
40.8
2.22.71.3.5.4
.3
.4
.4
.3
7.2
7.87.76.66.06.8
7.17.07.27.58.2
7.97.87.77.47.5
8.110.012.815.618.2
19.921.823.2
._ 25.0
.4 J27.8
30.1
Seasonally adjusted annual rates
361.9
359.9
358.3357.6358.8367.1
375.3384.8392.0397.3
228.5231.4232.1230.3
232.2235.1237.9241.0
245.8250.5255.7257.5
51.755.052.846.0
45.546.945.950.7
54.160.160.562.8
25.226.225.825.9
25.927.328.529.4
31.232.633.232.3
11.712.212.111.7
11.813.014.215.0
16.116.917.216.2
13.514.013.814.1
14.114.314.314.4
15.115.716.016.2
24.324.425.024.1
22.922.422.221.9
21.523.224.925.5
2.24.52.0
-4 .0
-3 .2- 2 . 7-4 .9
- . 6
1.54.32.45.0
-2 .0-2 .5-2 .2-1 .2
- 1 . 1- . 3- . 7
.9
- . 4- . 7(8)(8)
83.685.484.284.8
81.775.975.874.5
75.874.975.877.0
59.061.059.358.7
54.748.647.745.7
46.445.245.546.0
51.953.251.349.4
46.843.642.140.5
41.240.440.640.8
7.78.38.49.6
8.35.46.15.5
5.55.25.25.5
0.5.4.4. 3
.4
.4
.4
. 3
. 3
. 3
.3
.3
24.624.324.926.2
27.027.328.128.7
29.429.730.231.0
1 See Table D-6 for major components.8 See Table D-7 for more detail and explanation^ components.1 For 1947-55 "national security" expenditures include the items classified as such in The Budget of the
United States Government for the Fiscal Year ending June SO, 1954. The items are: military services, inter-national security and foreign relations, development and control of atomic energy, promotion of merchantmarine, promotion of defense production and economic stabilization, and civil defense. These expendi-tures are not comparable with the "national security" category in the Budget for the Fiscal Year endingJune 30,1955. "National defense" expenditures for goods and services correspond more closely to the newBudget definition; they include items shown under the national security classification in the 1955 Budgetand in addition, defense production and economic stabilization, military manpower selection, promotionof aviation (National Advisory Committee for Aeronautics only), and civil defense. National defenseexpenditures for goods and services since 1947 are as follows: 1947,12.3 billion dollars; 1948,11.6 billion; 1949.13.6 billion; 1950, 14.3 billion; 1951, 33.9 billion; 1952, 46.4 billion; 1953, 49.4 billion; 1954, 41.4 billion; and1955, 38.9 billion.
«Not available separately.8 Less than 50 million dollars.6 Preliminary; fourth quarter by Council of Economic Advisers.NOTE.—Detail will not necessarily add to totals because of rounding.SOURCE: Department of Commerce (except as noted).
165
Digitized for FRASER http://fraser.stlouisfed.org/ Federal Reserve Bank of St. Louis
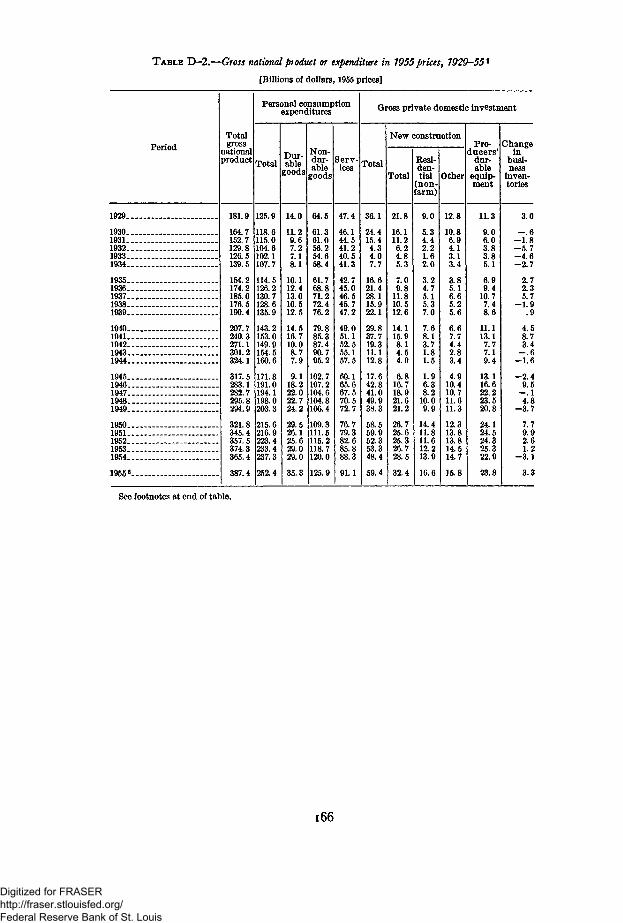
TABLE D-2.—Gross national product or expenditure in 1955 prices, 1929-55x
[Billions of dollars, 1955 prices]
Period
1929
1930 . _1931193219331934
19351936193719381939
1940194119421943 . _1944
19451946194719481949
19501951 _19521953 .1954
1955« .
Totalgross
nationalproduct
181.9
164.7152.7129.8126.5139.5
154.2174.2185.0176.5190.4
207.7240.3271.1301.2324.1
317.5283.1282.7295.8294.9
321.8345.4357.5374.3365.4
387.4
Personal consumptionexpenditures
Total
125.9
118.6115.0104.6102.1107.7
114.5126.2130.7128.6135.9
143.2153.0149.9154.5160.6
171.8191.0194.1198.0203.3
215.6216.9223.4233.4237.3
252.4
Dur-able
goods
14.0
11.29.67.27.18.1
10.112.413.010.512.5
14.516.710.08.77.9
9.118.222.022.724.2
29.526.125-629.029.0
35.3
Non-dur-able
goods
64.5
61.361.056.254.658.4
61.768.871.272.476.2
79.885.387.490.795.2
102.7107.2104.6104.8106.4
109.3111.5115.2118.7120.0
125.9
Serv-ices
47.4
46.144.541.240.541.3
42.745.046.545.747.2
49.051.152.555.157.5
60.165.667.570.572.7
76.779.382.685.888.3
91.1
Gross private domestic investment
Total
36.1
24.415.44.34.07.7
16.621.428.115.922.1
29.837.719.311.112.8
17.642.841.049.938.3
58.559.952.353.348.4
59.4
New construction
Total
21.8
16.111.26.24.85.3
7.09.8
11.810.512.6
14.115.98.14.54.9
6.816.718.921.621.2
26.725625.326.728.5
32.4
Resi-den-tial
[non-farm)
9.0
5.34.42.21.62.0
3.24.75.15.37.0
7.68.13.71.81.5
1.96.38.2
10.09.9
14.411.811.612.213.9
16.6
Other
12.8
10.86.94.13.13.4
3.85.16.65.25.6
6.67.74.42.83.4
4.910.410.711.611.3
12.313.813.814.514.7
15.8
Pro-ducers '
dur-able
equip-ment
11.3
9.06.03.83.85.1
6.99.4
10.77.48.6
11.113.17.77.19.4
13.116.622.223.520.8
24.124.524.325.322.9
23.8
Changein
busi-ness
inven-tories
3.0
- . 6- 1 . 8- 5 . 7- 4 . 6- 2 . 7
2.72.35.7
- 1 . 9.9
4.58.73.4
- . 6- 1 . 6
- 2 . 49.5
—. 14.8
- 3 . 7
7.79.92.61.2
- 3 . 1
3.3
See footnotes at end of table.
166
Digitized for FRASER http://fraser.stlouisfed.org/ Federal Reserve Bank of St. Louis
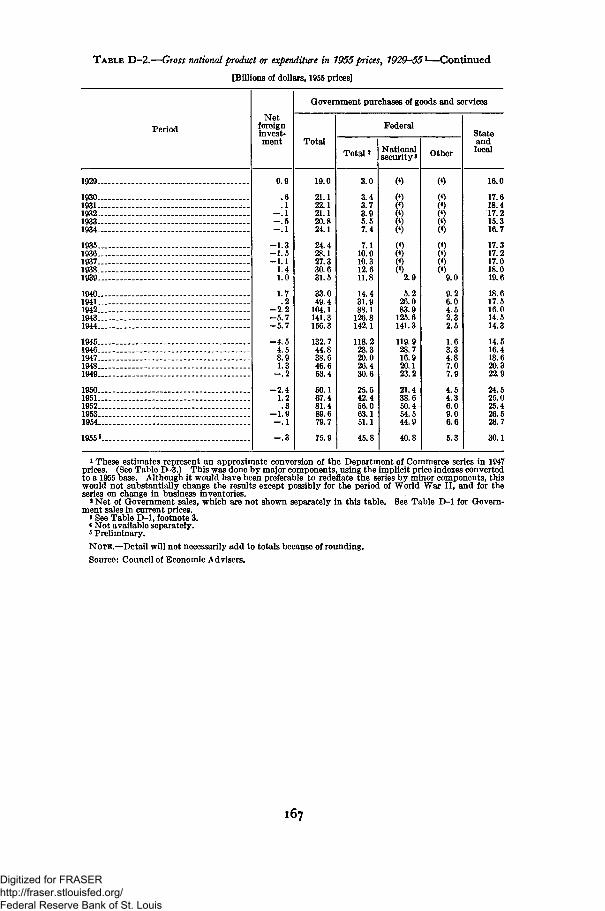
TABLE D-2.—Gross national product or expenditure in 1955 prices> 1929-55l—Continued
[Billions of dollars, 1955 prices]
Period
1929
19301931 _193219331934
1935 _19361937 _19381939
19401941 _ _ _194219431944 _ _ _
19451946194719481949 .
19501951195219531954
19555
Netforeigninvest-ment
0.9
.6
.1- . 1- . 5- . 1
—1.3- 1 . 5—1.1
1.41.0
1.7.2
- 2 . 2—5.7- 5 . 7
—4.54.58.91.3
- . 2
- 2 . 41.2.3
—1.9- . 1
- . 3
Government purchases of goods and services
Total
19.0
21.122.121.120.824.1
24.428.127.330.631.5
33.049.4
104.1141.3156.3
132.744.838.646.653.4
50.167.481.489.679.7
75.9
Federal
To ta l '
3.0
3.43.73.95.57.4
7.110.910.312.611.8
14.431.988.1
126.8142.1
118.228.320.026.430.6
25.642.456.063.151.1
45.8
Nationalsecurity8
(«)
(4)(4)(4)(«)(4)
80)(4)
2.95.2
26.083.9
125.6141.3
119.928.716.920.123.2
21.438.650.454.544.9
40.8
Other
<«)
(4)(*)(4)(4)(4)
(4)
*(4)(4)
9.0
9.26.04.52 32.5
1.63.34.87.07.9
4.54.36.09.06.6
5.3
Stateandlocal
16.0
17.618.417.215.316.7
17.317.217.018.019.6
18.617.516.014.514.3
14.516.418.620.322.9
24.525.025.426.528.7
30.1
* These estimates represent an approximate conversion of the Department of Commerce series in 1947prices. (See Table D-3.) This was done by major components, using the implicit price indexes convertedto a 1955 base. Although it would have been preferable to redeflate the series by minor components, thiswould not substantially change the results except possibly for the period of World War II, and for theseries on change in business inventories.
*Net of Government sales, which are not shown separately in this table. See Table D-l for Govern-ment sales in current prices.
3 See Table D-l, footnote 3.* Not available separately.* Preliminary.
NOTE.—Detail will not necessarily add to totals because of rounding.
Source: Council of Economic Advisers.
167
Digitized for FRASER http://fraser.stlouisfed.org/ Federal Reserve Bank of St. Louis
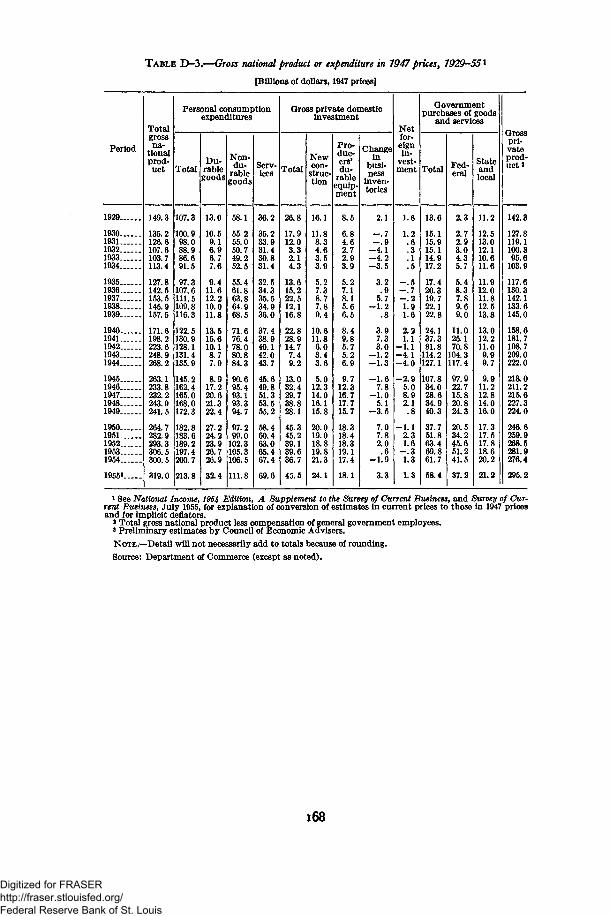
TABLE D-3.—Gross national product or expenditure in 1947 prices, 1929-55l
[Billions of dollars, 1947 prices]
Period
1929
19301931193219331934
19351936193719381939
19401941194219431944
19451946194719481949
19501951195219531954
19553
Totalgrossna-
tionalprod-uct
149.3
135.2126.6107.6103.7113.4
127.8142.5153.5145.9157.5
171.6198.2223.6248.9268.2
263.1233.8232.2243.9241.5
264.7282.9293.3306.5300.5
319.0
Personal consumptionexpenditures
Total
107.3
100.998.088.986.691.5
97.3107.6111.5109.8116.3
122.5130.9128.1131.4135.9
145.2162.4165.0168.0172.3
182.8183.6189.2197.4200.7
213.8
Du-rablegoods
13.0
10.59.16.96.77.6
9.411.612.210.011.8
13.515.610.18.77.9
8.917.220.621.322.4
27.224.223.926.726.9
32.4
Non-du-
rablegoods
58.1
55.255.050.749.252.5
55.461.863.864.968.5
71.676.478.080.884.3
90.695.493.193.394.7
97.299.0
102.3105.3106.5
111.8
Serv-ices
36.2
35.233.931.430.831.4
32.534.335.534.936.0
37.438.940.142.043.7
45.649.851.353.555.2
58.460.463.065.467.4
69.6
Gross private domesticinvestment
Total
26.8
17.912.03.32.14.3
13.615.222.512.116.8
22.828.914.77.49.2
13.032.429.738.828.1
45.345.239.139.636.7
45.5
Newcon-
struc-tion
16.1
11.88.34.63.53.9
5.27.38.77.89.4
10.611.86.03.43.6
5.012.314.016.115.8
20.019.018.819.821.3
24.1
Pro-duc-ers'du-
rableequip-ment
8.5
6.84.62.72.93.9
5.27.18.15.66.5
8.49.85.75.26.9
9.712.316.717.715.7
18.318.418.319.117.4
18.1
Changein
busi-ness
inven-tories
2.1
- . 7- . 9
- 4 . 1- 4 . 2- 3 . 5
3.2.9
5.7- 1 . 2
.8
3.97.33.0
- 1 . 2- 1 . 3
- 1 . 67.8
-1 .05.1
- 3 . 5
7.07.82.0.6
- 1 . 9
3.3
Netfor-eignin-
vest-ment
1.6
1.2.6.3.1.5
- . 5- . 7- . 21.91.6
2.21.1
- 1 . 1- 4 . 1-4 .0
- 2 . 95.08.92.1.8
- 1 . 12.31.6
- . 31.3
1.3
Governmentpurchases of goods
and services
Total
13.6
15.115.915.114.917.2
17.420.319.722.122.8
24.137.381.8
114.2127.1
107.834.028.634.940.3
37.751.863.469.861.7
58.4
Fed-eral
2.3
2.72.93.04.35.7
5.48.37.89.69.0
11.025.170.8
104.3117.4
97.922.715.820.824.3
20.534.245.651.241.5
37.2
Stateandlocal
11.2
12.513.012.110.611.6
11.912.011.812.513.8
13.012.211.09.99.7
9.911.212.814.016.0
17.317.517.818.620.2
21.2
Grosspri-vateprod-uct a
142.3
127.8119.1100.395.6
103.9
117.6130.3142.1133.6145.0
158.6181.7198.7209.0222.0
218.0211.2215.6227.3224.0
246.6259.9268.5281.9276.4
295.2
i See National Income, 1954. Edition, A Supplement to the Survey of Current Business, and Survey of Cur-rent Business, July 1955, for explanation of conversion of estimates in current prices to those in 1947 pricesand for implicit deflators.
a Total gross national product less compensation of general government employees.* Preliminary estimates by Council of Economic Advisers.
NOTE .—Detail will not necessarily add to totals because of rounding.
Source: Department of Commerce (except as noted).
168
Digitized for FRASER http://fraser.stlouisfed.org/ Federal Reserve Bank of St. Louis
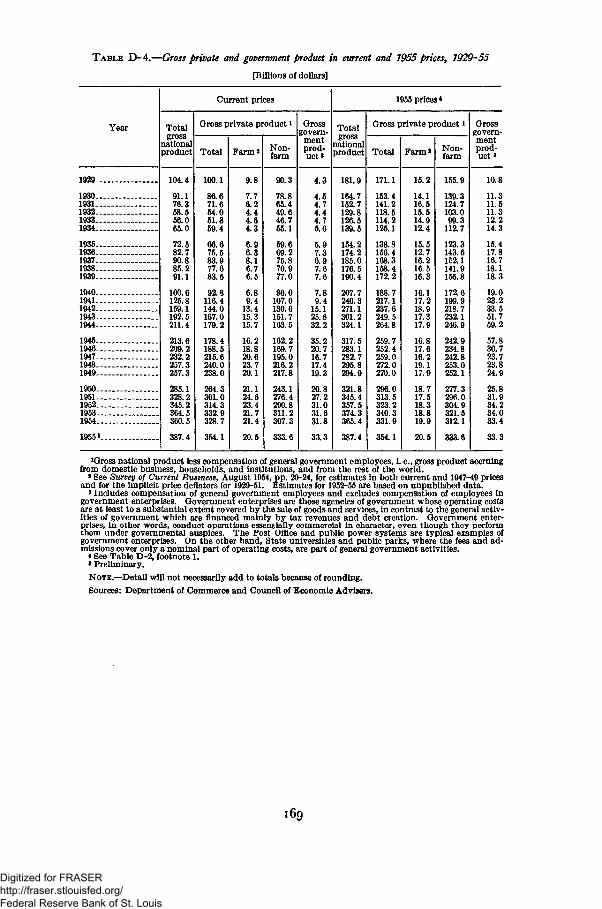
TABLE D-4.—Gross private and government product in current and 1955 prices, 1929-55
[Billions of dollars]
Year
Current prices
Totalgross
nationalproduct
Gross private product 1
Total Farm a Non-farm
Grossgovern-
mentprod-u c t '
1955 prices*
Total
nationalproduct
Gross private product J
Total Farm* Non-farm
Grossgovern-mentprod-u c t '
1930-1931-1932-1933-1934-
1935-1936-1937-1938-1939-
1940-1941-1942..1943-1944..
1945-1946-1947-1948-1949-
1950-1951-1952..1953-.1954..
1955 V
104.4
91.176.358.556.065.0
72.582.790.885.291.1
100.6125.8159.1192.5211.4
213.6209.2232.2257.3257.3
285.1328.2345.2364.5360.5
387.4
100.1
71.654.051.359.4
66.675.583.977.683.5
92.8116.4144.0167.0179.2
178.4188.5215.6240.0238.0
264.3301.0314.3332.9328.7
354.1
9.8
7.76.24.44.64.3
6.96.38.16.76.5
6.89.4
13.415.315.7
16.218.820.623.720.1
21.124.623.421.721.4
20.5
90.3
78.865.449.646.755.1
59.669.275.870.977.0
86.0107.0130.6151.7163.5
162.2169.7195.0216.2217.8
243.1276.4290.8311.2307.3
333.6
4.3
4.54.74.44.75.6
5.97.36.97.67.6
7.89.4
15.125.632.2
35.220.716.717.419.3
20.827.231.031.631.8
33.3
181.9
164.7152.7129.8126.5139.5
154.2174.2185.0176.5190.4
207.7240.3271.1301.2324.1
317.5283.1282.7295.8
321.8345.4357.5374.3365.4
387.4
171.1
153.4141.2118.5114.2125.1
138.8156.4168.3158.4172.2
188.7217.1237.6249.5264.8
259.7252.4259.0272.0270.0
296.0313.5323.2340.3331.9
354.1
15.2
14.116.515.514.912.4
15.512.716.216.516.3
16.117.218.917.317.9
16.817.616.219.117.9
18.717.518.318.819.9
20.5
155.9
139.3124.7103.099.3
112.7
123.3143.6152.1141.9155.8
172.6199.9218.7232.1246.9
242.9234.8242.8253.0252.1
277.3296.0304.9321.5312.1
333.6
10.8
11.311.511.312.214.3
15.417.816.718.118.3
19.023.233.551.759.2
57.830.723.723.824.9
25.831.934.234.033.4
33.3
JGross national product less compensation of general government employees, i. e., gross product accruingfrom domestic business, households, and institutions, and from the rest of the world.
2 See Survey of Current Business, August 1954, pp. 20-24, for estimates in both current and 1947-49 pricesand for the implicit price deflators for 1929-51. Estimates for 1952-55 are based on unpublished data.
s Includes compensation of general government employees and excludes compensation of employees ingovernment enterprises. Government enterprises are those agencies of government whose operating costsare at least to a substantial extent covered by the sale of goods and services, in contrast to the general activ-ities of government which are financed mainly by tax revenues and debt creation. Government enter-prises, in other words, conduct operations essentially commercial in character, even though they performthem under governmental auspices. The Post Office and public power systems are typical examples ofgovernment enterprises. On the other hand, State universities and public parks, where the fees and ad-missions cover only a nominal part of operating costs, are part of general government activities.
* See Table D-2, footnote 1.5 Preliminary.
NOTE.—Detail will not necessarily add to totals because of rounding.
Sources: Department of Commerce and Council of Economic Advisers.
169
Digitized for FRASER http://fraser.stlouisfed.org/ Federal Reserve Bank of St. Louis
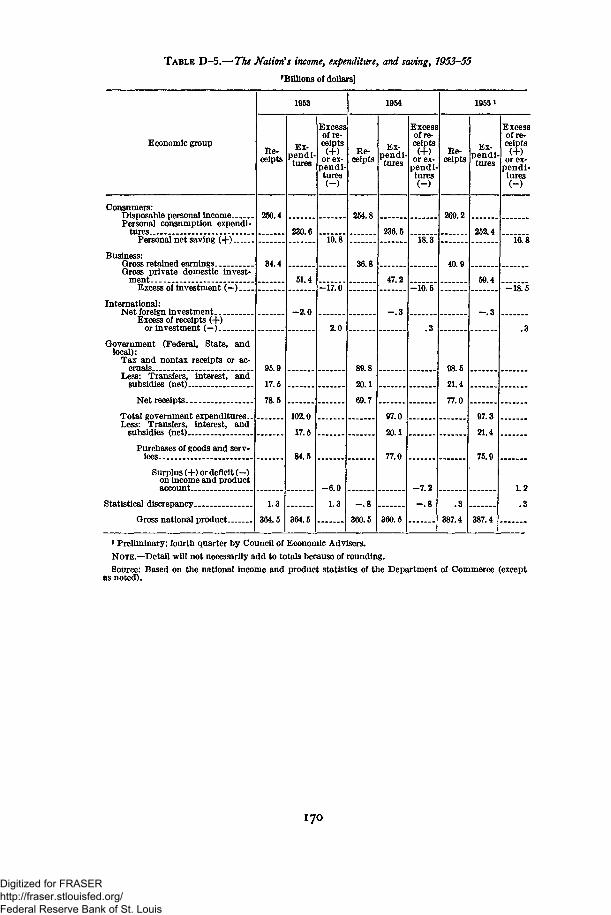
TABLE D-5.—The Nation's income, expenditure, and saving, 1953-55
iBillions of dollars]
Economic group
Consumers:Disposable personal incomePersonal consumption expendi-
turesPersonal net saving (-}-)
Business:Gross retained earnings _ _Gross private domestic invest-
ment-Excess of investment (—)- „_
International:Net foreign investment
Excess of receipts (40or investment (—)
Government (Federal, State, andlocal):
Tax and nontax receipts or ac-cruals
Less: Transfers, interest, andsubsidies (net)
Net receipts _
Total government expendituresLess: Transfers, interest, and
subsidies (net)
Purchases of goods and serv-ices.- -
Surplus (-f) or deficit ( - )on income and productaccount
Statistical discrepancy _
Gross national product
1953
Re-ceipts
250.4
34.4
95.9
17.5
78.5
1.3
364.5
Ex-pendi-tures
230.6
51.4
- 2 . 0
102.0
17.5
84.5
364.5
Excessof re-ceipts
or ex-pendi-tures
19.8
-17.0
2.0
—6.0
1.3
1954
Re-ceipts
254.8
36.8
89.8
20.1
69.7
— 8
360.5
Ex-pendi-tures
236.5
47.2
- . 3
97.0
20.1
77.0
360.5
Excessof re-ceipts
or ex-pendi-tures
18.3
-10.5
.3
- 7 . 2
—.8
19551
Re-ceipts
269.2
40.9
98.5
21.4
77.0
.3
387.4
Ex-pend!tures
252.4
59.4
—.3
97.3
21 4
75.9
387.4
Excessof re-ceipts
or ex-pendi-tures
16.8
-18.5
.3
1.2
.3
1 Preliminary; fourth quarter by Council of Economic Advisers.
NOTE.—Detail will not necessarily add to totals because of rounding.
Source: Based on the national income and product statistics of the Department of Commerce (exceptas noted).
170
Digitized for FRASER http://fraser.stlouisfed.org/ Federal Reserve Bank of St. Louis
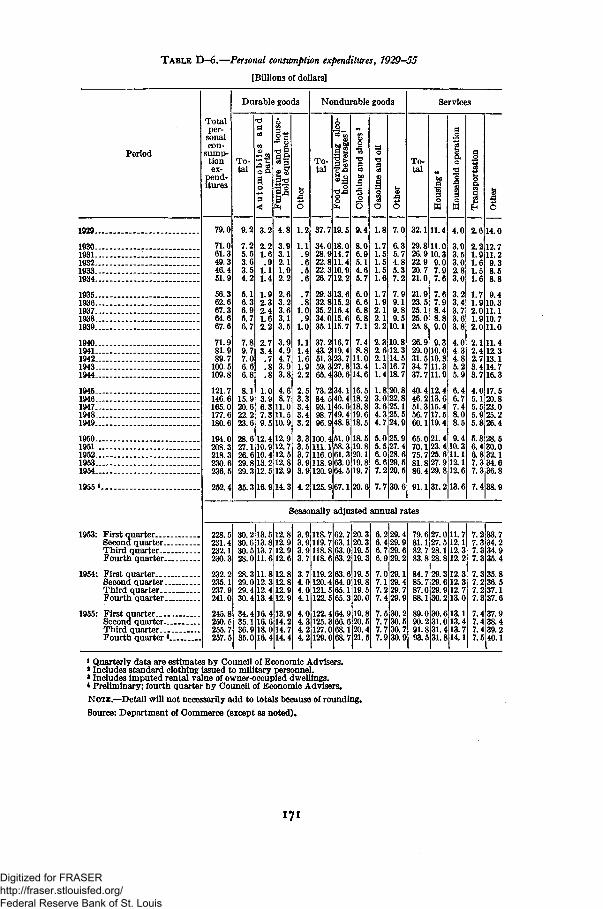
TABLE D-6.—Personal consumption expenditures, 1929-55
[Billions of dollars]
Period
1929-
1930..1931-1932-1933-1934..
1935-1936-1937-1938..1939-
1940-1941-1942-1943-1944-
1945-1946-1947-1948..1949-
1950-1951-1952..1953-1954-
1955«.
1953: First quarterSecond quarter-Third quarter. _.Fourth quarter..
1954: First quarterSecond quarter..Third quarter. _Fourth quarter.
1955: First quarter ___Second quarterThird quarter _Fourth quarter *
Totalper-sonalcon-
sump-tionex-
pend-itures
79.0
71.061.349.346.451.9
56.362.667.364.667.6
71.981.989.7
100.5109.8
121.7146.6165.0177.6180.6
194.0208.3218.3230.6236.5
252.4
Durable goods
To-tal
9.2
7.25.53.63.54.2
5.16.36.95.76.7
7.89.77.6.66.8
8.115.920.622.223.6
28. 6 12.4 12. 927.1 10.9 12. 726. 6 10.4 12. 529.8 13.2 12.829.3 12. 5 12.9
35.3 16.9 14.3
6.3 11.07.3 11.59.5 10.9
.5
.7
.81.0.9
1.0
1.11.41.61.92.2
2.53.33.43.43.2
Nondurable goods
To-tal
5 i l l .
37.719.5
34.018.028.914.722.8 11.422.310.926.712.2
29.3 13.632.815.235.216.434.015.635.115.7
7.48.8
11.059.3 27.8 13.465.4 30.6 14.6
37.216.743.51.
219.3 23.
2 34.73.84.93.1 45.6 18.8
:. 140.4
7 49.496.948.8 18.5
3.3 100.4 51.0 18.51 58.3 19.8
116.0 61.3 20.1118.9 63.
3.9 120.9 64.5 19.7
4.2 125.9 67.1 20.6
16.518.2
19.6
2.1
1.4
2.2 10.1
2.310.82.6 12.3
14.51.3 16.7
18.7
1.8 20.83.0 22.83.6 25.14.3 25.54.7 24.9
5.0 25.95. 5 27. 46.0 28. 66.6 29.57. 2 29. 5
7.7 30.6
Services
To-tal
32.1 11.4
29.8 11.026.9 10.3
9.07.97.6
22.920.721.0
21.923.525.125.025.8
26.929.0 10.031.5 10.834.7 11.337.7 11.9
40.4 12.446.2 13.651.3 15.456.7 17.560.U9.4
65.0 21.470.1 23.4 10.375.81.
7 25.8 27.
86.4 29.8 12.6
91.1 31.2 13.6
4.0
6 11.1912.1
2.6 14.0
2.2 12.71.9 11.21.61.51.6
1.7
9.38.58.8
9.41.9 10.32.0 11.11.9 10.72.0 11.0
2.1 11.42.4 12.32.7 13.13.4 14.73.7 16.3
4.0 17.55.1 20.85.5 23.05.9 25.25.8 26.4
5.8 28.56.4 30.06.8 32.17.3 34.67.3 36.8
7.438.9
Seasonally adjusted annual rates
228.5231.4232.1
232.2235.1237.9241.0
245.8250.5255.7257.5
35.1
30.2 13. 5 12. 830.6 13. 8 12. 930. 5 13. 7 12. 928.0 11.6 12.6
28.3 11.8 12.829.0 12.3 12.829.4 12.4 12.930.4 13.4 12. 9
34.4 16.4 13.9
36.9 18. 0 14. 735.0 16.414.4
16.6 14.2
3.9 118.7 62.7 20.33.9 119.7 63.1 20.33. 9 118.8 63.0 19. 53.7 118.6 63.2 19.3
3.7 119.2 63.6 19.54 64.0 19.85 65.1 19.5
4.0120.4 64.0 19.80121.
122.5 65. 3 20.0
4.0 122.4 64.9 19.84.3 125. 3 66.6 20.54.2 127.0 68.1 20.44.2129.0 68.7 21.5
6.2 29. 46.4 29.96.7 29.66.9 29. 2
0 29.1.129.4
1.71.9
2 29.7.4 29.
7.5 30.27.7 30.57.7 30.77.9 30.9
79.6 27.0 11.781.1 27.5 12.182. 7 28.1 12. 383.8 28.8 12. 2
84.7 29.3 12.385.7 29. 6 12. 387.0 29.9 12.788.1 30.2 13.0
89.0 30.613.190.2 31.0 13.491.8 31.4 13.793.5 31.8 14.1
7.2 33.77.3 34.27.3 34.97.3 35.4
7.3 35.87.2 36.57.2 37.17.3 37.6
7.4 37.97.4 38.47.4 39.27.5 40.1
1 Quarterly data are estimates by Council of Economic Advisers.> Includes standard clothing issued to military personnel.«Includes imputed rental value of owner-occupied dwellings.4 Preliminary; fourth quarter by Council of Economic Advisers.NOTE.—Detail will not necessarily add to totals because of rounding.Source: Department of Commerce (except as noted).
171
Digitized for FRASER http://fraser.stlouisfed.org/ Federal Reserve Bank of St. Louis
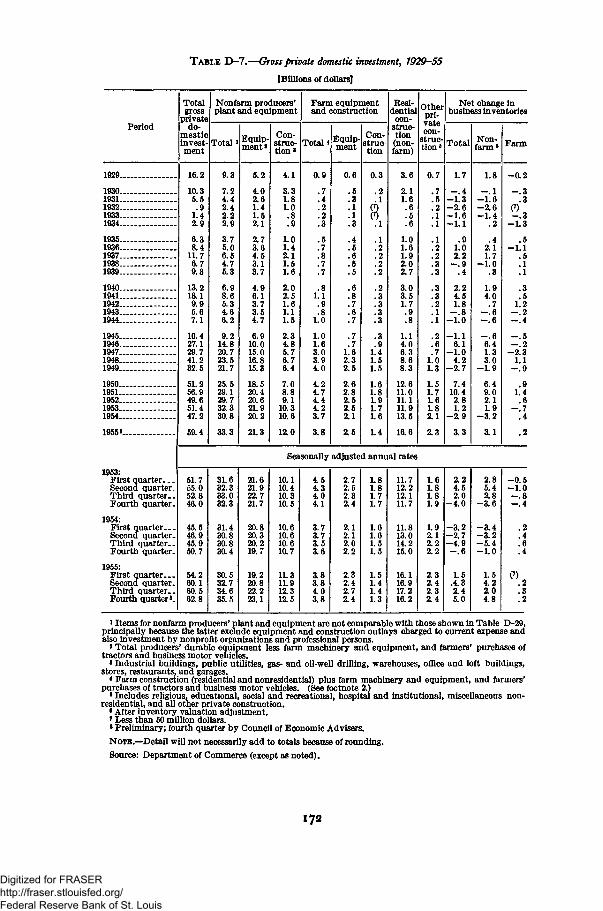
TABLE D-7.—Gross private domestic investment, 1929-55
[Billions of dollars]
Period
Totalgross
privatedo-
mesticinvest'ment
Nonfarm producers'plant and equipment
Total Equip-ment1
Con-struc-t ion '
Total*
Farm equipmentand construction
Equip-ment
Con-struetion
Residential
con-struc-tion(non-farm)
Otherpri-vatecon-
struc-tion*
Net change inbusiness inventories
Total Non-farm6 Farm
1929._..
1931—1932...1933...1934...
1935...1936...1937—1938...1939...
1940—1941...1942—1943—1944...
1945...1946—1947...1948—1949...
1950...1951...1952...1953—1954...
19558..
16.2
10.35.5.9
1.42.9
6.38.4
11.76.79.3
13.218.19.95.67.1
10.427.129.741.232.5
51.256.949.651.447.2
59.4
9.3
7.24.42.42.22.9
3.75.06.54.75.3
6.98.65.34.66.2
9.214.820.723.521.7
25.529.129.732.330.8
33.3
5.2
4.02.61.41.52.1
2.73.64.53.13.7
4.96.13.73.54.7
6.910.015.016.815.3
18.520.420.621.920.2
21.3
4.1
3.31.81.0.8.9
1.01.42.11.51.6
2.02.51.61.11.5
2.34.85.76.76.4
7.08.89.1
10.310.6
12.0
0.9
.7
.4
.2
.2
.3
.5
.7
.8
.7
.7
.81.1.9.8
1.0
1.01.63.03.94.0
4.24.74.44.23.7
3.8
0.6
.5
.3
.1
.1
.3
.4
.5
.6
.5
.5
.8
.7
.6
.7
.7
.71.62.32.5
2.62.82.52.52.1
2.5
0.3
.2
i
.4
.5
.5
.6
.81.91.71.6
1.4
3.6
2.11.6.6.5.6
1.01.61.92.02.7
3.03.51.7.9.8
1.14.06.38.68.3
12.611.011.111.913.5
16.6
0.7
.7
.5
.2
.1
.1
.1
.2
.2
.3
.3
.3
.3
.2
.1
.1
.2
.6
.71.01.3
1.51.71.61.82.1
2.3
1.7
- . 4- 1 . 3- 2 . 6- 1 . 6- 1 . 1
1.02.2
- . 9.4
2.24.51.8
- . 8- 1 . 0
- 1 . 1i. 1
- 1 . 04.2
- 2 . 7
7.410.42.81.2
- 2 . 9
3.3
1.8
- . 1- 1 . 6- 2 . 6- 1 . 4
.2
.42.11.7
- 1 . 0
1.94.0.7
- . 6- . 6
- . 66.41.33.0
- 1 . 9
6.49.02.11.9
- 3 . 2
3.1
Seasonally adjusted annual rates
1953:First quarter. _.Second quarter.Third quarter..Fourth quarter.
1954:First quarter. . .Second quarter.Third quarter..Fourth quarter.
1955:First quarter. . .Second quarter-Third quarter..Fourth quarters.
51.755.052.846.0
45.546.945.950.7
54.260.160.562.8
-0.2
- . 3.3
- 1 . 3
.5- 1 . 1
.5
.1
.1
.3
.51.2
- . 2- . 4
- . 5- . 2
- 2 . 31.1
- . 9
.91.4.6
- . 7.4
.2
31.632.333.032.3
31.430.830.830.4
30.532.734.635.5
21.621.922.721.7
20.820.320.219.7
19.220.822.223.1
10.110.410.310.5
10.610.610.610.7
11.311.912.312.5
4.54.34.04.1
3.73.73.53.6
3.83.84.03.8
2.72.52.32.4
2.12.12.02.2
2.32.42.72.4
1.8
:
]]
L.8L.71.7
L.6L.6L.5L.5
L.5L.4L.4L.3
11.712.212.111.7
11.813.014.215.0
16.116.917.216.2
1.61.81.81.9
1.92.12.22.2
2.32.42.32.4
2.24.52.0
- 4 . 0
- 3 . 2- 2 . 7- 4 . 9- . 6
1.5.4.32.45.0
2.85.42.8
- 3 . 6
- 3 . 4- 3 . 2- 5 . 4- 1 . 0
1.54.22.04.8
- 0 . 5- 1 . 0- . 8—.4
.2
.4
.4
.3
.2
i Items for nonfarm producers' plant and equipment are not comparable with those shown in Table D-29,principally because the latter exclude equipment and construction outlays charged to current expense andalso investment by nonprofit organizations and professional persons.
a Total producers' durable equipment less farm machinery and equipment, and farmers' purchases oftractors and business motor vehicles.
3 Industrial buildings, public utilities, gas- and oil-well drilling, warehouses, office and loft buildings,stores, restaurants, and garages.
< Farm construction (residential and nonresidential) plus farm machinery and equipment, and farmers'purchases of tractors and business motor vehicles. (See footnote 2.)
8 Includes religious, educational, social and recreational, hospital and institutional, miscellaneous non-residential, and all other private construction.
• After inventory valuation adjustment.1 Less than 50 million dollars.8 Preliminary; fourth quarter by Council of Economic Advisers.
NOTE.—Detail will not necessarily add to totals because of rounding.
Source: Department of Commerce (except as noted).
17a
Digitized for FRASER http://fraser.stlouisfed.org/ Federal Reserve Bank of St. Louis
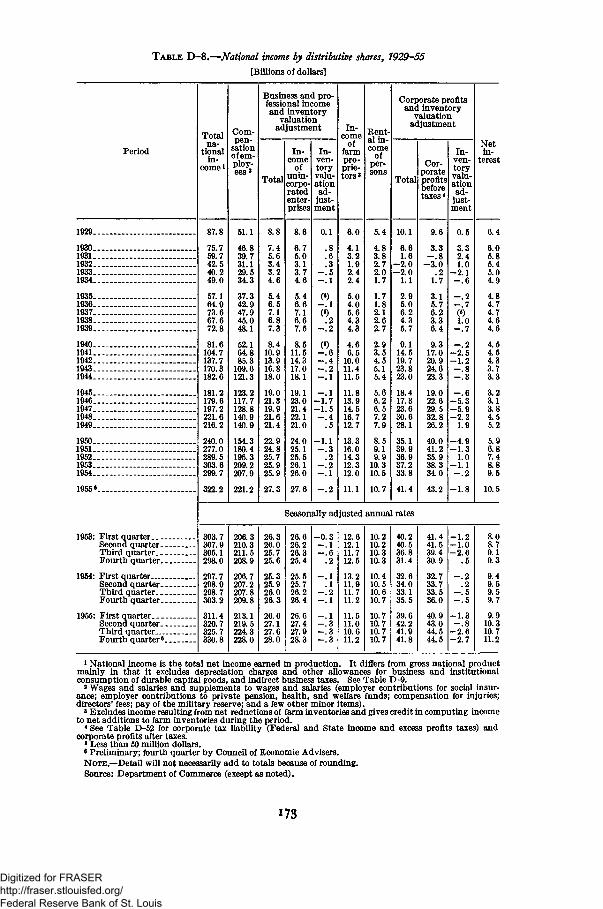
TABLE D-8.—National income by distributive shares, 1929-55
[Billions of dollars]
Period
Totalna-
tionalin-
come1
Com-pen-
sationofem-ploy-
Business and pro-fessional incomeand inventory
valuationadjustment
Total
8.8
7.45.63.43.24.6
5.46.57.16.87.3
8.410.913.916.818.0
19.021.319.921.621.4
22.924.825.725.925.9
27.3
In-come
ofunin-corpo-ratedenter-prises
8.6
6.75.03.13.74.6
5.46.67.16.67.5
8.511.514.317.018.1
19.123.021.422.121.0
24.025.125.526.126.0
27.6
In-ven-toryvalu-ationad-
just-ment
In-come
offarmpro-prie-tors'
Rent-al in-come
ofper-sons
Corporate profitsand inventory
valuationadjustment
Total
Cor-porateprofitsbeforetaxes <
In-ven-toryvalu-ationad-
just-ment
Netin-
terest
1929..
1930..1931..1932.1933.1934..
1935.1936..1937..1938..1939.
1940..1941..1942..1943..1944..
1945..1946..1947..1948..1949..
1950..1951..1952..1953..1954..
1955 «.
1953: First quarterSecond quarter.Third quarter. _Fourth quarter.
1954: First quarter.._.Second quarter _Third quarter. _Fourth quarter.
1955: First quarter. _ _Second quarter.Third quarter—Fourth quarter6
87.8
75.759.742.540.249.0
57.164.973.667.672.8
81.6104.7137.7170.3182.6
181.2179.6197.2221.6216.2
240.0277.0289.5303.6299.7
322.2
51.1
46.839.731.129.534.3
37.342.947.945.048.1
52.164.885.3
109.6121.3
123.2117.7128.8140.9140.9
154.3180.4195.3209.2207.9
221.2
0.1
.8
.6
.3- . 5- . 1
- . 2
( )- . 6- . 4- . 2- . 1
- . 1-1 .7-1 .5- . 4
.5
-1 .1- . 3
.2- . 2- . 1
- . 2
6.0
4.13.21.92.42.4
5.04.05.64.34.3
4.66.5
10.011.411.5
11.813.914.516.712.7
13.316.014.312.312.0
11.1
5.4
4.83.82.72.01.7
1.71.82.12.62.7
2.93.54.55.15.4
5.66.26.57.27.9
8.59.19.9
10.310.5
10.7
10.1
6.61.6
- 2 . 0-2 .0
1.1
2.95.06.24.35.7
9.114.519.723.823.0
18.417.323.630.628.1
35.139.936.937.233.8
41.4
3.3
.21.7
3.15.76.23.36.4
17.020.924.623.3
19.022.629.532.826.2
40.041.235.938.334.0
43.2
0.5
3.32.41.0
-2 .1
- . 2- . 7(»)1.0
- . 7
- . 2-2 .5- 1 . 2- . 8- . 3
-5 .3-5 .9- 2 . 2
1.9
-4 .9- 1 . 3
1.0-1 .1- . 2
-1.8
Seasonally adjusted annual rates
303.7307.9305.1298.0
297.7298.9298.7303.2
311.4320.7325.7330.8
206.3210.3211.5208.9
206.7207.2207.8209.8
213.1219.5224.3228.0
26.326.025.725.6
25.325.926.026.3
26.627.127.628.0
26.626.226.325.4
25.525.726.226.4
26.627.427.928.3
- 0 . 3- . 1- . 6
. 2
—.1. 1
- . 2- . 1
- . 1- . 3- . 3- . 3
12.612.111.712.5
13.211.911.711.2
11.511.010.611.2
10.210.210.310.3
10.410.510.610.7
10.710.710.710.7
40.240.536.831.4
32.634.033.135.5
39.642.241.941.8
41.441.539.430.9
32.733.733.536.0
40.943.044.544.5
-1 .2- 1 . 0- 2 . 6
. 5
- . 2. 2
- . 5- . 5
- 1 . 3- . 8
- 2 . 6-2 .7
6.4
6.05.85.45.04.9
4.84.74.74.64.6
4.54.54.33.73.3
3.23.13.84.55.2
5.96.87.48.89.5
10.5
8.08.79.19.3
9.49.59.59.7
10.310.711.2
1 National income is the total net income earned in production. It differs from gross national productmainly in that it excludes depreciation charges and other allowances for business and institutionalconsumption of durable capital goods, and indirect business taxes. See Table D-9.2 Wages and salaries and supplements to wages and salaries (employer contributions for social insur-ance; employer contributions to private pension, health, and welfare funds; compensation for injuries;directors' fees; pay of the military reserve; and a few other minor items).
3 Excludes income resulting from net reductions of farm inventories and gives credit in computing incometo net additions to farm inventories during the period.4 See Table D-52 for corporate tax liability (Federal and State income and excess profits taxes) andcorporate profits after taxes.4 Less than 50 million dollars.
• Preliminary; fourth quarter by Council of Economic Advisers.NOTE.—Detail will not necessarily add to totals because of rounding.Source: Department of Commerce (except as noted).
173
Digitized for FRASER http://fraser.stlouisfed.org/ Federal Reserve Bank of St. Louis
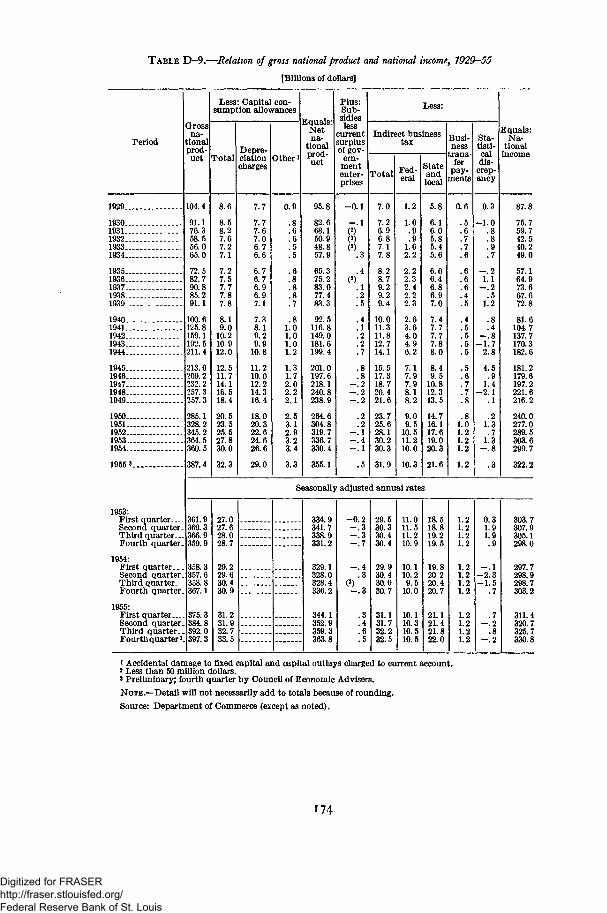
TABLE D-9.—Relation of gross national product and national income, 1929-55
[Billions of dollars]
Period
Grossna-
tionalprod-uct Total
Less: Capital con-sumption allowances
Depre-ciationcharges
Other i
EqualsNetna-
tionalprod-uct
Plus:Sub-sidiesless
currentsurplusof gov-ern-
mententer-prises
Total
Indirect businesstax
Fed-eral
Stateandlocal
Busi-ness
trans-ferpay-
ments
Sta-tisti-caldis-crep-ancy
Equals:Na-
tionalincome
1929..
1930-1931..1932-1933..1934..
1935..1936..1937-1938..1939-
1940-1941..1942..1943-1944-
1945-1946..1947-1948-1949..
1950-1951..1952-1953-1954-
1955«.
104.4
91.176.358.556.065.0
72.582.790.885.291.1
100.6125.8159.1192.5211.4
213.6209.2232.2257.3257.3
285.1328.2345.2
,5360.5
387.4
1953:First quarter—Second quarter.Third q u a r t e r -Fourth quarter.
1954:First quarter...Second quarter.Third quarter-Fourth quarter.
1955:First q u a r t e r -Second quarter.Third quarter.Fourth quarter3.
361.9369.3366.9359.9
358.3357.6358.8367.1
375.3384.8392.0397.3
8.6
8.58.27.67.27.1
7.27.57.77.87.8
8.19.0
10.210.912.0
12.511.714.116.518.4
20.523.525.527.830.0
32.3
7.7
7.77.67.06.76.6
6.76.76.96.97.1
7.38.19.29.9
10.8
11.210.012.214.316.4
18.020.322.624.626.6
29.0
0.9
.7
1.01.01.01.2
1.31.72.02.22.1
2.53.12.93.23.4
3.3
95.8
82.668.150.948.857.9
65.375.283.077.483.3
92.5116.8149.0181.6199.4
201.0197.6218.1240.8238.9
264.6304.8319.7336.7330.4
355.1
- 0 . 1 7.0
7.26.96.87.17.8
8.28.79.29.29.4
10.011.311.812.714.1
15.517.318.720.421.6
23.725.628.130.230.3
31.9
1.2
1.0
1.62.2
2.22.32.42.22.3
2.63.64.04.96.2
7.17.97.98.18.2
9.09.5
10.511.210.0
10.3
5.8
6.16.05.85.45.6
6.06.46.86.97.0
7.47.77.77.88.0
8.49.5
10.812.313.5
14.716.117.619.020.3
21.6
0.6
.5
.6
.7
.7
.6
1.01.21.21.2
1.2
0.3
-1.0
.7
- . 21.1
- . 2.5
1.2
.4- . 8
-1.72.8
4.5.9
1.4-2 .1
.1
.21.3.7
1.3— 8
Seasonally adjusted annual rates
27.027.628.028.7
29.229.630.430.9
31.231.932.733.5
334.9341.7338.9331.2
329.1328.0328.4336.2
344.1352.9359.3363.8
-0 .2- . 3- . 3- . 7
- . 4.3
(2)- . 3
.3
.4
.6
. 5
29.530.330.430.4
29.930.430.030.7
31.131.732.232.5
11.011.511.210.9
10.110.29.5
10.0
10.110.310.510.5
18.518.819.219.5
19.820.220.420.7
21.121.421.822.0
1.21.21.21.2
1.21.21.21.2
1.21.21.21.2
0.31.91.9.9
- . 1- 2 . 3—1.5
.7
.7- . 2
.8- . 2
87.8
75.759.742.540.249.0
57.164.973.667.672.8
81.6104.7137.7170.3182.6
181.2179.6197.2221.6216.2
240.0277.0289.5303.6299.7
322.2
303.7307.9305.1298.0
297.7
298.7303.2
311.4320.7325.7330.8
i Accidental damage to fixed capital and capital outlays charged to current account.a Less than 50 million dollars.
' Preliminary; fourth quarter by Council of Economic Advisers.
NOTE.—Detail will not necessarily add to totals because of rounding.
Source: Department of Commerce (except as noted).
174
Digitized for FRASER http://fraser.stlouisfed.org/ Federal Reserve Bank of St. Louis
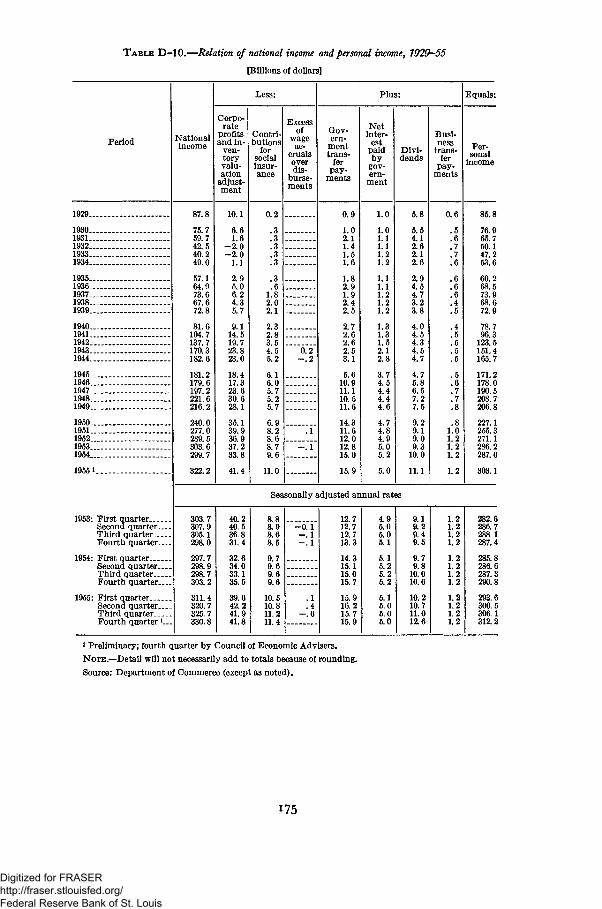
T A B L E D—10.—Relation of national income and personal income, 1929—55
[Billions of dollars]
Period
1929
19301931193219331934
19351936193719381939
19401941194219431944
19451946194719481949
19501951195219531954
19551
1953: First quarterSecond quarterThird quarterFourth quarter
1954: First quarterSecond quarterThird quarterFourth quarter
1955: First quarterSecond quarterThird quarterFourth quarter1—
Nationalincome
87.8
75.759.742.540.249.0
57.164.973.667.672.8
81.6104.7137.7170.3182.6
181.2179.6197.2221.6216.2
240.0277.0289.5303.6299.7
322.2
Less:
Corpo-rate
profitsand in-
ven-toryvalu-ation
adjust-ment
10.1
6.61.6
- 2 . 0- 2 . 0
1.1
2.95.06.24.35.7
9.114.519.723.823.0
18.417.323.630.628.1
35.139.936.937.233.8
41.4
Contri-butions
forsocialinsur-ance
0.2
.3
.3
.3
.3
.3
.3
.61.82.02.1
2.32.83.54.55.2
6.16.05.75.25.7
6.98.28.68.79.6
11.0
Excessof
wageac-
crualsoverdis-
burse-ments
0.2- . 2
.1
- . 1
Plus:
Gov-ern-
menttrans-
ferpay-
ments
0.9
1.02.11.41.51.6
1.82.91.92.42.5
2.72.62.62.53.1
5.610.911.110.511.6
14.311.612.012.815.0
15.9
Netinter-
estpaidby
gov-ern-
ment
1.0
1.01.11.11.21.2
1.11.11.21.21.2
1.31.31.52.12.8
3.74.54.44.44.6
4.74.84.95.05.2
5.0
Divi-dends
5.8
5.54.12.62.12.6
2.94.54.73.23.8
4.04.54.34.54.7
4.75.86.57.27.5
9.29.19.09.3
10.0
11.1
Busi-ness
trans-fer
pay-ments
0.6
.5
.6
.7
.7
.6
.6
.6
.6
.4
.5
.4
.5
.5
.5
.5
.5
.6
.7
.7
.8
.81.01.21.21.2
1.2
Equals:
Per-sonal
income
85.8
76.965.750.147.253.6
60.268.573.968.672.9
78.796.3
123.5151.4165.7
171.2178.0190.5208.7206.8
227.1255.3271.1286.2287.6
303.1
Seasonally adjusted annual rates
303.7307.9305.1298.0
297.7298.9298.7303.2
311.4320.7325.7330.8
40.240.536.831.4
32.634.033.135.5
39.642.241.941.8
8.88.98.68.5
9.79.69.69.6
10.510.811.211.4
- 0 . 1- . 1- . 1
.1
.4- . 6
12.712.712.713.3
14.315.115.015.7
15.916.215.715.9
4.95.05.05.1
5.15.25.25.2
5.15.05.05.0
9.19.29.49.5
9.79.8
10.010.6
10.210.711.012.6
1.21.21.21.2
1.21.21.21.2
1.21.21.21.2
282.6286.7288.1287.4
285.8286.6287.3290.8
293.6300.5306.1312.2
1 Preliminary; fourth quarter by Council of Economic Advisers.
NOTE.—Detail will not necessarily add to totals because of rounding.
Source: Department of Commerce (except as noted).
175
Digitized for FRASER http://fraser.stlouisfed.org/ Federal Reserve Bank of St. Louis
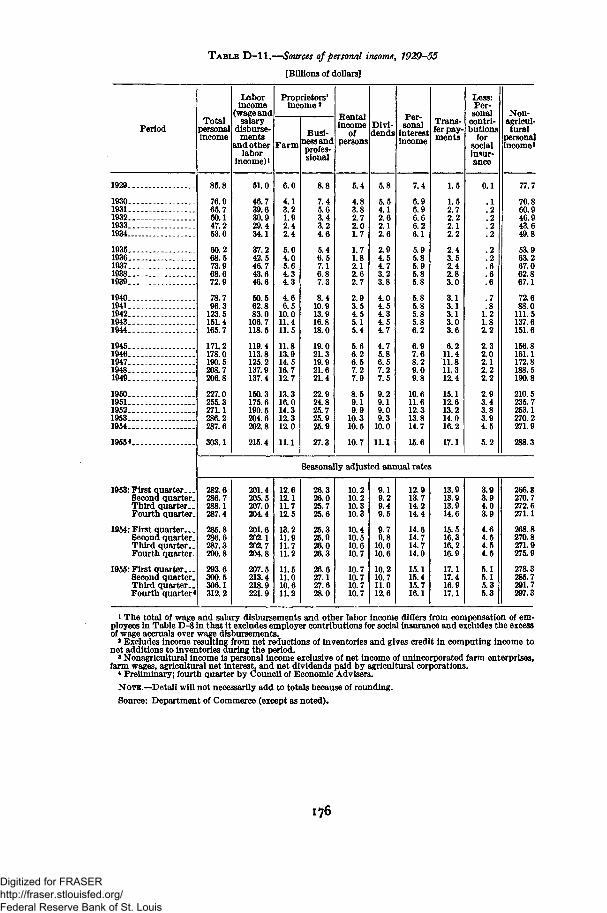
T A B L E D-l l .—Sources of personal incomey 1929-55
[Billions of dollars]
PeriodTotal
personalincome
85.8
76.965.750.147.253.6
60.268.573.968.672.9
78.796.3
123.5151.4165.7
171.2178.0190.5208.7206.8
227.0255.3271.1286.2287.6
303.1
Laborincome
(wage andsalary
disburse-ments
and otherlabor
income) i
51.0
46.739.630.929.434.1
37.242.546.743.646.6
50.562.883.0
106.7118.5
119.4113.8125.2137.9137.4
150.3175.6190.5204.6202.8
215.4
Proprietors'income *
Farm
6.0
4.13.21.92.42.4
5.04.05.64.34.3
4.66.5
10.011.411.5
11.813.914.516.712.7
13.316.014.312.312.0
11.1
Bust-ness andprofes-sional
8.8
7.45.63.43.24.6
5.46.57.16.87.3
8.410.913.916.818.0
19.021.319.921.621.4
22.924.825.725.925.9
27.3
Rentalincome
ofpersons
5.4
4.83.82.72.01.7
1.71.82.12.62.7
2.93.54.55.15.4
5.66.26.57.27.9
8.59.19.9
10.310.5
10.7
Divi-dends
5.8
5.54.12.62.12.6
2.94.54.73.23.8
4.04.54.34.54.7
4.75.86.57.27.5
9.29.19.09.3
10.0
11.1
Per-sonal
interestincome
7.4
6.96.96.66.26.1
5.95.85.95.85.8
5.85.85.85.86.2
6.97.68.29.09.8
10.611.612.313.814.7
15.6
Trans-fer pay-ments
1.5
1.52.72.22.12.2
2.43.52.42.83.0
3.13.13.1&03.6
6.211.411.811.312.4
15.112.613.214.016.2
17.1
Less:Per-sonal
contri-butions
forsocialinsur*ance
0.1
.1
.2
.2
.2
.2
.2
.2
.6
.6
.6
.7
.81.21.82.2
2.32.02.12.22.2
2.93.43.83.94.5
5.2
Non-agricul-tural
personalincome8
1929.
1930.1931.1932.1933.1934..
1935.1936.1937.1938.1939.
1940.1941.1942.1943.1944.
1945.1946.1947.1948.1949.
1950.1951.1952..1953..1954..
1955*.
Seasonally adjusted annual rates
1953: First quarter. -_Second quarter.Third quarter..Fourth quarter.
1954: First quarter.. .Second quarter.Third quarter..Fourth quarter.
1955: First quarter. _.Second quarter.Third quarter..Fourth quarter*
282.6286.7288.1287.4
285.8286.6287.3290.8
293.6300.5306.1312.2
201.4205.5207.0204.4
201.6202.1202.7204.8
207.5213.4218.9221.9
12.612.111.712.5
13.211.911.711.2
11.511.010.611.2
26.326.025.725.6
26.325.926.026.3
26.627.127.628.0
10.210.210.310.3
10.410.510.610.7
10.710.710.710.7
9.19.29.49.5
9.79.8
10.010.6
10.210.711.012.6
12.913.714.214.4
14.614.714.714.9
15.115.415.716.1
13.913.913.914.6
15.516.316.216.9
17.117.416.917.1
3.93.94.03.9
4.64.54.54.5
5.16.15.35.3
77.7
70.860.946.943.649.8
53.963.267.062.867.1
72.688.0
111.5137.6151.6
156.8161.1172.8188.5190.8
210.5235.7253.1270.2271.9
288.3
266.3270.7272.6271.1
268.8270.8271.9275.9
278.3285.7291.7297.3
1 The total of wage and salary disbursements and other labor income differs from compensation of em-ployees in Table D-8 in that it excludes employer contributions for social insurance and excludes the excessof wage accruals over wage disbursements.
2 Excludes income resulting from net reductions of inventories and gives credit in computing income tonet additions to inventories during the period.
»Nonagricultural income is personal income exclusive of net income of unincorporated farm enterprises,farm wages, agricultural net interest, and net dividends paid by agricultural corporations.
* Preliminary; fourth quarter by Council of Economic Advisers.
NOTE.—Detail will not necessarily add to totals because of rounding.
Source: Department of Commerce (except as noted).
176
Digitized for FRASER http://fraser.stlouisfed.org/ Federal Reserve Bank of St. Louis
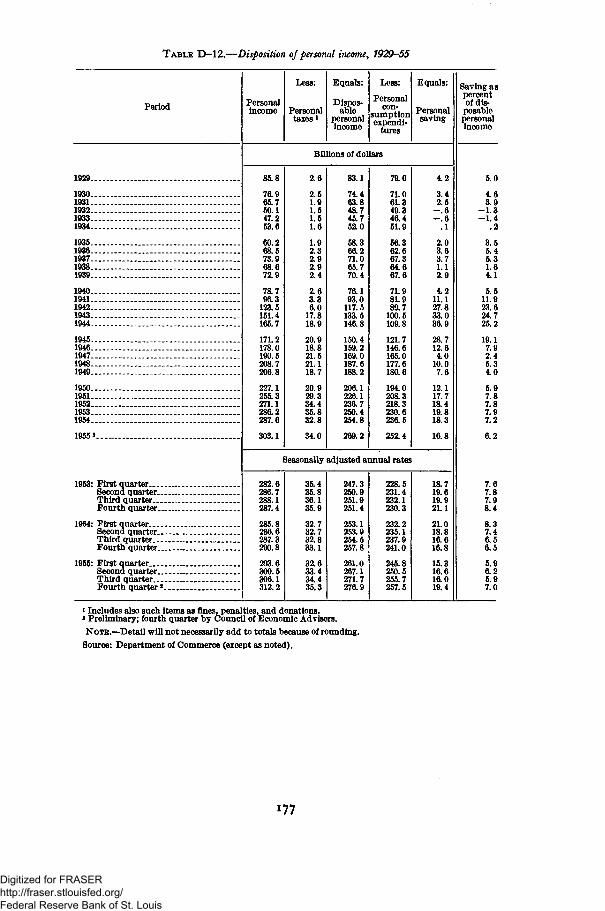
TABLE D-12.—Disposition of personal income, 1929-55
Period Personalincome
Less:
Personaltaxes1
Equals:
Dispos-able
personalincome
Less:
Personalcon-
sumptionexpendi-
tures
Equals:
Personalsaving
Saving aspercentof dis-
posablepersonalincome
Billions of dollars
1929_.
1930..1931-1932..1933-1934-
1935-1936-1937-1938-1939-
1940-1941-1942-1943-1944-
1945-1946-1947-1948-1949..
1950-1951-1952..1953..1954..
1955 2
1953: First quarterSecond quarter-Third q u a r t e r -Fourth quarter. .
1954: First quarterSecond quarter..Third quarter. _.Fourth quarter..
1955: First quarterSecond quarter..Third quarter. _.Fourth quarter2
85.8
76.965.750.147.253.6
60.268.573.968.672.9
78.796.3
123.5151.4165.7
171.2178.0190.5208.7206.8
227.1255.3271.1286.2287.6
303.1
2.6
2.51.91.51.51.6
1.92.32.92.92.4
2.63.36.0
17.818.9
20.918.821.521.118.7
20.929.334.435.832.8
34.0
83.1
74.463.848.745.752.0
58.366.271.065.770.4
76.193.0
117.5133.5146.8
150.4159.2169.0187.6188.2
206.1226.1236.7250.4254.8
269.2
79.0
71.061.349.346.451.9
56.362.667.364.667.6
71.981.989.7
100.5109.8
121.7146.6165.0177.6180.6
194.0208.3218.3230.6236.5
252.4
4.2
3.42.5
- . 6- . 6
.1
2.03.63.71.12.9
4.211.127.833.0
28.712.64.0
10.07.6
12.117.718.419.818.3
16.8
Seasonally adjusted annual rates
282.6286.7288.1287.4
285.8286.6287.3290.8
293.6300.5306.1312.2
35.435.836.135.9
32.732.732.833.1
32.633.434.435.3
247.3250.9251.9251.4
253.1253.9254.5257.8
261.0267.1271.7276.9
228.5231.4232.1230.3
232.2235.1237.9241.0
245.8250.5255.7257.5
18.719.619.921.1
21.018.816.616.8
15.316.616.019.4
5.0
4.63.9
- 1 . 3- 1 . 4
.2
3.55.45.31.64.1
5.511.923.624.725.2
19.17.92.45.34.0
5.97.87.87.97.2
6.2
7.67.87.98.4
8.37.46.56.5
5.96.25.97.0
i Includes also such items as fines, penalties, and donations.* Preliminary; fourth quarter by Council of Economic Advisers.
NOTE.—Detail will not necessarily add to totals because of rounding.
Source: Department of Commerce (except as noted).
177
Digitized for FRASER http://fraser.stlouisfed.org/ Federal Reserve Bank of St. Louis
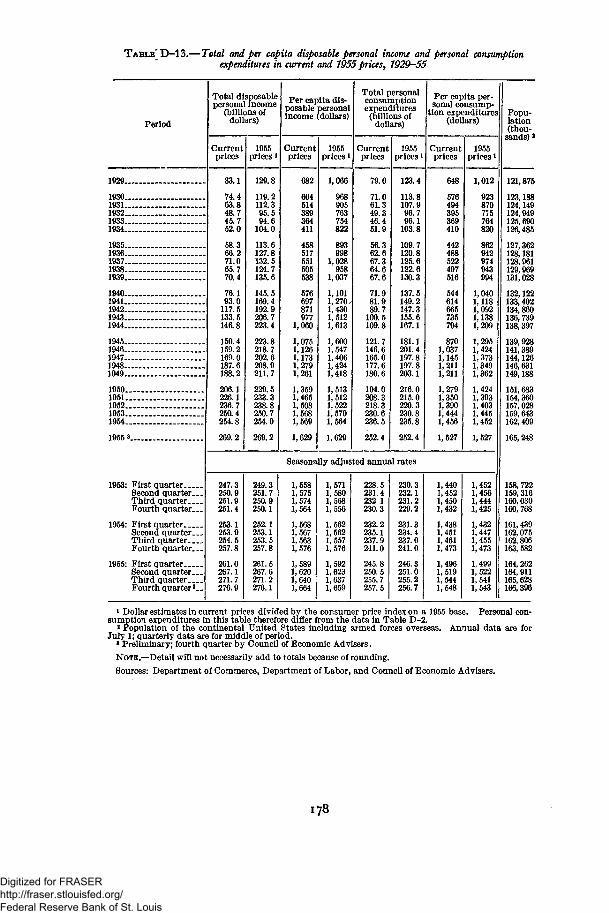
TABLE"D-13.—Total and per capita disposable personal income and personal consumptionexpenditures in current and 1955 prices, 7929—55
Period
Total disposablepersonal income
(billions ofdollars)
Currentprices
1955prices
Per capita dis-posable personalincome (dollars)
Currentprices
1955prices *
Total personalconsumptionexpenditures
(billions ofdollars)
Currentprices
1955prices
Per capita per-sonal consump-
tion expenditures(dollars)
Currentprices
1955prices
Popu-lation(thou-
sands) 3
1929..
1930—1931—1932...1933—1934—
1935—1936...1937—1938...1939...
1940—1941...1942...1943—1944—
1945-.1946—1947—1948—1949—
1950._1951__1952..1953-1954..
1955 3..
1953: First quarterSecond quarter..Third quarter. __Fourth quarter. _
1954: First quarterSecond quarter. _Third quarter. __Fourth quarter..
1955: First quarterSecond quarter..Third quarter . . .Fourth quarter *.
83.1
74.463.848.745.752.0
58.366.271.065.770.4
76.193.0
117.5133.5146.8
150.4159.2169.0187.6188.2
206.1226.1236. 7250.4254.8
269.2
129.8
119.2112.395.594.6
104.0
113.6127.8132.5124.7135.6
145.5169.4192.9206.7223.4
223.8218.7202.6208.9211.7
229.5233.3238.8250.7254.0
269.2
604514
411
458517551505538
576697871977
1,060
1,0751,1261,1731,2791,261
1,3591,4651,5081,5681,569
1,629
1,066
905763754822
893998
1,028958
1,037
1,1011,2701,4301,5121,613
1,6001,5471,4061,4241,418
1,5131,5121,5221,5701,564
1,629
79.0
71.061.349.346.451.9
56.362.667.364.667.6
71.981.989.7
100.5109.8
121.7146.6165.0177.6180.6
194.0208.3218.3230.6236.5
252.4
123.4
113.8107.996.796.1
103.8
109.7120.8125.6122.6130.3
137.5149.2147.3155.6167.1
181.1201.4197.8197.8203.1
216.0215.0220.3230.8235.8
252.4
648
576494395369410
442488522497516
544614665735794
8701,0371,1451,2111,211
1,2791,3501,3901,4441,456
1,527
Seasonally adjusted annual rates
247.3250.9251.9251.4
253.1253.9254.5257.8
261.0267.1271.7276.9
249.3251.7250.9250.1
252.1253.1253.5257.8
261.5267.6271.2276.1
1,5581,5751,5741,564
1,5681,5671,5631,576
1,5891,6201,6401,664
1,5711,5801,5681,556
1,5621,5621,5571,576
1,5921,6231,6371,659
228.5231.4232.1230.3
232.2235.1237.9241.0
245.8250.5255.7257.5
230.3232.1231.2229.2
231.3234.4237.0241.0
246.3251.0255.2256.7
1,4401,4521,4501,432
1,4381,4511,4611,473
1,4961,5191,5441,548
1,012
923870775764820
862942974943994
1,0401,1181,0921,1381,209
1,2951,4241,3731,3491,362
1,4241,3931,4031,4451,452
1,527
1,4521,4561,4441,425
1,4321,4471,4551,473
1,4991, 5221,5411,543
121,875
123,188124,149124,949125, 690126,485
127,362128,181128,961129,969131,028
132,122133,402134,860136, 739138,397
139,928141,389144,126146,631149,188
151,683154,360157,028159, 643162, 409
165,248
158, 722159,316160,030160,768
161,439162,075162,806163, 582
164, 262164, 911165,628166,396
1 Dollar estimates in current prices divided by the consumer price index on a 1955 base. Personal con-sumption expenditures in this table therefore differ from the data in Table D-2.
2 Population of the continental United States including armed forces overseas. Annual data are forJuly 1; quarterly data are for middle of period.
* Preliminary; fourth quarter by Council of Economic Advisers.
NOTE.—Detail will not necessarily add to totals because of rounding.
Sources: Department of Commerce, Department of Labor, and Council of Economic Advisers.
178
Digitized for FRASER http://fraser.stlouisfed.org/ Federal Reserve Bank of St. Louis
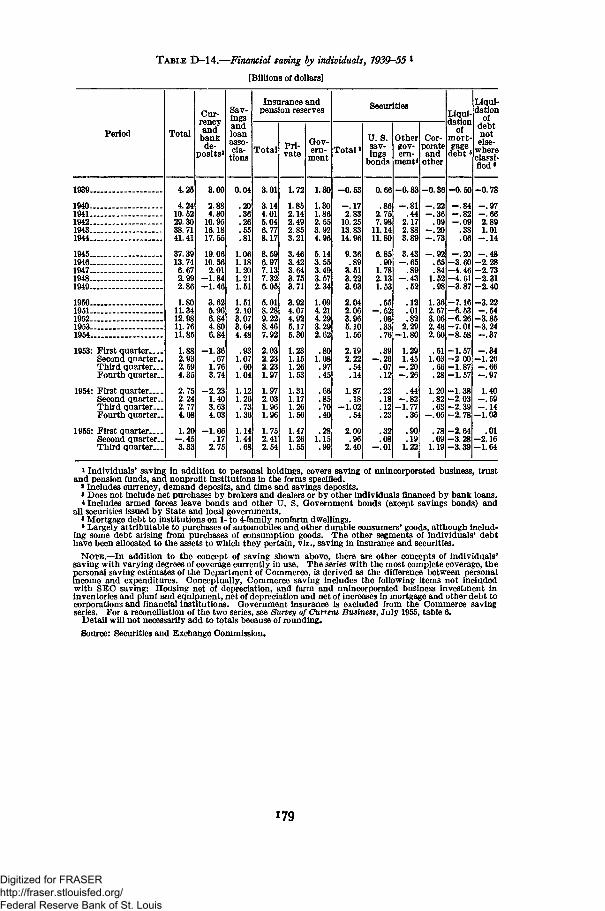
TABLE D-14.—Financial saving by individuals, 1939-55 l
[Billions of dollars]
Period Total
4.25
4.2410.5229.3038.7141.41
37.3913.746.672.992.86
1.8011.3412.9811.7611.85
1.882.932.594.35
2.752.242.774.08
1.20- . 4 53.33
Cur-rencyand
bankde-
posits*
3.00
2.884.80
10.9516.1817.55
19.0610.562.01
-1.84-1.46
3.625.966.844.806.84
-1.36.67
1.763.74
-2.231.403.634.03
-1.06.17
2.75
Sav-ingsandloanasso-cia-
tions
0.04
.20
.36
.26
.55
.81
1.061.181.201.211.51
1.512.103.073.644.48
.931.07.60
1.04
1.121.26.73
1.36
1.141.44.68
Insurance andpension reserves
Total
3.01
3.144.015.046.778.17
8.596.977.137.326.05
5.018.289.228.467.92
2.032.232.231.97
1.972.031.961.96
1.752.412.54
Pri-vate
1.72
1.852.142.492.853.21
3.463.423.643.753.71
3.924.074.925.175.30
1.231.151.261.53
1.311.171.261.56
1.471.261.55
Gov-ern-
ment
1.30
1.301.862.553.924.96
6.143.553.493.572.34
1.094.214.293.292.62
.801.08.97.45
.66
.85
.70
.40
.281.15.99
Securities
Total»
-0.53
- . 1 72.83
10.2513.8314.96
9.36.89
3.513.223.03
2.042.063.965.101.56
2.192.22.54.14
1.87.18
-1.02.54
2.00.96
2.40
U.S .sav-ings
bonds
0.66
.862.757.98
11.1411.80
6.85.90
1.782.131.53
.55- . 52
.08
.33
.76
.39- . 26
.07
.12
.23
.18
.12
.23
.32
.08- . 0 1
Othergov-ern-
ment*
-0.83
- . 8 1.44
2.172.883.89
3.43- . 6 5
.89- . 4 3
.52
.12
.01
.822.29
-1.80
1.291.45
- .20- .26
.44- . 8 2
-1.77.36
.90
.191.22
Cor-porateand
other
-0.36
- . 22- . 3 6
.09- .20- . 7 3
- . 92.65.84
1.52.98
1.362.573.062.482.60
.511.03.66.28
1.20.82.63
- . 0 5
.78
.691.19
Liqui-dation
ofmort-gage
debt*
-0.50
- .84- . 82- .09
.38
.06
- .20-3.60-4.46-4.61-3.87
-7.16-6.53-6.26-7.01
Q COO. 05
-1.57-2.00-1.87-1.57
-1.38-2.03-2.39-2.78
-2.64-3.28-3.39
Liqui-dation
ofdebtnotelse-
whereclassi-fied"
1939
19401941194219431944
1945194619471948—-1949
19501951195219531954
1953: First quarter—.Second quarter-Third quarter-Fourth quarter.
1954: First q u a r t e r -Second quarter-Third quarter-Fourth quarter.
1955: First q u a r t e r -Second quarter-Third quarter-
-0.78
- . 9 7- . 6 62.891.01
- .14
- .20 - . 4 8-2.28-2.73-2.31-2.40
-7.16 -3.22- .54
-6.26 -3.85-7.01 -3.24
- . 3 7
- .34-1.26- . 66- . 9 7
1.40- .59
. - .14-2 .78-1 .03
.01-3.28 -2.16-3.39-1.64
i Individuals' saving in addition to personal holdings, covers saving of unincorporated business, trustand pension funds, and nonprofit institutions in the forms specified.
* Includes currency, demand deposits, and time and savings deposits.> Does not include net purchases by brokers and dealers or by other individuals financed by bank loans.* Includes armed forces leave bonds and other U. S. Government bonds (except savings bonds) and
all securities issued by State and local governments.8 Mortgage debt to institutions on 1- to 4-family nonfarm dwellings.* Largely attributable to purchases of automobiles and other durable consumers' goods, although includ-
ing some debt arising from purchases of consumption goods. The other segments of individuals' debthave been allocated to the assets to which they pertain, viz., saving in insurance and securities.
NOTE.—In addition to the concept of saving shown above, there are other concepts of individuals'saving with varying degrees of coverage currently in use. The series with the most complete coverage, thepersonal saving estimates of the Department of Commerce, is derived as the difference between personalincome and expenditures. Conceptually, Commerce saving includes the following items not includedwith SEC saving: Housing net of depreciation, and farm and unincorporated business investment ininventories and plant and equipment, net of depreciation and net of increases in mortgage and other debt tocorporations and financial institutions. Government insurance is excluded from the Commerce savingseries. For a reconciliation of the two series, see Survey of Current Business, July 1955, table 6.
Detail will not necessarily add to totals because of rounding.
Source: Securities and Exchange Commission.
179
Digitized for FRASER http://fraser.stlouisfed.org/ Federal Reserve Bank of St. Louis
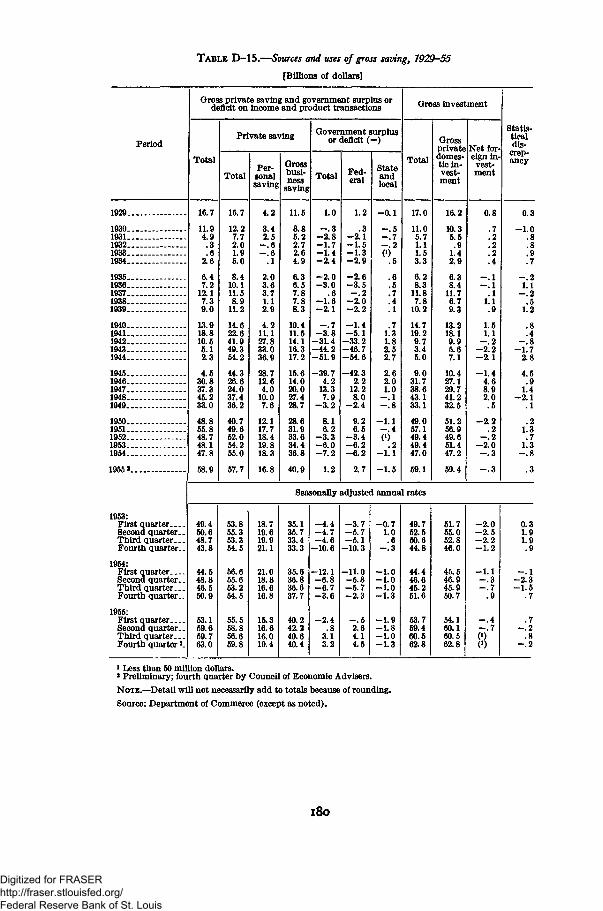
TABLE D-15.—Sources and uses of gross saving, 1929—55
[Billions of dollars]
Period
Gross private saving and government surplus ordeficit on income and product transactions
Total
Private saving
TotalPer-sonalsaving
Grossbusi-ness
saving
Government surplusor deficit (—)
Total Fed- Stateandlocal
Gross investment
Total
Grossprivate Net for-domes-tic in-vest-ment
eign in-vest-ment
Statis-ticaldis-
crep-ancy
1929.
1930.1931.1932.1933.1934.
1935.1936.1937.1938.1939.
1940.1941.1942.1943.1944.
1945.1946.1947.1948..1949.
1950.1951.1952-1953.1954.
1955 ».
1953:First quarterSecond quarter..Third quarter. . .Fourth quarter..
1954:First quarterSecond quarter..Third quarter. . .Fourth quarter. .
1955:First quarterSecond quarter..Third quarter. . .Fourth quarter K
16.7
11.94.9.3.6
2.6
6.47.2
12.17.39.0
13.918.810.55.12.3
4.530.837.345.233.0
48.855.848.748.147.8
58.9
15.7
12.27.72.01.95.0
8.410.111.58.9
11.2
14.622.641.949.354.2
44.326.624.037.436.2
40.749.652.054.255.0
57.7
4.2
3.42.5
.1
2.03.63.71.12.9
4.211.127.833.036.9
28.712.64.0
10.07.6
12.117.718.419.818.3
16.8
11.5
8.85.22.72.64.9
6.36.57.87.88.3
10.411.514.116.317.2
15.614.020.027.428.7
28.631.933.634.436.8
40.9
1.0
- 2 . 8- 1 . 7- 1 . 4- 2 . 4
- 2 . 0- 3 . 0
.6- 1 . 6- 2 . 1
- . 7- 3 . 8-31.4-44.2-51.9
39.74.2
13.37.9
- 3 . 2
8.16.2
- 3 . 3- 6 . 0- 7 . 2
1.2
1.2
.3- 2 . 1- 1 . 5- 1 . 3- 2 . 9
- 2 . 6- 3 . 5- . 2
- 2 . 0- 2 . 2
- 1 . 4- 5 . 1
-33.2-46.7-54.6
-42.32.2
12.28.0
- 2 . 4
9.26.5
- 3 . 4- 6 . 2- 6 . 2
2.7
- 0 . 1
- . 5- . 7- . 2(0
.5
.6
.5
.7
.4
.1
.71.31.82.52.7
2.62.01.0
—.1- . 8
- 1 . 1
- 1 . 5
17.0
11.05.71.11.53.3
6.28.3
11.87.8
10.2
14.719.29.73.45.0
9.031.738.643.133.1
49.057.149.449.447.0
59.1
16.2
10.35.5.9
1.42.9
6.38.4
11.76.79.3
13.218.19.95.67.1
10.427.129.741.232.5
51.256.949.651.447.2
59.4
0.8
.7
.2
.2
.2
.4
- . 1- . 1
.11.1.9
1.51.1
- . 2- 2 . 2- 2 . 1
- 1 . 44.68.92.0.5
- 2 . 2.2
- . 2- 2 . 0- . 3
Seasonally adjusted annual rates
49.450.648.743.8
44.548.846.550.9
53.159.659.763.0
53.855.353.354.5
56.655.653.254.5
55.558.856.659.8
18.719.619.921.1
21.018.816.616.8
15.316.616.019.4
35.135.733.433.3
35.636.836.637.7
40.242.240.640.4
- 4 . 4- 4 . 7- 4 . 6
-10.6
-12 .1- 6 . 8- 6 . 7- 3 . 6
- 2 . 4.8
3.13.2
- 3 . 7- 5 . 7- 5 . 1
-10.3
-11.0- 5 . 8- 5 . 7- 2 . 3
- . 52.64.14.5
- 0 . 71.0.6
- . 3
- 1 . 0- 1 . 0- 1 . 0- 1 . 3
- 1 . 9- 1 . 8- 1 . 0- 1 . 3
49.752.550.644.8
44.446.645.251.6
53.759.460.562.8
51.755.052.846.0
45.546.945.960.7
54.160.160.562.8
- 2 . 0- 2 . 5- 2 . 2- 1 . 2
- 1 . 1- . 3- . 7
.9
- . 4- . 70)0)
0.3
- 1 . 0.8.8.9.7
- . 21.1
- . 2.5
1.2
.8
.4- . 8
- 1 . 72.8
4.5.9
1.4- 2 . 1
.1
.21.3.7
1.3
0.31.91.9.9
- . 1- 2 . 3- 1 . 5
.7
.7- . 2
- . 2
i Less than 50 million dollars.
» Preliminary; fourth quarter by Council of Economic Advisers.
NOTE.—Detail will not necessarily add to totals because of rounding.
Source: Department of Commerce (except as noted).
180
Digitized for FRASER http://fraser.stlouisfed.org/ Federal Reserve Bank of St. Louis
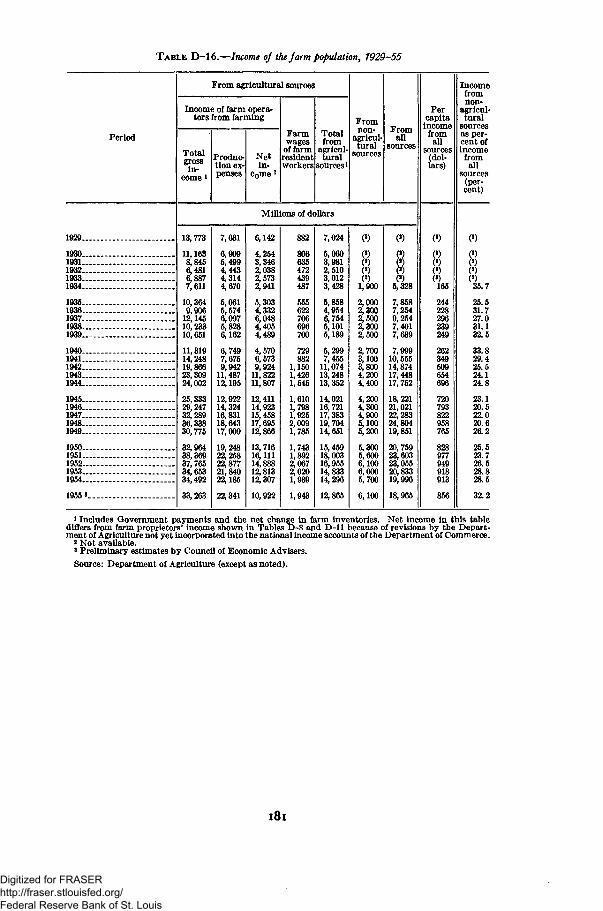
TABLE D-16.—Income of the farm population, 1929-55
Period
From agricultural sources
Income of farm opera-tors from farming
Total
in-come l
Produc-tion ex-
Netin-
Come1
Farm
of farmresident
Totalfrom
agricul-tural
workers sources1
Fromnon-
agricul-tural
sources
Fromall
sources
Percapita
incomefromall
sources(dol-lars)
Incomefromnon-
agricul-tural
sourcesas per-cent ofincome
fromall
sources(per-cent)
Millions of dollars
1929...
1930—1931...1932...1933...1934...
1935...1936—1937—1938—1939...
1940—1941...1942...1943...1944...
1945...1946—1947—1948—1949—
1950—1951...1952...1953...1954...
1955 3..
13,773
11,1638,8456,4816,8877,611
10,3649,90612,14510,23310,651
11,31914,24819,866
24,002
25,33329,24732,289
30,775
32,96438,36937,76534,65334,492
33,263
7,631
6,9095,4994,4434,3144,670
5,0615,6746,097
6,162
6,7497,6759,94211,48712,195
12,92214,32416,83118,64317,909
19,24822,25822,87721,84022,185
22,341
6,142
4,254
2,0382,5732,941
5,3034,3326,0484,405
4,5706,5739,92411,82211,807
12,41114,92315,45817,69512,866
13,71616, 11114,88812,81312,307
10,922
472439487
555622706696700
729882,150,426,545
,610,798,9252,0091,785
1,7431,8922,0672,0201,989
1,943
7,024
5,0603,9812,5103,0123,428
5,8584,9546,7545,1015,189
5,2997,45511,07413,24813,352
14,02116,72117,38319,70414,651
15,45918,00316,95514,83314,296
12,865
1,900
2,0002,3002,5002,3002,500
2,7003,100
4,2004,400
4,2004,3004,9005,1005,200
5,3005,6006,1006,0005,700
6,100
7,99910,55514,87417,44817,752
18,22121,02122,28324,80419,851
20,75923,60323,05520,83319,996
18,965
8165244228296
349509654
720793822958765
828977949918913
856
8835.7
25.531.727.031.132.5
29.425.524.124.8
23.120.522.020.626.2
25.523.726.528.828.5
1 Includes Government payments and the net change in farm inventories. Net income in this tablediffers from farm proprietors' income shown in Tables D-8 and D-l l because of revisions by the Depart-ment of Agriculture not yet incorporated into the national income accounts of the Department of Commerce.
2 Not available.• Preliminary estimates by Council of Economic Advisers.
Source: Department of Agriculture (except as noted).
181
Digitized for FRASER http://fraser.stlouisfed.org/ Federal Reserve Bank of St. Louis
EMPLOYMENT AND WAGES
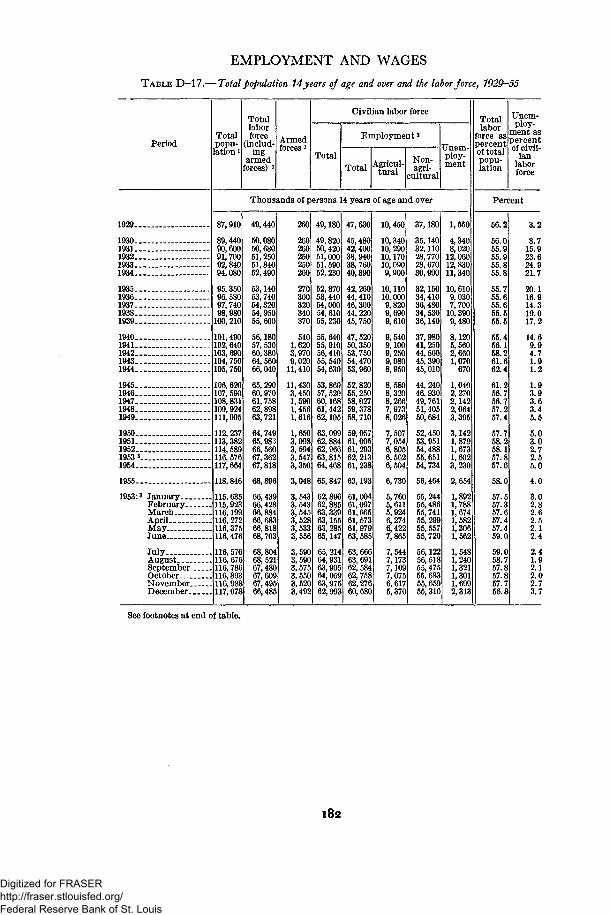
T A B L E D—17-—Total population 14 years of age and over and the labor force, 1929—55
PeriodTotalpopu-
lation i
Totallaborforce
(includ-ing
armedforces) i
Armedforces i
Civilian labor force
Total
Employment2
Total Agricul-tural
Non-agri-
cultural
Unem-ploy-ment
Totallabor
force aspercentof totalpopu-lation
Unem-ploy-
ment aspercentof civil-
ianlaborforce
1929..
1930..1931..1932..1933..1934..
1935..1936..1937..1938..1939..
1940.1941.1942.1943.1944.
1945.1946-1947.1948.1949.
1950...1951—1952...1953 3.1954.-.
1955-.
1953:3 January.. .February-MarchAprilMayJune
Thousands of persons 14 years of age and over
JulyAugustSeptember-OctoberNovemberDecember
87,910
89,44090,60091,70092,84094,080
95,35096,58097,74098,980100,210
101,490102, 640103,690104,750105,750
106,620107, 590108,831109,924111, 095
112, 237113,382114,589116, 576117,664
118,846
115,635115,923116,199116, 272116,375116,476
116, 576116,676116,786116,893116,988117,078
49,440
50,08050,68051,25051,84052,490
53,14053,74054,32054,95055,600
56,18057, 53060,38064,56066,040
65,29060,97061,75862,89863,721
64,74965,98366, 56067,36267,818
68,896
66,43966,42866,88466,68366,81868,703
68,80468, 52167,48067, 60967,49566,485
260
260260250250260
270300320340370
5401,6203,9709,02011,410
11,4303,4501,5901,4561,616
1,6503,0983,5943,5473,350
3,048
3,5433,5433,5453,5283,5333,556
3,5903,5903,5753,5503,5203,492
49,180
49,82050,42051,00051,59052,230
52,87053,44054,00054, 61055,230
55,64055,91056,41055, 54054,630
53,86057,52060,16861,44262,105
63,09962, 88462,96663,81564,468
65, 847
62,89662,88563,33963,15563, 28565,147
65, 21464,93163,90564,05963,97562,993
47,630
45,48042,40038,94038,76040,890
42,26044,41046,30044,22045,750
47,52050,35053,75054,47053,960
52,82055, 25058,02759,37858,710
59,95761,00561, 29362, 21361, 238
63,193
61,00461,09761,66561,57361,97963,585
63,66663,69162, 58462,75862, 27660,680
10,450
10,34010,29010,17010,0909,900
10,11010,0009,8209,6909,610
9,5409,1009,2509,0808,950
8,5808,3208,2667,9738,026
7,5077,0546,8056,5626,504
6,730
5,7605,6115,9246,2746,4227,865
7,5447,1737,1097,0756,6175,370
37,180
35,14032,11028,77028,67030,990
32,15034,41036,48034, 53036,140
37,98041,25044,50045,39045,010
44,24046,93049,76151,40550,684
52,45053, 95154,48855, 65154,734
56,464
55,24455,48655,74155, 29955,55755,720
56,12256,51855,47555, 68355,65955,310
1,550
4,3408,02012,06012,83011,340
10,6109,0307,70010,3909,480
8,1205,5602,6601,070670
1,0402,2702,1422,0643,395
3,1421,8791,6731,6023,230
2,654
1,8921,7881,6741,5821,3061,562
1,5481,2401,3211,3011,6992,313
Percent
56.2
56.055.955.955.855.8
55.755.655.655.555.5
55.456.158.261.662.4
61.256.756.757.257.4
57.758.258.157.857.6
58.0
57.557.357.657.457.459.0
59.058.757.857.857.756.8
3.2
8.715.9
21.7
20.116.914.319.017.2
14.69.94.71.91.2
1.93.93.63.45.5
5.03.02.72.55.0
4.0
3.02.82.62.52.12.4
2.41.92.12.02.73.7
See footnotes at end of table.
182
Digitized for FRASER http://fraser.stlouisfed.org/ Federal Reserve Bank of St. Louis
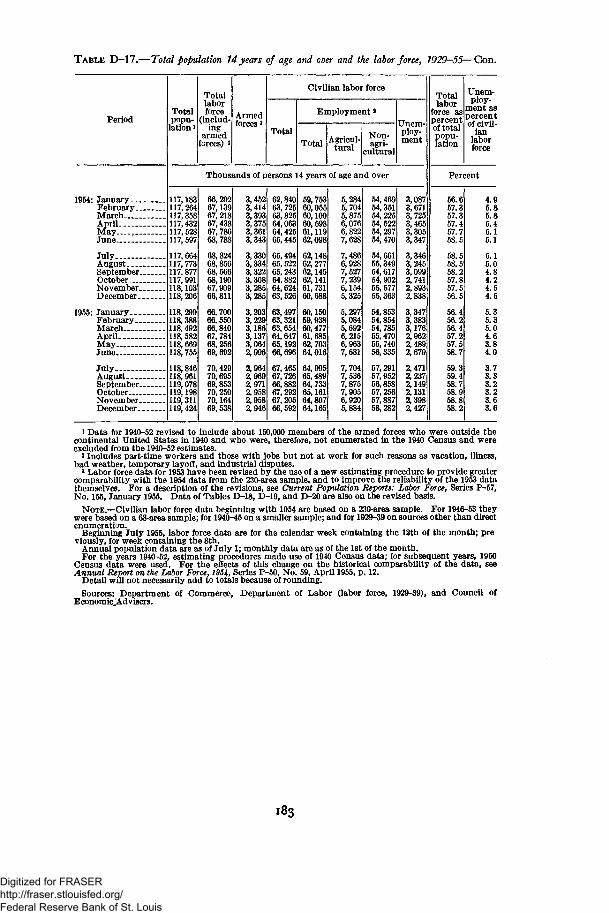
TABLE D-17.—Total population 14 years of age and ever and the labor force, 1929-55—Con.
PeriodTotalpopu-
lation i
Totallaborforce
(includ-ing
armedforces)
Armedforces *
Civilian labor force
Total
Employment2
Total Agricul-tural
Non-agri-
cultural
Unem-ploy-ment
Totallabor
force aspercentof totalpopu-lation
Unem-ploy-
ment aspercentof civil-
ianlaborforce
Thousands of persons 14 years of age and over Percent
1954: January...February..MarchAprilMay—....June
JulyAugustSeptember.October....November.December.
1955: January...February..MarchAprilMayJune
JulyAugustSeptember.October....November.December.
117,183117,264117,358117,432117,528117,597
117,664117,773117,877117,991118,103118,206
118,299118,388118,492118,582118,669118, 755
118,846118,961119,078119,198119,311119,424
66,29267,13967, 21867,43867,78668,788
68,82468, 856
68,19067,90966,811
66,70066,55066,84067, 78468,256
70,42970,695
70,25070,16469,538
3,4523,4143,3933,375
3,343
3,3303,3343,3223,3083,2853,285
3,2033,2293,1863,1373,0642,996
2,9642,9692,9712,9582,9582,946
62,84063, 725
64,06364,42565,445
65,49465, 52265, 24364,88264,62463,526
63,49763,32163,65464,64765,192
67,46567,72666,88267, 29267, 20566,592
59,75360,05560,10060,59861,11962,098
62,14862,27762,14562,14161,731
60,15059,93860,47761,68562, 70364,016
64,99565,48964, 73365,16164,80764,165
5,2845,7045,8756,0766,8227,C"
7,4866,9287,5277,2396,1545,325
5,2975,0845,6926,2156,9637,681
7,7047,5367,8757,9056,9205,884
54,46954,35154, 22554, 52254, 29754, 470
54,66155,34954,61754,90255, 57755,363
54.85354.85454, 78555, 47055, 74056,33557,29157, 95256,85857, 25657,88758,282
3,0873,6713,7253,4653,3053,347
3,3463,2453,0992,741
2,838
3,3473,3833,1762,9622,4892,679
2,4712,2372,1492,1312,3982,427
56.657.357.357.457.758.5
58.558.558.257.857.556.5
56.456.256.457.257.558.7
59.359.458.758.958.858.2
4.95.85.85.45.15.1
5.15.04.84.24.54.5
5.35.35.04.63.84.0
3.73.33.23.23.63.6
1 Data for 1940-52 revised to include about 150,000 members of the armed forces who were outside thecontinental United States in 1940 and who were, therefore, not enumerated in the 1940 Census and wereexcluded from the 1940-52 estimates.
2 Includes part-time workers and those with jobs but not at work for such reasons as vacation, illness,bad weather, temporary layoff, and industrial disputes.3 Labor force data for 1953 have been revised by the use of a new estimating procedure to provide greatercomparability with the 1954 data from the 230-area sample, and to improve the reliability of the 1953 datathemselves. For a description of the revisions, see Current Population Reports: Labor Force, Series P-57,No. 155, January 1955. Data of Tables D-18, D-19, and D-20 are also on the revised basis.
NOTE.—-Civilian labor force data beginning with 1954 are based on a 230-area sample. For 1946-53 theywere based on a 68-area sample; for 1940-45 on a smaller sample; and for 1929-39 on sources other than directenumeration.
Beginning July 1955, labor force data are for the calendar week containing the 12th of the month; previously, for week containing the 8th.
Annual population data are as of July 1; monthly data are as of the 1st of the month.For the years 1940-52, estimating procedures made use of 1940 Census data; for subsequent years, 1950
Census data were used. For the effects of this change on the historical comparability of the data, seeAnnual Report on the Labor Force, 1954, Series P-50, No. 59, April 1955, p. 12.
Detail will not necessarily add to totals because of rounding.Sources: Department of Commerce, Department of Labor (labor force, 1929-39), and Council of
Economic.Advisers.
183
Digitized for FRASER http://fraser.stlouisfed.org/ Federal Reserve Bank of St. Louis
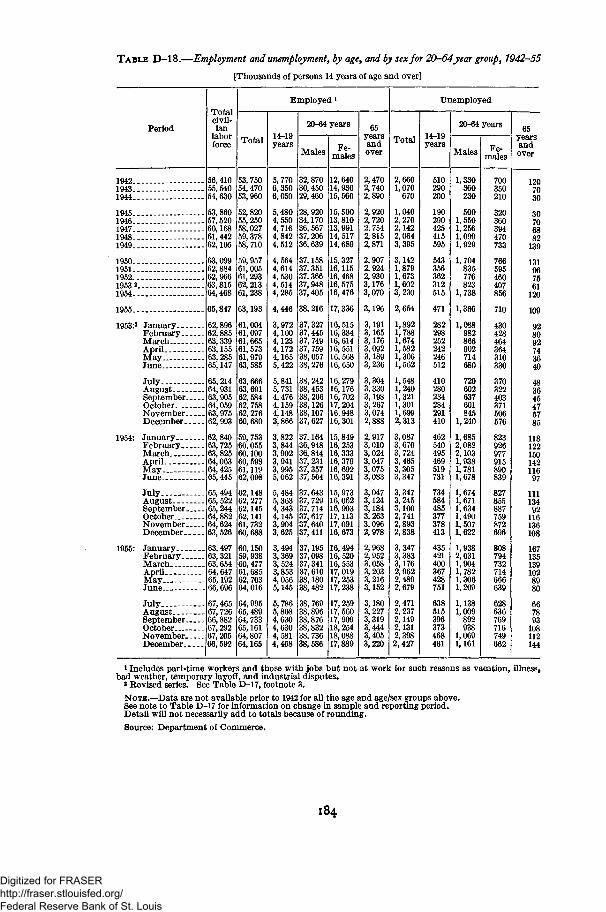
T A B L E D-18.—Employment and unemployment, by age, and by sex for 20-64year group, 1942-55
[Thousands of persons 14 years of age and over]
Period
TLotalcivil-ian
laborforce
56,41055,54054,630
53,86057,52060,16861,44262,105
63,09962,88462,96663,81564,468
65,847
62,89662,88563,33963,15563, 28565,147
65, 21464,93163,90564,05963,97562,993
62, 84063, 72563,82564,06364,42565,445
65,49465, 52265, 24464,88264, 62463, 526
63,49763, 32163,65464,64765,19266,696
67,46567,72666,88267,29267, 20566,592
Total
53,75054,47053,960
52, 82055, 25058,02759,37858, 710
59, 95761,00561, 29362, 21361, 238
63,193
61,00461,09761,66561, 57361,97963,585
63,66663, 69162, 58462, 75862, 27660,680
59, 75360,05560,10060, 59861,11962,098
62,14862, 27762,14562,14161, 73260,688
60,15059,93860,47761,68562, 70364,016
64,99565,48964, 73365,16164,80764,165
Employed i
14-19years
5,7706,3506,050
5,4804,5504,7164,8424,512
4,5644,6144,5304,5144,285
4,446
3,9724,1004,1234,1724,1655,422
5,8415,7314,4764,1594,1483,866
3,8223,8443, 9023,9413,9955,062
5,4845,3634,3434,1453,9043,625
3,4943,3693,5243,8534,0565,145
5,7865,8084,6304,6304,5814,468
20-64 years
Males
32,87030,45029,460
28,92034,17036, 56737, 20636,639
37,15837,35137, 36637,94837,405
38,216
37,32737,44537, 74937, 75938,05738, 276
38, 24238,45338, 20638,12638,10737, 627
37,16436,94836,84437, 23137,35737, 564
37,64337, 72937, 71437, 61737, 64037,411
37,19537,09837,34137,61038,18038,482
38,76938,89638,87638,83238, 73638,586
Fe-males
12,64014,93015,560
15,50013,81013, 99114, 51714,689
15, 32716,11516, 46816, 57516,476
17,336
16,51516,38416,61416, 55116, 56816, 650
16, 27916,17616, 70217,20416,94816,301
15, 84916, 25316,33316,37916,69216,391
15, 97316,06216,90317,11317,09116, 673
16,49416, 52016,55317, 01917, 25317,238
17,25917, 56017, 90918,25418,08817,889
65yearsandover
2,4702,7402,890
2,9202,7202,7542,8152,871
2,9072,9242,9303,1763,070
3,196
3,1913,1653,1763,0923,1893,236
3,3043,3303,1983,2673,0742,888
2,9173,0103,0243,0473,0753,083
3,0473,1243,1843,2633,0962,978
2,9682,9523,0583,2033,2163,152
3,1803,2273,3193,4443,4053,220
Total
2,6601,070
670
1,0402,2702,1422,0643,395
3,1421,8791,6731,6023,230
2,654
1,8921,7881,6741,5821,3061,562
1,5481,2401,3211,3011,6992,313
3,0873,6703,7243,4653,3053,347
3,3473,2453,1002,7412,8932,838
3,3473,3833,1762,9622,4892,679
2,4712,2372,1492,1312,3982,427
Unemployed
14-19years
510290200
190290425415595
543356362312515
471
282298252242246512
410280234284291410
462540495469519731
734584485377378413
435421400367428751
638515396373468461
20-64 years
Males
1,330360230
5001,5501,2561,0991,929
1,704835776823
1,738
1,366
1,088982866902714680
720602637601845
1,240
1,6852,0822,1031,9381,7811,678
1,6741,6711,6341,4901,5071,622
1,9382,0311,9041,7821,3061,209
1,1381,009
892938
1,0691,161
J: e-males
700350210
320360394470733
766595460407856
710
430428464364310330
370322403371506576
823926977915890839
827855887759872696
808794732714666639
628636769716749662
65yearsandover
1207030
30706882
139
131967561
120
109
928092743640
483645475785
11812215014211697
11113492
116136108
1671351391028980
667893
108112144
194219431944
19451946194719481949
1950 - -19511952..1953 21954.
1955 -
1953:2 JanuaryFebruaryMarchAprilMayJune
JulyAugustSeptemberOctoberNovemberDecember
1954: JanuaryFebruaryMarch _AprilMay __-June
July —AugustSeptember._,._-October _-NovemberDecember
1955: JanuaryFebruaryMarchApril -MayJune
JulyAugustSeptemberOctoberNovemberDecember
i Includes part-time workers and those with jobs but not at work for such reasons as vacation, illness,bad weather, temporary layoff, and industrial disputes.
* Eevised series. See Table D-17, footnote 3.
NOTE.—Data are not available prior to 1942 for all the age and age/sex groups above.See note to Table D-17 for information on change in sample and reporting period.Detail will not necessarily add to totals because of rounding.
Source: Department of Commerce.
184
Digitized for FRASER http://fraser.stlouisfed.org/ Federal Reserve Bank of St. Louis
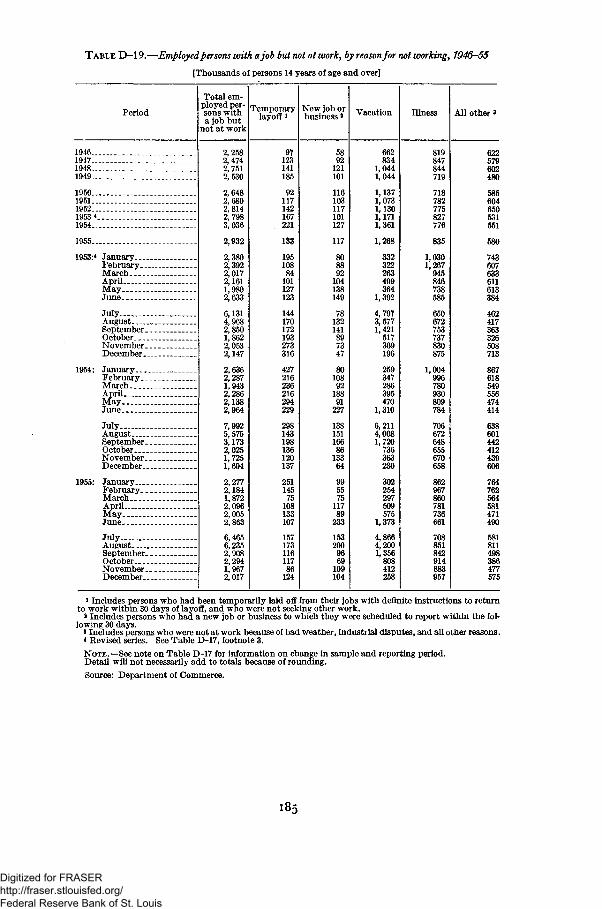
TABLE D-19.—Employed persons with a job but not at work, by reason for not working, 1946-55
[Thousands of persons 14 years of age and over]
Period
Total em-ployed per-sons witha job but
not at work
Temporarylayoff i
New job orbusiness 2 Vacation Illness All other 3
1946194719481949
1950.195119521953*1954
1955...
1953:4 January_._February..MarchAprilMayJune
JulyAugustSeptember.October...November.December.
1954: January. . .February _.MarchAprilMayJune
JulyAugustSeptember.October...November.December.
1955: January...February..MarchAprilMay _June
July.AugustSeptember.October...November.December.
2,2582,4742,7512,530
2,6482,6802,8142,7983,036
2,932
2,3922,0172,1611,9802,633
6,1314,9682,8501,8622,0532,147
2,6362,2871,9432,2862,1382,964
7,9925,5753,1732,0251,7251,694
2,2772,1841,8722,0962,0052,863
6,4656,2352,9082,2941,9672,017
97123141185
117142167221
133
19510884101127123
144170172193273316
427216236216294229
143198136120137
25114575108133107
15717311611786124
5892121101
116103117101127
117
92104138149
78132141897347
1089218891227
1381511668613364
557511789233
1532009669109104
662834
1,0441,044
1,1371,0731,1301,1711,361
1,268
332322263499364
1,392
4,7973,5771,421517369196
259347
4701,310
6,2114,0081,720736363230
302254297509575
1,373
4,8664,2001,356808412258
819847844719
718782775827776
835
1,0301,267945846738585
650672753737830875
1,004996780930809784
706672648655670658
967860781736661
708851842914883957
622579602480
585604650531551
580
743607633611613384
462417363326508713
867618549556474414
638601442412439606
764762564581471490
581811498386477575
1 Includes persons who had been temporarily laid off from their jobs with definite instructions to returnto work within 30 days of layoff, and who were not seeking other work.
2 Includes persons who had a new job or business to which they were scheduled to report within the fol-lowing 30 days.
3 Includes persons who were not at work because of bad weather, industrial disputes, and all other reasons.* Kevised series. See Table D-17, footnote 3.
NOTE.—See note on Table D-17 for information on change in sample and reporting period.Detail will not necessarily add to totals because of rounding.
Source: Department of Commerce.
185
Digitized for FRASER http://fraser.stlouisfed.org/ Federal Reserve Bank of St. Louis
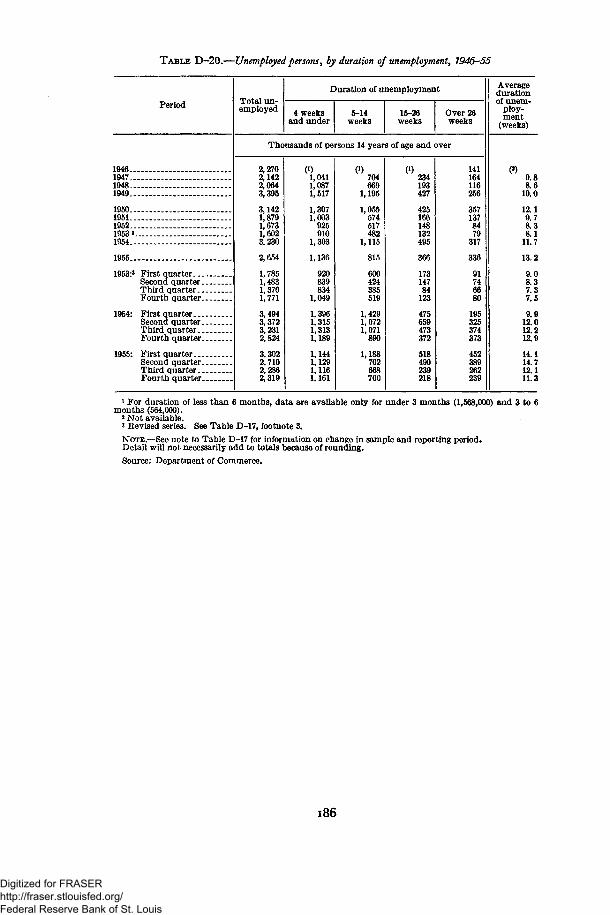
TABLE D-20.—Unemployed persons, by duration of unemployment, 1946-55
Period
1946194719481949 .
1950 - - -195119521953 31954
1955
1953:8 First quarter _Second quarterThird quarterFourth quarter
1954: First quarterSecond quarter _Third quarterFourth quarter
1955: First quarterSecond quarterThird quarterFourth quarter
Total un-employed
Duration of unemployment
4 weeksand under
5-14weeks
15-26weeks
Over 26weeks
Thousands of persons 14 years of age and over
2,2702,1422,0643,395
3,1421,8791,6731,6023,230
2,654
1,7851,4831,3701,771
3,4943,3723,2312,824
3,3022,7102,2862,319
0)1,0411,0871,517
1,3071,003
925910
1,303
1,136
920839834
1,049
1,3961,3151,3131,189
1,1441,1291,1161,161
W 7 0 4669
1,195
1,055574517482
1,115
815
600424385519
1,4291,0721,071
890
1,188702668700
W «193427
425166148132495
366
17314784
123
475659473372
518490239218
141164116256
3571378479
317
336
91746680
195325374373
452389262239
Averagedurationof unem-
ploy-ment
(weeks)
(*)9.88.6
10.0
12.19.78.38.1
11.7
13.2
9.08.37.37.5
9.912.012.212.9
14.114.712.111.3
1 For duration of less than 6 months, data are available only for under 3 months (1,568,000) and 3 to 6months (564,000).
2 Not available.3 Revised series. See Table D-17, footnote 3.
NOTE.—See note to Table D-17 for information on change in sample and reporting period.Detail will not necessarily add to totals because of rounding.
Source: Department of Commerce.
186
Digitized for FRASER http://fraser.stlouisfed.org/ Federal Reserve Bank of St. Louis
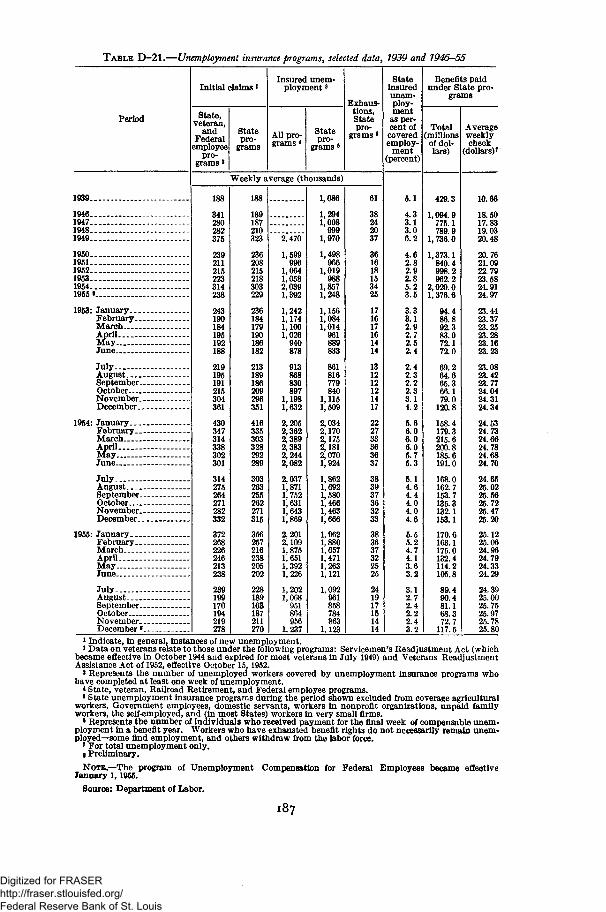
T A B L E D-21.—Unemployment insurance programs, selected data, 1939 and 1946-55
Period State,veteran,
andFederal
employeepro-
grams
Initial claims»
Statepro-
grams
Insured unem-ployment 3
All pro-grams*
Statepro-
grams (
Exhaus-tions,Statepro-
grams 6
Stateinsuredunem-ploy-ment
as per-cent ofcoveredemploy-
ment(percent)
Benefits paidunder State pro-
grams
Totalmillionsof dol-lars)
Averageweeklycheck
(dollars)*
1946.1947.1948.1949.
1950...1951...1952...1953...1954...1955 8_.
1953: January.. .February-MarchAprilMayJune
JulyAugustSeptember-OctoberNovember..December..
1954: January- -February .MarchAprilMayJune
JulyAugustSeptember..OctoberNovember..December..
1955: January- -February .MarchAprilMayJune
JulyAugustSeptember.OctoberNovember.December«
Weekly average (thousands)
188
341280282375
239211215223314
243190184195192188
219195191215304361
430347314338302301
314275264271282332
372268226246213238
239199170194219278
188
189187210323
236208215218303229
236184179190186182
213189186209296351
416335303328292289
303263255262271315
356257216238205202
228189163187211270
2,470
1,599996
1,0641,0582,0391,392
1,2421,1741,1001,026940878
913868830897
1,1981,632
2,2052,3622,3892,3832,2442,082
2,0371,8711,7521,6311,6431,869
2,2012,1091,8751,6511,3921,226
1,2021,068951864956
1,237
1,086
1,2941,008999
1,970
1,498966
1,019988
1,8571,248
1,1561,0841,014961889833
861816779840
1,1151,509
2,0342,1702,1752,1812,0701,924
1,8621,6921,5801,4661,4631,666
1,9621,8801,6571,4711,2631,121
1,092961858784863
1,123
5.1
4.33.13.06.2
4.62.82.92.85.23.5
3.33.12.92.72.52.4
2.42.32.22.33.14.2
5.66.06.06.05.75.3
5.14.64.44.04.04.6
5.55.24.74.13.63.2
3.12.72.42.22.43.2
429.3
1,094.9775.1789.9
1,736.0
1,373.1840.4998.2962.2
2,029.01,376.6
94.486.892.383.072.172.0
69.264.665.366.179.0
120.8
158.4179.3215.6200.8185.6191.0
168.0162.7153.7135.3132.1153.1
170.6163.1175.0132.4114.2105.8
89.490.481.168.372.7
117.5
10.66
18.5017.8319.0320.48
20.7621.0922.7923.5824.9124.97
23.4423.3723.2523.2823.16
23.0823.4223.7724.0424.3124.34
24.5324.7324.6624.7824.6824.70
24.6525.0225.5625.7225.4725.20
25.1225.0624.9624.7924.3324.29
24.3925.0025.7525.9725.7825.80
1 Indicate, in general, instances of new unemployment.2 Data on veterans relate to those under the following programs: Servicemen's Readjustment Act (which
became effective in October 1944 and expired for most veterans in July 1949) and Veterans ReadjustmentAssistance Act of 1952, effective October 15,1952.
8 Represents the number of unemployed workers covered by unemployment insurance programs whohave completed at least one week of unemployment.
* State, veteran, Railroad Retirement, and Federal employee programs.5 State unemployment insurance programs during the period shown excluded from coverage agricultural
workers, Government employees, domestic servants, workers in nonprofit organizations, unpaid familyworkers, the self-employed, and (in most States) workers in very small firms.
• Represents the number of individuals who received payment for the final week of compensable unem-ployment in a benefit year. Workers who have exhausted benefit rights do not necessarily remain unem-ployed—some find employment, and others withdraw from the labor force.
7 For total unemployment only,i Preliminary.
NOTE.—The program of Unemployment Compensation for Federal Employees became effectiveJanuary 1,1955.
Source: Department of Labor.
187
Digitized for FRASER http://fraser.stlouisfed.org/ Federal Reserve Bank of St. Louis
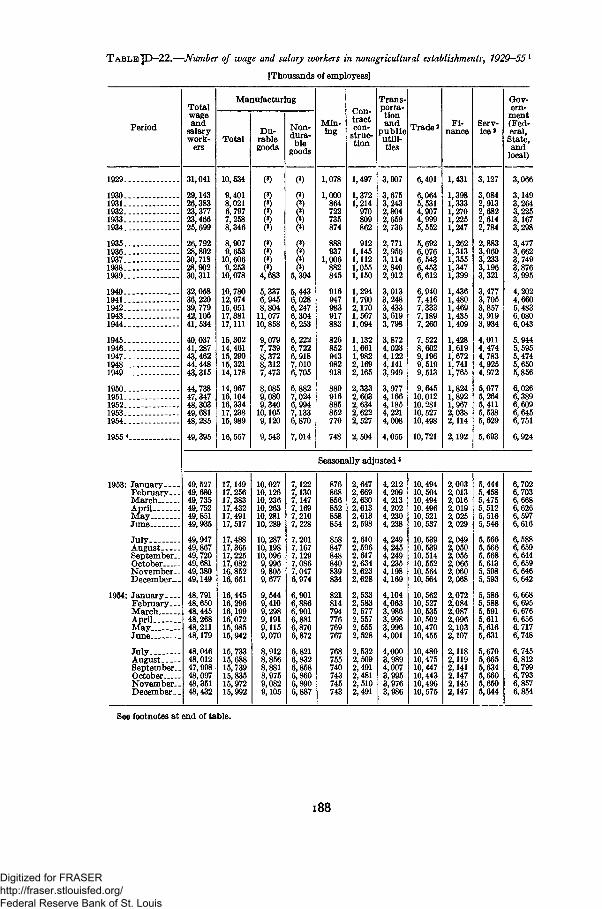
TABLEJD—22.—Number of wage and salary workers in nonagricultural establishments, 1929-55*
[Thousands of employees]
Period
Totalwageand
salarywork-
ers
31,041
29,14326,38323,37723,46625,699
26,79228,80230,71828,90230,311
32,05836,22039, 77942,10641, 534
40,03741,28743, 46244,44843,315
44,73847,34748,30349, 68148,285
49,395
Manufacturing
Total
10,534
9,4018,0216,7977,2588,346
8,9079,653
10,6069,253
10,078
10,78012,97415,05117,38117, 111
15,30214, 46115,29015,32114,178
14,96716,10416,33417, 23815,989
16, 557
Du-rablegoods
(')
003)3)3)3)
COCO0000
4,683
5,3376,9458,804
11,07710,858
9,0797,7398,3728,3127,473
8,0859,0809,340
10,1059,120
9,543
Non-dura-ble
goods
00
(*)
I8(3)00
5,394
5,4436,0286,2476,3046,253
6,2226,7226,9187,0106,705
6,8827,0246,9947,1336,870
7,014
Min-ing
1,078
1,000864722735874
888937
1,006882845
916947983917883
826852943982918
889916885852770
748
Con-tractcon-
struc-tion
1,497
1,3721,214
970809862
9121,1451,1121,0551,150
1,2941,7902,1701,5671,094
1,1321,6611,9822,1692,165
2,3332,6032,6342,6222,527
2,504
Trans-porta-tionand
publicutili-ties
3,907
3,6753,2432,8042,6592,736
2,7712,9563,1142,8402,912
3,0133,2483,4333,6193,798
3,8724,0234,1224,1413,949
3,9774,1664,1854,2214,008
4,055
Trades
6,401
6,0645,5314,9074,9995,552
5,6926,0766,5436,4536,612
6,9407,4167,3337,1897,260
7,5228,6029,1969,5199,513
9,64510, 01210, 28110, 52710, 498
10,721
Fi-nance
1,431
]]
]
]
]
L,398L,333L,270L,225L,247
1,262L,313L, 355L,347L, 399
1,4361,4801,4691,4351,409
L,4281,6191,672L, 741L, 765
L, 8241,892L,9672,0382,114
<2,192
Serv-ice a
3,127
3,0842,9132,6822,6142,784
2,8833,0603,2333,1963,321
3,4773,7053,8573,9193,934
4,0114,4744,7834,9254,972
5,0775,2645,4115,5385,629
5,693
Gov-ern-
ment(Fed-eral,
State,and
local)
1929..
1930..1931..1932..1933..1934..
1935..1936..1937..1938..1939-.
1940..1941..1942..1943..1944..
1945..1946..1947..1948..1949..
1950..1951..1952..1953..1954-.
1955 *
1953: JanuaryFebruary. _MarchAprilMayJune
JulyAugustSeptember.October—.November.December..
1954: JanuaryFebruary..MarchAprilMayJune
JulyAugustSeptember.OctoberNovember.December _
3,066
3,1493,2643,2253,1673,298
3,4773,6623,7493,8763,995
4,2024,6605,4836,0806,043
5,9445,5955,4745,6505,856
6,026
6,6456,751
6,924
Seasonally adjusted5
49,52749,68049,73549, 75249,85149,935
49,94749,86749, 72049,68149,38049,149
48,79148,65048,44548,26848,21148,179
48,04648,01247,998.48,09748,35148,432
17,14917, 25617,38317, 43217, 49117, 517
17,48817,36517, 22517,08216, 85216, 651
16,44516,29616,19916,07215,98515,942
15,73315,68815,73915,83515,97215,992
10, 02710,12610,23610,26310, 28110,289
10, 28710,19810,0969,9969,8059,677
9,5449,4109,2989,1919,1159,070
8,9128,8568,8818,9759,0829,105
7,1227,1307,1477,1697,2107,228
7,2017,1677,1297,0867,0476,974
6,9016,8866,9016,8816,8706,872
6,8216,8326,8586,8606,8906,887
876868856852858854
858847848840839834
821814794776769767
768755740743745743
2,6472,6692,6302,6132,6132,598
2,6102,5962,6172,6342,6232,628
2,5332,5832,5772,5572,5552,528
2,5322,5092,4912,4812,5102,491
4,2124,2094,2134,2024,2304,238
4,2494,2454,2494,2354,1984,169
4,1044,0633,9863,9983,9964,001
4,0003,9894,0073,9953,9763,986
10, 49410, 50410, 49410,49610, 52110, 537
10, 53910, 53910, 51410, 55210, 56410, 564
10,56210,52710,53510,50210,47010,455
10,48010,47510,44710,44310,49610,575
2,0032,0132,0162,0192,0252,029
2,0492,0502,0552,0662,0602,068
2,0722,0842,0872,0962,1032,107
2,1182,1192,1412,1472,1452,147
5,4445,4585,4755,5125,5165,546
5,5665,5665,5685,6135,5985,593
5,5865,5885,5915,6115,6165,631
5,6705,6655,6345,6605,6505,644
6,7026,7036,6686,6266,5976,616
6, 5886,6596,6446,6596,6466,642
6,6686,6956,6766,6566,7176,748
6, 7456,8126,7996,7936,8576,854
See footnotes at end of table.
188
Digitized for FRASER http://fraser.stlouisfed.org/ Federal Reserve Bank of St. Louis
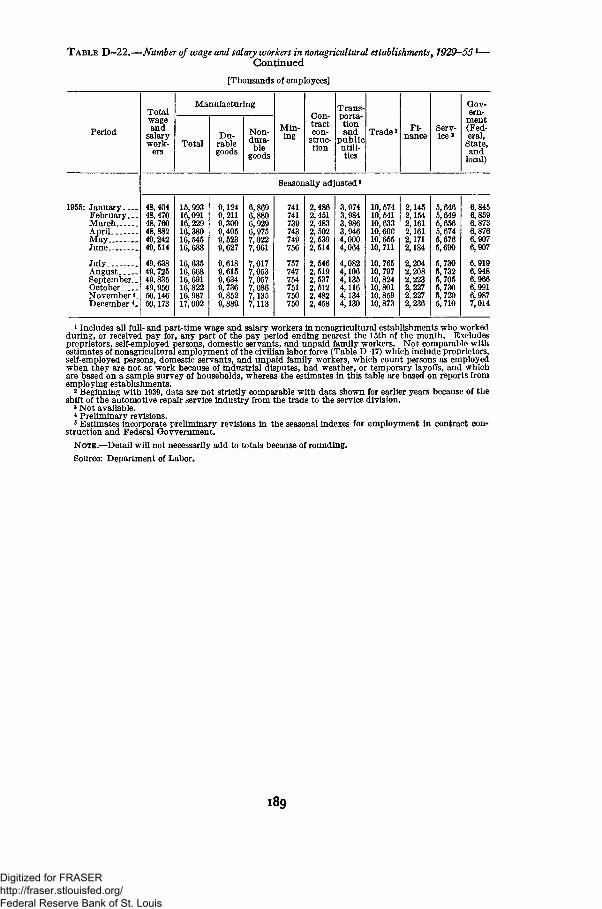
TABLE D—22.—Number of wage and salary workers in nonagricultural establishments, 1929—551—Continued
[Thousands of employees]
Period
Totalwageand
salary-work-
ers
Manufacturing
TotalDu-rablegoods
Non-dura-ble
goods
Min-ing
Con-tractcon-
struc-tion
Trans-porta-tionand
publicutili-ties
Trades Fi- Serv-
Gov-ern-
ment(Fed-eral,
State,and
local)
Seasonally adjusted5
1955: JanuaryFebruary. _.MarchAprilMayJune
JulyAugustSeptember-OctoberNovember *.December 4>
48,40448,47048, 76048,88249,24249,514
49, 63849, 72549,83549, 95050,14650,173
15,99316,09116,22916,38016,54516,688
16,63516,66816,69116,82216, 98717,002
9,1249,2119,3009,4059,5239,627
9,6189,6159,6349,7369,8529,88ft
6,8696,8806,9296,9757,0227,061
7,0177,0537,0577,0867,1357,113
741741739743749756
757747754751750750
2,4862,4512,4832,5022,5392,514
2,5462,5192,5372,5122,4822,458
3,9743,9843,9863,9464,0004,064
4,0824,1064,1354,1164,1344,130
10,57410,54110,63310,60010,65510,711
10.76510,79710,82410,80110,85910,873
2,1452,1542,1612,1612,1712,184
2,2042,2082,2232,2272,2272,236
5,6465,6495,6565,6745,6765,690
5,7305,7325,7055,7305,7205,710
6,8456,8596,8736,8766,9076,907
6,9196,948
6,9916,9877,014
1 Includes all full- and part-time wage and salary workers in nonagricultural establishments who workedduring, or received pay for, any part of the pay period ending nearest the 15th of the month. Excludesproprietors, self-employed persons, domestic servants, and unpaid family workers. Not comparable withestimates of nonagricultural employment of the civilian labor force (Table D-17) which include proprietors,self-employed persons, domestic servants, and unpaid family workers, which count persons as employedwhen they are not at work because of industrial disputes, bad weather, or temporary layoffs, and whichare based on a sample survey of households, whereas the estimates in this table are based on reports fromemploying establishments.
2 Beginning with 1939, data are not strictly comparable with data shown for earlier years because of theshift of the automotive repair service industry from the trade to the service division.
3 Not available.4 Preliminary revisions.5 Estimates incorporate preliminary revisions in the seasonal indexes for employment in contract con-struction and Federal Govvernment.
NOTE.—Detail will not necessarily add to totals because of rounding.Source: Department of Labor.
189
Digitized for FRASER http://fraser.stlouisfed.org/ Federal Reserve Bank of St. Louis
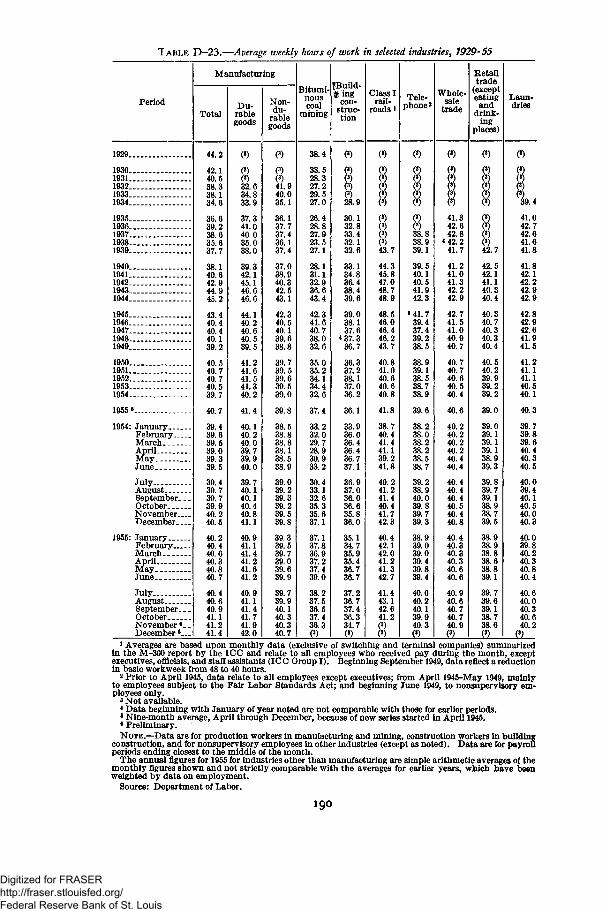
T A B L E
Period
1929
19301931193219331934
1935193619371938.1939
1940194119421943..1944
1945...19461947 _19481949.
19501951195219531954
1955 8_ ._
1954: January.FebruaryMarchApriL.May.Tuna
JulyAugustSeptemberOctoberNovemberDecember
1955: January.FebruaryMarchAprilMayJune ..
JulyAugustSeptemberOctoberNovember 8_ _December 8___
D-23.—Average weekly hours of work in selected industries, 7929-55
Manufacturing
Total
44.2
42.140 538.338.134.6
36.639.238 635.637 7
38 140 642 944.945.2
43 440 440 440 139.2
40.540 740.740.539.7
40.7
39 439.639 539.039 339 5
39 439.739.739.940.240.5
40.240.440.640 340.840.7
40.440.640.941.141.241.4
Du-rablegoods
32.634.833.9
37.341.040 035.038 0
39 342.145 146.646.6
44.140 240.640 539.5
41.241 641.541.340.2
41.4
40.140.240 039.739 940 0
39 740.140.140.440.841.1
40.941.141.441.241.641.2
40.941.141.441.741.942.0
Non-du-
rablegoods
00
(3)41.940.035.1
36.137.737.436.137.4
37.038.940 342.543.1
42.340.540.139 638.8
39.739 539.639.539.0
39.8
38.538.838 838.138 538.9
39.039.239.339.239.539.8
39.339.539.739 039.639.9
39.739.940.140.340.340.7
Bitumi-nouscoal
mining
38.4
33.528.327.229.527.0
26.428.827.923.527.1
28.131.132.936.643.4
42.341.640.738.032.6
35.035 234.134.432.6
37.4
33.232.029 728.930 933.2
30.433.132.635.335.637.1
37.137.836.937 237.439.0
38.237.536.537.436.3
IBuild-
con-struc-tion
(3)
(3)28.9
30.132.833.432.132.6
33.134.836.438.439.6
39.038.137.6
*37.336.7
36.337.238.137.036.2
36.1
33.936.036.436.436.737.1
36.937.036.036.635.836.0
35.134.735.935.436.736.7
37.236.737.436.334.7
Class Irail-
roads *
8(3)(3)
(3)
43.7
44.345.847.048.748.9
48.546.046.446.243.7
40.841.040.640.640.8
41.8
38.740.441.441.139.241.8
40.241.241.440.441.742.3
40.442.142.041.241.342.7
41.443.142.641.2
8
Tele-phone3
n
!(")38.838.939.1
39.540.140.541.942.3
«41.739.437.439.238.5
38.939.138.538.738.9
39.6
38.238.038.238.238.538.7
39.238.940.039.839.739.3
38.939.039.039.439.839.4
40.040.240.139.940.3(3)
Whole-sale
trade
141.342.642.8
4 42.241.7
41.241.041.342.242.9
42.741.541.040.940.7
40.740.740.640.540.4
40.6
40.240.240.240.240.440.4
40.440.440.440.540.440.8
40.440.340.340.340.640.6
40.940.640.740.740.9
Retailtrade
(excepteating
anddrink-
ingplaces)
(J)
i8,42.542.141.140.340.4
40.340.740.340.340.4
40.540.239.939.239.2
39.0
39.039.139.139.138.939.3
39.839.739.138.938.739.5
38.938.938.838.638.839.1
39.739.639.138.738.6
Laun-dries
0
(3)(3)(3)39.4
41.042.742.641.641.8
41.842.142.242.942.9
42.842.942.641.941.5
41.241.141.140.540.1
40.3
39.739.839.640.440.340.5
40.039.440.140.540.040.3
40.039.840.240.340.840.4
40.640.040.340.640.2
1 Averages are based upon monthly data (exclusive of switching and terminal companies) summarizedin the M-300 report by the ICC and relate to all employees who received pay during the month, exceptexecutives, officials, and staff assistants (ICC Group I). Beginning September 1949, data reflect a reductionin basic workweek from 48 to 40 hours.2 Prior to April 1945, data relate to all employees except executives; from April 1945-May 1949, mainlyto employees subject to the Fair Labor Standards Act; and beginning June 1949, to nonsupervisory em-ployees only.3 Not available.4 Data beginning with January of year noted are not comparable with those for earlier periods.6 Nine-month average, April through December, because of new series started in April 1945.8 Preliminary.
NOTE.—Data are for production workers in manufacturing and mining, construction workers in buildingconstruction, and for nonsupervisory employees in other industries (except as noted). Data are for payrollperiods ending closest to the middle of the month.
The annual figures for 1955 for industries other than manufacturing are simple arithmetic averages of themonthly figures shown and not strictly comparable with the averages for earlier years, which have beenweighted by data on employment.
Source: Department of Labor.
i go
Digitized for FRASER http://fraser.stlouisfed.org/ Federal Reserve Bank of St. Louis
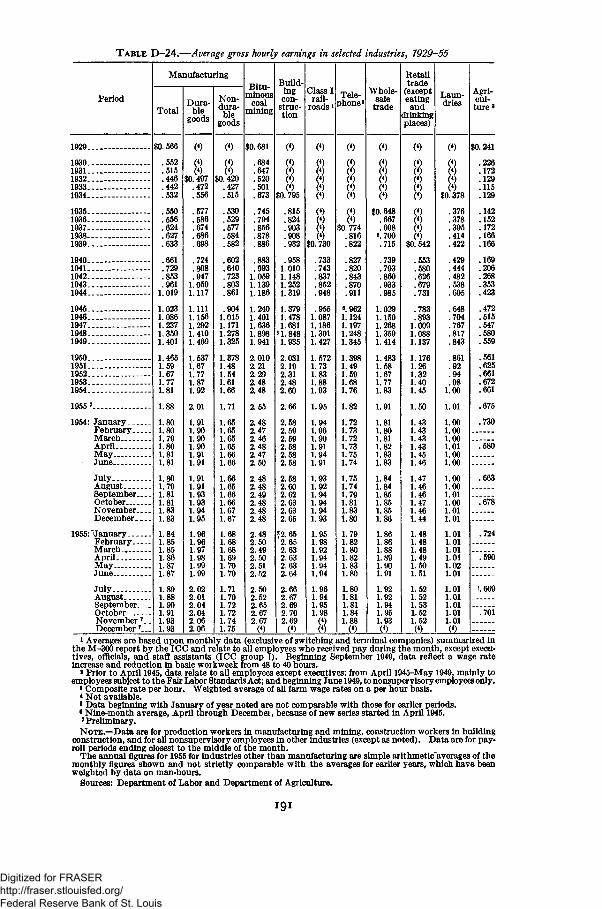
TABLE D-24.—Average gross hourly earnings in selected industries, 1929-55
Period
Manufacturing
TotalDura-
blegoods
Non-dura-ble
goods
Bitu-minous
coalmining
Whole-sale
trade
Retailtrade
(excepteatingand
drinking
Laun-dries
Agri-cul-ture1
1929.
1931.1932.1933.1934.
1935.1936.1937-1938-1939.
1940.1941.1942.1943.1944.
1945.1946.1947.1948.1949.
1950.1951.1952.1953.1954.
1955 7.
1954: JanuaryFebruaryMarchAprilMayJune -.
July.. - -AugustSeptemberOctober _NovemberDecember
1955: "January _FebruaryMarchAprilMayJune
JulyAugustSeptemberOctoberNovember 7 . .December 7.._
$0.566
.552
.515
.446
.442
.532
.550
.556
.624
.627
.633
.661
.729
.853
.9611.019
1.0231.0861.2371.3501.401
1.4651.591.671.771.81
1.88
1.801.801.791.801.811.81
1.801.791.811.811.831.83
1.841.851.851.861.871.87
1.891.881.901.911.931.93
()$0,497
.472
.556
.577
.586
.674
.724
.808
.9471.0591.117
1.1111.1561.2921.4101.469
1.5371.671.771.871.92
2.01
1.911.901.901.901.911.91
1.911.911.931.931.941.95
1.961.961.971.981.991.99
2.022.012.042.042.062.06
8$0. 420.427.515.530.529.577.584.582
.602
.640
.723
.803
.861
.9041.0151.1711.2781.325
1.3781.481.541.611.66
1.71
1.651.651.651.651.661.66
1.661.651.661.661.671.67
1.681.681.681.691.701.70
1.711.701.721.721.741.75
$0,681
.684
.647
.520
.501
.673
.745
.794
.856
.878
1.0591.1391.186
1.2401.4011.6361.8981.941
2.0102.212.292.482.48
2.55
2.482.472.462.482.472.50
2.482.482.492.482.482.48
2.482.502.492.502.512.52
2.502.522.652.672.67
(*)
()$0.795
.815
.824
.903
.908
.932
.9581.0101.1481.2521.319
1.3791.4781.6811.8481.935
2.0312.192.312.482.60
2.582.592.592.582.582.58
2.582.602.622.632.632.65
2.672.692.702.69
()$0.730
.733
.743
.837
.852
.948
.9551.0871.1861.3011.427
1.5721.731.831.881.93
1.95
1.941.961.901.911.941.91
1.931.921.941.941.941.93
1.951.981.921.941.941.94
$0. 648.667.698
5.700.715
.739
.793
.985
1.0291.1501.2681.3591.414
1.4831.581.671.771.83
1.91
1.811.801.811.821.831.83
1.841.841.851.851.851.86
1.861.861.881.891.901.91
1.921.921.941.951.93
$0,378
.376
.378
.395
.414
.422
.429
.444
.482
.538
.605
.704
.767
.817
.843
.861
.92
.94
.981.00
1.01
.00
.00
.00
.01
.00
.00
.00
.00
.01
.00
.01
.01
.01
.01
.01
.01
.02
.01
.01
.01
.01
.01
.01
$0,241
.226
.172
.129
.115
.129
.142
.152
.172
.166
.166
.169
.206
.268
.353
.423
.472
.515
.547
.580
.559
.561
.625
.661
.672
.661
.675
.730
.580
.663
.678
.724
.590
.701
i Averages are based upon monthly data (exclusive of switching and terminal companies) summarized inthe M-300 report by the ICC and relate to all employees who received pay during the month, except execu-tives, officials, and staff assistants (ICC group I). Beginning September 1949, data reflect a wage rateincrease and reduction in basic workweek from 48 to 40 hours.
* Prior to April 1945, data relate to all employees except executives; from April 1945-May 1949, mainly toemployees subject to the Fair Labor Standards Act; and beginning June 1949, to nonsupervisory employees only.
» Composite rate per hour. Weighted average of all farm wage rates on a per hour basis.< Not available.8 Data beginning with January of year noted are not comparable with those for earlier periods.6 Nine-month average, April through December, because of new series started in April 1945.7 Preliminary.NOTE.—Data are for production workers in manufacturing and mining, construction workers in building
construction, and for all nonsupervisory employees in other industries (except as noted). Data are for pay-roll periods ending closest to the middle of the month.
The annual figures for 1955 for industries other than manufacturing are simple arithmetic'averages of themonthly figures shown and not strictly comparable with the averages for earlier years, which have beenweighted by data on man-hours.
Sources: Department of Labor and Department of Agriculture.
Digitized for FRASER http://fraser.stlouisfed.org/ Federal Reserve Bank of St. Louis
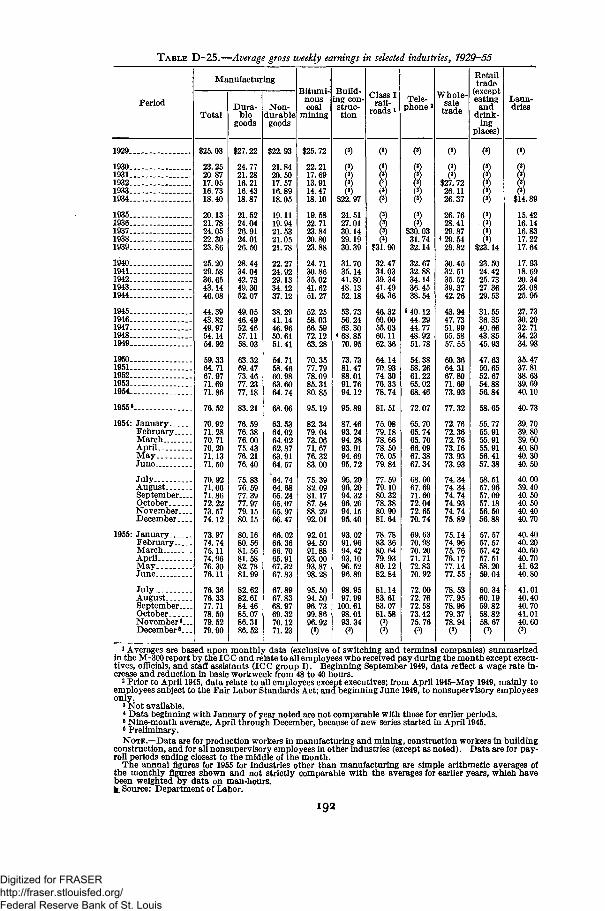
TABLE D-25.—Average gross weekly earnings in selected industries, 1929-55
Period
Manufacturing
Total
$25.03
23.2520.8717.0516.7318.40
20.1321.7824.0522.3023.86
25.2029. 5836. 6543.1446.08
44.3943.8249.9754.1454.92
59.3364.7167.9771.6971.86
76.52
70.9271.2870.7170.2071.1371.50
70.9271.0671.8672.2273.5774.12
73.9774.7475.1174.9676.3076.11
76.3676.3377.7178.5079.5279.90
Dura-ble
goods
$27.22
24.7721.2816.2116.4318.87
21.5224.0426.9124.0126.50
28.4434.0442.7349.3052.07
49.0546.4952.4657.1158.03
63.3269.4773.4677.2377.18
83.21
76.5976.3876.0075.4376.2176.40
75.8376.5977.3977.9779.1580.15
80.1680.5681.5681.5882.7881.99
82.6282.6184.4685.0786.3186.52
Non-durablegoods
$22.93
21.8420.5017.5716.8918.05
19.1119.9421. 5321.0521.78
22.2724.9229.1334.1237.12
38.2941.1446.9650.6151.41
54.7158.4660.9863.6064.74
68.06
63.5364.0264.0262.8763.9164.57
64. 7464.6865.2465.0765.9766.47
66.0266.3666.7065.9167.3267.83
67.8967.8368.9769.3270.1271.23
Bitumi-nouscoal
mining
$25. 72
22.2117.6913.9114.4718.10
19.5822.7123.8420.8023.88
24.7130.8635.0241.6251.27
52.2558.0366.5972.1263.28
70.3577.7978.0985.3180.85
95.19
82.3479.0473.0671.6776.3283.00
75.3982.0981.1787.5488.2992.01
92.0194.5091.8893.0093.8798.28
95.5094.5096.7399.8696.92
Build-ing con-struc-tion
(3)
i(3)$22. 97
24. 5127.0130.1429.1930.39
31.7035.1441.8048.1352.18
53.7356.2463.30
4 68.8570.95
73.7381.4788.0191.7694.12
95.89
87.4693.2494.2893.9194.6995.72
95.2096.2094.3296.2694.1595.40
93.0291.9694.4293.1096.5296.89
98.9597.99
100.6198.0193.34
(3)
Class Irail-
roads !
|
(3)
(3)(3)
(3)(3)
$31.90
32.4734.0339.3441.4946.36
46.3250.0055.0360.1162.36
64.1470.9374.3076.3378.74
81.51
75.0879.1878.6678.5076.0579.84
77.5979.1080.3278.3880.9081.64
78.7883.3680.6479.9380.1282.84
81.1483.6183.0781.58
(3)
(3)
Tele-phone 2
(3)(3)(3)(3)
(3)(3)
(3)(3)
$30.0331.7432.14
32.6732.8834.1436.4538.54
6 40.1244.2944.7748.9251.78
54.3858.2661.2265.0268.46
72.07
65.7065.7465.7066.0967.3867.34
68.6067.6971.6072.0472.6570.74
69.6370.9870.2071.7172.8370.92
72.0072.7672.5873.4275.76(3)
Whole-sale
trade
(3)(3)
(3)$27.7226.1126.37
26.7628.4129.87
4 29. 5429.82
30.4532.5135.5239.3742.26
43.9447.7351.9955.5857.55
60.3664.3167.8071.6973.93
77.32
72.7672.3672.7673.1673.9373.93
74.3474.3474.7474.9374.7475.89
75.1474.9675.7676.1777.1477.55
78.5377.9578.9679.3778.94(3)
Retailtrade
(excepteatingand
drink-ing
places)
CO(3)
(3)(3)
(3)(3)
(3)
(3)
8$23.14
23.5024.4225.7327.3629.53
31.5536.3540.6643.8545.93
47.6350.6552.6754.8856.84
58.65
55.7755.9155.9155.9156.4157.38
58.5157.9657.0957.1856.5056.88
57.5757.5757.4257.5158.2059.04
60.3460.1959.8258.8258.67(3)
Laun-dries
1929
19301931193219331934
1935...1936193719381939..
1940194119421943...1944
19451946-194719481949
19501951195219531954
19558-
1954: JanuaryFebruary...March _AprilMayJune.
JulyAugustSeptember..OctoberNovember..December..
1955: JanuaryFebruary.. _MarchAprilMayJune
JulyAugustSeptember..OctoberNovember6.December8.
3)3)
3$14.8915.4216.1416.8317.2217.64
17.9318.6920.3423.0825.95
27.7330.2032.7134.2334.98
35.4737.81
40.10
40.73
39.7039.8039.6040.8040.3040.50
40.0039.4040.5040.5040.4040.70
40.4040.2040.6040.7041.6240.80
41.0140.4040.7041.0140.60
1 Averages are based upon monthly data (exclusive of switching and terminal companies) summarizedin the M-300 report by the ICC and relate to all employees who received pay during the month except execu-tives, officials, and staff assistants (ICC group I). Beginning September 1949, data reflect a wage rate in-crease and reduction in basic workweek from 48 to 40 hours.
2 Prior to April 1945, data relate to all employees except executives; from April 1945-May 1949, mainly toemployees subject to the Fair Labor Standards Act; and beginning June 1949, to nonsupervisory employeesonly.
a Not available.* Data beginning with January of year noted are not comparable with those for earlier periods.8 Nine-month average, April through December, because of new series started in April 1945.6 Preliminary.NOTE.—Data are for production workers in manufacturing and mining, construction workers in building
construction, and for all nonsupervisory employees in other industries (except as noted). Data are for pay-roll periods ending closest to the middle of the month.
The annual figures for 1955 for industries other than manufacturing are simple arithmetic averages ofthe monthly figures shown and not strictly comparable with the averages for earlier years, which havebeen weighted by data on man-hours.!&Source: Department of Labor.
Digitized for FRASER http://fraser.stlouisfed.org/ Federal Reserve Bank of St. Louis
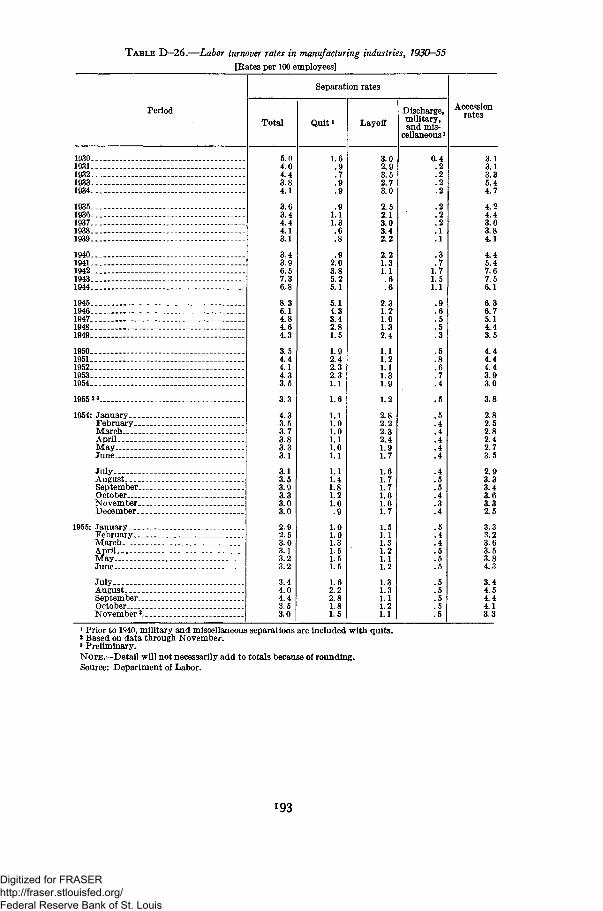
T A B L E D—26.—Labor turnover rates in manufacturing industries, 1930—55[Kates per 100 employees]
Period
Separation rates
Total
5.04.04.43.84.1
3.63.44.44.13.1
3.43.96.57.36.8
8.36.14.84.64.3
3.54.44.14.33.5
3.3
4.33.53.73.83.33.1
3.13.53.93.33.03.0
2.92.53.03.13.23.2
3.44.04.43.53.0
Quit*
1.6. 9.7. 9.9
. 91.11.3
.6
.8
. 92.03.85.25.1
5.14.33.42.81.5
1.92.42.32.31.1
1.6
1.11.01.01.11.01.1
1.11.41.81.21.0.9
1.01.01.31.51.51.5
1.62.22.81.81.5
Layoff
3.02.93.52.73.0
2.52.13.03.42.2
2.21.31.1
.6
. 6
2.31.21.01.32.4
1.11.21.11.31.9
1.2
2.82.22.32.41.91.7
1.61.71.71.61.61.7
1.51.11.31.21.11.2
1.31.31.11.21.1
Discharge,military,and mis-
cellaneous 1
0.4. 2. 2. 2. 2
.2
. 2
. 2
. 1
. 1
. 3
.71.71.51.1
. 9
.6
. 5
. 5
. 3
. 5
.8
.6
.7
. 4
. 5
. 5
.4
.4
.4
.4
.4
.4
. 5
. 5
.4
. 3
. 4
. 5
. 4
. 4
. 5
.5
. 5
. 5
. 5
. 5
. 5
. 5
Accessionrates
3.13.13.35.44.7
4.24.43.63.84.1
4.45.47.67.56.1
6.36.75.14.43.5
4.44.44.43.93.0
3.8
2.82.52.82.42.73.5
2.93.33.43.63.32.5
3.33.23.63.53.84.3
3.44.54.44.13.3
19301931..1932.1933.1934 _—
1935.1936.19371938.1939
1940 -1941-.1942...1943 - —1944 —
19451946 - .1947 —19481949
1950 . . . .1951195219531954
1955 23. _..
1954: JanuaryFebruary...MarchAprilMayJune
JulyAugustSeptember..OctoberNovember..December..
1955: JanuaryFebruary...MarchAprilMayJune. .
July . .AugustSeptember..OctoberNovember3.
' Prior to 1940, military and miscellaneous separations are included with quits.* Based on data through November.3 Preliminary.NOTE.—Detail will not necessarily add to totals because of rounding.Source: Department of Labor.
193
Digitized for FRASER http://fraser.stlouisfed.org/ Federal Reserve Bank of St. Louis
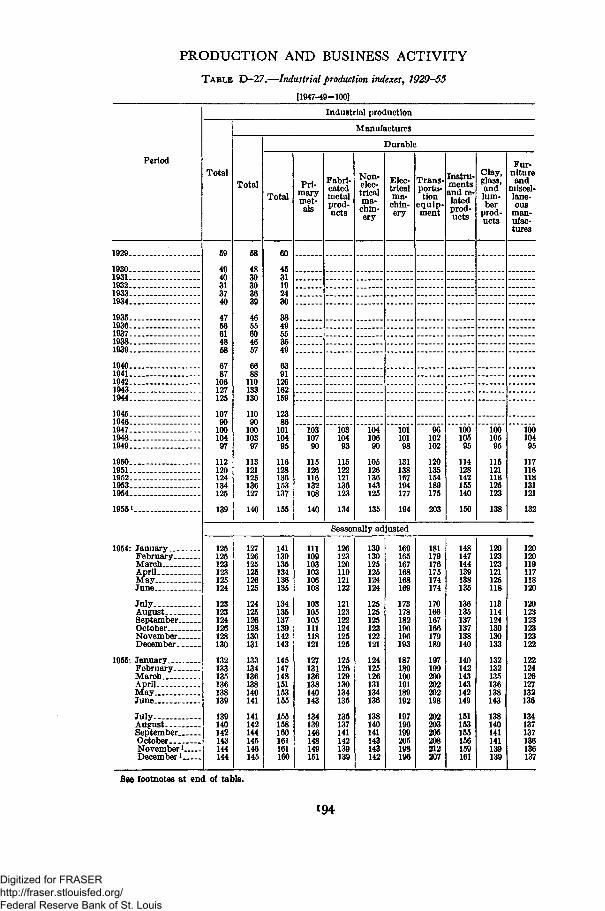
PRODUCTION AND BUSINESS ACTIVITY
TABLE D-27.—Industrial production indexes, 1929-55
[1947-49-100]
Period
Industrial production
Total
Manufactures
Total
Durable
TotalPri-
marymet-als
Fabri-catedmetalprod-ucts
Non-elec-tricalma-chin-ery
Elec-tricalma-chin-ery
Trans-porta-tion
equip-ment
Instru-mentsand re-latedprod-ucts
Clay,glass,andlum-ber
prod-ucts
Fur-nitureand
miscel-lane-ous
man-ufac-tures
1929..
1930..1931..1932..1933.1934.
1935.1936.1937.1938.1939.
1940.1941.1942.1943.1944.
1945.1946.1947.1948-1949.
1950.1951.1952.1953.1954.
1955 V
1954: JanuaryFebruaryMarchAprilMay _.June
July—AugustSeptemberOctoberNovemberDecember. _.
1955-. JanuaryFebruaryMarchAprilMayJune
JulyAugustSeptemberOctoberNovember1
December1
4940313740
4756614858
6787
106127125
10790
10010497
112120124134125
139
125125123123125124
123123124126128130
132133135136138139
139140142143144144
110133130
11090
10010397
113121125136127
140
3849553549
6391126162159
12386
10110495
116128136153137
155
10310790
115126116132108
140
10310493
115122121136123
134
10410690
105126136143125
135
101101
131138167194177
194
102102
120135154189175
203
10010595
114128142155140
150
Seasonally adjusted
10010595
115121118125123
138
127126125125126125
124125126128130131
133134136138140141
141142144145146145
141139135134136135
134135137139142143
145147148151153155
155158160161161160
111109103103106108
103105105111118121
127131136138140143
134139146148149151
126123120119121122
121123122124125125
125126129130134135
135137141142139139
130130125125124124
125125125123122121
124125126131134136
138140141143143142
169165167168168169
173178182190196193
187189190191189192
197196199205198196
181179176175174174
170166167166179189
197199200202202198
202203205208212207
148147144139138135
136135137137138140
140142143143142149
151153155156159161
120123123121125118
113114124130130133
132132135136138143
138140141141139139
10010495
117116118131121
132
120120119117118120
120123123123123122
122124126127132136
134137137136136137
See footnotes at end of table.
194
Digitized for FRASER http://fraser.stlouisfed.org/ Federal Reserve Bank of St. Louis
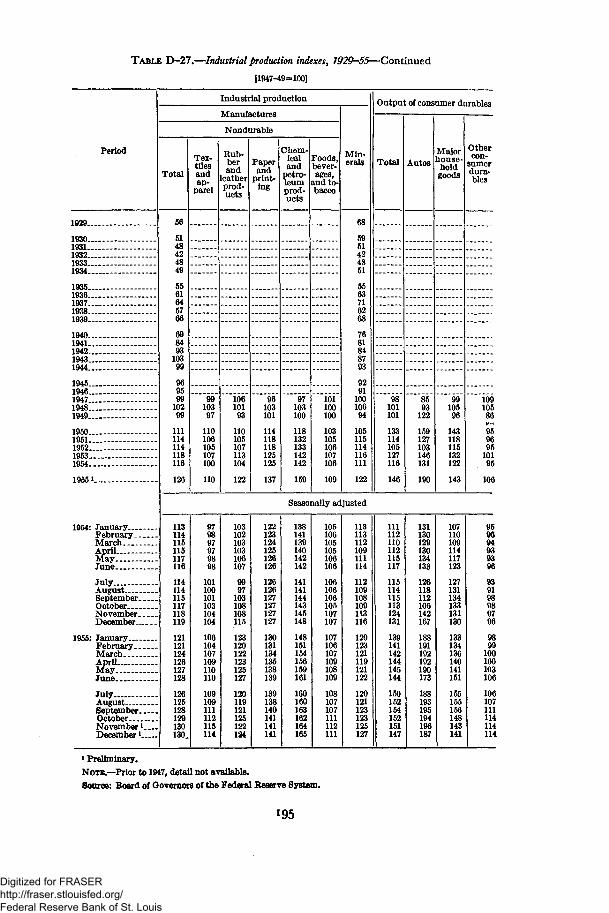
TABLE D-27.—Industrial production indexes, 1929-55—Continued
[1947-49=100]
Period
1929
19301931 - - -193219331934
19351936193719381939 - -
19401941194219431944
1945194619471948 ___1949
19501951195219531954
19551,
1954* JanuaryFebruaryMarchApril - -MayJune . - *
JulyAugustSeptemberOctoberNovemberDecember
1955: JanuaryFebruaryMarchAprilMay -June - - -
JulyAugustSeptemberOctober . — .November1
Decemberl
Industrial production
Manufactures
Nondurable
Total
56
5148424849
5561645766
698493
10399
969599
10299
111114114118116
126
Tex-tilesandap-
parel
9910397
110106105107100
110
Kub-berand
leatherprod-ucts
10610193
110105107113104
122
Paperand
print-ing
96103101
114118118125125
137
Chem-icaland
petro-leumprod-ucts
97103100
118132133142142
159
Foods,bever-ages,
and to-bacco
101100100
103105106107106
109
Min-erals
68
5951424851
5563716268
7681848793
9291
10010694
105115114116111
122
Output of consumer di
Total
98101101
133114105127116
146
Autos
8593
122
159127103146131
190
Majorlouse-holdgoods
9910596
143118115132122
143
irables
Othercon-
sumerdura-bles
10910586***•;959695
10195
106
Seasonally adjusted
113114115115117116
114114115117118119
121121124126127128
126125128129130130.
979897979898
101100101103104104
106104107109110110
109109111112115114
103102103103106107
9997
103108108115
123120122123125127
120119121125122124
122123124125126126
126126127127127127
130131134135138139
139138140141141141
138141139140142142
141141144143145148
148151154156159161
160160163162164165
105106105105106106
106106106105107107
107106107109108109
108107107111112111
113113112109111114
112109108109113116
120123121119121122
120121123123125127
111112110112115117
115114115113124131
139141142144145144
150152154152151147
131130129130134133
126118112106142167
188191192192190173
188193195194196187
107110109114117123
127131134133131130
133134136140141151
155155156148143141
959694939396
939198989796
9899
100100103106
106107111114114114
I Preliminary.
NOTE.—Prior to 1947, detail not available.
Source: Board of Governors of the Federal Reserve System.
195
Digitized for FRASER http://fraser.stlouisfed.org/ Federal Reserve Bank of St. Louis
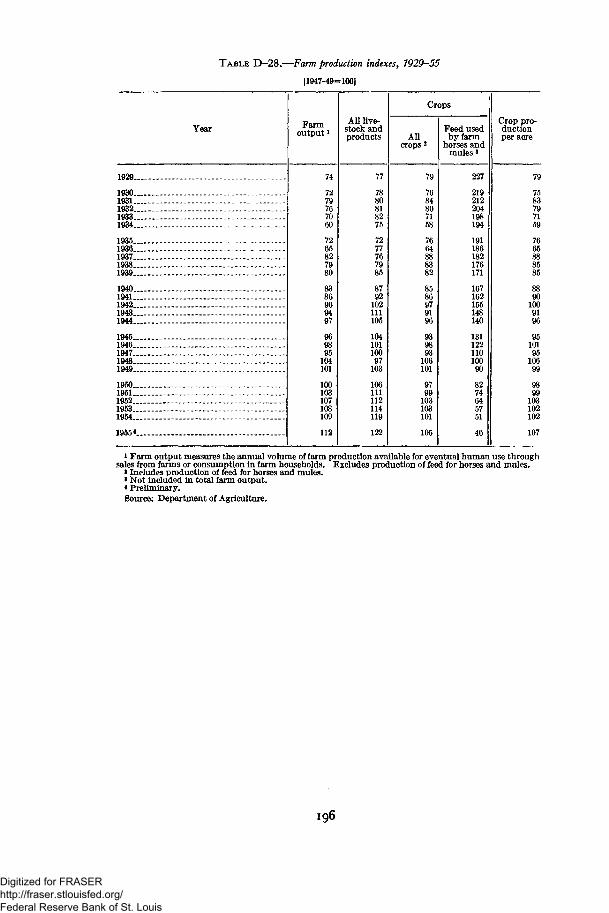
TABLE D-28.—Farm production indexes, 1929-55
[1947-49=100]
Year
1929
19301931 —193219331934 - - .
19351936 -193719381939
19401941 . . _ _- . .194219431944 - - -
1945 -.19461947 _19481949 .
19501951 .-195219531954
1955*
Farmoutputl
74
7279767060
7265827980
8386969497
969895104101
100103107108109
112
All live-stock andproducts
77
7880818275
7277767985
8792102111105
10410110097103
106111112114119
122
Crops
Allcrops2
79
7684807158
7664888382
8586979196
939893106101
9799103103101
105
Feed usedby farm
horses andmules 3
227
219212204198194
191186182176171
167162155148140
13112211010090
8274645751
46
Crop pro-ductionper acre
79
7583797159
7665888585
88901009196
951019510699
9899103102102
107
1 Farm output measures the annual volume of farm production available for eventual human use throughsales from farms or consumption in farm households. Excludes production of feed for horses and mules.
2 Includes production of feed for horses and mules.» Not included in total farm output.* Preliminary.Source: Department of Agriculture.
196
Digitized for FRASER http://fraser.stlouisfed.org/ Federal Reserve Bank of St. Louis
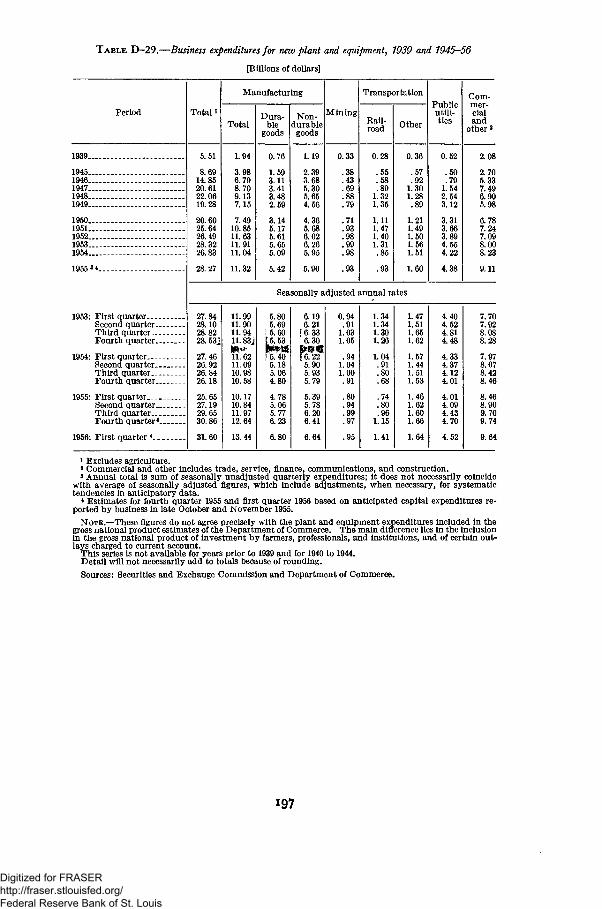
TABLE D-29.—Business expenditures for new plant and equipment, 1939 and 1945-56
[Billions of dollars]
Period
1939.
1945.1946.1947.1948.1949.
1950.1951.1952.1953.1954.
1955
1953: First quarter...Second quarter.Third quarter..Fourth quarter.
1954: First quarter..-Second quarter.Third quarter..Fourth quarter.
1955: First quarter...Second quarter.Third quarter..Fourth quarter'
1956: First quarter *.
Total i
14.8520.6122.0619.28
20.6025.6426.4928.3226.83
28.27
Manufacturing
Total
1.94
6.798.709.137.15
7.4910.8511.6311.9111.04
11.32
Dura-ble
Non-durable
0.76
1.593.113.413.482.59
3.145.175.615.655.09
5.42
Mining
1.19
2.393.685.305.654.56
4.365.686.026.265.95
5.90
0.33
.38
.79
.99
Transportation
Rail-road
0.28
.55
.58
.891.321.35
1.111.471.401.31.85
Other
0.36
.57
.921.301.28
1.211.491.501.561.51
1.60
Publicutili-ties
0.52
.50
.791.542.543.12
3.313.663.894.554.22
4.38
Com-mer-cialand
other3
2.08
2.705.337.496.905.98
6.787.247.098.008.23
9.11
Seasonally adjusted annual rates
27.8428.1028.8228. 53 j
27.4626.9226.8426.18
25.6527.1929.6530.86
31.60
11.9911.9011.9411.83j
ta*11.6211.0910.9810.58
10.1710.8411.9712.64
13.44
5.805.69
^ 5.60[5.53
15.405.185.064.80
4.785.065.776.23
6.80
6.196.21
f6.336.30
mm16.225.905.935.79
5.395.786.206.41
6.64
0.94.91
1.031.05
.941.041.00.91
.80
.94
.99
.97
.95
1.341.341.301.26
1.04.91.80.68
.74
.80
.961.15
1.41
]
L. 47L. 51L. 65L. 62
L.57L.44L. 51L. 53
L. 46L.62L.60L.66
L. 64
4.404.524.814.48
4.334.374.124.01
4.014.094.434.70
4.52
7.707.928.088.28
7.978.078.428.46
8.468.909.709.74
9.64
1 Excludes agriculture.2 Commercial and other includes trade, service, finance, communications, and construction.3 Annual total is sum of seasonally unadjusted quarterly expenditures; it does not necessarily coincide
with average of seasonally adjusted figures, which include adjustments, when necessary, for systematictendencies in anticipatory data.
* Estimates for fourth quarter 1955 and first quarter 1956 based on anticipated capital expenditures re-ported by business in late October and November 1955.
NOTE.—These figures do not agree precisely with the plant and equipment expenditures included in thegross national product estimates of the Department of Commerce. The main difference lies in the inclusionin the gross national product of investment by farmers, professionals, and institutions, and of certain out-lays charged to current account.
This series is_-ies is not available for years prior to 1939 and for 1940 to 1944.Detail will not necessarily add to totals because of rounding.Sources: Securities and Exchange Commission and Department of Commerce.
197
Digitized for FRASER http://fraser.stlouisfed.org/ Federal Reserve Bank of St. Louis
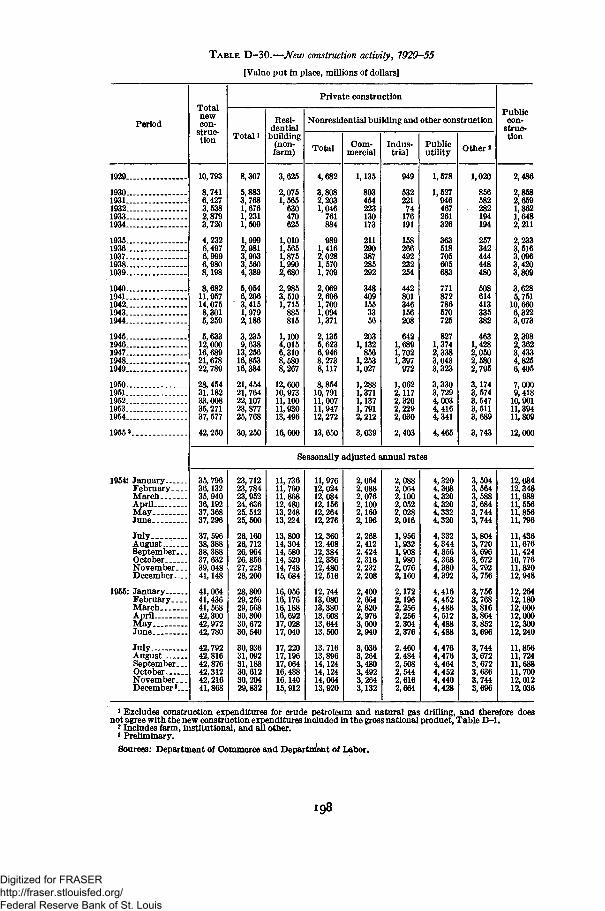
TABLE D-30.—New construction activity, 1929-55
[Value put in place, millions of dollars]
Period
1929
19301931193219331934
19351936193719381939
19401941194219431944
19451946194719481949
1950195119521953 .1954
19558
1954: January.FebruaryMarchAprilMayJune
JulyAugust.September. . .OctoberNovember. . .December
1955: JanuaryFebruaryMarchAprilMayJune
July. .AugustSeptember...October _November.. _December8 . . .
Totalnewcon-
struc-tion
10,793
8,7416,4273,5382,8793,720
4,2326,4976,9996,9808,198
8,68211,95714,0758,3015,259
5,63312,00016,68921,67822,789
28,45431,18233,00835,27137, 577
42,250
Private construction
Total i
8,307
5,8833,7681,6761,2311,509
1,9992,9813,9033,5604,389
5,0546,2063,4151,9792,186
3,2359,638
13,25616,85316,384
21, 45421, 76422,10723, 87725,768
30,250
Kesi-dential
building(non-farm)
3,625
2,0751,565
630470625
1,0101,5651,8751,9902,680
2,9853,5101,715
885815
1,1004,0156,3108,5808,267
12, 60010,97311,10011,93013, 496
16,600
Nonresidential building and other construction
Total
4,682
3,8082,2031,046
761884
9891,4162,0281,5701,709
2,0692,6961,7001,0941,371
2,1355,6236,9468,2738,117
8,85410, 79111,00711,94712,272
13, 650
Com-mercial
1,135
893454223130173
211290387285292
3484091553356
2031,132
8561,2531,027
1,2881,3711,1371,7912,212
3,039
Indus-trial
949
53222174
176191
158266492232254
442801346156208
6421,6891,7021,397
972
1,0622,1172,3202,2292,030
2,403
Publicutility
1,578
1,527946467261326
363518705605683
771872786570725
8271,3742,3383,0433,323
3,3303,7294,0034,4164,341
4,465
Other a
1,020
856582282194194
257342444448480
508614413335382
4631,4282,0502,5802,795
3,1743,5743,5473,5113,689
3,743
Publiccon-
struc-tion
2,486
2,8582,6591,8621,6482,211
2,2333,5163,0963,4203,809
3,6285,751
10,6606,3223,073
2,3982 3623,4334,8256,405
7,0009,418
10,90111,39411,809
12,000
Seasonally adjusted annual rates
35,79636,13235, 94036,19237,36837,296
37, 59638,38838,38837, 63239, 04841,148
41,06441,43641, 56842,30042,97242,780
42,79242,81642, 87642,31242,21641,868
23,71223, 78423, 95224,63625, 51225, 500
26,16026, 71226,96426, 85627, 22828, 200
28,80029,25629,56830,30030,67230,540
30,93631,09231,18830,61230,20429,832
11,73611, 76011,86812,48013,24813, 224
13,80014,30414,58014, 52014, 74815,684
16,05616,17616,18816,69217,02817,040
17,22017,19617,06416,48816,14015,912
11,97612, 02412, 08412,15612, 26412,276
12,36012, 40812,38412,33612, 48012, 516
12, 74413,08013,38013,60813,64413,500
13,71613,89614,12414,12414,06413,920
2,0642,0882,0762,1002,1602,196
2,2682,4122,4242,3162,2322,208
2,4002,6642,8202,9763,0002,940
3,0363,2643,4803,4923,2643,132
2,0882,0642,1002,0522,0282,016
1,9561,9321,9081,9802,0762,160
2,1722,1962,2562,2562,3042,376
2,4602,4842,5082,5442,6162,664
4,3204,3084,3204,3204,3324,320
4,3324,3444,3564,3684,3804,392
4,4164,4524,4884,5124,4884,488
4,4764,4764,4644,4524,4404,428
3,5043,5643,5883,6843,7443,744
3,8043,7203,6963,6723,7923,756
3,7563,7683,8163,8643,8523,696
3,7443,6723,6723,6363,7443,696
12,08412,34811,98811, 55611,85611, 796
11,43611, 67611, 42410, 77611, 82012, 948
12,26412,18012,00012,00012,30012,240
11,85611,72411,68811,70012,01212,036
»Excludes construction expenditures for crude petroleum and natural gas drilling, and therefore doesnot agree with the new construction expenditures included in the gross national product, Table D- l .
2 Includes farm, institutional, and all other.* Preliminary.
Sources: Department of Commerce and Department of Labor.
198
Digitized for FRASER http://fraser.stlouisfed.org/ Federal Reserve Bank of St. Louis
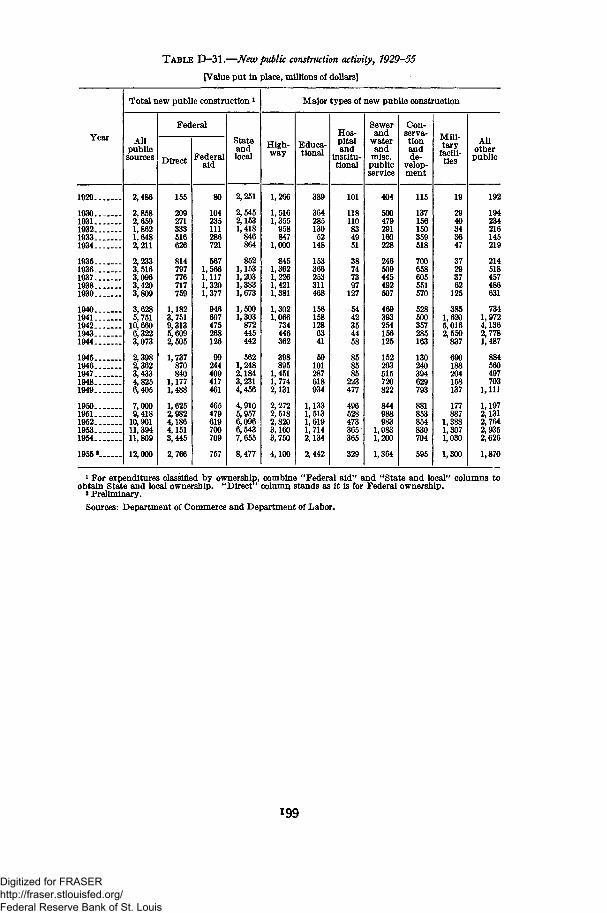
TABLE D-31.—New public construction activity, 1929-55
[Value put in place, millions of dollars]
Year
1929
19301931193219331934
19351936193719381939
19401941194219431944
19451946194719481949
19501951195219531954
1955 *
Total new public construction *
Allpublicsources
2,486
2,8582,6591,8621,6482,211
2,2333,5163,0963,4203,809
3,6285,751
10,6606,3223,073
2,3982,3623,4334,8256,405
7,0009,418
10,90111,39411,809
12,000
Federal
Direct
155
209271333516626
814797776717759
1,1823,7519,3135,6092,505
1,737870840
1,1771,488
1,6252,9824,1864,1513,445
2,766
Federalaid
80
104235111286721
5671,5661,1171,3201,377
946697475268126
99244409417461
465479619700709
757
Stateandlocal
2,251
2,5452,1531,418
846864
8521,1531,2031,3831,673
1,5001,303
872445442
5621,2482,1843,2314,456
4,9105,9576,0966,5437,655
8,477
Major types of new public construction
High-way
1,266
1,5161,355
958847
1,000
8451,3621,2261,4211,381
1,3021,066
734446362
398895
1,4511,7742,131
2,2722,5182,8203,1603,750
4,100
Educa-tional
389
36428513052
148
153366253311468
1561581286341
59101287618934
1,1331,5131,6191,7142,134
2,442
Hos-pitaland
institu-tional
101
118110834951
38747397
127
5442354458
858585
223477
496528473365365
329
Sewerand
waterand
misc.publicservice
404
500479291160228
246509445492507
469393254156125
152293515720822
844988983
1,0831,200
1,364
Con-serva-tionandde-
velop-ment
115
137156150359518
700658605551570
528500357285163
130240394629793
881853854830704
595
Mili-tary
facili-ties
19
2940343647
37293762
125
3851,6205,0162,550
837
690188204158137
177887
1,3881,3071,030
1,300
Allotherpublic
192
194234216145219
214518457486631
7341,9724,1362,7781,487
884560497703
1,111
1,1972,1312,7642,9352,626
1,870
1 For expenditures classified by ownership, combine "Federal aid" and "State and local" columns toobtain State and local ownership. "Direct" column stands as it is for Federal ownership.
3 Preliminary.
Sources: Department of Commerce and Department of Labor.
199
Digitized for FRASER http://fraser.stlouisfed.org/ Federal Reserve Bank of St. Louis
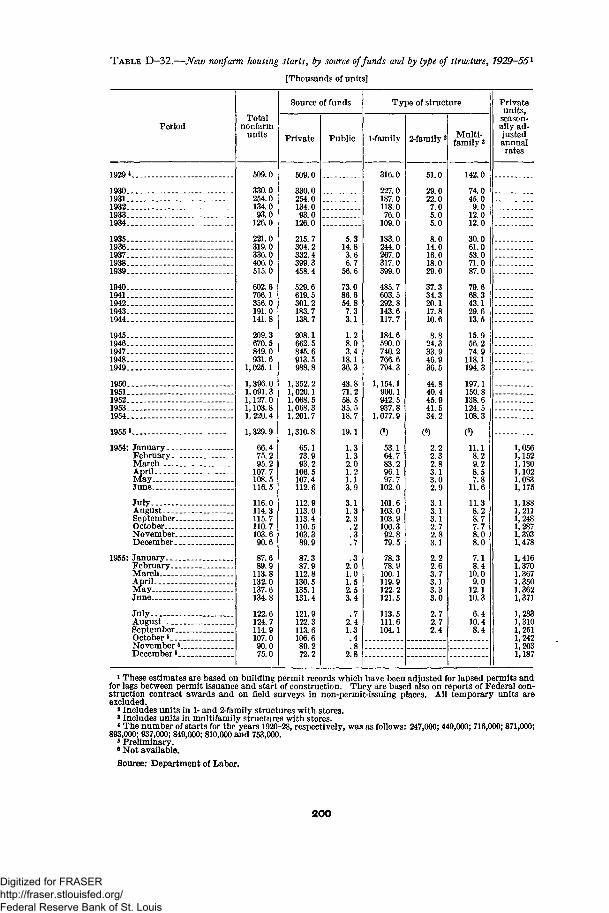
TABLE D-32.—New nonfarm housing starts, by source ojfunds and by type of structure, 1929-55l
[Thousands of units]
PeriodTotal
nonfarmunits
Source of funds
Private Public
Type of structure
1-family 2-family 2 Multi-family 3
Privateunits,
season-ally ad-justedannualrates
1929 «____
193019311932.-19331934 _
19351936193719381939
19401941194219431944
19451946194719481949 -
19501951195219531954
1955«
1954: JanuaryFebruary...March.AprilMay...June
JulyAugustSeptember..OctoberNovember..December-_
1955: JanuaryFebruary. _.MarchAprilMayJune
JulyAugustSeptember..October 5__.November8.December«_
509.0
330.0254.0134.093.0
126.0
221.0319.0336.0406.0515.0
602.6706.1356.0191.0141.8
209.3670.5849.0931.6
1,025.1
1,396. 01, 091.31,127.01,103.81,220.4
1,329.9
66.475.295.2
107.7108.5116.5
116.0114.3115.7110.7103.690.6
87.689.9
113.8132.0137.6134.8
122.6124.7114.9107.090.075.0
509.0
330.0254.0134.093.0
126.0
215.7304.2332.4399.3458.4
529.6619.5301.2183.7138.7
208.1662.5845.6913.5
1,352. 21, 020.11,068. 51,068.31, 201.7
1,310.8
65.173.993.2
106.5107.4112.6
112.9113.0113.4110.5103.3
87.387.9
112.8130.5135.1131.4
121.9122.3113.6106.689.272.2
5.314.83.66.7
56.6
73.086.654.87.33.1
1.28.03.4
18.136.3
43.871.258.535.518.7
19.1
1.31.32.01.21.13.9
3.11.32.3.2.3.7
.32.01.01.52.53.4
.72.41.3.4.8
2.8
316.0
227.0187.0118.076.0
109.0
183.0244.0267.0317.0399.0
485.7603.5292.8143.6117.7
184.6590.0740.2766.6794.3
1,154.1900.1942.5937.8
1,077.9
53.164.783.296.197.7
102.0
101.6103.0103.9100.392.879.5
78.378.9
100.1119.9122.2121.5
113.5111.6104.1
51.0
29.022.07.05.05.0
8.014.016.018.029.0
37.334.320.117.810.6
24.333.946.936.5
44.840.445.941.534.2
2.22.32.83.13.02.9
3.13.13.12.72.83.1
2.22.63.73.13.33.0
2.72.72.4
142.0
74.045.09.0
12.012.0
30.061.053.071.087.0
79.668.343.129.613.5
15.956.274.9
118.1194.3
197.1150.8138.6124.5108.3
11.18.29.28.57.8
11.6
11.38.28.77.78.08.0
7.18.4
10.09.0
12.110.3
6.410.48.4
1,0561,1521,1301,1021,0831,175
1,1881,2111,2481,2871,3931,478
1,4161,3701,3671,3501,3621,371
1,2831,3101,2511,2421,2031,187
1 These estimates are based on building permit records which have been adjusted for lapsed permits andfor lags between permit issuance and start of construction. They are based also on reports of Federal con-struction contract awards and on field surveys in non-permit-issuing places. All temporary units areexcluded.
2 Includes units in 1- and 2-family structures with stores.»Includes units in multifamily structures with stores.* The number of starts for the years 1920-28, respectively, was as follows: 247,000; 449,000; 716,000; 871,000;
893,000; 937,000; 849,000; 810,000 and 753,000.8 Preliminary.8 Not available.
Source: Department of Labor.
200
Digitized for FRASER http://fraser.stlouisfed.org/ Federal Reserve Bank of St. Louis

TABLE D-33.—Private nonfarm housing starts and proposed home construction: Governmentunderwritten, 1935-55
[Thousands of units]
Period
Private nonfarm housing starts
TotalGovernment underwritten
Total FHA V A i
Proposedhome construction
FHAapplica-tions 2
VAappraisalrequests
19351936193719381939 -.
1940194119421943.1944
19451946194719481949
1950 _1951195219531954
19558 -
1954: JanuaryFebruary. _.MarchAprilMayJune
JulyAugustSeptember..OctoberNovember..December...
1955: JanuaryFebruary...MarchAprilMayJune
JulyAugustSeptember-OctoberNovember..December6.
215.7304.2332.4399.3458.4
529.6619.5301.2183.7138.7
208.1662.5845.6913.5
1, 352. 21, 020.11, 068. 51, 068.31, 201. 7
1,310.8
65.173.993.2
106.5107.4112.6
112.9113.0113.4110.5103.3
87.387.9
112.8130.5135.1131.4
121.9122.3113.6
6 106.66 89.2
72.2
14.049.460.0
118.7158.1
180.1220.4165.7146.293.3
686.7412.2421.2408.6583.3
V668.5
24.730.536.443.649.055.6
52.260.359.858.262.450.7
46.145.353.660.365.971.6
63.367.658.053.445.637.8
14.049.460.0
118.7158.1
180.1220.4165.7146.293.3
41.269.0
229.0294.1363.8
486.7263.5279.9252.0276.3
276.7
13.216.320.523.824.027.7
25.427.025.924.726.321.5
20.017.223.825.828.032.1
26.026.924.718.617.516.2
5 200.0148.7141.3156.6307.0
11.614.215.919.825.027.9
26.833.333.933.536.029.1
26.128.029.934.537.839.5
37.440.833.334.828.121.6
3 20.647.849.8
131.1179.8
231.2288.5238.5144.462.9
56.6121.7286.4293.2327.0
397.7192.8267.9253.7
306.2
15.020.028.132.330.335.2
30.132.234.829.326.924.3
25.628.335.633.130.130.8
24.326.423.119.216.313.4
()164.4226.3251.4535.4
620.8
20.134.436.542.952.252.7
52.355.451.345.647.744.3
46.264.271.965.969.352.4
51.456.045.143.130.424.9
1 Data since June 1950 are based on VA first compliance inspection; prior data are estimates of units startedwhich resulted in VA-guaranteed first mortgage loans.2 Units in mortgage applications for new-home construction.
s FHA program approved in June 1934; all 1934 activity included in 1935.* Not available.6 Partly estimated.6 Preliminary.Sources: Department of Labor, Federal Housing Administration (FHA), and Veterans Administra-
tion (VA).
2OI
Digitized for FRASER http://fraser.stlouisfed.org/ Federal Reserve Bank of St. Louis
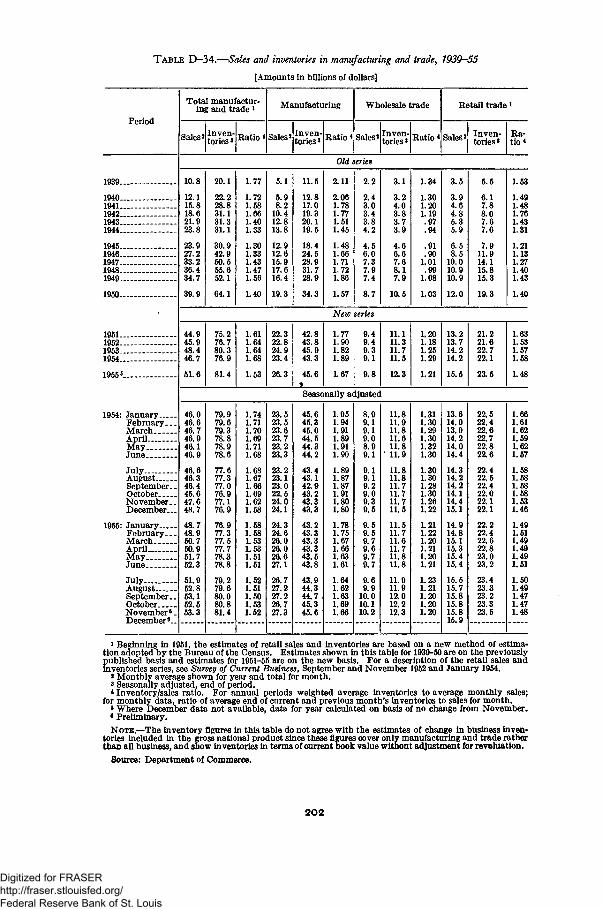
T A B L E D—34.—Sales and inventories in manufacturing and trade, 7939—55
[Amounts in billions of dollars]
Period
Total manufactur-ing and trade l
Sales 2 Inven-tories 3 Ratio *
Manufacturing
Sales* Inven-tories 3 Ratio
Wholesale trade
Sales 2Inven-tories 3 Ratio < Sales 2
Retail trade»
Inven-tories'
Ra-tio*
Old series
1939.
19401941.194219431944.
1945.1946.1947.1948.1949.
1950.
1951..1952..1953..1954..
19555.
1964: JanuaryFebruary...MarchAprilMayJune
July..AugustSeptember..OctoberNovember..December...
1955: JanuaryFebruary...MarchAprilMayJune
JulyAugustSeptember..OctoberNovember6.December6..
10.8
12.115.818.621.923.8
23.927.233.236.434.7
39.9
20.1
22.228.831.131.331.1
30.942.950.555.652.1
64.1
1.77
1.721.581.661.401.33
1.301.331.431.471.56
1.40
5.1
5.98.2
10.412.813.8
12.912.615.917.616.4
19.3
11.5
12.817.019.320.119.5
18.424.528.931.728.9
34.3
2.11
2.061.78L.77L.51L.45
L.48L.66L.71L.721.86
L.57
2.2
2.43.03.43.84.2
4.56.07.37.97.4
8.7
3.1
3.24.03.83.73.9
4.66.67.68.17.9
10.5
1.34
1.301.201.19.97.94
.91
.901.01
.991.08
1.03
3.5
3.94.64.85.35.9
6.58.5
10.010.910.9
12.0
5.5
6.17.88.07.67.6
7.911.914.115.815.3
19.3
44.945.948.446.7
51.6
46.046.646.746.946.146.9
46.646.346.445.647.648.7
48.748.950.750.951.752.3
51.952.853.152.553.3
New series
Seasonally adjusted
79.979.679.378.878.978.6
77.677.377.076.977.176.9
76.977.377.577.778.378.8
79.279.680.080.881.4
1.741.71.70.69.71
.67
.58
.531.631.511.51
1.521.511.501.531.52
23.523.523.623.723.223.3
23.223.123.022.524.024.1
24.324.626.026.026.627.1
26.727.227.226.727.3
45.645.345.044.544.344.2
43.443.142.943.243.343.3
43.243.343.343.343.543.8
43.944.344.745.345.6
.95
.94
.91
.89
.91
.90
.89
.87
.87
.91
.80
.80
.78
.75
.67
.661.631.61
1.641.621.631.691.66
8.99.19.19.08.99.1
9.19.19.29.09.39.5
9.59.59.79.69.79.7
9.69.9
10.010.110.2
11.811.911.811.611.811.9
11.811.811.711.711.711.5
11.511.711.611.711.811.8
11.911.912.012.212.3
1.311.301.291.30
.32
.30
.30
.30
.28
.30
.26
.22
.21
.22
.20
.211.201.21
1.231.211.201.201.20
13.614.013.914.214.014.4
14.314.214.214.114.415.1
14.914.815.115.315.415.4
15.515.715.815.815.815.9
22.522.422.622.722.822.6
22.422.522.422. Q22.122.1
22.222.422.622.823.023.2
23.423.323.223.323.5
1.63
1.491.481.761.431.31
1.211.131.271.401.43
1.40
75.276.780.376.9
81.4
1.611.641.641.68
1.53
22.322.824.923.4
26.3
42.843.845.943.3
45.6*
1.771.901.821.89
1.67
9.49.49.39.1
9.8
11.111.311.711.5
12.3
1,201.181.251.29
1.21
13.213.714.214.2
15.5
21.221.622.722.1
23.5
1.631.531.571.58
1.48
1.661.611.621.591.621.57
1.581.581.681.581.531.46
1.491.511.491.491.491.51
1.501.491.471.471.48
i Beginning in 1951, the estimates of retail sales and inventories are based on a new method of estima-tion adopted by the Bureau of the Census. Estimates shown in this table for 1939-50 are on the previouslypublished basis and estimates for 1951-55 are on the new basis. For a description of the retail sales andinventories series, see Survey of Current Business, September and November 1952 and January 1954.
* Monthly average shown for year and total for month,s Seasonally adjusted, end of period.< Inventory/sales ratio. For annual periods weighted average inventories to average monthly sales;
for monthly data, ratio of average end of current and previous month's inventories to sales for month.«Where December data not available, data for year calculated on basis of no change from November.• Preliminary.
NOTE.—The inventory figures in this table do not agree with the estimates of change in business inven-tories included in the gross national product since these figures cover only manufacturing and trade ratherthan all business, and show inventories in terms of current book value without adjustment for revaluation.
Source: Department of Commerce.
202
Digitized for FRASER http://fraser.stlouisfed.org/ Federal Reserve Bank of St. Louis
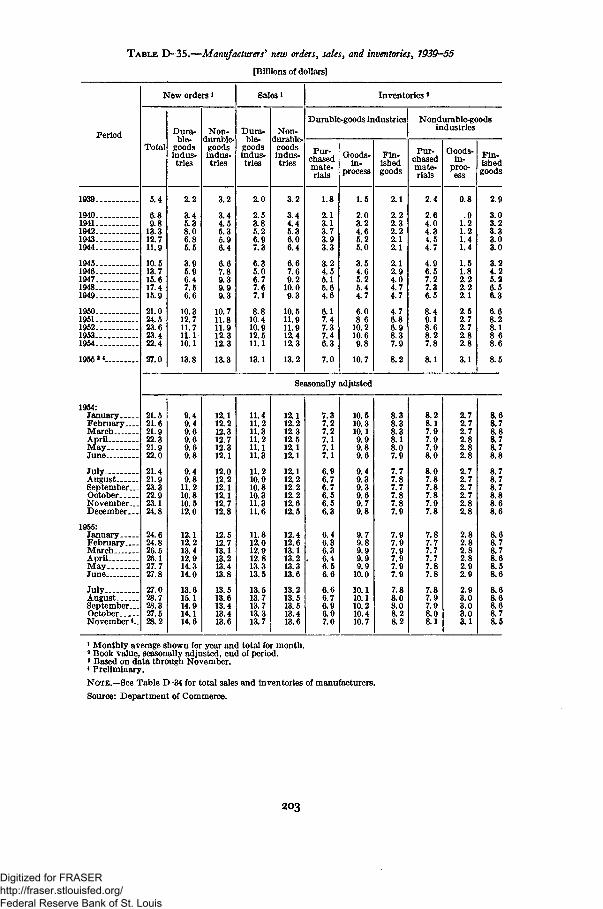
TABLE D-35.—Manufacturers* new orders, sales, and inventories, 1939-55
[Billions of dollars]
Period
1940.1941.1942.1943.1944.
1945.1946.1947.1948.1949.
1950.1951.1952.1953-1954.
1955»
1954:JanuaryFebruary—MarchAprilMayJune
JulyAugustSeptember..OctoberNovember..December...
1955:JanuaryFebruary-MarchAprilMayJune
July..AugustSeptember. _OctoberNovember«.
New orders *
Total
5.4
6.89.8
13.312.711.9
10.513.715.617.415.9
21.024.523.623.422.4
27.0
Dura-ble-
goodsindus-tries
2.2
3.45.38.06.85.5
3.95.96.47.56.6
10.312.711.711.110.1
13.8
Non-durable-goodsindus-tries
3.2
3.44.55.35.96.4
6.67.89.39.99.3
10.711.811.912.312.3
13.3
Sales »
Dura-ble-
goodsindus-tries
2.0
2.53.85.26.97.3
6.35.06.77.67.1
8.810.410.912.511.1
13.1
Non-durable-
goodsindus-tries
3.2
3.44.45.36.06.4
6.67.69.2
10.09.3
10.511.911.912.412.3
13.2
Inventoriesa
Durable-goods industries
Pur-chasedmate-rials
1.8
2.13.13.73.93.3
3.24.55.15.64.6
6.17.47.37.46.3
7.0
Qoods-in-
process
1.5
2.03.24.65.25.0
3.54.65.25.44.7
6.086
10.210.69.8
10.7
Fin-ishedgoods
2.1
2.22.32.22.12.1
2.12.94.04.74.7
4.76.86.98.37.9
8.2
Nondurable-goodsindustries
Pur-chasedmate-rials
2.4
2.64.04.34.54.7
4.96.57.27.36.5
8.49.18.68.27.8
8.1
Goods-in-
proc-ess
0.8
1.21.21.41.4
1.51.82.22.22.1
2.52.72.72.82.8
3.1
Seasonally adjusted
Fin-ishedgoods
21.521.621.922.321.922.0
21.421.923.322.923.124.8
24.624.826.526.127.727.8
27.028.728.327.528.2
9.49.49.69.69.69.8
9.49.8
11.210.810.512.0
12.112.213.412.914.314.0
13.615.114.914.114.6
12.112.212.312.712.312.1
12.012.212.112.112.712.8
12.512.713.113.213.413.8
13.513.613.413.413.6
11.411.211.311.211.111.3
11.210.910.810.311.311.6
11.812.012.912.813.313.5
13.513.713.713.313.7
12.112.212.312.512.112.1
12.112.212.212.212.612.5
12.412.613.113.213.313.6
13.213.513.513.413.6
7.37.27.27.17.17.1
6.96.76.76.56.56.3
6.46.36.3
. 6.46.56.6
6.66.76.96.97.0
10.510.310.19.99.89.6
9.49.39.39.69.79.8
9.79.89.99.99.9
10.0
10.110.110.210.410.7
8.38.38.38.18.07.9
7.77.87.77.87.87.9
7.97.97.97.97.97.9
7.88.08.08.28.2
8.28.17.97.97.98.0
8.07.87.87.87.97.8
7.87.77.77.77.87.8
7.87.97.98.08.1
2.72.72.72.82.82.8
2.72.72.72.72.82.8
2.82.82.82.82.92.9
2.93.03.03.03.1
2.9
3.03.23.33.03.0
3.24.25.26.56.3
6.68.28.18 686
8.5
8.68.78.88.78.78.8
8.78.78.78.88.68.6
8.68.78.78.68.58.6
8.68.68.68.78.5
1 Monthly average shown for year and total for month.2 Book value, seasonally adjusted, end of period.3 Based on data through November.4 Preliminary.
NOTE.—See Table D-34 for total sales and inventories of manufacturers.
Source: Department of Commerce.
2O3
Digitized for FRASER http://fraser.stlouisfed.org/ Federal Reserve Bank of St. Louis
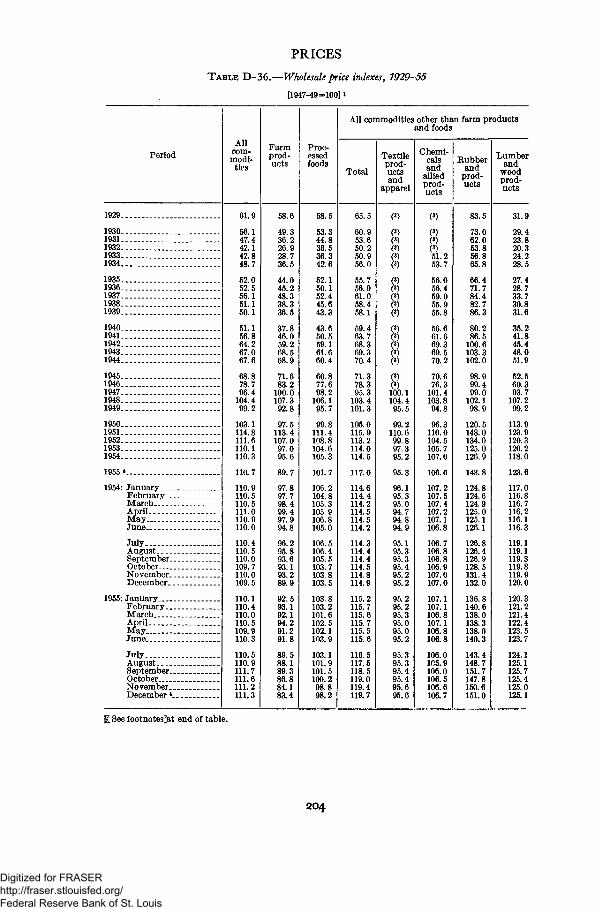
PRICES
TABLE D-36.—Wholesale price indexes, 1929-55
[1947-49=100] 1
PeriodAll
com-modi-ties
Farmprod-ucts
Proc-essedfoods
All commodities other than farm productsand foods
Total
Textileprod-uctsand
apparel
Chemi-calsand
alliedprod-ucts
Rubberand
prod-ucts
Lumberand
woodprod-ucts
1929
19301931193219331934
19351936193719381939
19401941... ___194219431944
19451946194719481949
19501951195219531954
1955 «
1954: January. __February..MarchAprilMayJune
JulyAugustSeptember-October....November.December.
1955: JanuaryFebruary. .MarchAprilMayJune
JulyAugustSeptember.October....November.December4.
61.9
56.147.442.142.848.7
52.052.556.151.150.1
51.156.864.267.067.6
68.878.796.4
104.499.2
103.1114.8111.6110.1110.3
110.7
110.9110.5110.5111.0110.9110.0
110.4110.5110.0109.7110.0109.5
110.1110.4110.0110.5109.9110.3
110. 5110.9111.7111.6111.2111.3
58.6
49.336.226.928.736.5
44.045.2
36.5
37.846.059.268.568.9
71.683.2
100.0107.392.8
97.5113.4107.097.095.6
89.7
97.897.798.499.497.994.8
96.295.893.693.193.2
92.593.192.194.291.291.8
89.588.189.386.884.183.4
58.5
53.344.836.536.342.6
52.150.152.445.643.3
43.650.559.161.660.4
60.877.698.2
106.195.7
99.8111.4108.8104.6105.3
101.7
106.2104.8105.3105.9106.8105.0
106.5106.4105.5103.7103.8103.5
103.8103.2101.6102.5102.1103.9
103.1101.9101.5100.298.898.2
65.5
60.953.650.250.956.0
55.756.961.058.458.1
59.463.768.369.370.4
71.378.395.3
103.4101.3
105.0115.9113.2114.0114.5
117.0
114.6114.4114.2114.5114.5114.2
114.3114.4114.4114.5114.8114.9
115.2115.7115.6115.7115.5115.6
116.5117.5118.5119.0119.4119.7
()100.1104.495.5
99.2110.699.897.395.2
95.3
96.195.395.094.794.894.9
95.195.395.395.495.295.2
95.295.295.395.095.095.2
95.395.395.495.495.695.6
()51.253.7
56.056.459.055.955.8
56.661.669.369.570.2
70.676.3
101.4103.894.8
110.0104.5105.7107.0
106.6
107.2107.5107.4107.2107.1106.8
106.7106.8106.8106.9107.0107.0
107.1107.1106.8107.1106.8106.8
106.0105.9106.0106.5106.6106.7
83.5
73.062.053.856.865.8
66.471.784.482.786.3
80.286.5
100.6103.3102.0
99.499.0
102.1
120.5148.0134.0125.0126.9
143.8
124.8124.6124.9125.0125.1126.1
126.8126.4126.9128.5131.4132.0
136.8140.6138.0138.3138.0140.3
143.4148.7151.7147.8150.6151.0
31.9
29.423.820.324.228.5
27.428.733.730.831.6
35.241.845.448.051.9
52.560.393.7
107.299.2
113.9123.9120.3120.2118.0
123.6
117.0116.8116.7116.2116.1116.3
119.1119.1119.3119.8119.9120.0
120.3121.2121.4122.4123.5123.7
124.1125.1125.7125.4125.0125.1
1 See footnotes'at end of table.
204
Digitized for FRASER http://fraser.stlouisfed.org/ Federal Reserve Bank of St. Louis
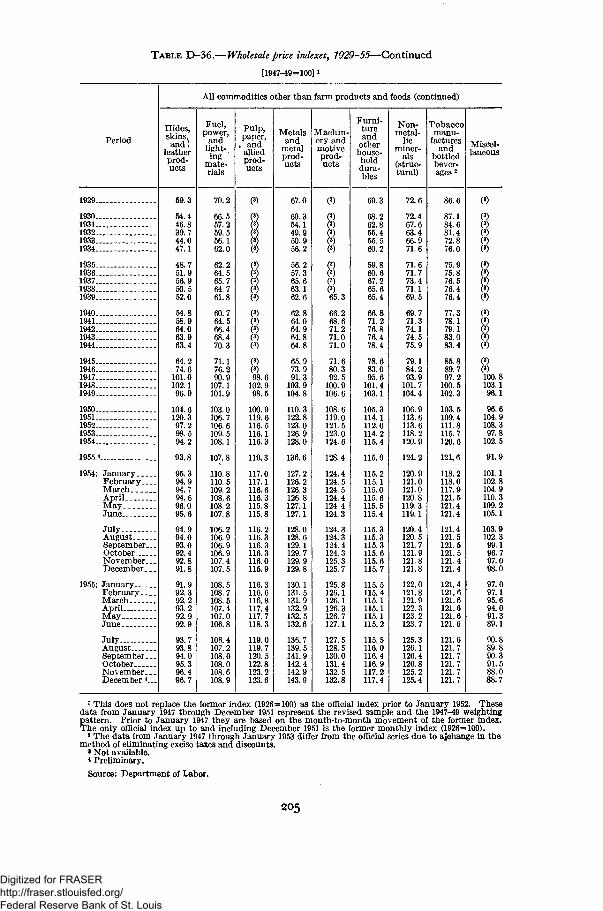
TABLE D-36.-—Wholesale price indexes, 1929-55— Continued
[1947-49=100] i
Period
All commodities other than farm products and foods (continued)
Hides,skins,and!
leatherprod-ucts
Fuel,power,
andlight-ing
mate-rials
Pulp,paper,v andalliedprod-ucts
Metalsand
metalprod-ucts
Machin-ery andmotiveprod-ucts
Furni-tureand
otherhouse-holddura-bles
Non-metal-
licminer-
als(struc-tural)
Tobaccomanu-
facturesand
bottledbever-
Miscel-laneous
1929
19301931193219331934
19351936193719381939
1940194119421943....1944
1945 „1946194719481949
1950 ._.195119521953..__1954
1955*
1954: JanuaryFebruary..MarchAprilMayJune
JulyAugustSeptember.OctoberNovember.December..
1955: JanuaryFebruary. _.MarchAprilMayJune
JulyAugustSeptember.OctoberNovember..December4-
59.3
54.446.839.744.047.1
48.751.956.950.552.0
54.858.964.063.963.4
64.274.6
101.0102.196.9
104.6120.397.298.594.2
93.8
95.394.994.794.696.0
94.994.093.092.492.891.8
91.992.392.293.292.992.9
93.793.894.095.396.496.7
70.2
66.557.259.556.162.0
62.264.565.764.761.8
60.764.566.468.470.3
71.176.290.9
107.1101.9
103.0106.7106.6109.5108.1
107.8
110.8110.5109.2108.6108.2107.8
106.2106.9106.9106.9107.4107.5
108.5108.7108.5107.4107.0106.8
106.4107.2108.0108.0108.6108.9
()98.6
102.998.5
100.9119.6116.5116.1116.3
119.3
117.0117.1116.6116.3115.8115.8
116.2116. 3116.3116.3116.0115.9
116.3116.6116.8117.4117.7118.3
119.0119.7120.5122.8123.2123.6
67.0
60.354.149.950.956.2
56.257.365.663.162.6
62.864.064.964.864.8
65.973.991.3
103.9104.8
110.3122.8123.0126.9128.0
136.6
127.2126.2126.3126.8127.1127.1
128.0128.6129.1129.7129.9129.8
130.1131.5131.9132.9132.5132.6
136.7139.5141.9142.4142.9143.9
()65.3
66.268.671.271.071.0
71.680.392.5
100.9106.6
108.6119.0121.5123.0124.6
128.4
124.4124.5124.5124.4124.4124.3
124.3124.3124.4124.3125. 3125.7
125.8126.1126.1126.3126.7127.1
127.5128.5130.0131.4132.5132.8
69.3
68.262.855.455.560.2
59.860.667.265.665.4
66.871.276.876.478.4
78.683.095.6
101.4103.1
105.3114.1112.0114.2115.4
115.9
115.2115.1115.0115.6115.5115.4
115.3115.3115.3115.6115.6115.7
115.5115.4115.1115.1115.1115.2
115.5116.0116.4116.9117.2117.4
72.6
72.467.663.466.971.6
71.671.773.471.169.5
69.771.374.174.575.9
79.184.293.9
101.7104.4
106.9113.6113.6118.2120.9
124.2
120.9121.0121.0120.8119.3119.1
120.4120.5121.7121.9121.8121.8
122.0121.8121.9122.3123.2123.7
125.3126.1126.4126.8125.2125.4
86.6
87.184.681.472.876.0
75.975.876.576.476.4
77.378.179.183.083.4
85.889.797.2
100.5102.3
103.5109.4111.8115.7120.6
121.6
118.2118.0117.9121.5121.4121.4
121.4121.5121.5121.5121.4121.4
121.4121.6121.6121.6121.6121.6
121.6121.7121.7121.7121.7121.7
()100.8103.196.1
96.6104.9108.397.8
102.5
91.9
101.1102.8104.9110.3109.2105.1
103.9102.399.196.797.098.0
97.097.195.694.091.389.1
90.889.890.391.588.088.7
1 This does not replace the former index (1926=100) as the official index prior to January 1952. Thesedata from January 1947 through December 1951 represent the revised sample and the 1947-49 weightingpattern. Prior to January 1947 they are based on the month-to-month movement of the former index.The only official index up to and including December 1951 is the former monthly index (1926=100).
2 The data from January 1947 through January 1953 differ from the official series due to a|change in themethod of eliminating excise taxes and discounts.
> Not available.4 Preliminary.
Source: Department of Labor.
205
Digitized for FRASER http://fraser.stlouisfed.org/ Federal Reserve Bank of St. Louis
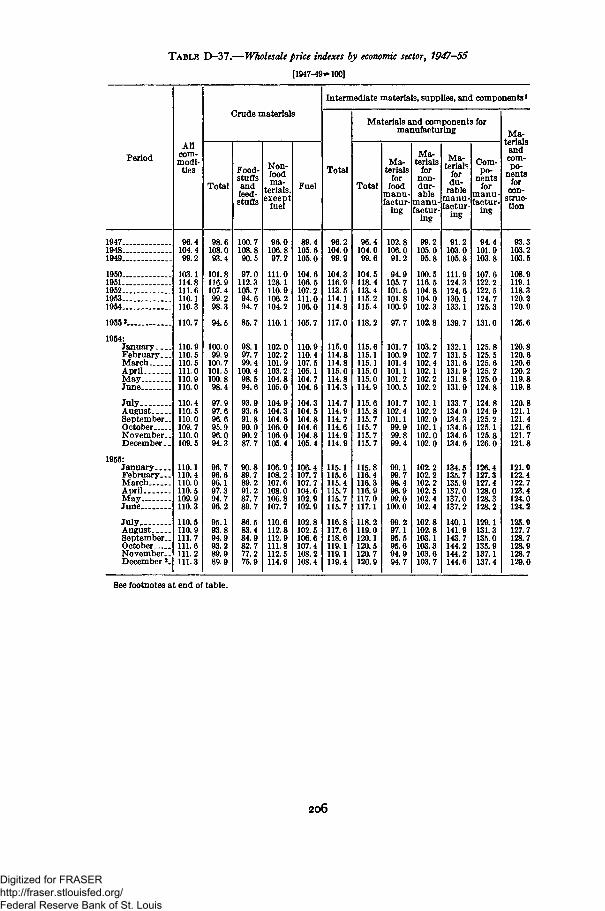
TABLE D-37.—Wholesale price indexes by economic sector, 1947-55
[1947-49-100]
PeriodAll
com-modi-ties
Crude materials
Total
98.6108.093.4
101.8116.9107.499.298.3
94.5
100.099.9
100.7101.5100.898.4
97.997.696.695.996.094.3
96.796.696.197.394.796.2
95.193.894.993.289.989.9
Food-stuffsandfeed-stuffs
100.7108.890.5
97.0112.3105.794.694.7
85.7
98.197.799.4
100.498.594.6
93.993.691.890.090.287.7
90.889.789.291.287.789.7
86.583.484.982.777.275.9
Non-foodma-
terials,except
fuel
96.0106.897.2
111.0128.1110.9106.2104.2
110.1
102.0102.2101.9103.2104.8105.0
104.9104.3104.6106.0106.0105.4
106.9108.2107.6108.0106.8107.7
110.6112.8112.9111.8112.5114.9
Fuel
Intermediate materials, supplies, and components1
Total
Materials and components formanufacturing
Total
Ma-terials
forfood
manu-factur-
ing
Ma-terials
fornon-dur-able
manu-factur-
ing
Ma-terials
fordu-
rablemanu-factur-
ing
Com-po-
nentsfor
manu-factur-
ing
Ma-terialsandcom-po-
nentsfor
con-struc-tion
194719481949
19501951195219531954
1955 »
1954:JanuaryFebruary..MarchAprilMayJune
JulyAugustSeptember-OctoberNovember.December..
1955:JanuaryFebruary. ..MarchAprilMayJune
JulyAugustSeptember..OctoberNovember..December3.
96.4104.499.2
103.1114.8111.6110.1110.3
110.7
110.9110.5110.5111.0110.9110.0
110.4110.5110.0109.7110.0109.5
110.1110.4110.0110.5109.9110.3
110.5110.9111.7111.6111.2111.3
89.4105.6105.0
104.6106.5107.2111.0106.0
105.7
110.9110.4107. 5105.1104.7104.6
104.3104.5104.8104.6104.8105.4
106.4107.7107.7104.6102.9102.9
102.8102.5106.6107.4108.2108.4
96.2104.099.9
104.3116.9113.5114.1114.8
117.0
115.0114.8114.8115.0114.8114.3
114.7114.9114.7114.6114.9114.9
115.1115.6115.4115.7115.7115.7
116.8117.6118.6119.1119.1119.4
96.4104.099.6
104.5118.4113.4115.2115.4
118.2
115.6115.1115.1115.0115.0114.9
115.6115.8115.7115.7115.7115.7
115.8116.4116.3116.9117.0117.1
118.2119.0120.1120.5120.7120.9
102.8106.091.2
94.9105.7101.5101.8100.9
97.7
101.7100.9101.4101.1101.2100.5
101.7102.4101.199.999.899.4
99.199.798.498.999.0
100.0
99.297.195.595.694.994.7
99.2105.095.8
100.5116.5104.8104.0102.3
102.8
103.2102.7102.4102.1102.2102.2
102.1102.2102.0102.1102.0102.0
102.2102.2102.2102.5102.4102.4
102.8102.8103.1103.3103.6103.7
91.2103.0105.8
111.9124.3124.6130.1133.1
139.7
132.1131.5131.6131.9131.8131.9
133.7134.0134.3134.6134.6134.6
134.5135.7135.9137.0137.0137.2
140.1141.9143.7144.2144.2144.6
94.4101.9103.8
107.6122.2122.5124.7125.3
131.0
125.8125.5125.6125.2125.0124.8
124.8124.9125.2125.1125.8126.0
126.4127.3127.4128.0128.3128.2
129.1131.3135.0135.9137.1137.4
93.3103.2103.5
108.9119.1118.3120.2120.9
125.6
120.8120.6120.6120.2119.8119.8
120.8121.1121.4121.6121.7121.8
121.9122.4122.7123.4124.0124.2
125.9127.7128.7128.9128.7129.0
See footnotes at end of table.
206
Digitized for FRASER http://fraser.stlouisfed.org/ Federal Reserve Bank of St. Louis
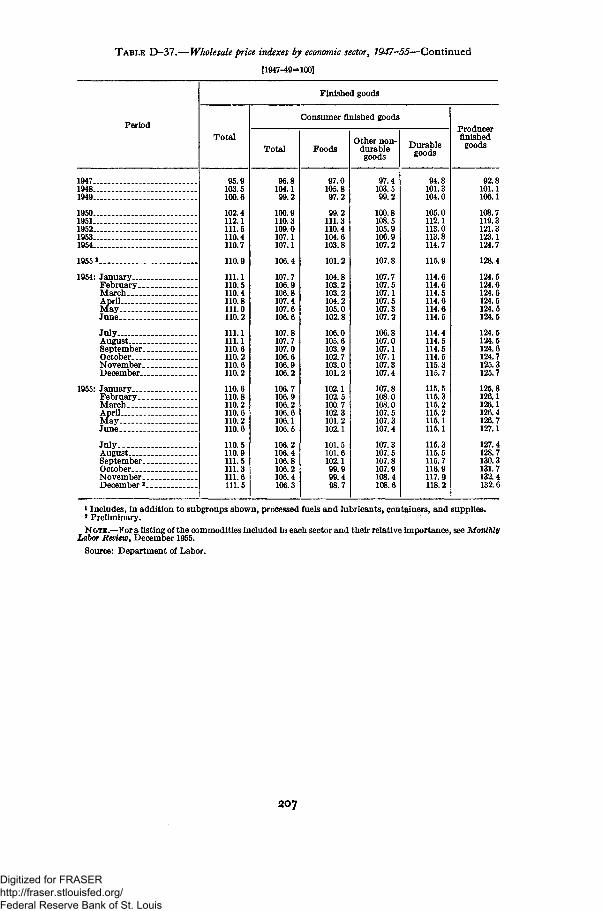
TABLE D-37.—Wholesale price indexes by economic sector, 1947-55—Continued
[1947-49=100]
Period
Finished goods
Total
95.9103.5100.6
102.4112.1111.5110.4110.7
110.9
111.1110.5110.4110.8111.0110.2
111.1111.1110.6110.2110.6110.2
110.6110.8110.2110.6110.2110.6
110.5110.9111.5111.3111.6111.5
Total
96.8104.199.2
100.9110.3109.0107.1107.1
106.4
107.7106.9106.8107.4107.6106.6
107.8107.7107.0106.6106.9106.2
106.7106.9106.2106.6106.1106.5
106.2106.4106.8106.2106.4106.3
Consumer finished goods
Foods
97.0105.897.2
99.2111.3110.4104.6103.8
101.2
104.8103.2103.2104.2105.0102.8
106.0105.6103.9102.7103.0101.2
102.1102.5100.7102.3101.2102.1
101.5101.6102.199.999.498.7
Other non-durablegoods
97.4103.599.2
100.8108.5105.9106.9107.2
107.8
107.7107.5107.1107.5107.3107.2
106.8107.0107.1107.1107.3107.4
107.8108.0108.0107.5107.3107.4
107.3107.5107.8107.9108.4108.6
Durablegoods
94.8101.3104.0
105.0112.1113.0113.8114.7
115.9
114.6114.6114.5114.6114.6114.5
114.4114.5114.5114.5115.3115.7
115.5115.3115.2115.2115.1115.1
115.3115.5115.7116.9117.9118.2
xTOQUcerfinished
goods
92.8101.1106.1
108.7119.3121.3123.1124.7
128.4
124.5124.6124.6124.5124.5124.5
124.5124.5124.6124.7125.3125.7
125.8126.1126.1126.4126.7127.1
127.4128.7130.3131.7132.4132.6
1947 -1948..._ _.1949
1950.19511952 _19531954 .._
1955 8 . - —
1954: JanuaryFebruary. _MarchApril _.MayJune
JulyAugustSeptember.OctoberNovember.December. .
1955: JanuaryFebruary..MarchAprilMayJune
JulyAugustSeptember.OctoberNovember .December2
* Includes, in addition to subgroups shown, processed fuels and lubricants, containers, and supplies.8 Preliminary.
NOTE.—For a listing of the commodities included in each sector and their relative importance, see MonthlyLabor Review, December 1955.
Source: Department of Labor.
207
Digitized for FRASER http://fraser.stlouisfed.org/ Federal Reserve Bank of St. Louis
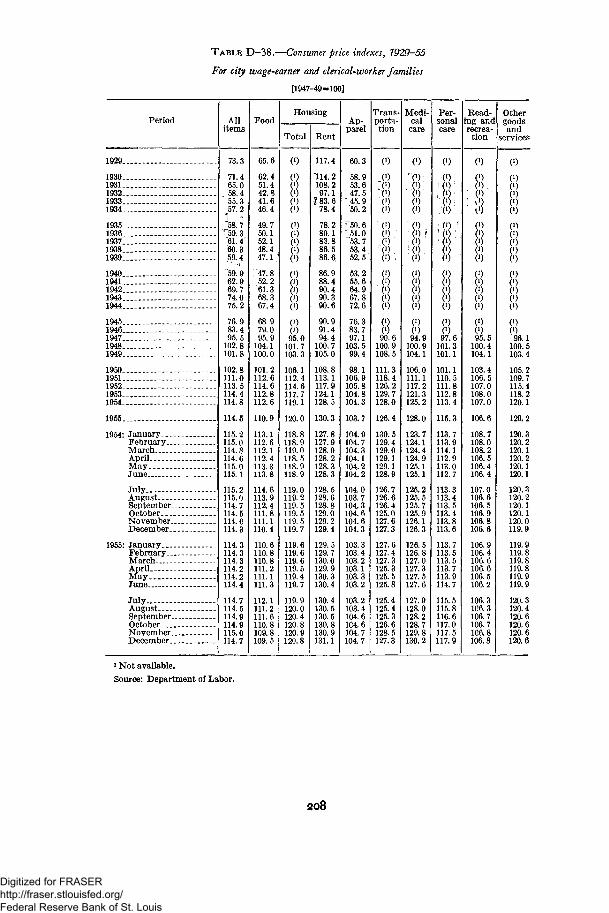
TABLE D-38.—Consumer price indexes, 1929-55
For city wage-earner and clerical-worker families
[1947-49=100]
Period Allitems
73.3
71.465.058.455.3
^57. 2
"58. 7r59.361.4^60.3.59.4
"59. 962.969.774.075.2
76.983.495.5
102.8101.8
102.8111.0113.5114.4114.8
114.5
115.2115.0114.8114.6115.0115.1
115.2115.0114.7114.5114. 6114.3
114.3114.3114.3114.2114.2114.4
114.7114.5114.9114.9115.0114.7
Food
65.6
62.451.442.841.646. 4
49.750.152.148.447.1
,47.852.261.368.367.4
68 979.095.9
104.1100.0
101. 2112.6114.6112.8112.6
110.9
113.1112.6112.1112.4113.3113.8
114.6113.9112.4111.8111.1110.4
110.6110.8110.8111.2111.1111.3
112.1111.2111. 6110.8109.8109.5
Housing
Total
P)
P)P)P)P)P)
P)
P)p)P)
P)P)
Y(0
P)P)95.0
101.7103.3
106.1112.4114.6117.7119.1
120.0
118.8118.9119.0118. 5118.9118.9
119.0119.2119.5119.5119.5119.7
119.6119.6119.6119.5119.4119.7
119.9120.0120.4120.8120.9120.8
Rent
117.4
"114.2108.297.1
183.678.4
78.280.183.886.586.6
86.988.490.490.390.6
90.991.494.4
100.7105.0
108.8113.1117.9124.1128.5
130.3
127.8127.9128.0128.2128.3128. 3
128.5128.6128.8129.0129.2129.4
129.5129.7130.0129.9130.3130.4
130.4130.5130.5130.8130.9131.1
A p -parel
60.3
58.953.647. 5
" 45. 950.2
"50. 6'51.0
53. 753. 452.5
53.255.664.967.872.6
76.383.797.1
103.599.4
98.1106.9105.8104.8104.3
103.7
104.9104.7104.3104.1104.2104.2
104.0103.7104.3104.6104.6104.3
103.3103.4103.2103.1103.3103.2
103.2103.4104.6104.6104.7104.7
Trans-porta-tion
P)
P)rP)0)P)P)
• P )P)P)P)P)>
P)P)P)P)P)
P)P)90.6
100.9108.5
111.3118.4126.2129.7128.0
126.4
130. 5129.4129.0129.1129.1128.9
126.7126.6126.4125.0127.6127.3
127.6127.4127.3125. 3125.5125.8
125.4125.4125.3126.6128.5127.3
Medi-calcare
P)
"•
J)0
P)
P)P) r
;P) ;
prP)P)P)P)P)
P)0)94.9
100.9104.1
106.0111.1117.2121.3125.2
128.0
123.7124.1124.4124.9125.1125.1
125.2125.5125.7125.9126.1126.3
126.5126.8127.0127.3127.5127.6
127.9128.0128.2128.7129.8130.2
Per-sonalcare
P)
P)
P);
P) iP)
;..P)..,r
P)P)P)
P)P)P)0)P)
P)P)97.6
101.3101.1
101.1110.5111.8112.8113.4
115.3
113.7113.9114.1112.9113.0112.7
113.3113.4113.5113.4113. 8113.6
113.7113.5113.5113.7113.9114.7
115.5115.8116.6117.0117.5117.9
Read-ing andrecrea-tion
P)
P)P)P)
: v1)
P)P)P)P)P)
P)P)P)P)P)
P)P)95.5
100.4104.1
103.4106.5107.0108.0107.0
106.6
108.7108.0108.2106.5106.4106.4
107.0106.6106.5106. 9106.8106. 6
106.9106.4106.6106.6106.5106.2
106.3106.3106.7106.7106.8106.8
Othergoodsand
services
P)
0)P)
P)P)
p>P)0)
8P)P)P)P)P)
P)196.1
100.5103.4
105.2109.7115.4118.2120.1
120.2
120.3120.2120.1120.2120.1120.1
120.3120.2120.1120.1120.0119.9
119.9119.8119.8119.8119.9119.9
120.3120.4120.6120.6120.6120.6
1929...
1930.. - —19311932 _19331934
1935193619371938..1939.
194019411942.. _.19431944....
19451946194719481949
1950.19511952.. _.._19531954__
1955..
1954: January._.February..MarchAprilMayJune.
JulyAugustSeptember.October...November.December.
1955: January. _.February..MarchAprilMayJune
JulyAugustSeptember.October...November.December.
i Not available.Source: Department of Labor.
208
Digitized for FRASER http://fraser.stlouisfed.org/ Federal Reserve Bank of St. Louis
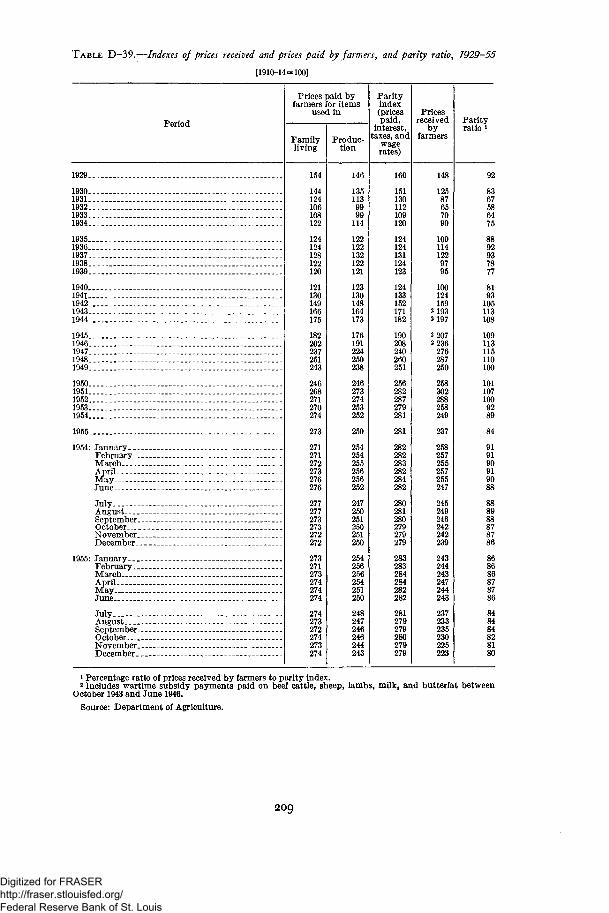
TABLE D~39.—Indexes of prices received and prices paid by farmers, and parity ratio, 1929-55
[1910-14=100]
Period
Prices paid byfarmers for items
used in
Familyliving
154
144124106108122
124124128122120
121130149166175
182202237251243
246268271270274
273
271271272273276276
277277273273272272
273271273274274274
274273272274273274
Produc-tion
146
1351139999114
122122132122121
123130148164173
176191224250238
246273274253252
250
254254255256256252
247250251250251250
254256256254251250
248247246246244243
Parityindex(pricespaid,
interest,taxes, and
wagerates)
160
151130112109120
124124131124123
124133152171182
190208240260251
256282287279281
281
282282283282284282
280281280279279279
283283284284282282
281279279280279279
Pricesreceived
byfarmers
148
12587657090
1091141229795
100124159
2 1932 197
2 2072 236276287250
258302288258249
237
258257255257255247
245249246242242239
243244243247244243
237233235230225223
Parityratio l
1929
19301931 __ .193219331934.._
19351936193719381939...
194019411942.19431944
19451946194719481949
19501951195219531954
1955.
1954: January. _.February..MarchApril.MayJune
JulyAugustSeptember.OctoberNovember.December.
1955: January-_.February..MarchAprilMayJune
JulyAugustSeptember.October....November.December.
8367586475
92937877
8193
105113108
109113115110100
10110710092
84
919190919088
8787
86878786
848484828180
1 Percentage ratio of prices received by farmers to parity index.2 Includes wartime subsidy payments paid on beef cattle, sheep, lambs, milk, and butterfat between
October 1943 and June 1946.Source: Department of Agriculture.
209
Digitized for FRASER http://fraser.stlouisfed.org/ Federal Reserve Bank of St. Louis
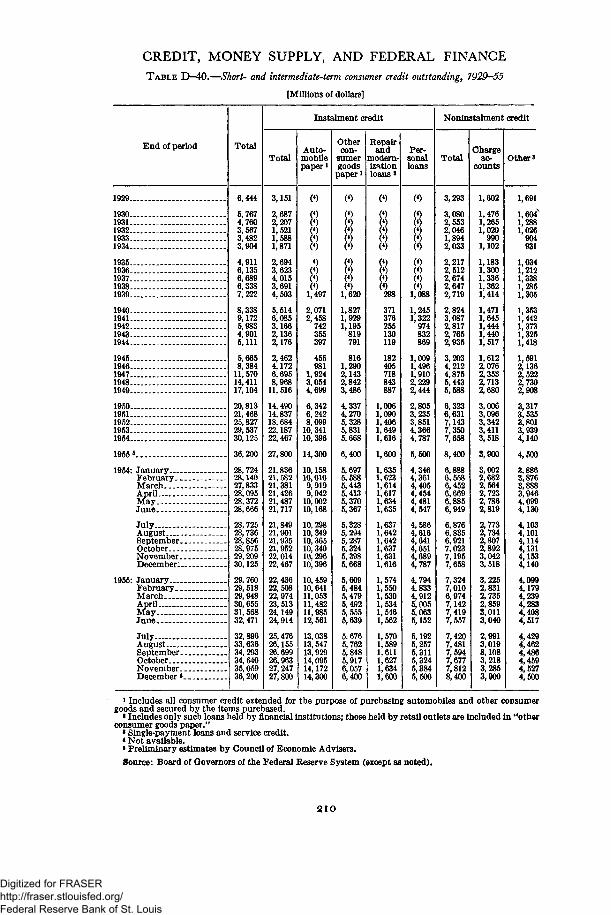
CREDIT, MONEY SUPPLY, AND FEDERAL FINANCETABLE D—40.—Short' and intermediate-term consumer credit outstanding, 1929—55
[Millions of dollars]
End of period Total
6,444
5,7674,7603,5673,4823,904
4,9116,1356,6896,3387,222
8,3389,1725,9834,9015,111
5,6658,384
11, 57014,41117,104
20,81321,46825,82729,53730,125
36,200
28,72428,14027,83328,09528,37228,666
28,72528,73628,85628,97529,20930,125
29,76029, 51829,94830,65531, 56832,471
32,89633,63634,29334,64035,05936,200
Instalment credit
Total
3,151
2,6872,2071,5211,5881,871
2,6943,6234,0153,6914,503
5,5146,0853,1662,1362,176
2,4624,1726,6958,968
11,516
14,49014,83718, 68422,18722,467
27,800
21,83621, 58221,38121,42621,48721,717
21,84921,90121,93521,95222,01422,467
22, 43622, 50822,97423, 51324,14924, 914
25, 47626,15526, 69926,96327, 24727,800
Auto-mobilepaper i
«
(4)(*)
(J)(4)4)
(4)
81,497
2,0712,458
742355397
455981
1,9243,0544,699
6,3426,2428,099
10, 34110,396
14,300
10,15810,0109,9199,942
10,00210,168
10,29810,34910,36510,34010,29610,396
10,45910, 64111,05311,48211,98512, 561
13,03813,54713,92914,09514,17214,300
Othercon-
sumergoods
paper *
(«)
(4)
h0)(4)4)4)4)4)
1,620
1,8271,9291,195
819791
8161,2902,1432,8423,486
4,3374,2705,3285,8315,668
6,400
5,6975,5885,4435,4135,3705,367
5,3285,2945,2875,3245,3985,668
5,6095,4845,4795,4925,5555,639
5,6765,7625,8485,9176,0576,400
Repairand
modern-izationloans*
(4)
(
0000298
371376255130119
182405718843887
1,0061,0901,4061,6491,616
1,600
1,6351,6231,6141,6171,6341,635
1,6371,6421,6421,6371,6311,616
1,5741,5501,5301,5341,5461,562
1,5701,5891,6111,6271,6341, 600
Per-sonalloans
(04)4)«)
J)4)4)4)4)
1 088
1,2451,322
974832869
1,0091,4961,9102,2292,444
2,8053,2353,8514,3664,787
5,500
4,3464,3614,4054,4544,4814,547
4,5864,6164,6414,6514,6894,787
4,7944,8334,9125,0055,0635,152
5,1925,2575,3115,3245,3845,500
Noninstalment credit
Total
3,293
3,0802,5532,0461,8942,033
2,2172,5122,6742,6472,719
2,8243,0872,8172,7652,935
3,2034,2124,8755,4435,588
6,3236,6317,1437,3507,658
8,400
6,8886,5586,4526,6696,8856,949
6,8766,8356,9217,0237,1957,658
7,3247,0106,9747,1427,4197,557
7,4207,4817,5947,6777,8128,400
Chargeac-
counts
1,602
1,4761,2651,020
9901,102
1,1831,3001,3361,3621,414
1,4711,6451,4441,4401,517
1,6122,0762,3532,7132,680
3,0063,0963,3423,4113,518
3,900
3,0022,6822,5642,7232,7862,819
2,7732,7342,8072,8923,0423,518
3,2252,8312,7352,8593,0113,040
2,9913,0193,1083,2183,2853,900
Other'
1,691
1,604s
1,2881,026
904931
1,0341,2121,3381,2851,305
1,3531,4421,3731,3251,418
1,5912,1362,5222,7302,908
3,3173,5353,8013,9394,140
4,500
3.8863,8763,8883,9464,0994,130
4,1034,1014,1144,1314,1534,140
4,0994,1794,2394,2834,4084,517
4,4294,4624,4864,4594,5274,500
1929 -
193019311932 ._19331934 _
19351936193719381939
19401941 _.._1942 -19431944
1945—.1946194719481949
1950 - -19511952 ..-_1953.—1954
1955 «
1954: JanuaryFebruary._MarchAprilMayJune
July —AugustSeptember.OctoberNovember.December-
1955: JanuaryFebruary. _MarchAprilMayJune
JulyAugustSeptember.OctoberNovember .December *
1 Includes all consumer credit extended for the purpose of purchasing automobiles and other consumergoods and secured by the items purchased.
»Includes only such loans held by financial institutions; those held by retail outlets are included in "otherconsumer goods paper."
* Single-payment loans and service credit.* Not available.»Preliminary estimates by Council of Economic Advisers.
Source: Board of Governors of the Federal Reserve System (except as noted).
2 I O
Digitized for FRASER http://fraser.stlouisfed.org/ Federal Reserve Bank of St. Louis
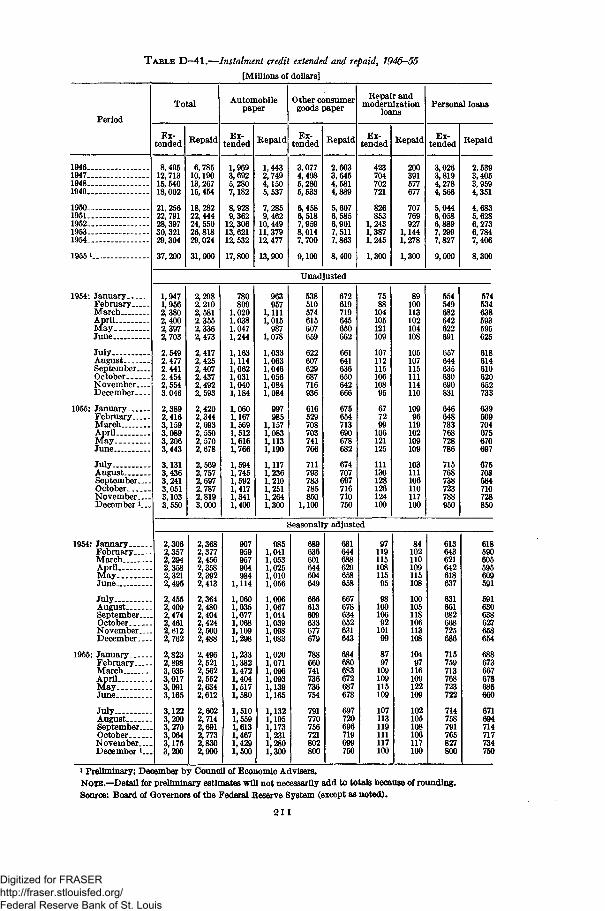
TABLE D-41.—Instalment credit extended and repaid, 1946-55
[Millions of dollars]
Period
Total
Ex-tended Repaid
Automobilepaper
Ex-tended Repaid
Other consumergoods paper
Ex-tended Repaid
Repair andmodernization
loans
Ex-tended Repaid
Personal loans
Ex-tended Repaid
1946-1947-1948-1949-
1950-1951-1952-1953-1954-
1955 i
1954: JanuaryFebruaryMarchAprilMayJune
July—.AugustSeptember-OctoberNovember—December
1955: JanuaryFebruaryMarch.AprilMayJune
JulyAugustSeptember-OctoberNovember-December i_
1954: JanuaryFebruary...MarchAprilMayJune _.
JulyAugustSeptember.OctoberNovember..December—
1955: JanuaryFebruary. ..MarchAprilMayJune
JulyAugustSeptember.OctoberNovember..December i.
8,49512,71315, 54018,002
21, 25622, 79128, 39730,32129, 304
37,200
6,78510,19013, 26715, 454
18, 28222, 44424, 55026, 81829,024
31,900
1,9693,6925,2807,182
8,9289,36212,30613,62112, 532
17,800
1,4432,7494,1505,537
7,2859,46210, 44911,37912, 477
13,900
3,0774,4985,2805,533
6,4586,5187,9598,0147,700
9,100
2,6033,6454,5814,889
5,6076,5856,9017,5117,863
8,400
423704702721
826853
1,2431,3871,245
1,300
200391577677
707769927
1,1441,278
1,300
3,0263,8194,2784,566
5,0446,058
7,2997,827
9,000
Unadjusted
1,9471,9562,3802,4002,3972,703
2,5492,4772,4412,4542,5543,046
2,3892,4163,1593,0893,2063,443
3,1313,4363,2413,0513,1033,550
2,2982.2102,5812.3552,3362,473
2,4172,4252,4072,4372,4922,593
2,4202,3442,6932,5502,5702,678
2,5692,7572,6972,7872,8193,000
780809
1,0201,0381,0471,244
1,1631,1141,0621,0311,0401,184
1,0601,1671,5691,5121,6161,766
1,5941,7451,5921,4171,3411,400
963957
1,1111,015987
1,078
1,0331,0631,0461,0561,0841,084
997985
1,1571,0831,1131,190
1,1171,2361,2101,2511,2641,300
538510574615607659
622607629687716936
616529708703741766
711793783785850
1,100
672619719645650662
661641636650642666
675654713690678682
674707697716710750
7588104105121109
10711211510610895
677299106121125
111130128126124100
89100113102104108
105107115111114110
10996119102109109
103111106110117100
554549682642622691
657644635630690831
646648783768728786
715768738723788950
Seasonally adjusted
2,3062,3572,2942,3582,3212,495
2,4552,4092,4742,4612,6122,762
2,823
3,0353,0173,0913,165
3,1223,2003,2793,0643,1753,200
2,3682,3772,4562,3582,3922,413
2,3642,4802,4042,4242,5002,488
2,4962,5212,5622,5522,6342,612
2,6022,7142,6912,7732,8302,900
907959957964984
1,114
1,0601,0351,0771,0681,1091,298
1,2331,3821,4721,4041,5171,580
1,5101,5591,6131,4671,4291,500
9851,0411,0531,0251,0101,056
1,0061,0671,0141,0391,0981,083
1,0201,0711,0961,0931,1391,165
1,1321,1951,1731,2311,2801,300
689636601644604649
666613609633677679
788660741736736754
791770756721802800
681644688629658658
667678634652631643
684680683672687678
697720696719699750
9711911510811595
981001069210199
8797109109115109
107113119111117100
84102110109115108
100105118106113108
10497116109122109
102105108106117100
613643621642618637
631661682668725686
715759713768723722
714758791765827800
2,5393,4053,9594,351
4,6835,6286,2736,7847,406
8,300
574534638593595625
618614610620652733
639609704675670697
675703684710728850
618590605595609591
591630638627658654
688673667678
671694714717734750
* Preliminary; December by Council of Economic Advisers.NOTE.—Detail for preliminary estimates will not necessarily add to totals because of rounding.Source: Board of Governors of the Federal Reserve System (except as noted).
211
Digitized for FRASER http://fraser.stlouisfed.org/ Federal Reserve Bank of St. Louis
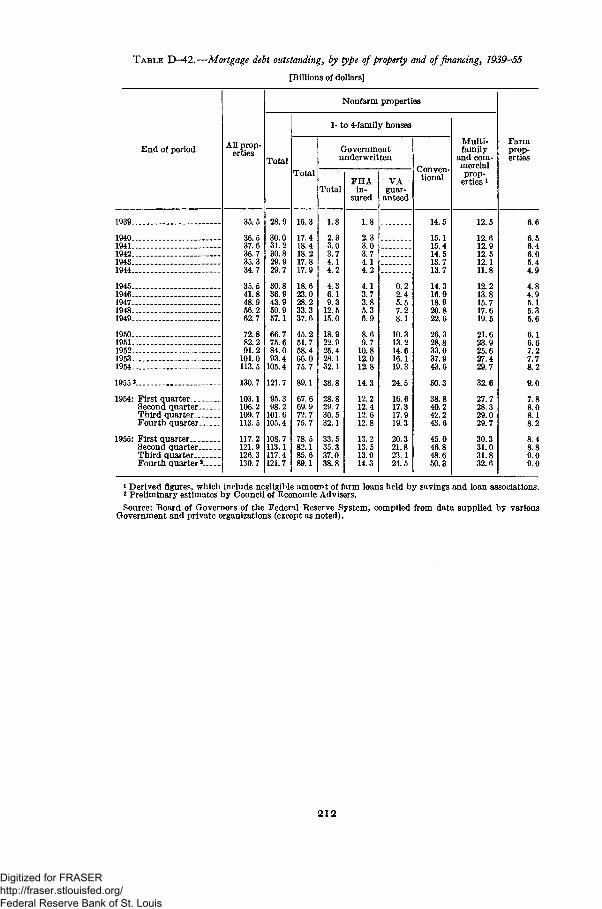
TABLE D-42.—Mortgage debt outstanding, by type of property and of financing, 1939-55
[Billions of dollars]
End of period
1939
19401941194219431944
19451946 - ,194719481949
19501951195219531954
1955 2
1954: First quarter- __Second quarterThird quarterFourth quarter
1955: First quarter.Second quarterThird quarterFourth quarter2-
All prop-erties
35.5
36.537.636.735.334.7
35.541.848.956.262.7
72.882.291.2
101.0113.5
130.7
103.1106.2109.7113.5
117.2121.9126.3130.7
Nonfarm properties
Total
28.9
30.031.230.829.929.7
30.836.943.950.957.1
66.775.684.093.4
105.4
121.7
95.398.2
101.6105.4
108.7113.1117.4121.7
1- to 4-family houses
Total
16.3
17.418.418.217.817.9
18.623.028.233.337.6
45.251.758.466.075.7
89.1
67.669.972.775.7
78.582.185.689.1
Governmentunderwritten
Total
1.8
2.33.03.74.14.2
4.36.19.3
12.515.0
18.922.925.428.132.1
38.8
28.829.730.532.1
33.535.337.038.8
FHAin-
sured
1.8
2.33.03.74.14.2
4.13.73.85.36.9
8.69.7
10.812.012.8
14.3
12.212.412.612.8
13.213.513.914.3
VAguar-
anteed
0.22.45.57.28.1
10.313.214.616.119.3
24.5
16.617.317.919.3
20.321.823.124.5
Conven-tional
14.5
15.115.414.513.713.7
14.316.918.920.822.6
26.328.833.037.943.6
50.3
38.840.242.243.6
45.046.848.650.3
Multi-family
and com-mercialprop-
erties 1
12.5
12.612.912.512.111.8
12.213.815.717.619.5
21.623.925.627.429.7
32.6
27.728.329.029.7
30.331.031.832.6
Farmprop-erties
6.6
6.56.46.05.44.9
4.84.95.15.35.6
6.16.67.27.78.2
9.0
7.88.08.18.2
8.48.89.09.0
1 Derived figures, which include negligible amount of farm loans held by savings and loan associations.2 Preliminary estimates by Council of Economic Advisers.Source: Board of Governors of the Federal Reserve System, compiled from data supplied by various
Government and private organizations (except as noted).
2 1 2
Digitized for FRASER http://fraser.stlouisfed.org/ Federal Reserve Bank of St. Louis
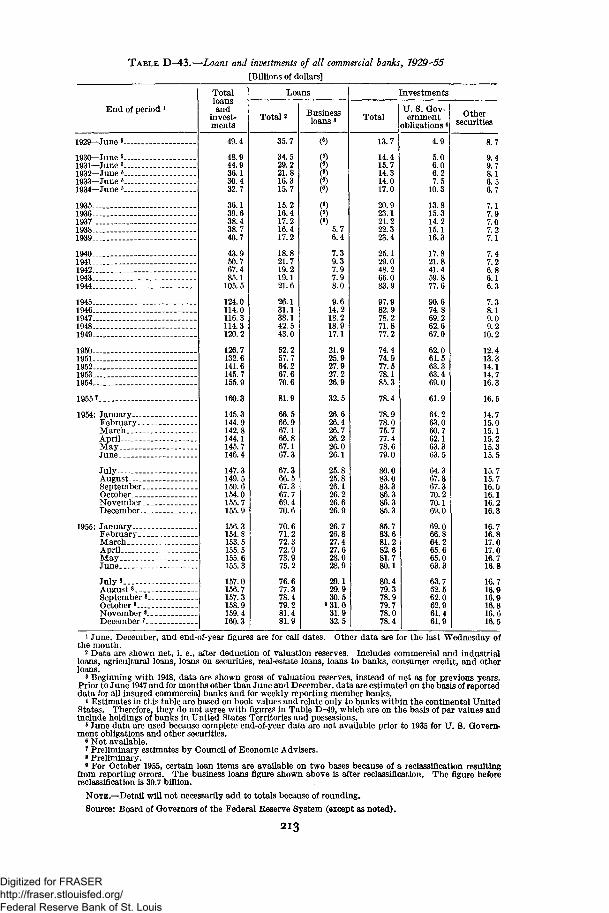
TABLE D-43.—Loans and investments of all commercial banks, 1929-55
[Billions of dollars]
End of period l
Totalloansand
invest-ments
Loans
Total 2 Businessloans 3
Investments
TotalU. S. Gov-ernment
obligations *Other
securities
1929—June «..
1930—June »..1931—June «..1932—June «..1933—June «_.1934—June K.
1935..
1937-1938-
1940..1941-1942..1943-1944..
1945-1946..1947-1948-1949..
1950-1951-1952..1953..1954-
1955 7
1954: January.-.February.MarchAprilMayJune
JulyAugustSeptember.OctoberNovember.December-.
1955: January-..February-MarchAprilMayJune
JulysAugust8
September 8_.October8
November 8_.December 7_ _
49.4
48.944.936.130.432.7
36.139.638.438.740.7
43.950.767.485.1
105.5
124.0114.0116.3114.3120.2
126.7132.6141.6145.7155.9
160.3
145.3144.9142.8144.1145.7146.4
147.3149.5150.6154.0155.7155.9
156.3154.8153.5155.5155.6155.3
157.0156.7157.3158.9159.4160.3
35.7
34.529.221.816.315.7
15.216.417.216.417.2
18.821.719.219.121.6
26.131.138.142.543.0
52.257.764.267.670.6
81.9
66.566.967.166.867.167.3
67.366.567.367.769.470.6
70.671.272.372.973.975.2
76.677.378.479.281.481.9
()5.76.4
7.39.37.97.98.0
9.614.218.218.917.1
21.925.927.927.226.9
32.5
26.626.426.726.226.026.1
25.825.826.126.226.626.9
26.726.827.427.628.028.9
29.129.930.5
•31.031.932.5
13.7
14.415.714.314.017.0
20.923.121.222.323.4
25.129.048.266.0
97.982.978.271.877.2
74.474.977.578.185.3
78.4
78.978.075.777.478.679.0
80.083.083.386.386.385.3
85.783.681.282.681.780.1
80.479.378.979.778.078.4
4.9
5.06.06.27.5
10.3
13.815.314.215.116.3
17.821.841.459.877.6
90.674.869.262.667.0
62.061.563.363.469.0
61.9
64.263.060.762.163.363.5
64.367.367.370.270.169.0
69.066.864.265.665.063.3
63.762.562.062.961.461.9
9.49.78.16.56.7
7.17.97.07.27.1
7.47.26.86.16.3
7.38.19.09.2
10.2
12.413.314.114.716.3
16.5
14.715.015.115.215.315.5
15.715.716.016.116.216.3
16.716.817.017.016.716.8
16.716.916.916.816.616.5
1 June, December, and end-of-year figures are for call dates. Other data are for the last Wednesday ofthe month.
2 Data are shown net, i. e., after deduction of valuation reserves. Includes commercial and industrialloans, agricultural loans, loans on securities, real-estate loans, loans to banks, consumer credit, and otherloans.
3 Beginning with 1948, data are shown gross of valuation reserves, instead of net as for previous years.Prior to June 1947 and for months other than June and December, data are estimated on the basis of reporteddata for all insured commercial banks and for weekly reporting member banks.
4 Estimates in this table are based on book values and relate only to banks within the continental UnitedStates. Therefore, they do not agree with figures in Table D-49, which are on the basis of par values andinclude holdings of banks in United States Territories and possessions.
• June data are used because complete end-of-year data are not available prior to 1935 for U. S. Govern-ment obligations and other securities.
6 Not available.7 Preliminary estimates by Council of Economic Advisers.• Preliminary.• For October 1955, certain loan items are available on two bases because of a reclassification resulting
from reporting errors. The business loans figure shown above is after reclassification. The figure beforereclassification is 30.7 billion.
NOTE.—Detail will not necessarily add to totals because of rounding.
Source: Board of Governors of the Federal Reserve System (except as noted).
213
Digitized for FRASER http://fraser.stlouisfed.org/ Federal Reserve Bank of St. Louis
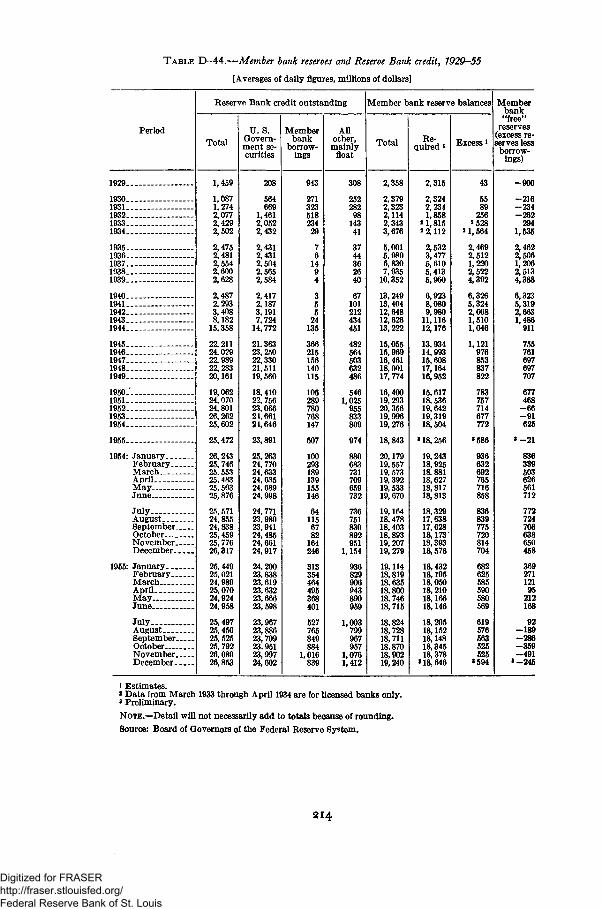
TABLE D-44.—Member bank reserves and Reserve Bank credit, 1929-55
[Averages of daily figures, millions of dollars]
Period
Reservo Bank credit outstanding
Total
1,459
1,0871,2742,0772,4292,502
2,4752,4812,5542,6002,628
2,4872,2933,4088,182
15.358
22, 21124,02922,98922,28320,161
19,06224.07024,80126, 26225,602
25,472
26,24325, 74625.55325,48325,50325,876
25,57124,85524,83825,45925, 77626,317
25, 44925,02124,98925,07024,92424,958
25,49725,45025, 52525, 79226,08926,853
U.S.Govern-ment se-curities
208
564669
1,4612,0522,432
2,4312,4312,5042,5652,584
2,4172,1873,1917,724
14, 772
21,36323,25022,33021,51119,560
18,41022, 75623,0662*. 66124,646
23,891
25,26324, 77024,63324, 63524, 68924,998
24, 77123,98923,94124, 48524,66124, 917
24, 20023,83823,61923,63223,66623,598
23,96723,88623,70923,95123,99724,602
Memberbank
borrow-ings
943
271323518234
29
76
1494
355
24135
366215156140115
106289780768147
607
100293189139155146
641156782
164246
313354464495368401
527765849884
1,016839
Allother,mainly
float
308
252282
9814341
3744362640
67101212434451
482564503632486
5461,025
955833809
974
880683731709659732
736751830892951
1,154
936829906P43890959
1,003799967957
1,0761,412
Member bank reserve balances
Total
2,358
2,3792,3232,1142,3433,676
5,0015,9896,8307,935
10,352
13,24913,40412,64812,62613, 222
15,05515,96916,46118,00117,774
16,40019,29320,35619,99619, 276
18,843
20,17919,55719,57319,39219,53319,670
19,16418,47818,40318,89319,20719, 279
19,11418,81918,63518,80018,74618,715
18,82418,72818,71118,87018,90219,240
Re-quired i
2,315
2,3242,2341,858
21,8152 2,112
2,5323,4775,6105,4135,960
6,9238,0809,980
11,11612,176
13,93414,99315,60817,16416,952
15,61718.53619,64219,31918,504
8 18,256
19,24318,92518, 88118,62718,81718,813
18,32917,63817,62818,17318,39318,576
18,43218,19518,05018,21018,16618,146
18,20518,15218,14818,34518,378
»18,646
Excessl
43
5589
2562 528
U,564
2,4692,5121,2202,5224,392
6,3265,3242,6681,5101,046
1,121976853837822
783757714677772
»586
936632692765716858
836839775720814704
682625585590580569
619576563525525
*594
Memberbank"free"
reserves(excess re-serves lessborrow-
ings)
1929 —
1930.1931.._.1932 — -19331934 -
19351936 -1937 -1938 — .1939
1940 -1941194219431944
19451946194719481949
1950.'1951195219531954
1955
1954: JanuaryFebruaryMarchAprilMayJune
JulyAugustSeptemberOctoberNovemberDecember
1955: JanuaryFebruaryMarch _AprilMayJune
JulyAugustSeptemberOctoberNovemberDecember
-900
-216-234-262
2941,535
2,4622,5061,2062,5134,388
6,3235,3192,6631,486911
755761
707
677468-66-91625
1-21
503626561712
772724708638650458
36927112195212
92-189
-491«-245
1 Estimates.2 Data from March 1933 through April 1934 are for licensed banks only.3 Preliminary.
NOTE.—Detail will not necessarily add to totals because of rounding.
Source: Board of Governors of the Federal Reserve System.
214
Digitized for FRASER http://fraser.stlouisfed.org/ Federal Reserve Bank of St. Louis
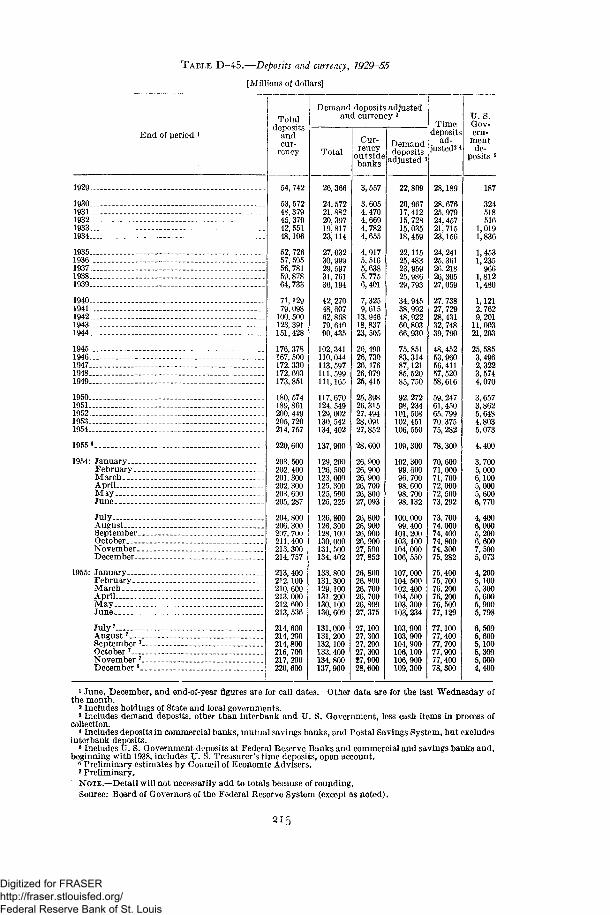
TABLE D-45.—Deposits and currency, 1929-55
[Millions of dollars]
End of period »
1929-
1930..1931 .1932-1933..1934-
1935-1936 .1937..1938..1939-
1940-1941-1942..1943..1944..
1945—1946—1947—1948—1949—
1950—1951 —1952...1953—1954—
1955«.
1954: January...February.MarchAprilMayJune
JulyAugustSeptember.OctoberNovember..December..
1955: January...February.MarchAprilMayJune
July*August7
September 7_.October 7
November 7_.December6..
Totaldeposits
andcur-
rency
54,742
53,57248,37945,37042, 55148,106
52, 72657, 59556, 78159,87864, 733
71,12979,098
100, 500123,391151, 428
176, 378167, 500172. 330172, 693173,851
180, 574189,861200, 449205,720214, 757
220,600
203, 500202. 400201, 300202, 300203, 600205, 287
204, 800206, 300207, 700211, 400213, 300214, 757
213, 400212,100210, 600213, 000212,600213, 536
214,600214, 200214, 800216, 700217, 200220,600
Demand deposits adjustedand currency 2
Total
26,366
24.57221,88220, 39719,81723,114
27,03230,99929, 59731, 76136,194
42, 27048, 60762,86879, 64090,435
102,341110,044113,597111,599111,165
117,670124,549129,002130,542134, 402
137,900
129, 200126, 500123, 600125, 300125, 500125, 225
126, 800126, 300128,100130, 000131, 500134, 402
133, 800131, 300129,100131, 200130,100130, 609
131,000131, 200132, 100133, 400134, 800137,900
Cur-rency
outsidebanks
3,557
3,6054,4704,6694,7824,655
4,9175,5165,6385,7756,401
7,3259,615
13,94618,83723, 505
26, 49026, 73026, 47626,07925,415
25,39826,31527, 49428,09127,852
28,600
26, 90026,90026, 90026, 70026, 80027, 093
26, 80026, 90026, 90026, 90027, 50027, 852
26, 80026, 80026, 70026, 70026,80027, 375
27,10027. 30027, 20027, 30027, 90028, 600
Demanddeposits
adjusted '
22,809
20,96717, 41215, 72815,03518, 459
22,11525,48323,95925,98629,793
34, 94538,99248,92260,803
75,85183,31487,12185, 52085, 750
92, 27298, 234101,508102,451106, 550
109, 300
102, 30099, 60096, 70098, 60098, 70098,132
100,00099, 400101, 200103,100104, 000106, 550
107, 000104, 500102, 400104, 500103,300103, 234
103,900103, 900104, 900106,100106, 900109,300
Timedeposits
ad-justed* *
28,189
28,67625. 97924,45721, 71523,156
24, 24125.36126. 21826,30527,059
27. 73827, 72928,43132, 74839, 790
48,45253.96056, 41157, 52058,616
59, 24761,45065, 79970,37575, 282
78,300
70, 60071, 00071, 70072, 00072, 50073, 292
73, 70074, 00074, 40074, 80074, 30075,282
75, 40075, 70076,20076, 20076, 50077,129
77,10077,40077,70077,90077,40078,300
U.S.Gov-ern-
mentde-
posits £
187
324518516
1,0191,836
1,4531,235966
1,8121,480
1,1212,7629,201
11, 00321,203
25,5853,4962,3223,5744,070
3,6573,8625,6484,8035,073
4,400
3,7005,0006,1005,0005,6006,770
4,4006,0005,2006,6007,5005,073
4,2005,1005,3005,6005,9005,798
6,5005,6005,1005,3005,0004,400
1 June, December, and end-of-year figures are for call dates. Other data are for the last Wednesday ofthe month.
2 Includes holdings of State and local governments.s Includes demand deposits, other than interbank and U. S. Government, less cash items in process of
collection.* Includes deposits in commercial banks, mutual savings banks, and Postal Savings System, but excludes
interbank deposits.5 Includes U. S. Government deposits at Federal Reserve Banks and commercial and savings banks and,
beginning with 1938, includes U. S. Treasurer's time deposits, open account.6 Preliminary estimates by Council of Economic Advisers.7 Preliminary.NOTE.—Detail will not necessarily add to totals because of rounding.Source: Board of Governors of the Federal Reserve System (except as noted).
21'
Digitized for FRASER http://fraser.stlouisfed.org/ Federal Reserve Bank of St. Louis
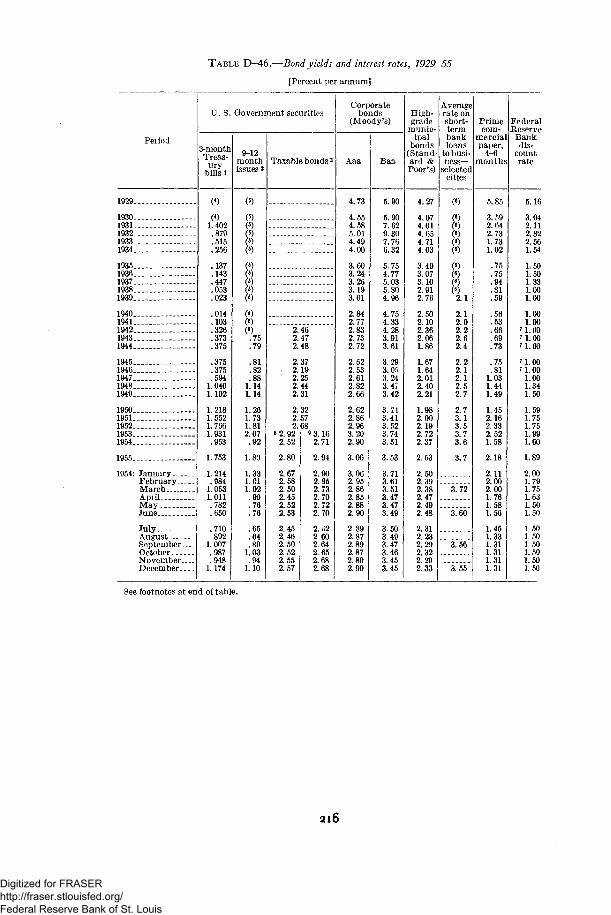
TABLE D-46.—Bond yields and interest rates, 1929-55
[Percent per annum]
Period
1929..
1930..1931..1932..1933..1934..
1935..1936..1937..1938..1939..
1940..1941_.1942..1943..1944_.
1945..1946..1947..1948..1949..
1950..1951..1952..1953..1954..
1955
1954: JanuaryFebruaryMarchAprilMayJune
JulyAugustSeptemberOctoberNovemberDecember
U. S. Government securitiesCorporate
bonds(Moody's)
3-monthTreas-
urybills i
()1.402
.879
.515
.256
.137
.143
.447
.053
.023
.014
.103
.326
.373
.375
.375
.375
.5941.0401.102
1.2181.5521.7661.931.953
1.753
1.214.984
1.0531.011.782.650
.710
.8921.007
.987
.9481.174
9-12monthissues2
1.89
1.331.011.02.90.76.76
.65
.64
.891.03.94
1.10
Taxable bonds 3
2.462.472.48
2.372.192.252.442.31
2.322.572.68
8 2.922.52
2.80
2.672.582.502.452.522.53
2.452.462.502.522.552.57
3.162.71
2.94
2.902.852.732.702.722.70
2.022.602.642.652.682.68
Aaa
4.73
4.554.585.014.494.00
3.603.243.263.193.01
2.842.772.832.732.72
2.622.532.612.822.66
2.622.862.963.202.90
3.06
3.062.952.862.852.882.90
2.892.872.892.872.892.90
Baa
5.90
5.907.629.307.766.32
5.754.775.035.804.96
4.754.334.283.913.61
3.293. OS3.243.473.42
3.243.413.523.743.51
3.53
3.713.613.513.473.473.49
3.503.493.473.463.453.45
High-grade
munic-ipal
bonds(Stand-ard &Poor's)
4.27
4.074.014.654.714.03
3.403.073.102.912.76
2.502.102.362.061.86
1.671.642.012.402.21
1.982.002.192.722.37
2.53
2.502.392.382.472.492.48
2.312.232.292.322.292.33
Averagerate onshort-termbankloans
to busi-ness-
selectedcities
()2.1
2.12.02.22.62.4
2.22.12.12.52.7
2.73.13.53.73.6
3.7
3.72
~3.~60"
3.56
~3.~55~
Primecom-
mercialpaper,
4-6months
5.85
3.592.642.731.731.02
.75
.75
.94
.81
.59
.56
.53
.66
.69
.73
.75
.811.031.441.49
1.452.162.332.521.58
2.18
2.112.002.001.761.581.56
1.451.331.311.311.311.31
FederalReserve
Bankdis-
countrate
5.16
3.042.112.822.561.54
1.501.501.331.001.00
1.001.00
7 1.00U . 0 0M.00
7 1.007 1.00
1.001.341.50
1.591.751.751.991.60
1.89
2.001.791.751.631.501.50
1.501.501.501.501.501.50
See footnotes at end of table.
2l6
Digitized for FRASER http://fraser.stlouisfed.org/ Federal Reserve Bank of St. Louis
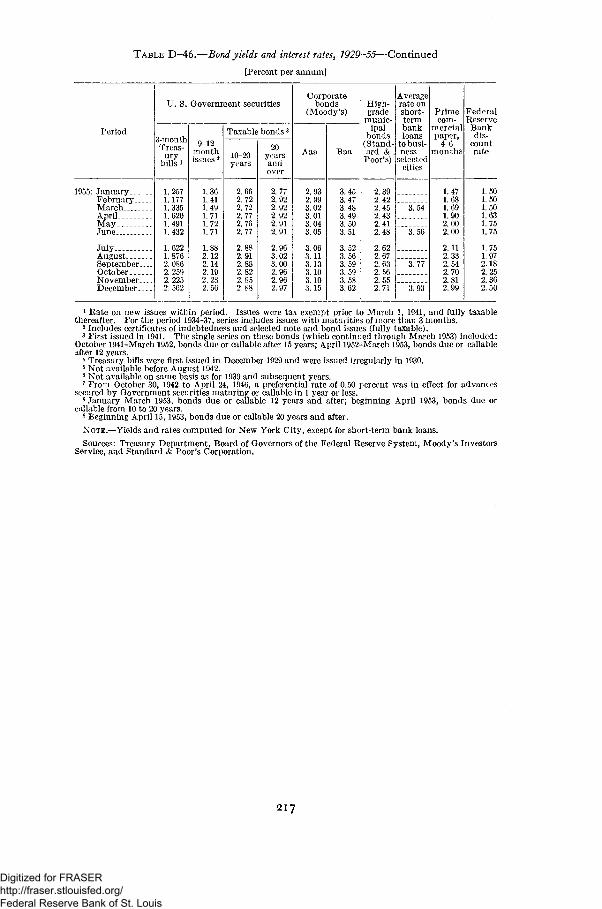
TABLE D-46.—Bond yields and interest rates, 1929-55—Continued
[Percent per annum]
Period
1955: JanuaryFebruaryMarchAprilMayJune
JulyAugustSeptemberOctoberNovemberDecember
U. S. Government securities
3-monthTreas-
urybills i
1. 2571. 1771.3351.6201.4911.432
1. 6221.8762. 0862. 2592.2252.562
9-12monthissues 2
1.361.411.491.711.721.71
1.882. 122.142.192.2S2.56
Taxable bonds3
10-20years
2.662.722.722.772.762.77
2.882.912.882.822.852.88
20yearsandover
2.772.922.922.922.912.91
2.963.023.002.962.962.97
Corporatebonds
(Moody's)
Aaa
2.932.993.023.013.043.05
3.063.113.133.103.103.15
Baa
3.453.473.483.493.503.51
3.523.563.593.593.583.62
High-grade
munic-ipal
bonds(Stand-ard & .Poor's)
2.392.422.452.432.412.48
2.622.672.632.562.552.71
Averagerate onshort-termbankloans
to busi-ness—
selectedcities
3.54
3.56
3.77
3.93
Primecom-
mercialpaper,
4-6months
1.471.681.691.902.002.00
2.112.332.542.702.812.99
FederalReserveBankdis-
countrate
1.501.501.501.631.751.75
1.751.972.182.252.362.50
1 Rate on new issues within period. Issues were tax exempt prior to March 1, 1941, and fully taxablethereafter. For the period 1934-37, series includes issues with maturities of more than 3 months.
2 Includes certificates of indebtedness and selected note and bond issues (fully taxable).3 First issued in 1941. The single series on these bonds (which continued through March 1953) included:
October 1941-March 1952, bonds due or callable after 15 years; April 1952-March 1953, bonds due or callableafter 12 years.
4 Treasury bills were first issued in December 1929 and were issued irregularly in 1930.5 Not available before August 1942.6 Not available on same basis as for 1939 and subsequent years.7 From October 30, 1942 to April 24, 1946, a preferential rate of 0.50 percent was in effect for advances
secured by Government securities maturing or callable in 1 year or less.8 January-March 1953, bonds due or callable 12 years and after; beginning April 1953, bonds due or
callable from 10 to 20 years.9 Beginning April 15, 1953, bonds due or callable 20 years and after.
NOTE.—Yields and rates computed for New York City, except for short-term bank loans.
Sources: Treasury Department, Board of Governors of the Federal Reserve System, Moody's InvestorsService, and Standard & Poor's Corporation.
217
Digitized for FRASER http://fraser.stlouisfed.org/ Federal Reserve Bank of St. Louis
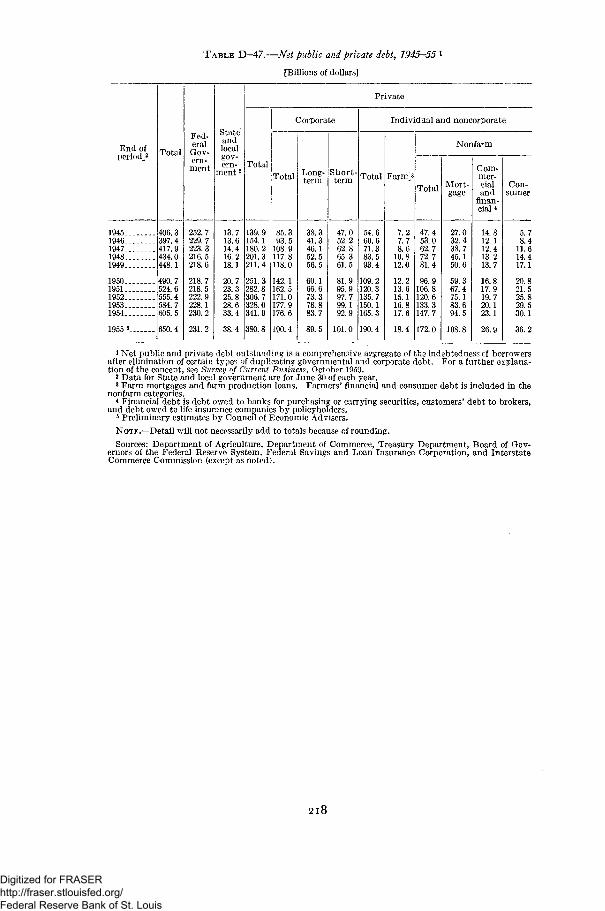
TABLE D-47.—Net public and private debt, 1945-55 1
[Billions of dollars]
E n d ofp e r i o d *
19451946194719481949
19501951195219531954
1955 «
Total
406.3397.4417.9434.0448.1
490.7524.6555.4584.7605.5
650.4
Fed-eralGov-ern-ment
252.7229.7223.3216.5218.6
218.7218.5222.9228.1230.2
231.2
Stateandlocalgov-ern-
ment2
13.713.614.416.218.1
20.723.325.828.633.4
38.4
Private
Total
139.9154.1180.2201.3211.4
251.3282.8306.7328.0341.9
380.8
Corporate
Total
85.393.5
108.9117.8118.0
142.1162.5171.0177.9176.6
190.4
Long-term
38.341.346.152.556.5
60.166.673.378.883.7
89.5
Short-term
47.052.262.865.361.5
81.995.997.799.192.9
101.0
Individual and noncorporate
Total
54.660.671.383.593.4
109.2120.3135.7150.1165.3
190. 4
FarmJ
7.27.78.6
10.812.0
12.213.615.116.817.6
18.4
Nonfarm
Total
47.453.062.772.781.4
96.9106.8120.6133.3147.7
172.0
Mort-gage
27.032.438.745.150.6
59.367.475.183.694.5
108.8
Com-mer-cialand
finan-cial 4
14.812.112.413.213.7
16.817.919.720.123.1
26.9
Con-sumer
5.78.4
11.614.417.1
20.821.525.829.530.1
36.2
1 Net public and private debt outstanding is a comprehensive aggregate of the indebtedness vf borrowersafter elimination of certain types of duplicating governmental and corporate debt. For a further explana-tion of the concept, see Survey of Current Business, October 1950.
2 Data for State and local government are for June 30 of each year.3 Farm mortgages and farm production loans. Farmers' financial and consumer debt is included in the
nonfarm categories.* Financial debt is debt owed to banks for purchasing or carrying securities, customers' debt to brokers,
and debt owed to life insurance companies by policyholders.5 Preliminary estimates by Council of Economic Advisers.
NOTE.—Detail will not necessarily add to totals because of rounding.
Sources: Department of Agriculture, Department of Commerce, Treasury Department, Board of Gov-ernors of the Federal Reserve System, Federal Savings and Loan Insurance Corporation, and InterstateCommerce Commission (except as noted).
2 l 8
Digitized for FRASER http://fraser.stlouisfed.org/ Federal Reserve Bank of St. Louis
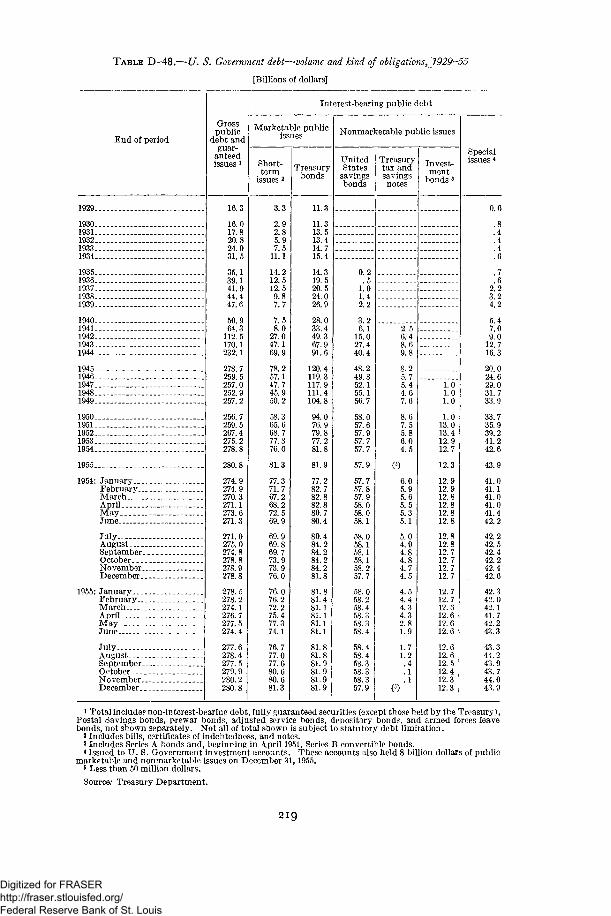
TABLE D—48.—U. S. Government debt—volume and kind of obligations, 1929—55
[Billions of dollars]
End of period
1929
19301931193219331934
19351936193719381939
19401941194219431944
19451946194719481949
19501951195219531954
1955
1954: January__.February..MarchAprilMayJune
JulyAugustSeptemberOctober...November.December.
1955: January.. .February..MarchAprilMayJune
JulyAugustSeptember.October...November.December.
Grosspublic
debt andguar-
anteedissues 1
16.3
16.017.820.824.031.5
35.139.141.944.447.6
50.964.3
112.5170.1232.1
278.7259.5257.0252.9257.2
256.7259.5267.4275.2278.8
280.8
274.9274.9270.3271.1273.6271.3
271.0275.0274.8278.8278.9278.8
278.5278.2274.1276.7277.5274.4
277.6278.4277.5279.9280.2
Interest-bearing public debt
Marketable publicissues
Short-
issues 2
3.3
2.92.85.97.5
11.1
14.212.512.59.87.7
7 58.0
27.047.169.9
78.257.147.745.950.2
58.365.668.777.376.0
81.3
77.371.767.268.272.569.9
69.969.869.773.973.976.0
76.076.272.275.477.374.1
76.777.077.680.680.681.3
Treasurybonds
11.3
11.313.513.414.715.4
14.319.520.524.026.9
28 033.449.367.991.6
120.4119.3117.9111.4104.8
94.076.979.877.281.8
81.9
77.282.782.882.880.780.4
80.484.284.284.284.281.8
81.881.481.181.181.181.1
81.881.881.981.981.981.9
Nonmarketable public issues
UnitedStates
savingsbonds
0.2.5
1.01.42.2
3 26.1
15.027.440.4
48.249.852.155.156.7
58.057.657.957.757.7
57.9
57.757.857.958.058.058.1
58.058.158.158.158.257.7
58.058.258.458.358. 358.4
58.458.458.358.358.357.9
Treasurytax andsavingsnotes
2.56.48.69.8
8.25.75.44.67.6
8.67.55.86.04.5
(5)
6.05.95.65.55.35.1
5.04.94.84.84.74.5
4.54.44.34.32.81.9
1.71.2.4. 1. 1
(5)
Invest-
bonds 3
1.01.01.0
1.013.013.412.912.7
12.3
12.912.912.812.812.812.8
12.812.812.712.712.712.7
12.712.712.612.612.612.6
12.612.612.512.412.312.3
Specialissues 4
0.6
.4
.4
.4
.6
2.23.24.2
5.47.09.0
12.716.3
20.024.629.031.733.9
33.735.939.241.242,6
43.9
41.041.141.041.041.442.2
42.242.542.442.242.442.6
42.342.042.141.742.243.3
43.344.243.943.744.043. 9
1 Total include? non-interest-bearing debt, fully guaranteed securities (except those held by the Treasury),Postal Savings bonds, prewar bonds, adjusted service bonds, depositary bond?, and armed forces leavebonds, not shown separately. Not all of total shown is subject to statutory debt limitation.
2 Includes bills, certificates of indebtedness, and notes.3 Includes Series A bonds and, beginning in April 1951, Series B convertible bonds.4 Issued to U. S. Government investment accounts. These accounts also held 8 billion dollars of public
marketable and nonmarketable issues on December 31,1955.8 Less than 50 million dollars.
Source: Treasury Department.
219
Digitized for FRASER http://fraser.stlouisfed.org/ Federal Reserve Bank of St. Louis
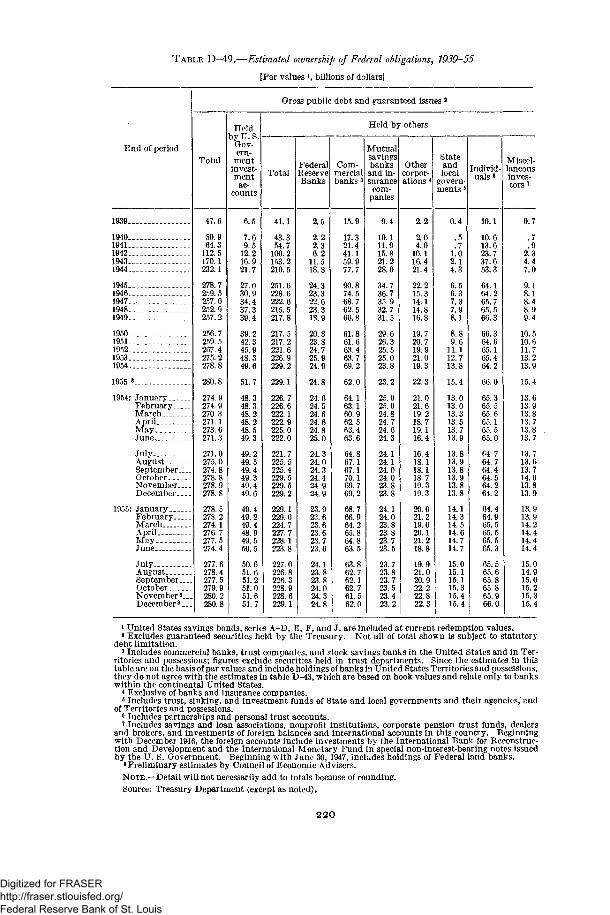
TABLE D-49.—Estimated ownership of Federal obligations, 1939-55
[Par values 1, billions of dollars]
End of period
1939.
19401941194219431944
194519461947...19481949
19501951195219531954
1955 8
1954: JanuaryFebruaryMarchAprilMayJune
JulyAugustSeptember..OctoberNovember...December-_.
1955: JanuaryFebruary....MarchAprilMay ._.June
July _AugustSeptember..OctoberNovember 8_December8.
Gross public debt and guaranteed issues 2
Total
Heldby U.S.
Gov-ern-ment
invest-ment
ac-counts
47.6
50.964.3
112.5170.1232.1
278.7259.5257. 0252.9257.2
256.7259.5267. 4275. 2278.8
274.9274.9270. 3271.1273.6271.3
271.0275.0274.8278. 8278.9278.8
278.5278. 2274.1276.7277.5274.4
277.6278.4277.5279.9280.2280.8
6.5
9.512.216.921.7
27.030.934.437.339.4
39.242.345.948.349.6
51.7
48.348.348.248.248.549.3
49.249.549.449.349.449.6
49.449.249.448.949.550.5
50.651.651.251.051.651.7
Held by others
TotalFederalReserveBanks
41.1
43.354.7
100.2153. 2210.5
251. 6228.6222.6215.5217.8
217.5217.2221.6226.9229.2
229.1
226.7226.6222.1222.9225.0222.0
221.7225.5225.4229.5229. 5229.2
229.1229.0224.7227.7228.1223.8
227.0226.8226.3228.9228.6229.1
2.22.36.2
11.518.8
24.323.322.623.318.9
20.823.824.725.924.9
24.8
24.624.524.624.624.825.0
24.324.024.324.424.924.9
23.923.623.623.623.723.6
24.123.823.824.024.324.8
Com-mercialbanks 3
Mutualsavingsbanksand in-surancecom-
panies
15.9
17.321.441.159.977.7
90.874.568.762.566.8
61.861.663.463.769.2
62.0
64.163.160.962.563.463.6
67.167.170.169.769.2
68.766.964.265.864.863.5
63.862.762.162.761.562.0
9.4
10.111.915.821.228.0
34.736.735.932.731.5
29.626.325.525.023.8
23.2
25.025.024.824.724.624.3
24.124.124.024.023.823.8
24.124.023.823.823.723.5
23.723.823.723.523.423.2
Othercorpor-ations 4
2.2
2.04.0
10.116.421.4
22.215.314.114.816.8
19.720.719.921.019.3
22.3
21.021.619.218.719.116.4
16.418.118.118.719.319.3
20.021.219.020.121.218.8
19.921.020.922.222.822.3
Stateandlocal
govern-ments 5
Individ-uals 6
0.4
.5
.71.02.14.3
6.56.37.37.98.1
11.112.713.8
15.4
13.013.013.313.513.713.9
13.813.913.813.913.813.8
14.114.314.514.614.714.7
15.015.115.115.315.415.4
10.1
10.613.623.737.653.3
64.164.265.765. 566.3
66.364.665.165.464.2
66.0
65.365.565.665.165.565.0
64.764.764.464.564.264.2
64.464.965.565.565.565.3
65.565.665.865.865.966.0
Miscel-laneousinves-tors 7
0.7
2.34.47.0
9.18.18.48.99.4
10.510.611.713.213.9
15.4
13.613.913.813.713.813.7
13.713.613.714.013.813.9
13.913.914.214.414.414.4
15.014.915.015.215.315.4
1 United States savings bonds, series A-D, E, F, and J, are included at current redemption values.3 Excludes guaranteed securities held by the Treasury. Not all of total shown is subject to statutorydebt limitation.
s Includes commercial banks, trust companies, and stock savings banks in the United States and in Ter-ritories and possessions; figures exclude securities held in trust departments. Since the estimates in thistable are on the basis of par values and include holdings of banks in United States Territories and possessions,they do not agree with the estimates in table D-43, which are based on book values and relate only to bankswithin the continental United States.
4 Exclusive of banks and insurance companies.5 Includes trust, sinking, and investment funds of State and local governments and their agencies,'andof Territories and possessions.6 Includes partnerships and personal trust accounts.7 Includes savings and loan associations, nonprofit institutions, corporate pension trust funds, dealersand brokers, and investments of foreign balances and international accounts in this country. Beginningwith December 1946, the foreign accounts include investments by the International Bank for Reconstruc-tion and Development and the International Monetary Fund in special non-interest-bearing notes issuedby the U. S. Government. Beginning with June 30, 1947, includes holdings of Federal land banks.8 Preliminary estimates by Council of Economic Advisers.
NOTE.—Detail will not necessarily add to totals because of rounding.Source: Treasury Department (except as noted).
220
Digitized for FRASER http://fraser.stlouisfed.org/ Federal Reserve Bank of St. Louis
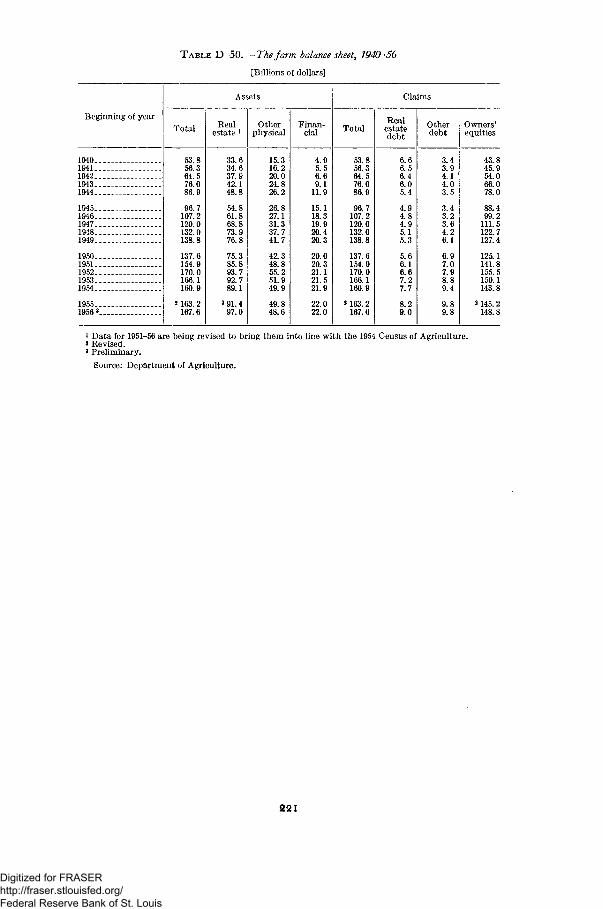
TABLE D-50.—-The farm balance sheet, 1940--56
[Billions of dollars]
Beginning of year
19401941194219431944
19451946194719481949
19501951195219531954 . _
19551956 3
Assets
Total
53.856.364.576.086.9
96.7107.2120.0132.0138.8
137.6154.9170.0166.1160.9
2 163. 2167.6
Realestate "•
33.634.637.942.148.8
54.861.868.873.976.8
75.385.893.792.789.1
2 91.497.0
Otherphysical
15.316.220.024.826.2
26.827.131.337.741.7
42.348.855.251.949.9
49.848.6
Finan-cial
4.95.56.69.1
11.9
15.118.319.920.420.3
20.020.321.121.521.9
22.022.0
Claims
Total
53.856.364.576.086.9
96.7107.2120.0132.0138.8
137.6154.9170.0166.1160.9
2 163.2167.6
Realestatedebt
6.66.56.46.05.4
4.94.84.95.15.3
5.66.16.67.27.7
8.29.0
Otherdebt
3.43.94.14.03.5
3.43.23.64.26.1
6.97.07.98.89.4
9.89.8
Owners'equities
43.845.954.066.078.0
88.499.2
111.5122.7127.4
125.1141.8155.5150.1143.8
2145.2148.8
1 Data for 1951-56 are being revised to bring them into line with the 1954 Census of Agriculture.2 Revised.3 Preliminary.
Source: Department of Agriculture.
221
Digitized for FRASER http://fraser.stlouisfed.org/ Federal Reserve Bank of St. Louis
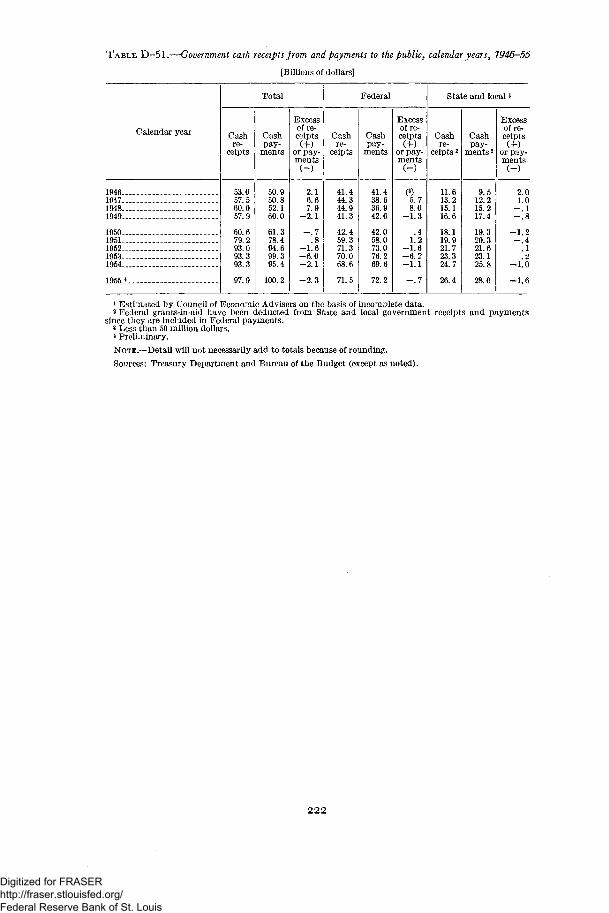
TABLE D-51.—Government cash receipts from and payments to the public, calendar years, 1946-55
[Billions of dollars]
Calendar year
1946 _- -194719481949
19501951195219531954 __
1955*
Total
Cashre-
ceipts
53.057 560 057.9
60.679 293.093 393 3
97.9
Cashpay-
ments
50.950 852.160.0
61.378 494.699 395.4
100.2
Excessof re-ceipts
(-{-)or pay-ments
2.16 67 9
- 2 . 1
- . 78
- 1 . 6—6 0- 2 . 1
- 2 . 3
Federal
Cashre-
ceipts
41.444 344.941.3
42.459 371.370 068.6
71.5
Cashpay-
ments
41.438 636.942.6
42.058 073.076 269.6
72.2
Excessof re-ceipts("f")
or pay-ments
(3)5 78.0
- 1 . 3
.41.2
- 1 . 6—6 2- 1 . 1
- . 7
State and local1
Cashre-
ceipts 2
11.613 215 116.6
18.119 921.723 324 7
26.4
Cashpay-
ments 2
9.512 215 217.4
19.320 321.623 125.8
28.0
Excessof re-ceipts
(4~)or pay-ments
2 01 0
— l- 8
- 1 . 2— 4
. 12
—1 0
- 1 . 6
1 Estimated by Council of Economic Advisers on the basis of incomplete data.2 Federal grants-in-aid have been deducted from State and local government receipts and payments
since they are included in Federal payments.3 Less than 50 million dollars.4 Preliminary.
NOTE.—Detail will not necessarily add to totals because of rounding.
Sources: Treasury Department and Bureau of the Budget (except as noted).
222
Digitized for FRASER http://fraser.stlouisfed.org/ Federal Reserve Bank of St. Louis
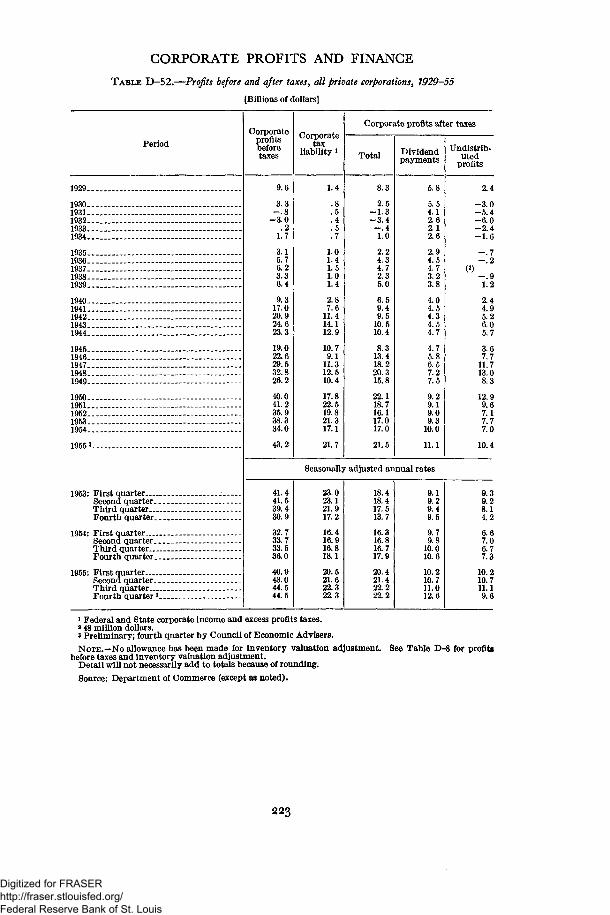
CORPORATE PROFITS AND FINANCE
TABLE D-52.—Profits before and after taxes, all private corporations, 1929-55
[Billions of dollars]
Period
1929
193019311932 _19331934
1935 _ _1936 _ _19371938 -1939
19401941 _ ___194219431944 _
1945 __1946 -1947 .19481949
19501951 .__ _ . .1952 _.-1953 _ _1954 _ _
I9553
1953* First quarterSecond quarterThird quarterFourth quarter
1954* First quarterSecond quarterThird quarter - -Fourth quarter
1955* First quarterSecond quarter - - -Third quarterFourth quarter ' _ - -
Corporateprofitsbeforetaxes
9.6
3.3- . 8
-3 .0. 2
1.7
3.15.76.23.36.4
9.317.020.924.623.3
19.022.629.532.826.2
40.041.235.938.334.0
43.2
Corporatetax
liability 1
1.4
.8
.5
. 4
. 5
.7
1.01.41.51.01.4
2.87.6
11.414.112.9
10.79.1
11.312.510.4
17.822.519.821.317.1
21.7
Corporate profits after taxes
Total
8.3
2.5- 1 . 3-3 .4
- . 41.0
2.24.34.72.35.0
6.59.49.5
10.510.4
8.313.418.220.315.8
22.118.716.117.017.0
21.5
Dividendpayments
5.8
5.54.12.62.12.6
2.94.54.73.23.8
4.04.54.34.54.7
4.75.86.57.27.5
9.29.19.09.3
10.0
11.1
Undistrib-uted
profits
2.4
-3 .0—5.4-6 .0—2.4- 1 . 6
- . 7—.2
(2)—.91.2
2.44.95.26.05.7
3.67.7
11.713.08.3
12.99.67.17.77.0
10.4
Seasonally adjusted annual rates
41.441.539.430.9
32.733.733.536.0
40.943.044.544.5
23.023.121.917.2
16.416.916.818.1
20.521.622.322.3
18.418.417.513.7
16.316.816.717.9
20.421.422.222.2
9.19.29.49.5
9.79.8
10.010.6
10.210.711.012.6
9.39.28.14.2
6.67.06.77.3
10.210.711.19.6
1 Federal and State corporate income and excess profits taxes.2 48 million dollars.3 Preliminary; fourth quarter by Council of Economic Advisers.
NOTE.—No allowance has been made for inventory valuation adjustment. See Table D-8 for profitsbefore taxes and inventory valuation adjustment.
Detail will not necessarily add to totals because of rounding.
Source: Department of Commerce (except as noted).
223
Digitized for FRASER http://fraser.stlouisfed.org/ Federal Reserve Bank of St. Louis
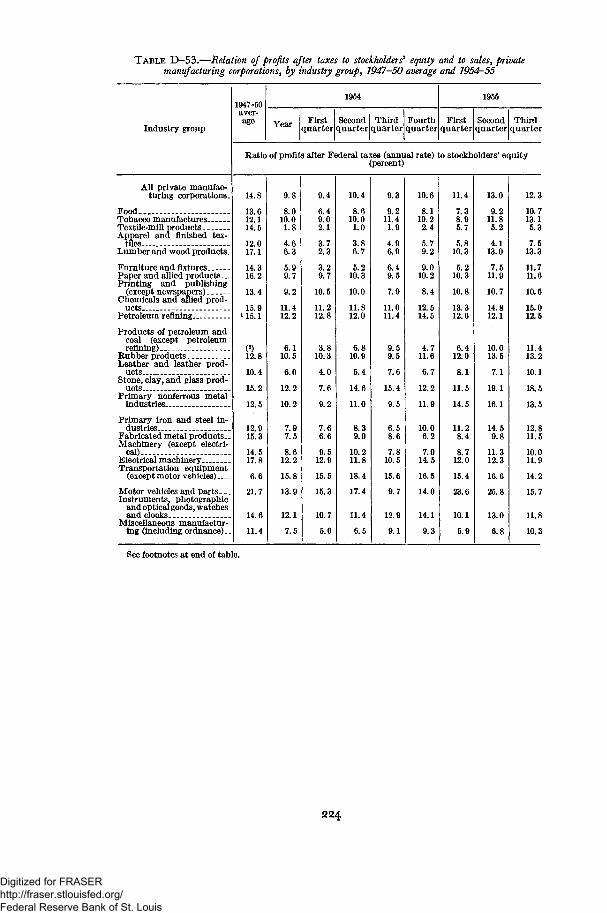
TABLE D—53.—Relation of profits after taxes to stockholders9 equity and to sales, privatemanufacturing corporations, by industry group, 1947—50 average and 1954-55
Industry group
1947-50aver-
1954
Year First Second Third Fourthquarter quarter quarter quarter quarter quarter quarter
1955
First Second Third
Ratio of profits after Federal taxes (annual rate) to stockholders' equity(percent)
All private manufac-turing corporations.
FoodTobacco manufacturesTextile-mill productsApparel and finished tex-
tilesLumber and wood products.
Furniture and fixturesPaper and allied products-Printing and publishing
(except newspapers)Chemicals and allied prod-
uctsPetroleum refining
Products of petroleum andcoal (except petroleumrefining)
Rubber productsLeather and leather prod-
uctsStone, clay, and glass prod-
uctsPrimary nonferrous metal
industries
Primary iron and steel in-dustries
Fabricated metal products..Machinery (except electri-
cal)Electrical machineryTransportation equipment
(except motor vehicles)
Motor vehicles and parts- _.Instruments, photographic
and optical goods, watchesand clocks
Miscellaneous manufactur-ing (including ordnance)..
14.8
13.612.114.5
12.017.1
14.316.2
13.4
15.9U5.1
(2)12.8
10.4
15.2
12.5
12.915.3
14.517.8
6.6
21.7
14.6
11.4
9.8
8.010.01.8
4.66.3
5.99.7
9.2
11.412.2
6.110.5
6.0
12.2
10.2
7.97.5
8.612.2
15.8
13.9
12.1
7.5
9.4
6.49.02.1
3.72.3
3.29.7
10.5
11.212.8
3.810.3
4.0
7.6
9.2
7.66.6
9.512.9
15.5
15.3
10.7
5.0
10.4
8.610.01.0
3.86.7
5.210.3
10.0
11.812.0
6.810.9
5.4
14.6
11.0
8.39.0
10.211.8
18.4
17.4
11.4
6.5
9.3
9.211.41.9
4.96.9
6.49.5
7.9
11.011.4
9.59.5
7.6
15.4
9.5
6.58.6
7.810.5
15.6
9.7
12.9
9.1
10.6
8.110.22.4
5.79.2
9.010.2
8.4
12.514.5
4.711.6
6.7
12.2
11.9
10.06.2
7.014.5
16.5
14.0
14.1
9.3
11.4
7.38.95.7
5.810.3
5.210.3
10.8
13.312.6
6.412.0
8.1
11.5
14.5
11.28.4
8.712.0
15.4
23.6
10.1
5.9
13.0
9.211.85.2
4.113.0
7.511.9
10.7
14.812.1
10.013.5
7.1
19.1
16.1
14.59.8
11.312.3
16.6
25.8
13.0
6.8
12.3
10.713.15.3
7.513.3
11.711.6
10.6
15.012.5
11.413.2
10.1
18.5
13.5
12.811.5
10.011.9
14.2
15.7
11.8
10.3
See footnotes at end of table.
224
Digitized for FRASER http://fraser.stlouisfed.org/ Federal Reserve Bank of St. Louis
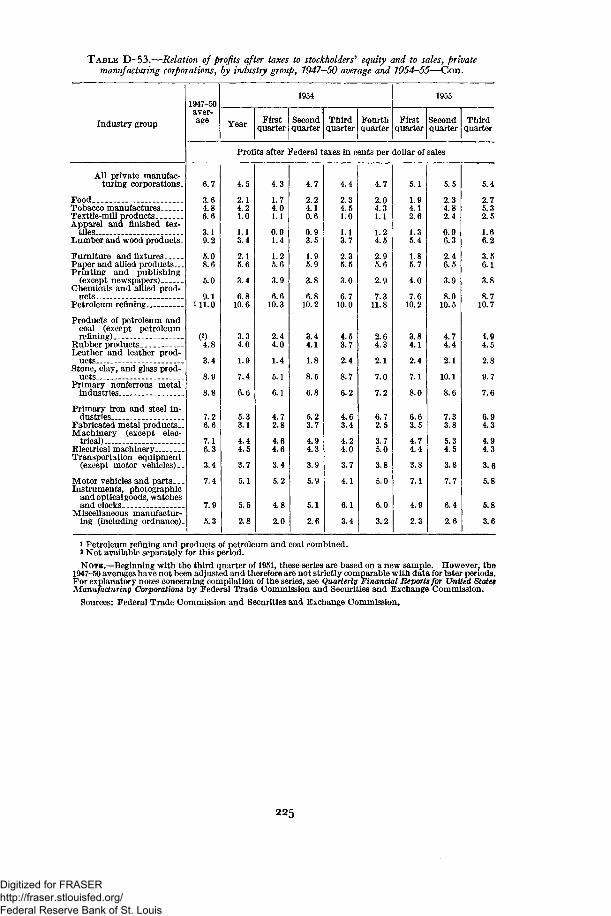
TABLE D-53.—Relation of profits after taxes to stockholders' equity and to sales, privatemanufacturing corporations, by industry group, 1947—50 average and 1954—55—Con.
Industry group
1947-50aver-
1954
Year Firstquarter
Secondquarter
Thirdquarter
Fourthquarter
1955
Firstquarter
Secondquarter
Thirdquarter
Profits after Federal taxes in cents per dollar of sales
All private manufac-turing corporations.
FoodTobacco manufacturesTextile-mill productsApparel and finished tex-
tilesLumber and wood products.
Furniture and fixturesPaper and allied products...Printing and publishing
(except newspapers)Chemicals and allied prod-
uctsPetroleum refining
Products of petroleum andcoal (except petroleumrefining)
Rubber productsLeather and leather prod-
ucts.Stone, clay, and glass prod-
uctsPrimary nonferrous metal
industries
Primary iron and steel in-dustries
Fabricated metal products-Machinery (except elec-
trical)Electrical machineryTransportation equipment
(except motor vehicles)..
Motor vehicles and parts. _.Instruments, photographic
and optical goods, watchesand clocks
Miscellaneous manufactur-ing (including ordnance).
6.7
3.64.86.6
3.19.2
5.08.6
5.0
9.1i l l .O
(2)4.8
3.4
8.9
8.8
7.26.6
7.16.3
3.4
7.4
7.9
5.3
4.5
2.14.21.0
1.13.4
2.15.6
3.4
6.810.6
3.34.0
1.9
7.4
6.6
5.33.1
4.44.5
3.7
5.1
5.5
2.8
4.3
1.74.01.1
0.91.4
1.25.6
3.9
6.610.3
2.44.0
1.4
5.1
6.1
4.72.8
4.64.6
3.4
5.2
4.8
2.0
4.7
2.24.10.6
0.93.5
1.95.9
3.8
6.810.2
3.44.1
1.8
8.5
6.8
5.23.7
4.94.3
3.9
5.9
5.1
2.6
4.4
2.34.51.0
1.13.7
2.35.5
3.0
6.710.0
4.53.7
2.4
8.7
6.2
4.63.4
4.24.0
3.7
4.1
6.1
3.4
4.7
2.04.31.1
1.24.5
2.95.6
2.9
7.311.8
2.64.3
2.1
7.0
7.2
6.72.5
3.75.0
3.8
5.0
6.0
3.2
5.1
1.94.12.6
1.35.4
1.85.7
4.0
7.610.2
3.84.1
2.4
7.1
8.0
6.63.5
4.74.4
3.8
7.1
4.9
2.3
5.5
2.34.82.4
0.96.3
2.46.5
3.9
8.010.5
4.74.4
2.1
10.1
8.6
7.33.8
5.34.5
3.8
7.7
6.4
2.6
5.4
2.75.32.5
1.66.2
3.56.1
3.8
8.710.7
4.9
4.5
2.8
9.7
7.6
6.94.3
4.94.3
3.6
5.8
5.8
3.6
1 Petroleum refining and products of petroleum and coal combined.2 Not available separately for this period.NOTE.—Beginning with the third quarter of 1951, these series are based on a new sample. However, the
1947-50 averages have not been adjusted and therefore are not strictly comparable with data for later periods.For explanatory notes concerning compilation of the series, see Quarterly Financial Reports for United StatesManufacturing Corporations by Federal Trade Commission and Securities and Exchange Commission.
Sources: Federal Trade Commission and Securities and Exchange Commission.
225
Digitized for FRASER http://fraser.stlouisfed.org/ Federal Reserve Bank of St. Louis
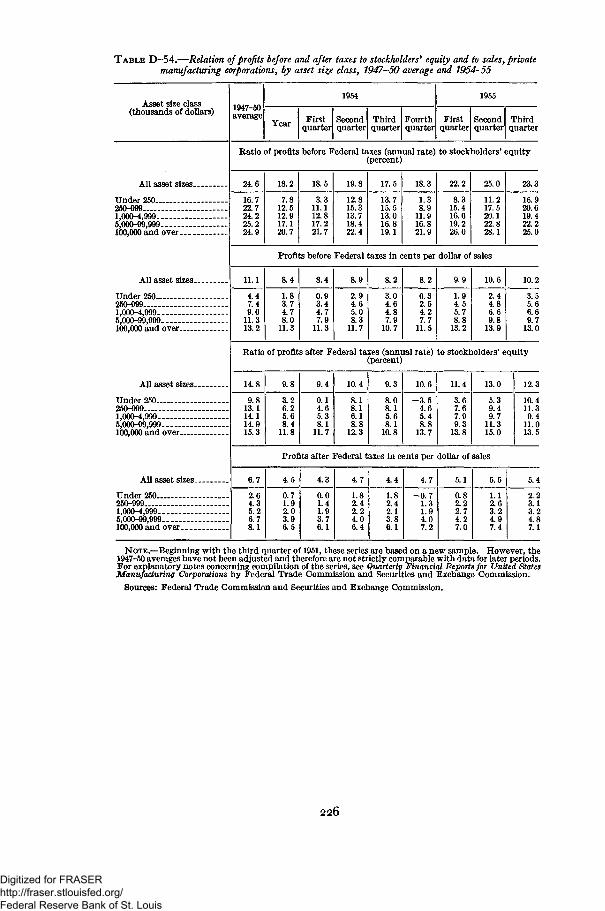
TABLE D—54.—Relation of profits before and after taxes to stockholders* equity and to sales, privatemanufacturing corporations, by asset size class, 1947—50 average and 1954-55
Asset size class(thousands of dollars) 1947-50
average
1954
YearFirst
quarterSecondquarter
Thirdquarter
Fourthquarter
1955
Firstquarter
Secondquarter
Thirdquarter
Ratio of profits before Federal taxes (annual rate) to stockholders' equity(percent)
All asset sizes.
Under 250250-999 _1,000-4,9995,000-99,999.100,000 and over
All asset sizes.
Under 250250-9991,000-4,9995,000-99,999100,000 and over
All asset sizes.
Under 250250-9991,000-4,9995,000-99,999100,000 and over
All asset sizes..
Under 250250-9991,000-4,9995,000-99,999-100,000 and over_
24.6
16.722.724.225.224.9
18.2
7.812.512.917.120.7
18.5
3.311.112.817.221.7
19.8
12.815.313.718.422.4
17.5
13.715.513.016.819.1
18.3
1.38.9
11.916.821.9
22.2
8.315.416.619.226.0
25.0
11.217.520.122.828.1
23.3
16.920.619.422.225.0
Profits before Federal taxes in cents per dollar of sales
11.1
4.47.49.0
11.313.2
8.4
1.83.74.78.0
11.3
8.4
0.93.44.77.9
11.3
8.9
2.94.65.08.3
11.7
8.2
3.04.64.87.9
10.7
8.2
0.32.54.27.7
11.5
9.9
1.94.55.78.8
13.2
10.6
2.44.86.69.8
13.9
10.2
3.55.66.69.7
13.0
Ratio of profits after Federal taxes (annual rate) to stockholders' equity(percent)
14.8
9.813.114.114.915.3
9.8
3.26.25.68.4
11.8
9.4
0.14.65.38.1
11.7
10.4
8.18.16.18.8
12.3
9.3
8.08.15.68.1
10.8
10.6
- 3 . 54.65.48.8
13.7
11.4
3.67.67.99.3
13.8
13.0
5.39.49.7
11.315.0
12.3
10.411.39.4
11.013.5
Profits after Federal taxes in cents per dollar of sales
6.7
2.64.35.26.78.1
4.5
0.71.92.03.96.5
4.3
0.01.41.93.76.1
4.7
1.82.42.24.06.4
4.4
1.82.42.13.86.1
-0.71.31.94.07.2
5.1
0.82.22.74.27.0
5.5
1.12.63.24.97.4
2.23.13.24.87.1
NOTE.—Beginning with the third quarter of 1951, these series are based on a new sample. However, the1947-50 averages have not been adjusted and therefore are not strictly comparable with data for later periods.For explanatory notes concerning compilation of the series, see Quarterly Financial Reports for United StatesManufacturing Corporations by Federal Trade Commission and Securities and Exchange Commission.
Sources: Federal Trade Commission and Securities and Exchange Commission.
226
Digitized for FRASER http://fraser.stlouisfed.org/ Federal Reserve Bank of St. Louis
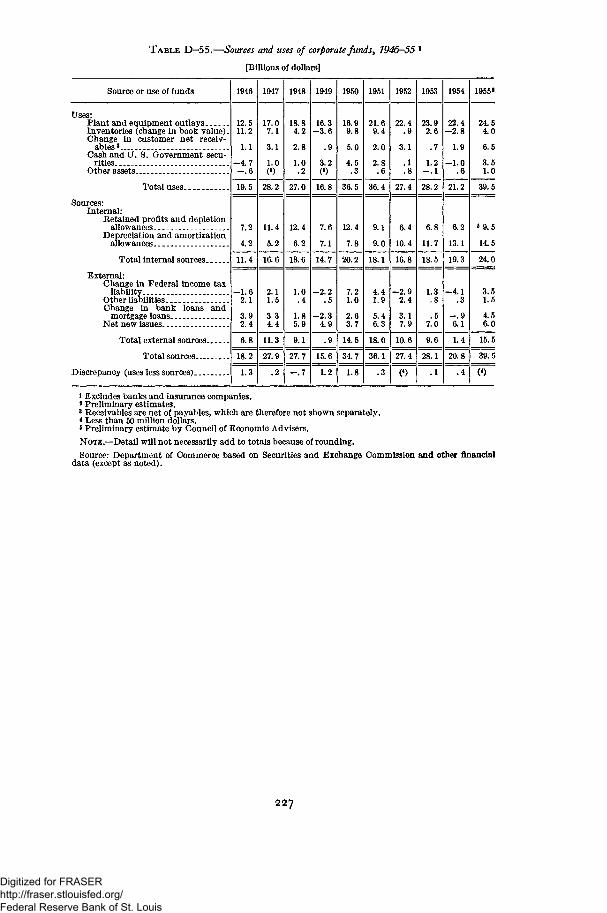
TABLE D-55.—Sources and uses of corporate funds, 1946-55 l
[Billions of dollars]
Source or use of funds
Uses:Plant and equipment outlaysInventories (change in book value) -Change in customer net receiv-
ables 8
Cash and IT. S. Government secu-rities
Other assets .__
Total uses
Sources:Internal:
Retained profits and depletionallowances
Depreciation and amortizationallowances
Total internal sources.
External:Change in Federal income tax
liabilityOther liabilitiesChange in bank loans and
mortgage loansNet new issues _..
Total external sources
Total sources
Discrepancy (uses less sources)
1946
12.511.2
1.1
- 4 . 7- . 6
19.5
7.2
4.2
11.4
- 1 . 62.1
3.92.4
6.8
18.2
1.3
1947
17.07.1
3.1
1.0(*)
28.2
11.4
5.2
16.6
2.11.5
3.34.4
11.3
27.9
.2
1948
18.84.2
2.8
1.0.2
27.0
12.4
6.2
18.6
1.0.4
1.85.9
9.1
27.7
- . 7
1949
16.3- 3 . 6
.9
3.2(4)
16.8
7.6
7.1
14.7
- 2 . 2.5
- 2 . 34.9
.9
15.6
1.2
1950
16.99.8
5.0
4.5.3
36.5
12.4
7.8
20.2
7.21.0
2.63.7
14.5
34.7
1.8
1951
21.69.4
2.0
2.8.6
36.4
9.1
9.0
18.1
4.41.9
5.46.3
18.0
36.1
.3
1952
22.4.9
3.1
.1
.8
27.4
6.4
10.4
16.8
—2.92.4
3.17.9
10.6
27.4
(4)
1953
23.92.6
.7
1.2- . 1
28.2
6.8
11.7
18.5
1.3.8
.57.0
9.6
28.1
.1
1954
22.4- 2 . 8
1.9
- 1 . 0.6
21.2
6.2
13.1
19.3
- 4 . 1.3
- . 96.1
1.4
20.8
.4
1955 *
24.54.0
6.5
3.51.0
39.5
»9.5
14.5
24.0
3.51.5
4.56.0
15.5
39.5
(4)
i Excludes banks and insurance companies.* Preliminary estimates.3 Receivables are net of payables, which are therefore not shown separately.* Less than 50 million dollars.8 Preliminary estimate by Council of Economic Advisers.
NOTE.—Detail will not necessarily add to totals because of rounding.
Source: Department of Commerce based on Securities and Exchange Commission and other financialdata (except as noted).
227
Digitized for FRASER http://fraser.stlouisfed.org/ Federal Reserve Bank of St. Louis
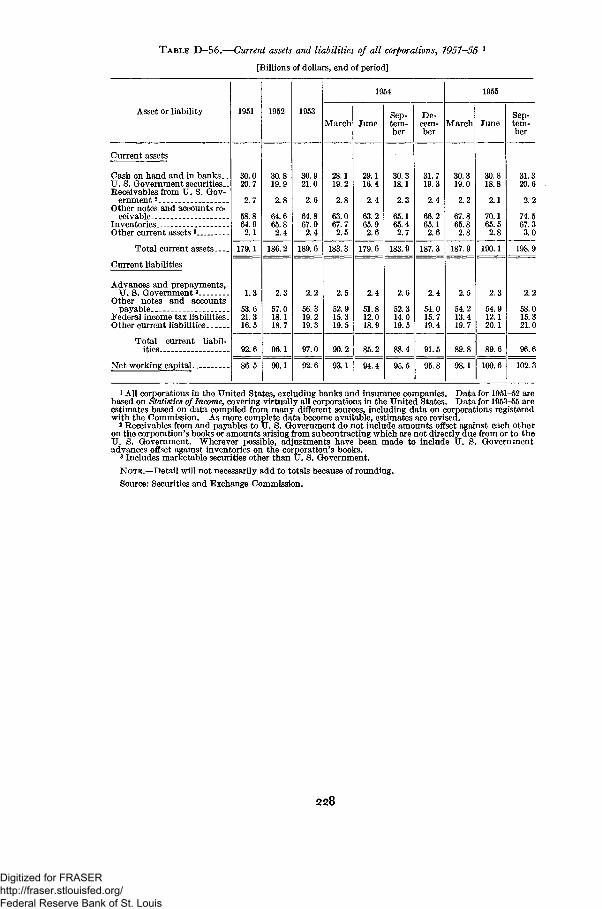
TABLE D-56.—Current assets and liabilities of all corporations, 1951-55 l
[Billions of dollars, end of period]
Asset or liability
Current assets
Cash on hand and in banks . .U. S. Government securities..Receivables from U. S. Gov-
ernment 2
Other notes and accounts re-ceivable . - -
InventoriesOther current assets 3 _._
Total current assets
Current liabilities
Advances and prepayments,U. S. Government2
Other notes and accountspayable
Federal income tax liabilities.Other current liabilities.. __.
Total current liabil-ities
Net working capital _.
1951
30.020.7
2.7
58.864.92.1
179.1
1.3
53.621.316.5
92.6
86.5
1952
30.819.9
2.8
64.665.82.4
186.2
2.3
57.018.118.7
96.1
90.1
1953
30.921.0
2.6
64.867.92.4
189.6
2.2
56.319.219.3
97.0
92.6
1954
March
28.119.2
2.8
63.067.72.5
183.3
2.5
52.915.319.5
90.2
93.1
June
29.116.4
2.4
63.265.92.6
179.6
2.4
51.812.018.9
85.2
94.4
Sep-tem-ber
30.318.1
2.3
65.165.42.7
183.9
2.6
52.314.019.5
88.4
95.5
De-cem-ber
31.719.3
2.4
66.265.12.6
187.3
2.4
54 015.719.4
91.5
95.8
1955
March
30.319.0
2.2
67.865.82.8
187.9
2.5
54.213.419.7
89.8
98.1
June
30.818.8
2.1
70.165.52.8
190.1
2.3
54.912.120.1
89.6
100.6
Sep-tem-ber
31.320.6
2.2
74.567.33.0
198.9
2.2
58.015.321.0
96.6
102.3
1 All corporations in the United States, excluding banks and insurance companies. Data for 1951-52 arebased on Statistics of Income, covering virtually all corporations in the United States. Data for 1953-55 areestimates based on data compiled from many different sources, including data on corporations registeredwith the Commission. As more complete data become available, estimates are revised.
2 Receivables from and payables to U. S. Government do not include amounts offset against each otheron the corporation's books or amounts arising from subcontracting which are not directly due from or to theU. S. Government. Wherever possible, adjustments have been made to include U. S. Governmentadvances offset against inventories on the corporation's books.
3 Includes marketable securities other than U. S. Government.
NOTE.—Detail will not necessarily add to totals because of rounding.
Source: Securities and Exchange Commission.
228
Digitized for FRASER http://fraser.stlouisfed.org/ Federal Reserve Bank of St. Louis
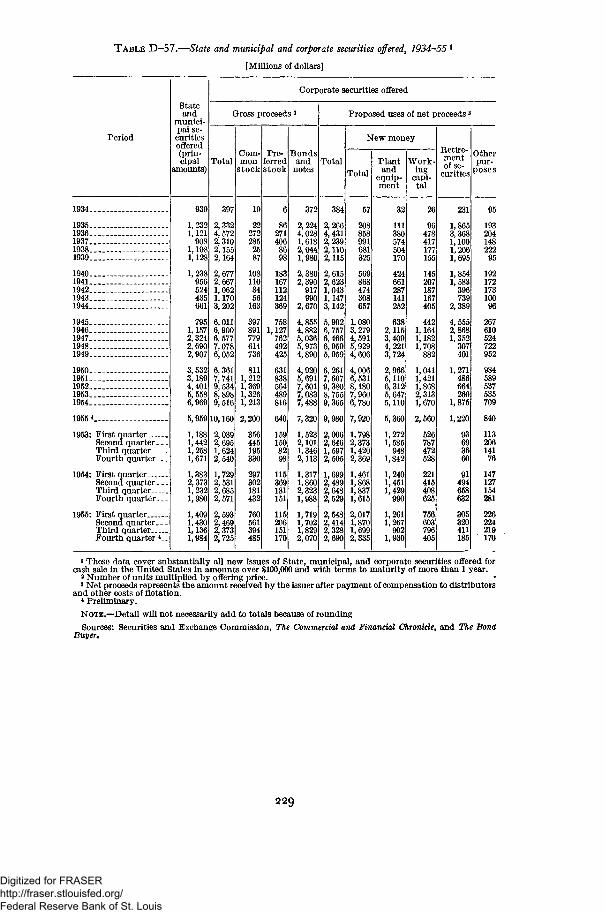
TABLE D—57.—State and municipal and corporate securities offered, 1934—551
[Millions of dollars]
Period
Stateand
munici-pal se-curitiesoffered(prin-cipal
amounts)
Corporate securities offered
Gross proceeds *
TotalCom- Pre-
ferredstock stock
Bondsand
notes
Proposed uses of net proceeds 3
TotalTotal
New money-
Plantand
equip-ment
Working
capi-tal
Retire-mentof se-
curities
Otherpur-poses
1934
19351936193719381939
19401941194219431944
19451946194719481949 _.
19501951195219531954
1955 4
1953: First quarterSecond quarter-_Third quarterFourth quarter..
1954: First quarterSecond quarter- _Third quarter....Fourth quarter..
1955: First quarterSecond quarter. _Third quarter....Fourth quarter 4_
1,2321,121908
1,1081,128
1,238956524435661
7951,1572,3242,6902,907
3,532
4,4015,558
397
2,3324,5722,3102,1552,164
2,6772,6671,0621,1703,202
6,0116,9006,5777,0786,052
6,3617,7419,534
9,516
5,959 10,160
1,"1,4421,2581,671
1,3832,3731,232i r ~
1,4091,4301,136lf~
2,0392,6951,6242,540
1,7292,5312,6852,571
2,5932,4692,3732,725
222722852587
1081103456163
397891779614736
8111,2121,3""1,31,213
2,200
356445195330
302181432
760561394485
271406
183167112124
7581,127762492425
631838564489816
640
15915082
115369181151
115206151170
372
2,2244,0281,6182,044i r ~ -2,3862,390
917990
2,670
4,855
4,r~5,<_..5,9734,8904,9205,6917,6017,0837,488
7,320
1,5232,1011,3462,113
1,3171,8602,3231,9""
1,7191,7021,8""2,070
384
2,2664,4312,2392,1102,115
2,6152,6231,0431,1473,142
5,9026,7576,4666,9595,959
6,2617,6079,3808,7559,365
2,0062,6461,5972,505
1,62,4892,6482,529
2,5482,4142,3282,690
57
208858991681
569868474308657
3,2794,5915,9294,606
4,0066,5318,1807,9606,780
7,920
I,1
2,3731,420
1,4611,8681,8371,615
2,0171,8701,6992,335
32
111380574504170
424661287141252
2,1153,4094,2213,724
2,9665,1106,3125,6475,110
5,360
1,2721,585948
1,842
1,2401,4511,429990
1,2611,267902
1,930
26
96478417177155
145207187167405
4421,1641,1821,708
1,0411,4211,8682,3131,670
526787472528
221415408625
756603796405
231
1,8653,3681,1001,2061,695
1,8541,
739
4,555
1,352307401
1,271486664260
1,875
1,220
91494658632
305320411185
95
19320414822295
192172173100
267610524722952
984589537535709
840
11320614176
147127154281
224219170
1 These data cover substantially all new issues of State, municipal, and corporate securities offered forcash sale in the United States in amounts over $100,000 and with terms to maturity of more than 1 year.
2 Number of units multiplied by offering price.3 Net proceeds represents the amount received by the issuer after payment of compensation to distributorsand other costs of flotation.
* Preliminary.NOTE.—Detail will not necessarily add to totals because of roundingSources: Securities and Exchange Commission, The Commercial and Financial Chronicle, and The Bond
Buyer,
229
Digitized for FRASER http://fraser.stlouisfed.org/ Federal Reserve Bank of St. Louis
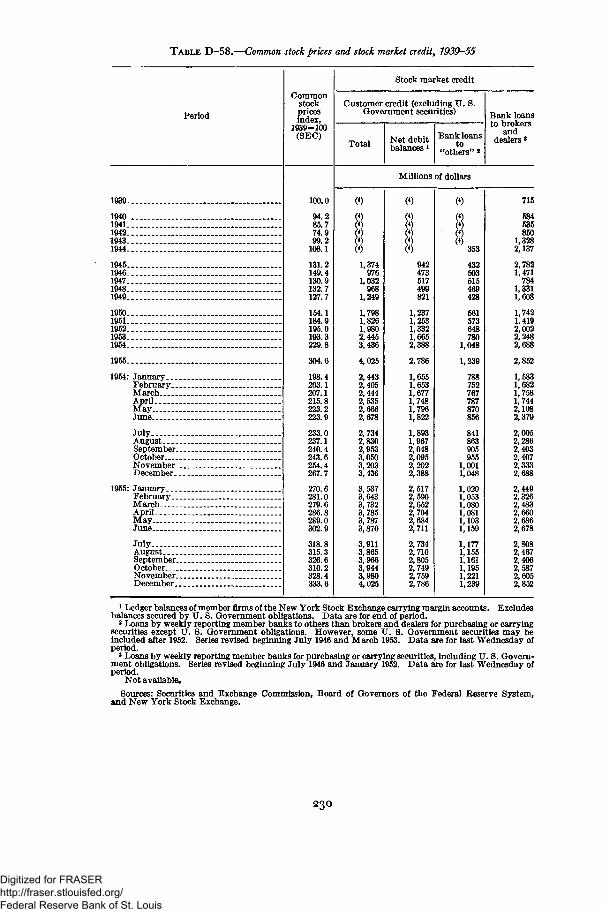
TABLE D-58.—Common stock prices and stock market credit, 1939-55
Period
Commonstockpricesindex,
1939=100(SEC)
Stock market credit
Customer credit (excluding U. S.Government securities)
Total Net debitbalances *
Bank loansto
"others" J
Bank loansto brokers
anddealers 3
Millions of dollars
1939
19401941.19421943__1944..
19451946..194719481949
19501951_19521953...1954 _
1955
1954: January. . .February..MarchAprilMayJune
JulyAugustSeptember.October....November.December.
1955: January. . .February..MarchApril.MayJune.
JulyAugustSeptember.October....November.December.
100.0
94.285.774.999.2
108.1
131.2149.4130.9132.7127.7
154.1184.9195.0193.3229.8
304.6
198.4203.1207.1215.8223.2223.9
233.0237.1240.4243.6254.4267.7
270.6281.0279.6286.8289.0302.9
318.8315.3326.6310.2328.4333.6
1,374976
1,032968
1,249
1,7981,8261,9802,4453,436
4,025
2,4432,4052,4442,5352,6662,678
2,7342,8302,9533,0503,2033,436
3,5373,6433,7323,7853,7873,870
3,9113,8653,9663,944
4,025
0)(4)(*)(4)
942473517499821
1,2371,2531,3321,6652,388
2,786
1,6551,653',677,748,796,822
,893,967
2,0482,0952,2022,388
2,5172,5902,6522,7042,6842,711
2,7342,7102,8052,7492,7592,786
353
432503515469428
561573648780
1,048
1,239
788752767787870856
841863905955
1,0011,048
1,0201,0531,080:, 081,103,159
,177,155,161,195,221,239
715
584535850
1,3282,137
2,7821,471784
1,3311,608
1,7421,4192,0022,248
2,852
1,5831,6821,7581,7442,1082,379
2,0052,2862,4032,4072,3332,688
2,4492,326
2,6602,6862,678
2,4672,4062,5872,6052,852
1 Ledger balances of member firms of the New York Stock Exchange carrying margin accounts. Excludesbalances secured by U. S. Government obligations. Data are for end of period.
2 Loans by weekly reporting member banks to others than brokers and dealers for purchasing or carryingsecurities except U. S. Government obligations. However, some U. S. Government securities may beincluded after 1952. Series revised beginning July 1946 and March 1953. Data are for last Wednesday ofperiod.
3 Loans by weekly reporting member banks for purchasing or carrying securities, including U. S. Govern-ment obligations. Series revised beginning July 1946 and January 1952. Data are for last Wednesday ofperiod.
Not available.
Sources: Securities and Exchange Commission, Board of Governors of the Federal Reserve System,and New York Stock Exchange.
230
Digitized for FRASER http://fraser.stlouisfed.org/ Federal Reserve Bank of St. Louis
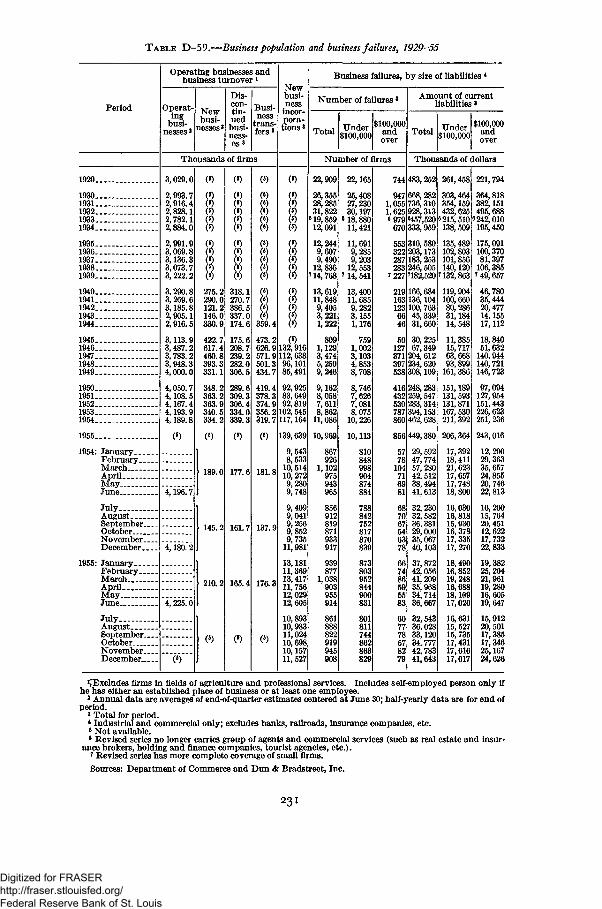
T A B L E D—59.—Business population and business failures, 1929—55
Period
Operating businesses andbusiness turnover 1
Operat-ing
busNewbusi-
nesses3
Dis-con-tin-uedbusi-ness-es 3
Busi-ness
trans-fers3
New-busi-ness
incor-pora-tions 3
Business failures, by size of liabilities *
Number of failures8
Total "0"nderi o t a l $100,000
$100,000andover
Amount of currentliabilities3
TotalU n d e r $100 00000 00
Thousands of firms Number of firms Thousands of dollars
1929..
1930.1931..1932..1933..1934..
1935..1936..1937..1938..1939..
1940..1941..1942..1943..1944..
1945..1946_.1947..1948..1949..
1950..1951..1952..1953..1954..
1955
1954: January. _.February.March..ApApril.May..y_June..
July —AugustSeptember-OctoberNovember. _December..
1955: January.. .February.MarchAprilMayJune _
JulyAugustSeptember..OctoberNovember..December...
3.029.0
2,993.72,916.42.828.12,782.12,884.0
2,991.93.069.83,136.33.073.73, 222.2
3,290.83,269.63,185.82,905.12,916.5
3,113.93.487.23,783. 23.948.34,000.0
4,050.74,108.54.167.44.193.94.189.8
4,196.7
4,180. 2
4,225.0
0s)
275,2290.0121.2146.0330.9
422.7617.4460.8393.3331.1
348.2363.2363.9340.5334.2
189.0
145.2
210.2
318.1270.7386.5337.0174.6
175.6208.7239.2282.0306.5
289.6309.3306.4334.0
177.6
161.7
165.4
00
00
00
88880s)
00
800359.4473.2626.9 132,916571.9 112,638501.3434.7
419.4378.3374.9
96,10185,491
92,92583,64992,819
356.2 102, 545117164319.7
181.8
137.9
176.3
117,164
139,639
9,5438,53310,51410,2729,2809,748
9,4099,0419,2569,8529,73511,981
13,18111,36913,41711,75612,02912,605
10,89310,98311,02410,69810,15711, 527
22,909
26,35528,28531,82219,85912,091
12,2449,6079,49012,83614,768
13,61911,8489,4053,2211,222
8091,1293,4745,2509,246
9,1628,0587,6118,86211,086
10,969
867926
1,102975943965
856912819871933917
939877
1,038903955914
861888822919945908
22,165
25,40827,23030,197
« 18,88011,421
11,6919,2859,20312, 553
7 14, 541
13,40011,6859,2823,1551,176
7591,0023,1034,8538,708
8,7467,6267,0818,07510,226
10,113
810848998904874884
788842752817870839
873803952844900831
801811744862863829
744 483,252
947 668, 282 303,464354,159432,625
6 9796457,5206215,510138, 509
1,055 736,3101,625 928,313
670 333,959
553 310,580322 203,173287 183,253283 246, 505
7 2277182,520
219 166,684163 136,104123 100,763" 45,339
31,66046
50127371397
30, 22567,349204,612234,620
538 308,109
416 248,283432 259,547530 283,314787 394,153860 462, 628
856 449,380
5778104
81
29, 59247,77457, 28042, 51238,49441,613
32,23032,58236,38129,00035,06740,103
37, 87242,05641, 20935,96834,71436,667
32,54336,02833,12034,77742,78341,643
261,458
135,489102,803101,856140,120132,863
119,904100,66080,28631,18414,548
11,38515,71763,66893,899161,386
151,189131,593131,871167,530211,392
206,364
17,39218,41121,62317,65717,74818,800
16,03016,81815,93016,37817,33517,270
18,49016,85219,24816,68818,10917,020
16,63115,52715,73517,43117,61617,017
221,794
364,818382,151495,688242,010195,450
175,091100,37081,397106,3857 49,657
46,78035,44420,47714,15517,112
18,84051,632140,944140,721146,723
97,094127,954151,443226,623251, 236
243,016
12, 20029,36335,65724,85520,74622,813
16,20015,76420,45112,62217,73222,833
19,38225,20421,96119,28016,60519,647
15,91220,50117,38517,34625,16724,626
^Excludes firms in fields of agriculture and professional services. Includes self-employed person only ifhe has either an established place of business or at least one employee.
3 Annual data are averages of end-of-quarter estimates centered at June 30; half-yearly data are for end ofperiod.
3 Total for period.* Industrial and commercial only; excludes banks, railroads, insurance companies, etc.8 Not available.• Revised series no longer carries group of agents and commercial services (such as real estate and insur-
ance brokers, holding and finance companies, tourist agencies, etc.).7 Eevised series has more complete coverage of small firms.
Sources: Department of Commerce and Dun & Bradstreet, Inc.
231
Digitized for FRASER http://fraser.stlouisfed.org/ Federal Reserve Bank of St. Louis
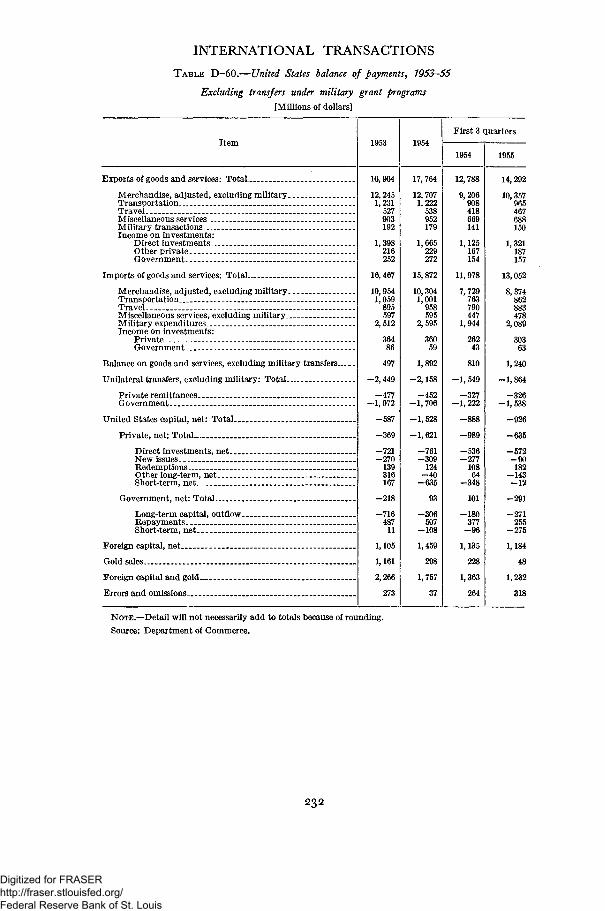
INTERNATIONAL TRANSACTIONS
TABLE D—60.—United States balance of payments, 1953—55
Excluding transfers under military grant programs[Millions of dollars]
Item 1953 1954First 3 quarters
1954 1955
Exports of goods and services: Total
Merchandise, adjusted, excluding militaryTransportation _TravelMiscellaneous services __.Military transactionsIncome on investments:
Direct investments _Other privateGovernment
Imports of goods and services: Total
Merchandise, adjusted, excluding militaryTransportation _TravelMiscellaneous services, excluding militaryMilitary expenditures _Income on investments:
PrivateGovernment
Balance on goods and services, excluding military transfers
Unilateral transfers, excluding military: Total _ _
Private remittances _
Government .-
United States capital, net: Total.
Private, net; Total
Direct investments, netNew issuesRedemptionsOther long-term, netShort-term, net ._.
Government, net: Total _Long-term capital, outflowRepaymentsShort-term, net _ _
Foreign capital, net
Gold sales _ _._
Foreign capital and gold. _
Errors and omissions
16,964
12,2451,231
527903192
1,398216252
16,467
10,9541,059
895597
2,512
364
497
- 2 , 4 4 9
- 4 7 7- 1 , 972
- 5 8 7
- 7 2 1- 2 7 0
139316167
- 2 1 8
- 7 1 6487
11
1,105
1,161
273
17,764
12,7071,222
538952179
1,665229272
15,872
10,3041,001
958595
2, 595
36059
1,892
- 2 , 1 5 8
- 4 5 2- 1 , 706
- 1 , 5 2 8
- 1 , 621
- 7 6 1-309
124- 4 0
- 6 3 5
- 3 0 6507
- 1 0 8
1,459
298
1,757
37
12,788
9,206908418
1,125167154
11,978
7,729763790447
1,944
26243
810
- 1 , 5 4 9
- 3 2 7- 1 , 222
- 5 3 6- 2 7 7
10864
- 3 4 8
101
- 1 8 0377
1,135
228
1,363
264
14,292
10,357965467688150
1,321187157
13,052
8,374862883478
2,089
30363
1,240
-1,864
-326-1,538
-926
-635
-572-90182
-143-12
-291
-271255
-275
1,184
1,232
318
NOTE.—Detail will not necessarily add to totals because of rounding.
Source: Department of Commerce.
232
Digitized for FRASER http://fraser.stlouisfed.org/ Federal Reserve Bank of St. Louis
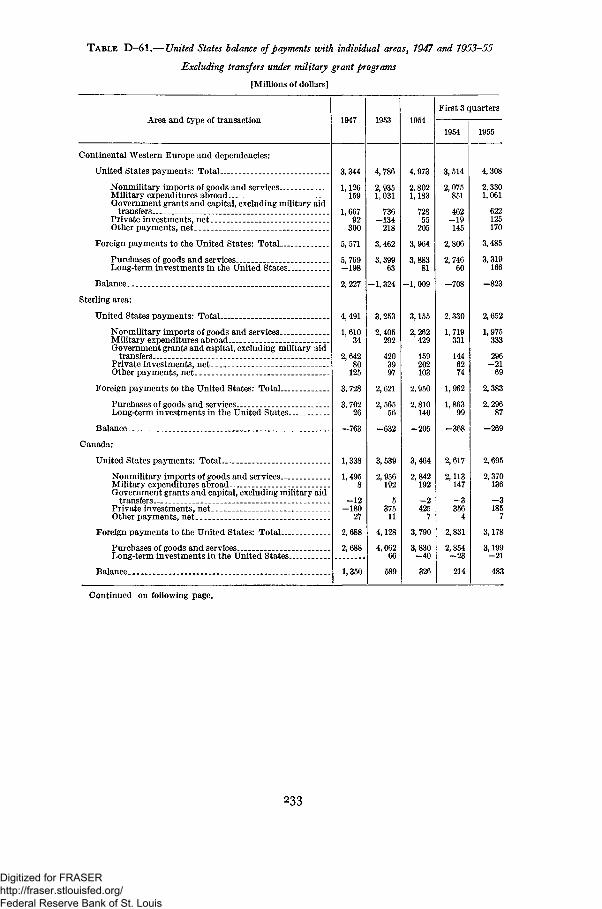
TABLE D—61.— United States balance of payments with individual areas, 1947 and 1953—55
Excluding transfers under military grant programs
[Millions of dollars]
Area and type of transaction 1947 1953 1954First 3 quarters
1954 1955
Continental Western Europe and dependencies:
United States payments: Total
Nqnmilitary imports of goods and servicesMilitary expenditures abroadGovernment grants and capital, excluding military aid
transfersPrivate investments, netOther payments, net
Foreign payments to the United States: Total
Purchases of goods and servicesLong-term investments in the United States..
Balance
Sterling area:
United States payments: Total..
Nqnmilitary imports of goods and servicesMilitary expenditures abroadGovernment grants and capital, excluding military aid
transfersPrivate investments, netOther payments, net
Foreign payments to the United States: Total
Purchases of goods and servicesLong-term investments in the United States..
Balance
Canada:
United States payments: Total-.
Nqnmilitary imports of goods and services.._Military expenditures abroadGovernment grants and capital, excluding military aid
transfersPrivate investments, netOther payments, net
Foreign payments to the United States: TotalPurchases of goods and servicesLong-term investments in the United States..
3,344
1,126159
1,66792
300
5,571
5,769-198
2,227
4,491
1,61034
2,64280
125
3,728
3,70226
-763
1,338
1,4958
- 1 2-180
27
2,688
2,688
Balance. 1,350
4,786
2,9351,031
736-134
218
3,462
3,39963
- 1 , 324
3,253
2,405292
4203997
2,621
2,56556
-632
3,539
2,956192
537511
4,128
4,06266
589
4,973
2,8021,183
72855
205
3,964
3,88381
-1,009
3,155
2,262429
159202103
2,950
2,810140
-205
3,464
2,842192
- 2425
7
3,790
3,830- 4 0
326
3,514
2,075851
462- 1 9145
2,806
2,74660
-708
2,330
1,719331
1446274
1,962
1,863
2,617
2,113147
- 3356
4
2,831
2,854- 2 3
214
4,308
2,3301,061
622125170
3,485
3,319166
-823
2,652
1,975333
296- 2 1
2,383
2,29687
2,695
2,370136
1857
3,178
3,199- 2 1
483
Continued on following page.
233
Digitized for FRASER http://fraser.stlouisfed.org/ Federal Reserve Bank of St. Louis
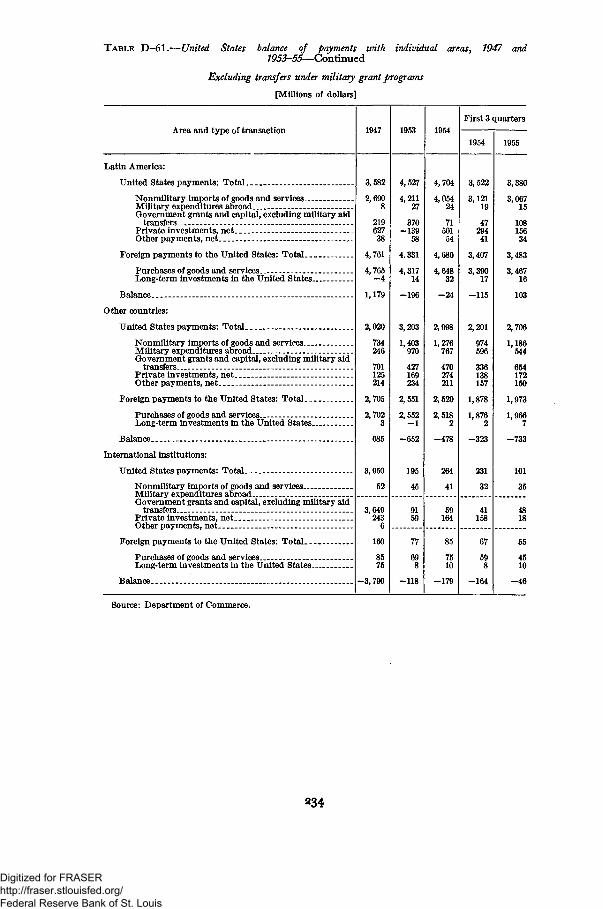
T A B L E D—61.—United States balance of payments with individual areas, 7947 and1953-55— Continued
Excluding transfers under military grant programs
[Millions of dollars]
Area and type of transaction 1947 1953 1954
First 3 quarters
1954 1955
Latin America:
United States payments: Total.
Nonmilitary imports of goods and services _.Military expenditures abroad...Government grants and capital, excluding military aid
transfersPrivate investments, netOther payments, net _
Foreign payments to the United States: Total-
Purchases of goods and services _Long-term investments in the United States-
Balance.
Other countries:
United States payments: Total.
Nonmilitary imports of goods and servicesMilitary expenditures abroadGovernment grants and capital, excluding military aid
transfers.Private investments, netOther payments, net
Foreign payments to the United States: Total.
Purchases of goods and servicesLong-term investments in the United States..
Balance.
International institutions:United States payments: Total.
Nonmilitary imports of goods and servicesMilitary expenditures abroadGovernment grants and capital, excluding military aid
transfersPrivate investments, netOther payments, net
3,582
2,6908
21962738
4,761
4,765- 4
1,179
2,020
734246
701125214
2,705
2,7023
685
3,950
52
4,527
4,21127
370-139
58
4.331
4,31714
-196
3,203
1,403970
427169234
2,551
2,552
-652
195
45
4,704
4,05424
7150154
4,680
4,64832
- 2 4
2,998
1,276767
470274211
2,520
2,5182
- 4 7 8
264
41
3,522
3,12119
4729441
3,407
3,39017
-115
2,201
974596
336138157
1,878
1,8762
231
32
Foreign payments to the United States: Total.
Purchases of goods and servicesLong-term investments in the United States..
Balance.
3,649243
160
8575
-3,790
59164
41158
77
-118
85
-179
67
-164
3,380
3,06715
10815634
3,46716
103
2,706
1,186544
654172150
1,973
1,9667
-733
101
35
4818
55
4510
- 4 6
Source: Department of Commerce.
234
Digitized for FRASER http://fraser.stlouisfed.org/ Federal Reserve Bank of St. Louis
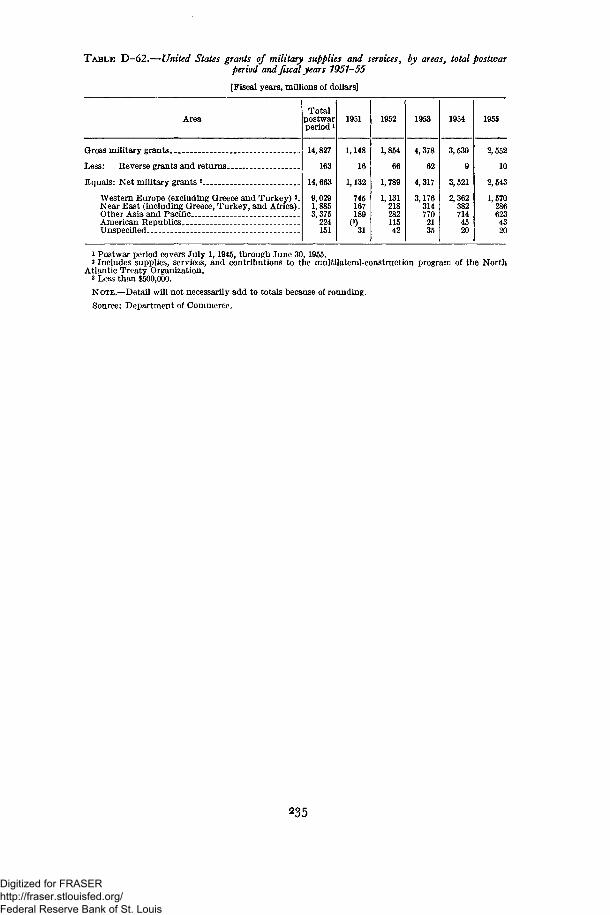
T A B L E D—62.—United States grants of military supplies and services, by areas, total postwarperiod and fiscal years 1951-55
[Fiscal years, millions of dollars]
AreaTotal
postwarperiod *
14,827
163
14,663
9,0291,8853,375
224151
1951
1,148
16
1,132
745167189
(3)31
1952
1,854
66
1,789
1,13121828211542
1953
4,378
62
4,317
3,1763147702135
1954
3,530
9
3,521
2,3623827144520
1955
Gross military grants
Less: Reverse grants and returns..
Equals: Net military grants 2
Western Europe (excluding Greece and Turkey) *_Near East (including Greece, Turkey, and Africa).Other Asia and PacificAmerican RepublicsUnspecified
2,552
10
2,543
1,5702866234320
1 Postwar period covers July 1, 1945, through June 30,1955.2 Includes supplies, services, and contributions to the multilateral-construction program of the North
Atlantic Treaty Organization.3 Less than $500,000.
NOTE.—Detail will not necessarily add to totals because of rounding.
Source: Department of Commerce.
235
Digitized for FRASER http://fraser.stlouisfed.org/ Federal Reserve Bank of St. Louis
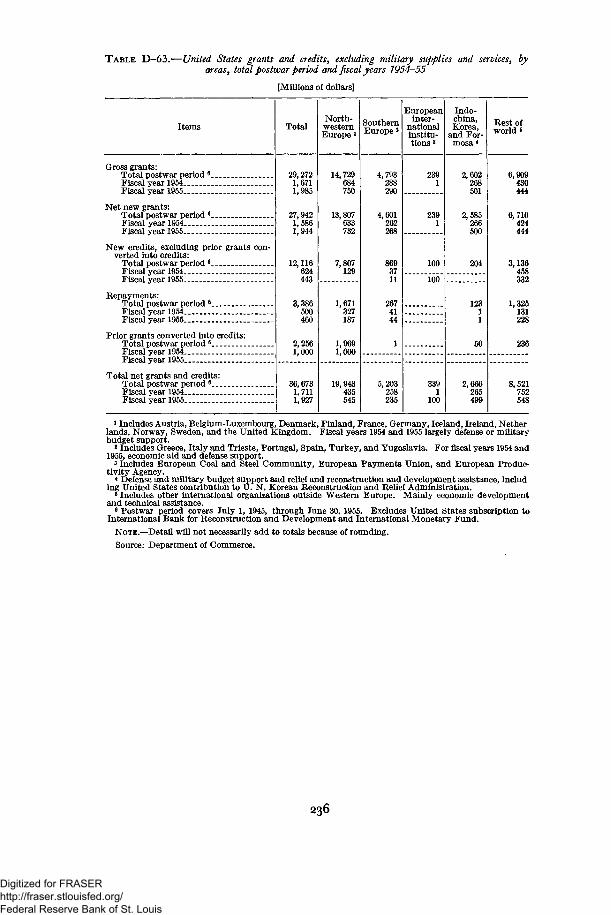
TABLE D—63.—United States grants and credits, excluding military supplies and services, byareas, total postwar period and fiscal years 1954—55
[Millions of dollars]
Items
Gross grants:Total postwar period8.Fiscal year 1954. _Fiscal year 1955.
Net new grants:Total postwar period 6_.Fiscal year 1954.Fiscal year 1955
New credits, excluding prior grants con-verted into credits:
Total postwar period6
Fiscal year 1954 __Fiscal year 1955
Repayments:Total postwar period fl_Fiscal year 1954_Fiscal year 1955_
Prior grants converted into credits:Total postwar period6 __Fiscal year 1954 _.Fiscal year 1955_
Total net grants and credits:Total postwar periodfl
Fiscal year 1954_Fiscal year 1955
Total
29,2721,6711,985
27,9421,5861,944
12,116624443
3,386500460
2,2561,000
36,6731,7111,927
North-westernEurope 1
14,729684750
13,807633732
7,807129
1,671327187
1,9691,000
19,943435545
SouthernEurope 2
Europeaninter-
nationalinstitu-tions 3
4,793288290
4,601262
2674144
5,203258235
2391
3391
100
Indo-china,Korea,
and For-mosa4
2,602268501
2391
100
100
2,585266500
204
12311
50
2,666265
Rest ofworld 8
6,909430444
6,710424444
3,136458332
1,325131228
236
8,521752548
1 Includes Austria, Belgium-Luxembourg, Denmark, Finland, France, Germany, Iceland, Ireland, Netherlands, Norway, Sweden, and the United Kingdom. Fiscal years 1954 and 1955 largely defense or militarybudget support.
2 Includes Greece, Italy and Trieste, Portugal, Spain, Turkey, and Yugoslavia. For fiscal years 1954 and1955, economic aid and defense support.
3 Includes European Coal and Steel Community, European Payments Union, and European Produc-tivity Agency.
* Defense and military budget support and relief and reconstruction and development assistance, including United States contribution to U. N. Korean Reconstruction and Relief Administration.
6 Includes other international organizations outside Western Europe. Mainly economic developmentand technical assistance.
6 Postwar period covers July 1, 1945, through June 30, 1955. Excludes United States subscription toInternational Bank for Reconstruction and Development and International Monetary Fund.
NOTE.—Detail will not necessarily add to totals because of rounding.
Source: Department of Commerce.
236
Digitized for FRASER http://fraser.stlouisfed.org/ Federal Reserve Bank of St. Louis
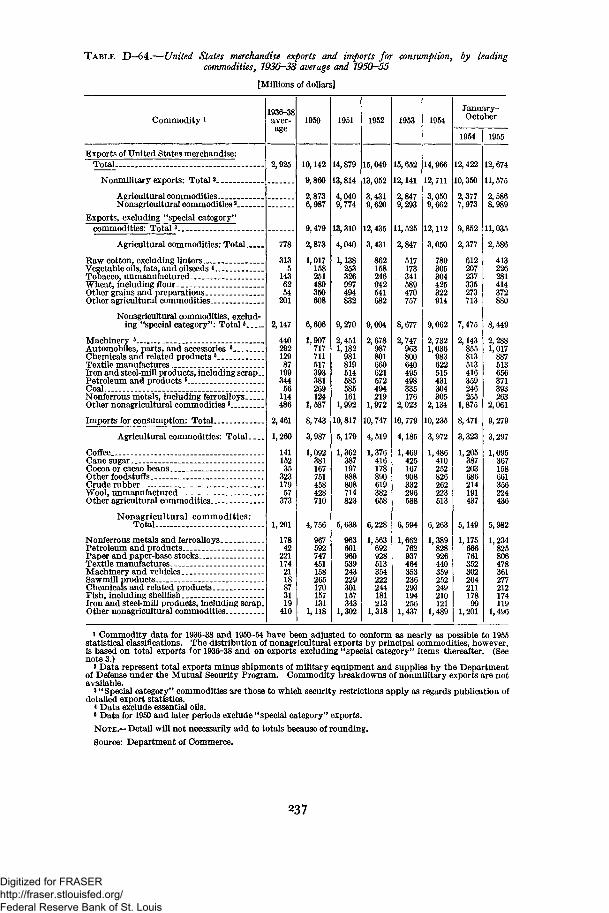
TABLE D-64.—United States merchandise exports and imports for consumption, by leadingcommodities, 1936-38 average and 1950-55
[Millions of dollars]
Commodity * 1950 1951 1952 1953 1954January-October
1954 1955
Exports of United States merchandise:Total 2,925
Nonmilitary exports: Total 2_
Agricultural commodities -Nonagricultural commodities2_
Exports, excluding "special category"commodities: Total 3
Agricultural commodities: Total—
Raw cotton, excluding lintersVegetable oils, fats, and oilseeds *..Tobacco, unmanufacturedWheat, including flourOther grains and preparationsOther agricultural commodities. _.
Nonagricultural commodities, exclud-ing "special category": Total •
Machinery 5 __ _Automobiles, parts, and accessories 6
Chemicals and related products 8
Textile manufacturesIron and steel-mill products, including scrap.Petroleum and products 8
Coal .__Nonferrous metals, including ferroalloysOther nonagricultural commodities 8.
Imports for consumption: Total--
Agricultural commodities: Total .
Coffee— -_-Cane sugarCocoa or cacao beansOther foodstuffs.Crude rubberWool, unmanufacturedOther agricultural commodities..
Nonagricultural commodities:Total „ ___
Nonferrous metals and ferroalloysPetroleum and products -.Paper and paper-base stocksTextile manufacturesMachinery and vehiclesSawmill productsChemicals and related productsFish, including shellfishIron and steel-mill products, including scrap.Other nonagricultural commodities
778
3135
1436254
201
2,147
44029212987
199344
56114486
2,461
1,260
14115235
32317957
373
1,201
17842
2211742118873119
410
10,142
9,860
2,8736,987
9,479
2,873
1,017158251489350
1,907717711517393381269124
1,587
8,743
3,987
1,092381167751458428710
4,756
967592747451158265170157131
1,118
14,879
13,814
4,0409,774
13,310
4,040
1,138253326997494832
9,270
2,4511,182981819514585585161
1,992
10,817
5,179
1,362387197
714823
5,638
963601960539243229301157343
1,302
15,049
13,052
3,4319,620
12,435
3,431
158246942541682
9,004
2,678987801660621572494219
1,972
10,747
4,519
1,376416178890619382658
1,563692928513354222244181213
1,318
15,652
12,141
2,8479,293
11,525
2,847
517173341589470757
8,677
2,747963800640495498335176
2,023
10,779
4,185
1,469425167908332296588
6,594
1,662762937464353236293194256
1,437
14,966
12,711
3,0509,662
12,112
3,050
780305304425322914
9,062
2,7321,036983622515431304305
2,134
10,235
3,972
410252826262223513
6,263
1,389828926440359252249210121
1,489
12,422
10,350
2,3777,973
9,852
2,377
612207237335273713
7,475
2,143855813513416359246255
1,875
8,471
3,323
1,205387203686214191437
5,149
1,17566676135230220421117899
1,201
12,674
11, 575
2,586
11,035
2,586
413226281414372
8,449
2,2881,017887513656371393263
2,061
9,279
3,2971,095367158661356224436
5,982
1,234825806478361277212174119
1,496
1 Commodity data for 1936-38 and 1950-54 have been adjusted to conform as nearly as possible to 1955statistical classifications. The distribution of nonagricultural exports by principal commodities, however,is based on total exports for 1936-38 and on exports excluding "special category" items thereafter. (Seenote 3.)
2 Data represent total exports minus shipments of military equipment and supplies by the Departmentof Defense under the Mutual Security Program. Commodity breakdowns of nonmilitary exports are notavailable.
3 " Special category" commodities are those to which security restrictions apply as regards publication ofdetailed export statistics.
* Data exclude essential oils.6 Data for 1950 and later periods exclude "special category" exports.
NOTE.—Detail will not necessarily add to totals because of rounding.
Source: Department of Commerce.
237
Digitized for FRASER http://fraser.stlouisfed.org/ Federal Reserve Bank of St. Louis
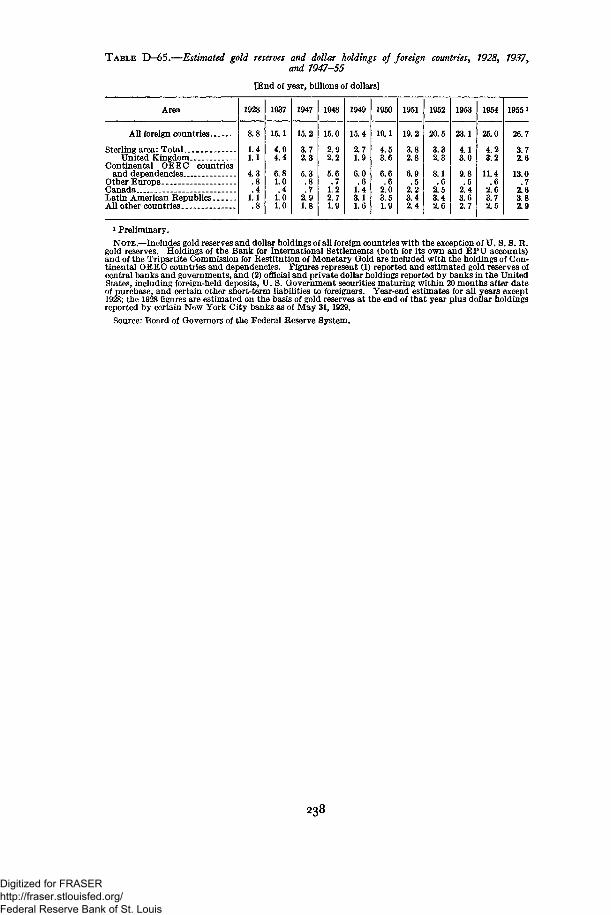
T A B L E D-65.—Estimated gold reserves and dollar holdings of foreign countries, 1928, 1937,and 1947-55
[End of year, billions of dollars]
Area 1928
8.8
1.41.1
4.3.8.41.1.8
1937
15.1
4.94.4
6.81.0.41.01.0
1947
15.2
3.72.3
5.3.8.72.91.8
1948
15.0
2.92.2
5.6.71.22.71.9
1949
15.4
2.71.9
6.0.61.43.11.6
1950
19.1
4.53.6
6.6.62.03.51.9
1951
19.2
3.82.8
6.9.52.23.42.4
1952
20.5
3.32.3
8.1.62.53.42.6
1953
23.1
4.13.0
9.8.52.43.62.7
1954
25.0
4.23.2
11.4.62.63.72.5
1955»
All foreign countries _
Sterling area: Total. __United Kingdom
Continental OEEO countriesand dependencies _
Other Europe -CanadaLatin American RepublicsAll other countries
26.7
3.72.6
13.0.7
2.63.82.9
i Preliminary.
NOTE.—Includes gold reserves and dollar holdings of all foreign countries with the exception of U. S. S. R.gold reserves. Holdings of the Bank for International Settlements (both for its own and EPU accounts)and of the Tripartite Commission for Restitution of Monetary Gold are included with the holdings of Con-tinental OEEC countries and dependencies. Figures represent (1) reported and estimated gold reserves ofcentral banks and governments, and (2) official and private dollar holdings reported by banks in the UnitedStates, including foreign-held deposits, U. S. Government securities maturing within 20 months after dateof purchase, and certain other short-term liabilities to foreigners. Year-end estimates for all years except1928; the 1928 figures are estimated on the basis of gold reserves at the end of that year plus dollar holdingsreported by certain New York City banks as of May 31,1929.
Source: Board of Governors of the Federal Reserve System.
238
Digitized for FRASER http://fraser.stlouisfed.org/ Federal Reserve Bank of St. Louis