Embed Size (px)
Citation preview

Agriculture, Ecosystems and Environment 103 (2004) 561–579
Erosion-related soil carbon fluxes in a pastoralsteepland catchment, New Zealand
Mike Pagea,∗, Noel Trustrumb, Hannah Brackleya, Troy Baisdenaa Landcare Research New Zealand, Private Bag 11052, Palmerston North, New Zealand
b Institute of Geological and Nuclear Sciences, P.O. Box 30368, Lower Hutt, New Zealand
Received 29 October 2002; received in revised form 28 October 2003; accepted 6 November 2003
Abstract
New Zealand is currently identifying and quantifying its carbon sources and sinks to develop a national carbon budget. Thiswill enable it to set policy and targets to reduce greenhouse gas emissions in line with the Kyoto Protocol. While soil is a majorcarbon sink, New Zealand also has high sediment yields to the ocean, suggesting that erosion has a significant effect on soil car-bon fluxes, through CO2 emission during transport of carbon in sediment, carbon burial and recovery of carbon on eroded areas.
As a contribution to the national carbon budget, a mass balance approach was used to calculate soil carbon fluxes fromlandslide and sheetwash erosion in the Tutira catchment in the North Island of New Zealand. This soft rock hill countrycatchment represents the upper limit for landslide-related soil carbon losses. It contains a lake that acts as a highly efficienttrap for sediment and nutrients, and has preserved a high-resolution record of storm-induced erosion. Information fromprevious studies of erosion and lake sedimentation was used to construct a carbon budget for the 114-year period of Europeanpastoral farming. The budget assumes the gross transfer of carbon by geomorphological processes and does not includebiogeochemical exchanges with the atmosphere.
Results indicate that 0.94±0.23 Mg C ha−1 per year enter the lake (0.50±0.15 Mg C ha−1 per year from landslide erosionand 0.44 ± 0.17 Mg C ha−1 per year from sheetwash erosion). On a national scale this equates to an anthropogenicallyinduced loss of 2 112 000 Mg C per year from the 10% of similar terrain under pastoral land use. However, the net loss fromthe landscape is significantly less due to carbon recovery on eroded sites. Landslide scars have a carbon recovery rate (afteroxidation) of∼0.61 Mg C ha−1 per year. Carbon recovery on areas affected solely by sheetwash erosion was not measured,but is significantly lower. This information is being used to constrain models of erosion-related carbon fluxes developed forlandslide-prone terrains, as part of the national carbon budget.© 2003 Elsevier B.V. All rights reserved.
Keywords: Erosion; Steeplands; Soil carbon; Carbon translocation; Mass balance
1. Introduction
The contribution of erosion to the New Zealandcarbon budget is currently being investigated. This
∗ Corresponding author. Tel.:+64-6-356-7154;fax: +64-6-355-9230.E-mail address: [email protected] (M. Page).
involves quantifying the amount of soil carbon trans-ferred to the ocean and to lakes, the amount stored interrestrial deposits, the amount released to the atmo-sphere as CO2 by biogeochemical processes duringtransport and after deposition, the potential for carbonsequestration by fluvial sediments and by revegetatederoded land, and the human-induced proportion ofthese fluxes (Trustrum et al., 2002). By necessity,
0167-8809/$ – see front matter © 2003 Elsevier B.V. All rights reserved.doi:10.1016/j.agee.2003.11.010

562 M. Page et al. / Agriculture, Ecosystems and Environment 103 (2004) 561–579
much of the work involves short-term monitoring ofcarbon in streams and rivers, which is not source- orprocess-specific.
As in many countries, a national carbon budget isbeing developed in New Zealand in anticipation of theneed for full carbon accounting, to substantiate reduc-tions in greenhouse gas emissions agreed to under theKyoto Protocol. The intended target of a 15% reduc-tion in New Zealand emissions by 2012 will be metlargely through uptake and storage in exotic plantationforests. To identify the amount of forestry required,the sources, sinks and transfers of carbon need to bebetter understood.
Vegetation and soils are major carbon sinks whereCO2 is stored and exchanged with the atmosphere. Itis estimated that vegetation and soils are absorbing∼40% of global CO2 emissions from human activ-ities, and that changes in land-use practices couldpotentially achieve 25% of the reductions in CO2projected to be required by 2050 to avoid large in-creases in temperature (The Royal Society, 2001;IPCC, 2001). While New Zealand vegetation con-tains∼2400 Tg C (above and below the ground) (Tateet al., 1997), soil is New Zealand’s major store ofcarbon with 4190± 280 Tg C (to 1 m depth) (Daviset al., 1999). However, it is estimated that 209±21 Tgof suspended sediment are delivered to the oceanannually from the New Zealand landscape (Hickset al., 2002). New Zealand and other steep islands ofOceania and Asia have among the highest sedimentyields, collectively accounting for more than 20%(Milliman and Syvitski, 1992), and perhaps as muchas 33% (Lyons et al., 2002), of the global sedimentyield to the ocean. They are also estimated to have thegreatest carbon yields (∼100–300 g C m−2 per year)(Stallard, 1998; Lyons et al., 2002). However, massbalances, which quantify the sources, sinks, processesand pathways that lead to these yields, have beenlacking.
New Zealand is subject to high-intensity storms,rapid runoff from steep terrain, and has short steeprivers, so that suspended sediment is rapidly trans-ferred to floodplains and the ocean. This short resi-dence time in streams and rivers limits the opportunityfor CO2 evolution. Initial estimates are that the poten-tial loss of carbon by erosion could be between 3 and11 Tg C per year (Tate et al., 2000). This is similar tocurrent energy-derived CO2 emissions (−8.3 Tg C per
year in 2000) and C-sequestration in plantation forests(+6 Tg C per year) (Scott et al., 2001). The erosionimpact on New Zealand’s carbon budget is thereforelikely to be significant and needs quantification. It isalso clear that the benefit of forest planting and scrubreversion to NZ’s carbon budget will be increased ifit is targeted at erodible terrain.
To date, the focus for most studies of erosion-relatedcarbon loss has been water erosion (sheetwash) ofcropland (Lal, 1995; Harden et al., 1999; Starr et al.,2000; Lal, 2001; Jacinthe and Lal, 2001). Little at-tention has been given to mass movement erosion ofpastoral steeplands. In New Zealand, landsliding is amajor erosion process, affecting about 12 million ha(46% of the country). In this paper, soil carbon lossesfrom landslide and sheetwash erosion were calculatedfor the Tutira catchment in the North Island, as acontribution to New Zealand’s carbon budget. Thissoft rock hill country catchment, with a combinationof terrain highly susceptible to landsliding and highfrequency of landslide-triggering storms (Page et al.,1994b; Glade, 1998), represents the upper limit forlandslide-related soil carbon losses.
2. Study area
The Tutira catchment, in northern Hawke’s Bay(Fig. 1), is representative of the landslide-prone softrock hill country that occupies∼19% of New Zealand(authors’ personal communication). The catchmenthas been the focus of erosion research for over adecade (Page et al., 1994a,b; Page and Trustrum,1997; Merz and Mosley, 1998; Preston, 1999), yield-ing a wealth of empirical data and understanding ofgeomorphic processes. It is well suited to a studylinking erosion and carbon transfers and identifyingsoil carbon losses associated with landsliding andother erosion processes.
The catchment is underlain by late Pliocene andearly Pleistocene sandstones and siltstones interbed-ded with limestones and conglomerates, and hasbeen mantled by a number of Holocene tephras,much of which has been eroded from steep hill-slopes. High-intensity rainstorms, some of cyclonicorigin, are an important component of the rainfallregime. The mean annual rainfall at Tutira is 1438 mm(1951–1980).

M. Page et al. / Agriculture, Ecosystems and Environment 103 (2004) 561–579 563
Fig
.1.
Loca
tion
map
.

564 M. Page et al. / Agriculture, Ecosystems and Environment 103 (2004) 561–579
The catchment has an area of 2963 ha, with LakeTutira (179 ha) near its southern boundary. The lakewas formed ca. 6500 years before present (B.P.) byblockage of a fourth-order stream by a large land-slide (Page and Trustrum, 1997), and has a maximumdepth of 42 m and an average depth of 21 m. LakeWaikopiro (11 ha) is separated from Lake Tutira by anarrow natural causeway, and has a catchment area of75 ha. The lakes are highly efficient sediment traps,being closely coupled with the surrounding steep,landslide-prone hills that are the major sedimentsource (Fig. 2). Two-thirds of the erosion-prone areacomprises siltstone and sandstone steeplands, andone-third comprises less-steep tephra-mantled hills.Sedimentation rates are rapid and the lake sedimentscontain a high-resolution record of storm-inducederosion (Page et al., 1994b). Conversion of the catch-ment from bracken fern/scrub to pasture began inearnest in 1882 with the arrival of Guthrie-Smith, apioneer farmer, who through 58 years of meticulous
Fig. 2. Lake Tutira and surrounding steepland terrain following Cyclone Bola, with landslides and deposition of sediment on hillslopesand valley floors. Photograph: N.A. Trustrum, 1988.
observations provided valuable information used inthis study. Despite problems of reversion, by the1930s most of the catchment was in pasture. Since1992∼370 ha of the steep hills around the lake hasbeen planted in exotic forest (mainlyPinus radiataand mixed deciduous hardwoods).
3. Approach
The Tutira catchment is an ideal site to use a massbalance approach to address the issue of whether ero-sion is a net source or sink of carbon in such land-scapes. This approach recognises the need, proposedby Stallard (1998), for ‘a more geomorphically rigor-ous approach’ to the linking of erosion, sedimentation,and carbon. The selection of a whole catchment asthe unit of study, and a long-time frame (∼100 years),provides a ‘real-world’ example, where source and de-positional sites, multiple erosion processes, and the
M. Page et al. / Agriculture, Ecosystems and Environment 103 (2004) 561–579 565
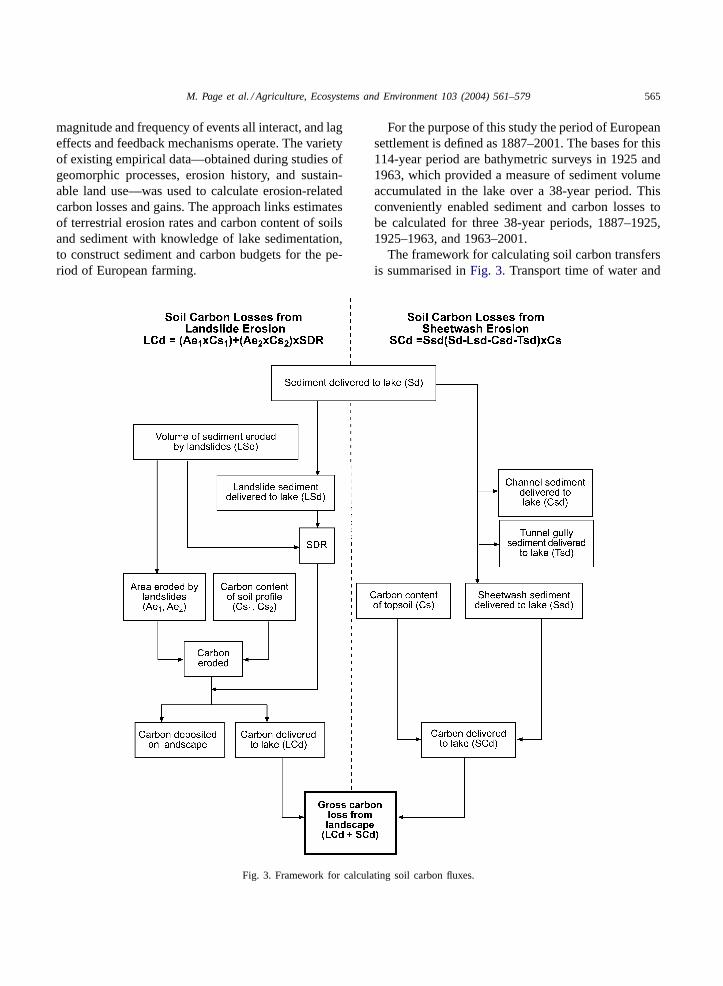
magnitude and frequency of events all interact, and lageffects and feedback mechanisms operate. The varietyof existing empirical data—obtained during studies ofgeomorphic processes, erosion history, and sustain-able land use—was used to calculate erosion-relatedcarbon losses and gains. The approach links estimatesof terrestrial erosion rates and carbon content of soilsand sediment with knowledge of lake sedimentation,to construct sediment and carbon budgets for the pe-riod of European farming.
Fig. 3. Framework for calculating soil carbon fluxes.
For the purpose of this study the period of Europeansettlement is defined as 1887–2001. The bases for this114-year period are bathymetric surveys in 1925 and1963, which provided a measure of sediment volumeaccumulated in the lake over a 38-year period. Thisconveniently enabled sediment and carbon losses tobe calculated for three 38-year periods, 1887–1925,1925–1963, and 1963–2001.
The framework for calculating soil carbon transfersis summarised inFig. 3. Transport time of water and

566 M. Page et al. / Agriculture, Ecosystems and Environment 103 (2004) 561–579
sediment to the lake during storms is in the order ofhours to days, providing limited opportunity for CO2evolution. The budget therefore assumes the grosstransfer of carbon by geomorphological processes,and does not include biogeochemical exchanges withthe atmosphere during transport. An evaluation ofthe uncertainty associated with the results is given inAppendix A.
3.1. Soil carbon losses from landslide erosion
Soil carbon losses from landsliding can be ex-pressed by the following equation:
LCd = [(Ae1 × Cs1) + (Ae2 × Cs2)] × SDR (1)
where LCd is the carbon delivered to the lake, Ae1the area of landslides on previously uneroded ground,1
Ae2 the area of landslides on previous landslide scars,2
Cs1 the carbon content of uneroded soil to 1 m depth,Cs2 the carbon content of soil forming on previouslandslide scars, and SDR the sediment delivery ratio.
In order to calculate Ae1, Ae2, and SDR, estimatesare needed of:
volume of landslide sediment eroded (LSe);volume of landslide sediment delivered to the lake
(LSd).
3.2. Soil carbon losses from sheetwash erosion
The amount of sediment and carbon derived bysheetwash erosion was estimated using the followingassumptions.
Soil carbon losses from sheetwash erosion can beexpressed by the following equations:
SCd= Ssd× Cs (2)
where
Ssd= Sd− Lsd− Csd− Tsd (3)
where SCd is carbon delivered to the lake, Ssd thesheetwash sediment delivered to the lake, Sd the totalsediment delivered to the lake, Lsd the landslide sed-iment delivered to the lake, Csd the channel sediment
1 Uneroded ground has had no landslide erosion since Europeansettlement.
2 Previous landslide scars were formed after European settle-ment.
delivered to the lake, Tsd the tunnel gully sedimentdelivered to the lake, and Cs the carbon content of topsoil to ∼10 cm depth.
4. Results
4.1. Soil carbon losses from landslide erosion
4.1.1. Volume of sediment eroded by landslides (LSe)The volume of sediment eroded was calculated us-
ing:
1. relationships between storm rainfall and landslidedensity;
2. average scar volume;3. a record of (landslide-triggering) storms derived
from the 1894–2001 daily rainfall record at thelake.
Relationships between storm rainfall and landslidedensity were applied to slopes 18–25◦ and slopes>25◦. These relationships were defined for similarterrains (land systems) in the Waipaoa catchment,90 km northeast of Tutira (Fig. 1). Descriptions ofthese terrains are given inTrustrum et al. (1999), Pageet al. (1999), and Reid and Page (2002). The graphof the relationship for slopes >25◦ includes landslidecounts for four storms of 230, 320, 692, and 753 mmat Tutira (Fig. 4).
The volume of landslide sediment eroded duringeach 38-year period was calculated by applying thestorm rainfall–landslide density relationships for eachslope category (Fig. 4) to each landsliding event(storm) in the rainfall record. A landsliding eventwas defined as >200 mm rainfall in 4 days or less,or >250 mm in 5–7 days. On this basis there were64 storms, 16 of which exceeded 300 mm, the largestbeing 753 mm. Each calculated density was then mul-tiplied by the area of the corresponding slope class inthe catchment, and by average scar volumes of 216and 195 m3 for slopes >25◦ and 18–25◦, respectively.Average scar volumes were calculated using data inPage et al. (1994a).
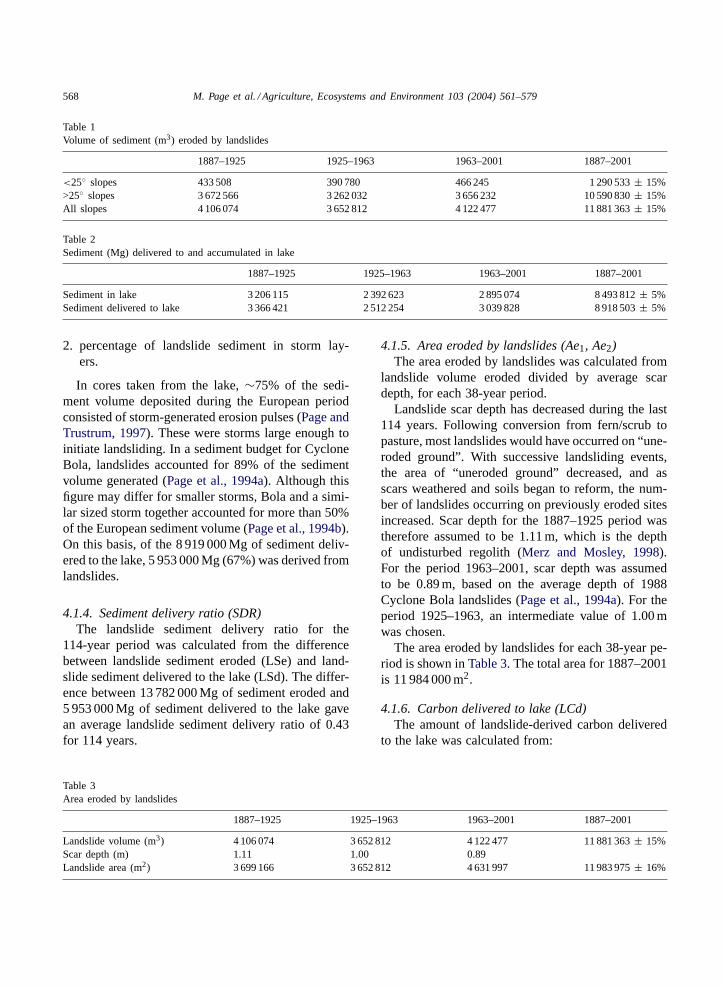
The volume of sediment eroded by landslides byslope class for each 38-year period is shown inTable 1.The total sediment eroded between 1887 and 2001 is11 881 000 m3, which equates to 13 782 000 Mg basedon a bulk density of 1.16 Mg m−3 (Page et al., 1994a).

M. Page et al. / Agriculture, Ecosystems and Environment 103 (2004) 561–579 567
Fig. 4. Relationship between storm rainfall and landslide densityunder pasture, for slopes 18–25◦ (Wharekopae land system) and>25◦ (Te Arai land system) (afterReid and Page, 2002). Curvedlines indicate the 95% confidence interval for the unconstrainedregressions (solid lines).
4.1.2. Sediment delivered to lake (Sd)The sediment delivered to the lake was calculated
using:
1. bathymetric surveys;2. relative sedimentation rates of lake cores;3. trap efficiency.
A comparison of bathymetric surveys carried outin 1925 (Guthrie-Smith, 1953) and 1963 (Grant,1966) showed that the mean lake depth had de-creased by 1.1 m. This provided a sedimentation rateof 2125 Mg km−2 per year (Adams, 1979) or a catch-ment yield of 2 393 000 Mg in 38 years.
From the high-resolution record of storm events,relative sedimentation rates from four lake cores(LT15, -16, -17, and -7,Page et al., 1994b) wereused to estimate the volumes of sediment accumu-lated in the preceding 38-year period (1887–1925)and the following 38-year period (1963–2001). Forthe period 1887–1925, there was a 1.34× increase insedimentation rate, while for 1963–2001 there wasa 1.21× increase, when compared with 1925–1963.The relative sedimentation rates necessarily assumeconstant patterns of sedimentation. The cores weretaken from deep (36–38 m of water), central basinsthat are part of the meandering floor of the valley,drowned when Lake Tutira was formed. Any effectthat sedimentation pattern changes may have had onsedimentation rates will have been minimised by thelocation of cores sites well away from stream entrypoints.
Based on the capacity to annual inflow ratio methodof Brune (1953), the trap efficiency of the lake is es-timated to be∼97% (Page and Trustrum, 1997). ForCyclone Bola, the largest storm since European settle-ment, the trap efficiency was 89% (Page et al., 1994a).For the purpose of this study an overall trap efficiencyof 95% was adopted.
Based on 2 393 000 Mg of sediment deposited be-tween 1925 and 1963, and relative sedimentation ratesof lake cores, 8 494 000 Mg was deposited in the lakebetween 1887 and 2001. With a 95% trap efficiency,a total of 8 919 000 Mg of sediment was delivered tothe lake (Table 2).
4.1.3. Landslide sediment delivered to lake (LSd)The amount of landslide sediment delivered was
calculated from the total sediment delivered to the lakeusing:
1. percentage of core sediment derived fromlandslide-generating storms;
568 M. Page et al. / Agriculture, Ecosystems and Environment 103 (2004) 561–579
Table 1Volume of sediment (m3) eroded by landslides
1887–1925 1925–1963 1963–2001 1887–2001
<25◦ slopes 433 508 390 780 466 245 1 290 533± 15%>25◦ slopes 3 672 566 3 262 032 3 656 232 10 590 830± 15%All slopes 4 106 074 3 652 812 4 122 477 11 881 363± 15%
Table 2Sediment (Mg) delivered to and accumulated in lake
1887–1925 1925–1963 1963–2001 1887–2001
Sediment in lake 3 206 115 2 392 623 2 895 074 8 493 812± 5%Sediment delivered to lake 3 366 421 2 512 254 3 039 828 8 918 503± 5%
2. percentage of landslide sediment in storm lay-ers.
In cores taken from the lake,∼75% of the sedi-ment volume deposited during the European periodconsisted of storm-generated erosion pulses (Page andTrustrum, 1997). These were storms large enough toinitiate landsliding. In a sediment budget for CycloneBola, landslides accounted for 89% of the sedimentvolume generated (Page et al., 1994a). Although thisfigure may differ for smaller storms, Bola and a simi-lar sized storm together accounted for more than 50%of the European sediment volume (Page et al., 1994b).On this basis, of the 8 919 000 Mg of sediment deliv-ered to the lake, 5 953 000 Mg (67%) was derived fromlandslides.
4.1.4. Sediment delivery ratio (SDR)The landslide sediment delivery ratio for the
114-year period was calculated from the differencebetween landslide sediment eroded (LSe) and land-slide sediment delivered to the lake (LSd). The differ-ence between 13 782 000 Mg of sediment eroded and5 953 000 Mg of sediment delivered to the lake gavean average landslide sediment delivery ratio of 0.43for 114 years.
Table 3Area eroded by landslides
1887–1925 1925–1963 1963–2001 1887–2001
Landslide volume (m3) 4 106 074 3 652 812 4 122 477 11 881 363± 15%Scar depth (m) 1.11 1.00 0.89Landslide area (m2) 3 699 166 3 652 812 4 631 997 11 983 975± 16%
4.1.5. Area eroded by landslides (Ae1, Ae2)The area eroded by landslides was calculated from
landslide volume eroded divided by average scardepth, for each 38-year period.
Landslide scar depth has decreased during the last114 years. Following conversion from fern/scrub topasture, most landslides would have occurred on “une-roded ground”. With successive landsliding events,the area of “uneroded ground” decreased, and asscars weathered and soils began to reform, the num-ber of landslides occurring on previously eroded sitesincreased. Scar depth for the 1887–1925 period wastherefore assumed to be 1.11 m, which is the depthof undisturbed regolith (Merz and Mosley, 1998).For the period 1963–2001, scar depth was assumedto be 0.89 m, based on the average depth of 1988Cyclone Bola landslides (Page et al., 1994a). For theperiod 1925–1963, an intermediate value of 1.00 mwas chosen.
The area eroded by landslides for each 38-year pe-riod is shown inTable 3. The total area for 1887–2001is 11 984 000 m2.
4.1.6. Carbon delivered to lake (LCd)The amount of landslide-derived carbon delivered
to the lake was calculated from:

M. Page et al. / Agriculture, Ecosystems and Environment 103 (2004) 561–579 569
1. carbon content of uneroded soil/regolith to 1 m(Cs1);
2. carbon content of soil forming on landslide scars(Cs2);
3. area eroded by landslides (Ae1, Ae2);4. sediment delivery ratio (SDR).
In New Zealand soils, organic carbon occursmainly in soil organic matter, with little occurring ascalcium carbonate and charcoal (Tate et al., 1997).Landslide-prone soils in the Tutira catchment are Or-thic Acrisols and Vitric Andosols (FAO–UNESCO,1974). These soils are classified as intergrades be-tween yellow-grey earths and yellow-brown earths,and composite yellow-brown pumice soils onyellow-brown loams according to the NZ GeneticSoil Classification (Taylor and Pohlen, 1968). Meansoil carbon values of 112 and 197 Mg C ha−1, re-spectively, are reported for these soil groups underpasture (Tate et al., 1997). Uneroded soil (withoutlandslides) on a 32◦ slope under pasture in the Tu-tira catchment was sampled, and had a soil carboncontent equivalent to 162 Mg C ha−1. (The aver-age slope for landslide scars is 31◦, derived froma random sample of 118 landslide scars, measuredduring the sediment budget described inPage et al.(1994a).)
The Tutira catchment, like the majority of the “softrock” sedimentary hill country of New Zealand, isdevoid of indigenous forest, so a value for the car-bon content of uneroded forest soil is difficult toobtain, although values of 164 and 144 Mg C ha−1
were measured for soils under a 105-year old secondgrowth forest in the catchment. For the purpose ofthis paper a value of 175 Mg C ha−1 for unerodedforest soil/regolith (to 1 m depth) has been adoptedfor landslide-prone terrain. This value is consistentwith understandings of the relationship between soilC levels in pasture and indigenous forest at a nationalscale (Giltrap et al., 2001). At the beginning of Eu-ropean settlement this would have equated to a totalof 240 000 Mg C for the landslide-prone area of thecatchment (1369 ha).
Calculations indicate that if all landslides occurredon uneroded ground, then by 2001 the area of land-slide scars (1198 ha) would occupy 87.5% of thelandslide-prone terrain (1369 ha). However, as pre-viously mentioned, a proportion of landslides occurs
on sites of previous landslides. Several studies on theEast Coast report that between 40 and 60% of regolithhas been removed by landslides since the onset ofpastoral farming (Crozier et al., 1980; Thomas andTrustrum, 1984; Merz and Mosley, 1998). At Wairoa,60 km northeast of Tutira (Fig. 1), on similar terrainand with a similar frequency of landslide-inducingstorms (Glade, 1998), 57% of the landslide-proneterrain was occupied by scars in 1984 (Trustrum andDouglas, unpublished data). Assuming a similar rateof landsliding to Tutira, the remaining 30.5% of scarsoccurred on the site of previous landslides. On thisbasis, of the 1198 ha eroded by landslides, 780 ha wason uneroded ground and 418 ha was on previouslyeroded sites. A value of 110 Mg C ha−1 from 1938scars was used as the average carbon content of pre-viously eroded landslide scars, as 1938 is about halfway in the 114-year period of European settlement,and this value is consistent with carbon recoveryrates (Fig. 6). A carbon content of 175 Mg C ha−1
applied to 780 ha, and 110 Mg C ha−1 applied to418 ha, gives a total of 182 500 Mg C eroded in 114years at a rate of 1.17 ± 0.22 Mg C ha−1 per year.Assuming an SDR of 0.43, then 78 500 Mg C has en-tered the lake at a rate of 0.50± 0.15 Mg C ha−1 peryear from the area of landslide-prone land (1369 ha).This is 33% of the soil carbon in the landslide-proneterrain at the commencement of European settle-ment.
4.2. Soil carbon losses from sheetwash erosion
Sheetwash sediment is derived from diffuse ar-eas of bare ground within the pasture sward, espe-cially from steep areas where the pasture is heavilygrazed or affected by drought. Farm tracks, landslidescars and debris tails are also sources of sheetwashsediment. Most landslide scars revegetate within10–20 years, while debris tails revegetate within2–3 years.
While landsliding is the main erosion process inthe Tutira catchment, contributing 67 wt.% of thesediment delivered to the lake in 114 years, the contri-bution of sheetwash erosion is not so well quantified.Estimates of the contribution that sheetwash has madeto the sediment and carbon budgets since Europeansettlement have been constrained by the above figure,together with a sediment budget for Cyclone Bola

570 M. Page et al. / Agriculture, Ecosystems and Environment 103 (2004) 561–579
(Page et al., 1994a), where landslides accounted for89% of the sediment volume mobilised, channel ero-sion 2%, tunnel gully 2%, and sheetwash erosion 7%.
The carbon content of translocated sediment canbe at least twice that of the average topsoil (VanNoordwijk et al., 1997), as the lighter particles thatcontain the most carbon are transported more readilyand furthest (Voroney et al., 1981). The following cal-culation of soil carbon losses from sheetwash erosioncan be regarded as a minimum, as it assumes that thepercentage of soil carbon in the sediment deliveredto the lake is the same as the carbon content of theuneroded topsoil (∼0–10 cm).
4.2.1. Sheetwash sediment delivered to lake (Ssd)The amount of sheetwash sediment delivered to the
lake was calculated from the total sediment deliveredto the lake using:
1. percentage of sheetwash sediment in storm layers;2. percentage of core sediment derived from non-
landslide-generating storms.
In the sediment budget for Cyclone Bola, sheetwasherosion was estimated to account for 7% of the sedi-ment volume mobilised, and for a similar percentageof the sediment delivered to the lake. Therefore, forthe 75% of the European sediment that was derivedfrom landslide-generating storms (Page and Trustrum,1997), 7% was assumed to have been derived fromsheetwash erosion.
The majority of the remaining 25% of Europeansediment was derived from rainfalls below the thresh-old for landsliding. Based on the ratio of sheetwasherosion to channel erosion to tunnel gully erosion forCyclone Bola,∼64% of this sediment was derivedfrom sheetwash erosion.
Therefore, of the 8 919 000 Mg of sediment deliv-ered to the lake, 1 895 000 Mg (21%) was derived fromsheetwash erosion.
Table 4Sheetwash erosion-derived carbon delivered to lake
1887–1925 1925–1963 1963–2001 1887–2001
Sediment delivered to lake (Mg) 715 365 533 854 645 963 1 895 182± 20%C in top soil (wt.%) 5.06 4.33 3.89Relative sedimentation rates 1.34 1.00 1.21Carbon (Mg) 36 197 23 116 25 128 84 441± 38%
4.2.2. Carbon delivered to lake (SCd)The amount of sheetwash erosion-derived carbon
was estimated for each 38-year period, based on therelative sedimentation rates in the cores and carboncontent of six top soils (0–10 cm) (Table 4). Carboncontent of top soils of 5.06 wt.% for the 1887–1925period, 4.33 wt.% for the 1925–1963 period and3.89 wt.% for the 1963–2001 period were used, basedon the carbon content of uneroded ground, new scarsand old scars, and the proportion of each surface ineach period. An estimated 84 500 Mg C has enteredthe lake at a rate of 0.44± 0.17 Mg C ha−1 per yearfrom 1679 ha of sheetwash erosion-prone land (slopes>10◦). This is 29% of the soil carbon in the sheet-wash erosion-prone terrain at the commencement ofEuropean settlement.
4.3. Total soil carbon losses from erosion
Combined landslide and sheetwash erosion deliv-ered 163 000 Mg C to the lake in 114 years (55% ofC in landslide and sheetwash erosion-prone terrain atEuropean arrival), at a rate of 0.94± 0.23 Mg C ha−1
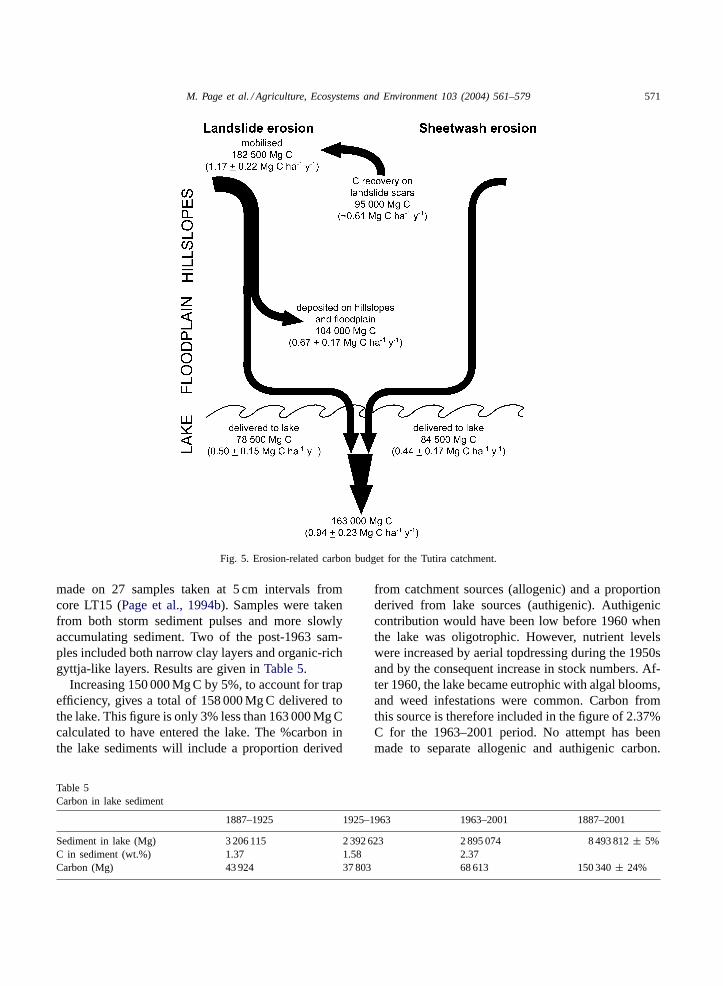
per year (0.50+ 0.44 Mg C ha−1 per year). There is,therefore, 0.94± 0.23 Mg C ha−1 per year potentiallyavailable for oxidation to CO2, as it is transporteddownstream, in this case to the lake or, in other catch-ments to the ocean, to be ultimately buried in marinesediments. A further 0.67± 0.17 Mg C ha−1 per yearis available in deposits on hillslopes and floodplains(Fig. 5).
4.4. Comparison of erosion-derived estimate ofcarbon loss with carbon content of lake sediment
The amount of carbon estimated to have been de-posited in the lake was compared with the carboncontent of lake sediment. Carbon measurements were
M. Page et al. / Agriculture, Ecosystems and Environment 103 (2004) 561–579 571
Fig. 5. Erosion-related carbon budget for the Tutira catchment.
made on 27 samples taken at 5 cm intervals fromcore LT15 (Page et al., 1994b). Samples were takenfrom both storm sediment pulses and more slowlyaccumulating sediment. Two of the post-1963 sam-ples included both narrow clay layers and organic-richgyttja-like layers. Results are given inTable 5.
Increasing 150 000 Mg C by 5%, to account for trapefficiency, gives a total of 158 000 Mg C delivered tothe lake. This figure is only 3% less than 163 000 Mg Ccalculated to have entered the lake. The %carbon inthe lake sediments will include a proportion derived
Table 5Carbon in lake sediment
1887–1925 1925–1963 1963–2001 1887–2001
Sediment in lake (Mg) 3 206 115 2 392 623 2 895 074 8 493 812± 5%C in sediment (wt.%) 1.37 1.58 2.37Carbon (Mg) 43 924 37 803 68 613 150 340± 24%
from catchment sources (allogenic) and a proportionderived from lake sources (authigenic). Authigeniccontribution would have been low before 1960 whenthe lake was oligotrophic. However, nutrient levelswere increased by aerial topdressing during the 1950sand by the consequent increase in stock numbers. Af-ter 1960, the lake became eutrophic with algal blooms,and weed infestations were common. Carbon fromthis source is therefore included in the figure of 2.37%C for the 1963–2001 period. No attempt has beenmade to separate allogenic and authigenic carbon.

572 M. Page et al. / Agriculture, Ecosystems and Environment 103 (2004) 561–579
However, recalculating the carbon in the lake sedi-ment by applying the 1925–1963 figure of 1.58% C tothe 1963–2001 period gave a total of 134 000 Mg C,18% less than 163 000 Mg C calculated to have en-tered the lake. This may be partially explained by alower (<95%) trap efficiency for carbon. The major-ity of the carbon is transported by clay-sized parti-cles, because of their greater surface area (Leitholdand Blair, 2001), and it is these lighter particles thatstay in suspension longest and are preferentially lostthrough the lake outlet. However, it is also likely tobe indicative of the amount of carbon released to theatmosphere during and after transport and deposition(Lal, 2001).
4.5. Carbon recovery
4.5.1. Carbon recovery by landslide scarsOf 182 500 Mg C eroded by landslides, 78 500 Mg C
was delivered to the lake. However, to calculate thenet loss of carbon from the landscape, carbon recoveryby landslide scars must be included. Recovery of car-bon is due to a combination of natural processes andhuman-induced recovery (oversowing and topdress-ing). Recovery was calculated using a carbon recoverycurve, derived from carbon measurements on landslidescars of different ages (Fig. 6), and area of landslidescars for each storm in the record. Carbon contentwas measured to bedrock (or the slip plane). Thecarbon recovery curve is derived from measurements
Fig. 6. Recovery curve of soil carbon on landslide scars.
of 12- and 62-year-old scars at Tutira, and 23- and37-year-old scars from Wairarapa sites near Master-ton. After ∼100 years recovery has reached∼70%of the uneroded value. This is similar to levels ofrecovery reported byLambert et al. (1984), Trustrumet al. (1990), Baisden et al. (2002), andSparling et al.(2003).
A total of 95 000 Mg C has been recovered by land-slide scars since 1887, at a rate of∼0.61 Mg C ha−1
per year. Unlike the gross estimates of carbon lossesby geomorphological processes, these figures repre-sent net carbon recovery after emission of carbon tothe atmosphere by oxidation.
4.5.2. Carbon recovery by sheetwash eroded pastureAs with landslide scars, carbon recovery is occur-
ring on 899 ha affected solely by sheetwash erosion. Inthe case of a landslide scar, the soil/regolith has beenremoved to a depth of∼1 m, and a new soil forms fromweathering of the regolith and accumulated material.It will take decades before another landslide occurs onthat site. During this time, the amount of carbon re-covered in the new profile can be measured. However,quantifying carbon recovery on areas prone to sheet-wash erosion is more difficult. As a more chronic formof erosion, carbon is being removed and recovered atthe same time and on a more regular basis. Conse-quently, no attempt was made to quantify carbon re-covery on areas affected solely by sheetwash erosion.However, when compared with other components of
M. Page et al. / Agriculture, Ecosystems and Environment 103 (2004) 561–579 573
the budget, recovery rate is likely to be less than halfthat on landslide scars.
5. Discussion
5.1. Carbon mobilisation and yields
There is debate about the role of erosion in thecarbon cycle and its importance as a mechanism forsoil carbon loss, with the majority of studies be-ing carried out on water erosion of cropland. WhileSchlesinger (1986)and Rasmussen and Albrecht(1998) discounted water erosion of cropland as animportant mechanism for soil carbon loss,Jacintheand Lal (2001)stated that such erosion makes a sig-nificant contribution both to soil carbon losses andto CO2 emissions, and quoted mobilisation rates ofbetween 30 and 260 g C m−2 per year from studies ofwater erosion of cropland in nine ecological regionsaround the world.
Results from Tutira indicate a mobilisation rate forlandsliding of 117 g C m−2 per year, and a combineddelivery rate to the lake from landsliding and sheet-wash erosion of 94 g C m−2 per year (50 g C m−2 peryear from landsliding and 44 g C m−2 per year fromsheetwash erosion). This is similar to the maximumcarbon yields of 100–300 g C m−2 per year quoted byStallard (1998)for small, wet, mountainous water-sheds with rapid erosion.
5.2. Carbon burial and carbon sequestration
Opinions also differ about whether erosion consti-tutes a carbon source or a carbon sink (Schlesinger,1990; Van Noordwijk et al., 1997; Stallard, 1998;Harden et al., 1999). Stallard (1998)estimated thathuman-induced erosion might be responsible for theburial of 0.6–1.5 Pg C in terrestrial sediments and formuch of the ‘missing carbon’ in global carbon budgets.A ‘dynamic equilibrium’ hypothesis proposes that thissink of buried carbon, together with recovery of carbonon eroded sites, may be in balance with initial lossesfrom erosion. At Tutira∼57% of carbon mobilised bylandslides is deposited on the landscape. The storageand ultimate burial of this carbon on hillslopes andvalley floors (assuming no flux to the atmosphere),together with recovery of carbon on landslide scars,
result in a net carbon gain of 9%. While these findingssupport contentions that landslide erosion constitutesa mechanism for significant carbon storage and mayplay an important role in the carbon cycle, pastoral,landslide-prone soft rock hill country is neverthelessa net source of carbon due to losses associated withsheetwash erosion.
5.3. Comparison of sheetwash erosion estimateswith other studies
There have been few other empirical studies ofsheetwash erosion in New Zealand soft rock hill coun-try. Lambert et al. (1985)reported sediment losses of1.22–2.74 Mg ha−1 per year (depending on grazingmanagement), from hill country catchments at theAgResearch Ballantrae Hill Country Research Stationin Hawke’s Bay. Annual losses of soil C in sedi-ment in runoff water were∼0.08 Mg ha−1 (Lambertet al., 2000). DeRose (unpublished data) calculateda sediment yield of 0.40–2.0 Mg ha−1 per year fromsheetwash erosion in the Mangaotama catchment nearHamilton.
Sediment accumulation was measured by the au-thors of this paper in 1998 in seven stock ponds in theWaipaoa catchment (Fig. 1) where sheetwash was theonly erosion process (Appendix B). Because trap ef-ficiency is unknown, rates of accumulation representonly minimum sediment losses. The average accu-mulation rate from the seven catchments, includingorganic carbon, was 8.25 Mg ha−1 per year (includesanimal excreta), and 7.95 Mg ha−1 per year withoutorganic carbon. By comparison, the sediment yield,from the sheetwash erosion-prone terrain in the Tutiracatchment (1679 ha) for the 1963–2001 period, was10.09 Mg ha−1 per year including organic carbon, and9.70 Mg ha−1 per year without organic carbon. Thestock pond accumulation rate is 82% of the Tutirayield, both with and without carbon. If a 90% trapefficiency is presumed, this would increase the pondyield to 90% of the Tutira yield.
The rates of sheetwash erosion from the East Coast(Tutira and Waipaoa) are 4–5 times greater than thosereported byLambert et al. (1985)for Ballantrae andDeRose (unpublished data) for the Waikato. How-ever, rates are expected to be significantly greater,given that the East Coast sites have a steeper, moreerodible terrain, and are subject to a higher frequency

574 M. Page et al. / Agriculture, Ecosystems and Environment 103 (2004) 561–579
and magnitude of storms (Tomlinson, 1980; Glade,1998).
5.4. Event resistance
Perhaps the greatest potential source of error in theapproach outlined in this paper is the assumption ofstationarity in the relationship between storm rainfalland landsliding. Progressive regolith removal by land-slides at a rate greater than weathering rates resultsin a rise in the threshold for landsliding and a changein the relationship. Evidence for this phenomenon oc-curs at Lake Tutira where Cyclone Bola in 1988, witha rainfall of 753 mm, deposited only 70% of the sedi-ment volume deposited by the 1938 storm with a rain-fall of 692 mm (Page et al., 1994a,b). Variables suchas rainfall intensity and antecedent conditions also in-fluence event resistance.
The 1925–1963 period has a 16% reduction in theamount of landslide sediment delivered to the lakecompared with the 1887–1925 period, whereas therainfall–landslide relationship predicts only a 10% re-duction. This difference may be evidence of a risinglandslide threshold, or may be due either to a changein SDR resulting from a different mix of storm sizesfor the two periods or to errors in the data. The samecomparison could not be made for the 1963–2001 pe-riod because of the absence of post-1988 sediment inthe cores.
5.5. Sediment delivery ratio
The soil carbon losses calculated in this study arestrongly influenced by the sediment delivery ratio, butlittle work has been done on sediment delivery fromlandsliding in New Zealand hill country. Sediment de-livery increases with increasing storm rainfall, by ex-tending the stream channel network further upslope toincrease connectivity with landslides, and by increas-ing transmission of debris tail sediment by overlandflow (Trustrum et al., 1999). A sediment delivery ra-tio of 0.56 was calculated for Cyclone Bola (753 mm)in the Tutira catchment (Page et al., 1994a; Reid andPage, 2002). In the Waipaoa catchment, on similarterrain, a delivery ratio of 0.5 was estimated byReidand Page (2002)for Cyclone Bola (ca. 600 mm). Ter-rain factors that influence sediment delivery ratios in-clude slope angle, slope length, landslide position and
size, and drainage density.Dymond et al. (1999)cal-culated delivery ratios of 0.2–0.54 for Cyclone Bolafor a number of terrains using a computer simulationmodel. However, measured sediment delivery ratiosfor smaller storms are lacking.
The problems of the influence of storm rainfall andterrain factors on sediment delivery have been over-come in this study by calculating an average sedimentdelivery ratio for all storms. In 114 years there havebeen ca. 64 rainstorms >200 mm, which is the approx-imate threshold for a significant landslide event. Theaverage SDR of 0.43 is heavily influenced by CycloneBola and the 1938 storm. Assuming that these twostorms (753 and 692 mm) had an SDR of 0.56 (ac-counting for more than 50% of the sediment volumeaccumulated in the lake), then the other 62 storms>200 mm had an average SDR of∼0.31.
5.6. Contribution of other erosion processes
Channel erosion and tunnel gully erosion are minorprocesses (Page et al., 1994a). During Cyclone Bolathey were responsible for only 2% each of the sedi-ment volume generated. On this basis, channel erosionwould mobilise 695 500 Mg sediment in 114 years,160 500 Mg (30%) of which would overbank onto val-ley floors, and deliver 535 000 Mg of sediment to thelake. With a mean carbon value of 1.52 wt.% for al-luvial soils to 1 m depth (average of four East Coastsoils), this would equate to∼8150 Mg C delivered tothe lake. This is regarded as a minimum value, as theaverage depth of channel incision is 1.84 m.
Carbon losses from tunnel gully erosion are negligi-ble. The gullies are ca. 1 m in depth, and the majorityof the material eroded is poorly consolidated tephrathat lies beneath the topsoil. Although the turf matmay collapse on removal of this material, most of thecarbon-rich topsoil is retained on the slope.
5.7. Scaling up
Catchment-based studies of erosion-related carbontransfers, such as Tutira and the nearby Waipaoacatchment (Gomez et al., 2003), provide a temporaland spatial basis to scale up results to the nationalscale. The validity of applying the gross rate of car-bon loss of 0.94 Mg C ha−1 per year to the nationalscale depends on the representativeness of the Tutira

M. Page et al. / Agriculture, Ecosystems and Environment 103 (2004) 561–579 575
catchment. Nationally, for landslide-prone soft rockhill country, the proportion of steeplands to easyhill country is the same as at Tutira (ratio 2:1). Thefrequency of landslide-triggering storms at Tutirais one storm every 1.75 years. The frequency ofrecorded landslide-triggering storms nationally forthis terrain is one storm every 2–3 years (∼80%)and one storm every 3–8 years (∼20%) (Glade,1998).
The issue of increased storage potential of largercatchments arises when results are extrapolated to thenational scale. At Tutira, 20% of sediment volumeentering watercourses during Cyclone Bola was rede-posited on valley floors (7% of the catchment) (Pageet al., 1994a). Similar values have been reported forthe larger Waipaoa catchment (220 499 ha), wherebetween 1979 and 1990 sediment deposition on thefloodplain (10.5% of the catchment) accounted for16% of the suspended sediment load transported dur-ing four large floods (including Cyclone Bola) and21% of the sediment transported by flows in excessof bankfull discharge (Gomez et al., 1999).
On a national scale, there are 4 910 000 ha ofsimilar terrain (mudstone/sandstone steeplands andtephra/loess hill country). For 2 496 000 ha in pasture,this equates to a gross loss of 2 346 500 Mg C peryear. For 2 414 000 ha in forest/scrub, gross loss is227 000 Mg C per year (based on a ten-fold reductionin erosion under forest (Page and Trustrum, 1997)).Total gross loss from New Zealand landslide-pronesoft rock hill country is therefore 2 573 500 Mg Cper year, of which the anthropogenic component is2 112 000 Mg C per year (2 346 500–234 500 Mg Cper year).
However, the net loss to the landscape is signifi-cantly less due to carbon recovery on eroded sites.Carbon recovery on landslide scars (after oxidation)equates to 1 670 000 Mg C per year, of which the an-thropogenic component is 1 370 500 Mg C per year.Carbon recovery on areas affected solely by sheet-wash erosion was not measured, but is significantlylower.
6. Conclusions
Erosion-related soil carbon losses from a steep-land catchment are estimated in this paper by linking
existing information on erosion and sediment trans-fers with soil carbon data. Results represent theupper limit for landslide-related soil carbon fluxes.This empirically based approach provides data thatwill be used to help constrain mass balance modelsof landslide and sheetwash-related carbon losses atthe national scale. It is the first time an attempt hasbeen made in New Zealand to calculate soil car-bon losses for such a long time period (114 years),on a process basis, and was made possible by theunique combination of a high-resolution lake sedi-ment record, historical records, and several decadesof geomorphic research. A major advantage is thatthe rates of carbon loss reflect variability in stormmagnitude and frequency not captured by short-termmonitoring.
Although erosion results in a net carbon lossfrom the landscape, carbon recovery on eroded sitesand carbon storage in depositional sites do signif-icantly offset the gross carbon losses that occur.The gross loss from Tutira erosion-prone terrain is0.94 ± 0.23 Mg C ha−1 per year. This equates to anational gross loss of 2 573 500 Mg C per year fromsimilar terrain, of which 2 112 000 Mg C per yearis associated with pastoral farming. Carbon recov-ery on landslide scars (after oxidation) at a rate of∼0.61 Mg C ha−1 per year equates to 1 670 000 Mg Cper year, of which the anthropogenic component is1 370 500 Mg C per year.
It is emphasised that this is an estimate oferosion-related soil carbon losses from best availabledata and understandings, originally obtained for otherpurposes. Errors are associated with each of the valuesused, and the sequence of calculations has introducedfurther uncertainty. However, the results are wellwithin an order of magnitude, and are supported bycomparison with the estimates presented from otherstudies. The accuracy of these results is regarded asadequate, given the paucity of data available for someerosion processes and landscapes, and the assump-tions and uncertainties associated with modelling atthe national scale.
Landslide-prone soft rock hill country is one of themajor sources of erosion-related soil carbon losses inNew Zealand. It is clear that reducing this erosionthrough better management and changing land usewill make a significant contribution to meeting NewZealand’s target of reducing CO2 emissions.

576 M. Page et al. / Agriculture, Ecosystems and Environment 103 (2004) 561–579
Acknowledgements
Thanks to Hugh Wilde and Murray Jessen for sam-pling soils and providing soil carbon data, and toNicolette Faville for graphics. Nick Preston providedhelpful comments on the manuscript.
Funds for this research were provided by TheFoundation for Research, Science and Technologyunder contract number C09X0013, and by LandcareResearch New Zealand Ltd. from the New Busi-ness Investment Programme “Reducing uncertaintyin the effect of soil erosion on the national carbonbudget”.
Appendix A. Uncertainty propagation
The application and propagation of uncertaintiesto calculations is explained in this Appendix, and isarranged in the same order of occurrence as the mainbody of the text. All calculations represent standarderrors and assume Gaussian (normal) distributionsfor the variables in question. Additionally, these errorpropagations assume that variables are uncorrelated.Given this assumption, propagated uncertainties rep-resent best estimates of uncertainty, and must be in-terpreted with somewhat more caution than measureduncertainties.
Volume of sediment eroded by landslides (LSe) isassigned a coefficient of variation (CoV) of 15% (Reidand Page, 2002). Uncertainty in the sediment deliv-ered to the lake (Sd) is governed by uncertainty inbathymetry and trap efficiency, and is assigned a CoVof 5% (T. Pinkney, personal communication).
The landslide sediment delivered to the lake (LSd)derives from sediment pulse thicknesses in cores, andis thus estimated from the most recognisable sedi-ment layer—that derived from the 1938 storm. The1988 storm is of similar magnitude and recognisablein all cores, but was not yet capped by other sedi-ments in all cores to a sufficient degree that the topof the sediment pulse was recovered within the core.The 1938 storm sediment thicknesses yield a CoVof 16%.
The sediment delivery ratio for landslides is thenthe ratio of sediment produced to sediment delivered(LSe/LSd). For propagating uncertainties presentedas CoV’s through product or ratio calculations, the
uncertainties are summed in quadrature:
CoVSDR =√
CoVLSe2 + CoVLSd
2 (A.1)
This formula yields CoVSDR of 22% of the SDR value,which can be written as 0.43± 09.
The area eroded by landslides (Ae1, Ae2) is calcu-lated as the volume of sediment eroded by landslides(LSd) divided by the average scar depth. The CoV ofthe average scar depth is estimated as 5% based onPage et al. (1994a)and the quartile ranges inMerzand Mosley (1998).
The carbon content of soil (Cs1, Cs2) to 1 m depthcan be variable, but estimates of soil C content to 1 mdepth for the soil/climate types predominating for thestudy area have a CoV of roughly 10% (Scott et al.,2001). Using this value, the C eroded is the productof the C content of soil (Cs1, Cs2) and the area eroded(Ae1, Ae2), and is calculated usingEq. (A.1)as havinga CoV of 19%. The soil C delivered to the lake (LCd)is the product of this value and the SDR. Given thatthe SDR for the fine soil particles with which C isassociated is likely greater, an additional 10% erroris added to the SDR, yielding a calculated CoV (viaEq. (A.1)) of 31% for LCd.
The amount of sheetwash sediment delivered to thelake (Ssd) is estimated based on a sediment budget(Page et al.,1994a), indicating that sheetwash accounts for 7% ofthe mobilised sediment. The overall sediment budgethas an uncertainty of 5% (Page et al., 1994a), so thisvalue is conservatively taken as 7± 5%, or a CoV of71%. This sediment budget is assumed to apply tolarge landslide-inducing storms. For smaller storms,the sheetwash contribution to total sediment repre-sents the remainder of sediment after assuming that18± 5% derives from channels and 18± 10% fromtunnel gullies. The addition of this uncertainty inquadrature yields a CoV of 11% for small storm Ssd.Since large and small storms contribute additively toSsd, uncertainty in the contribution of both large andsmall storms to Ssd is best calculated as the sum ofthe absolute uncertainties (e.g. CoV× Ssdsmall):
CoVSsd= 1
Ssd
√(Ssdsmall × CoVsmall)
2
+(Ssdlarge× CoVlarge)2 (A.2)
This equation yields a CoV of 20% or a value of 0.44±0.09 Mg C ha−1 per year for Ssd.

M. Page et al. / Agriculture, Ecosystems and Environment 103 (2004) 561–579 577
But, the uncertainty in soil C delivered to the lakeby sheetwash must be considered. We assume 10%uncertainty in surface (0–10 cm) soil C concentra-tions (Scott et al., 2001) but raise uncertainty to 30%because sheetwash may not uniformly transport theupper 10 cm of soil. UsingEq. (A.1) to include anadditional 30% uncertainty in SCd results in a CoVof 36%. Assuming that the land area within the catch-ment subject to sheetwash erosion is uncertain by10%, the final uncertainty on SCd may be estimatedas 38% or be written as 0.44 ± 0.17 Mg C ha−1 peryear.
The total loss of soil C due to erosion is calculatedas the sum of sheetwash and landslide erosion. Calcu-lating as inEq. (A.2), overall uncertainty is estimatedas 24%, or the total C delivered to the lake can bewritten as 0.94± 0.23 Mg C ha−1 per year.
Appendix B. Sediment accumulation rates from stock ponds
Pond Lithology Catchmentslope (◦)
Rainfall(mm p.a.)
C(wt.%)
Bulkdensity(Mg m−3)
Years of ac-cumulation
Accumulationrate withoutorganic matter(m3 ha−1 per year)
Accumulationrate includingorganic matter(m3 ha−1 per year)
1 Mudstone 20–22 1081 3.32 0.80 4 2.93 3.052 Tephra on
mudstone14–18 1081 2.91 0.73 4 12.34 12.81
3 Mudstone 22–27 1437 1.61 0.93 5 8.47 8.614 Alternating
mudstone/sandstone
28–32 1830 2.47 0.84 9 12.74 13.07
5 Loosejointedmudstone
10–18 1450 28.62 0.30 40 7.60 10.72
6 Tephra andsandstone
10–32 1113 1.04 1.13 5 18.07 18.25
7 Tephra andsandstone
10–35 1113 3.34 0.79 9 3.84 3.98
References
Adams, J., 1979. Sediment loads of North Island rivers, NewZealand—a reconnaissance. J. Hydrol. NZ 18, 36–48.
Baisden, W.T., Parfitt, R.L., Trustrum, N.A., 2002. Using nutrientbalance to estimate net C balance in landslide-prone pastoralhill country: testing the dynamic equilibrium hypothesis inNew Zealand soft rock landscapes. In: Proceedings of the12th International Soil Conservation Organisation Conference,Beijing, China, 26–31 May 2002.
It is also useful to estimate the uncertainty ontotal soil C eroded, thus including C eroded bylandsliding but not delivered to the lake. Calcu-lating as in Eq. (A.2) yields a CoV of 17% or1.60±0.28 Mg C ha−1 per year. Similarly, it is possibleto calculate an uncertainty for the C eroded by lands-liding but not delivered to the lake, as LCe(1−SDR).Taking (1−SDR) as 0.57± 0.9 or a CoV of 17%—together with the CoV of 19% calculated for prod-uct of the area of landslides and carbon content ofsoil—yields an estimate of 0.67±0.17 Mg C ha−1 peryear or 25% CoV. This final calculation emphasisesthat with good sediment budgets it may be possibleto better constrain the terrestrial sediment C budgetscenarios examined byStallard (1998). No estimatewas made of the uncertainty on carbon recovery bylandslides scars, due to limited data.
Brune, G.M., 1953. Trap efficiency of reservoirs. Trans. Am.Geophys. Union 34 (3), 407–418.
Crozier, M.J., Eyles, R.J., Marx, S.L., McConchie, J.A., Owen,R.C., 1980. Distribution of landslips in the Wairarapa hillcountry. NZ J. Geol. Geophys. 23, 575–586.
Davis, M.R., Wilde, R.H., Oliver, G., Scott, N.A., Tate, K.R.,Giltrap, D.J., Betts, H., Chinnery, P., Nordmeyer, A., 1999.Contribution of soil carbon to New Zealand’s CO2 emissions.IX. Updated 1990 soil carbon baseline. Contract report toMinistry for the Environment, JNT 9899/146.

578 M. Page et al. / Agriculture, Ecosystems and Environment 103 (2004) 561–579
Dymond, J.R., Jessen, M.R., Lovell, L.R., 1999. Computersimulation of shallow landsliding in New Zealand hill country.Int. J. Appl. Earth Geoinf. 1 (2), 122–131.
FAO–UNESCO, 1974. Soil Map of the World, 1:5 000 000, vol.1, Legend. UNESCO, Paris.
Giltrap, D.J., Betts, H., Wilde, R.H., Oliver, G., Tate, K.R.,Baisden, W.T., 2001. Contribution of soil carbon to NewZealand’s CO2 emissions. Report XIII. Integrated GeneralLinear Model and Digital Elevation Model. Ministry for theEnvironment, Wellington, New Zealand, p. 50.
Glade, T., 1998. Establishing the frequency and magnitude oflandslide-triggering rainstorm events in New Zealand. Environ.Geol. 35 (2–3), 160–174.
Gomez, B., Eden, D.N., Hicks, D.M., Trustrum, N.A., Peacock,D.H., Wilmshurst, J., 1999. Contribution of floodplainsequestration to the sediment budget of the Waipaoa River, NewZealand. In: Alexander, J., Marriott, S.B. (Eds.), Floodplains:Interdisciplinary Approaches, vol. 163. Geological Society ofLondon, London, pp. 69–88 (special publication).
Gomez, B., Trustrum, N.A., Hicks, D.M., Rogers, K.M., Page,M.J., Tate, K.R., 2003. Production, storage and outputof particulate organic carbon: Waipaoa River basin, NewZealand. Water Resour. Res. 39 (6), 1161. DOI: 10.1029/2002WR001619.
Grant, P.J., 1966. Tutira Lake—1925 and 1963. Soil and Water2 (4), 21–22.
Guthrie-Smith, W.H., 1953. Tutira, the Story of a New ZealandSheep Station, 3rd ed. William Blackwood and Sons Ltd.,London.
Harden, J.W., Sharpe, J.M., Parton, W.J., Ojima, D.S., Fries, T.L.,Huntington, T.G., Dabney, S.M., 1999. Dynamic replacementand loss of soil carbon on eroding cropland. GlobalBiogeochem. Cycles 13 (4), 885–901.
Hicks, D.M., Shankar, U., McKerchar, A.I., Hume, T.M., Basher,L.R., Lynn, I.H., Jessen, M.R., Page, M.J., Webb, T., 2002.River suspended sediment yields to the New Zealand coastand estuaries. In: Poster Paper Presented at 2002 New ZealandMarine Sciences Symposium, Nelson, New Zealand, September2002.
IPCC, 2001. Summary for policy makers. In: Houghton, J.T., Ding,Y., Griggs, D.J., Noguer, M., van der Linden, P.J., Dai, X.,Maskell, K., Johnson, C.A. (Eds.), Climate Change 2001: TheScientific Basis. Contribution of Working Group 1 to the ThirdAssessment Report of the Intergovernmental Panel on ClimateChange. Cambridge University Press, Cambridge, UK.
Jacinthe, P.A., Lal, R., 2001. A mass balance approach to assesscarbon dioxide evolution during erosional events. Land Degrad.Dev. 12, 329–339.
Lal, R., 1995. Global soil erosion by water and carbon dynamics.In: Lal, R., Kimble, J., Levine, E., Stewart, B.A. (Eds.), Soilsand Global Change. CRC/Lewis, Boca Raton, FL, pp. 131–142.
Lal, R., 2001. Soil degradation by erosion. Land Degrad. Dev. 12,519–539.
Lambert, M.G., Trustrum, N.A., Costall, D.A., 1984. Effects ofsoil slip erosion on seasonally dry Wairarapa hill pastures. NZJ. Agric. Res. 27, 57–64.
Lambert, M.G., Devantier, B.P., Nes, P., Penny, P.E., 1985.Losses of nitrogen, phosphorus, and sediment in runoff from
hill country under different fertiliser and grazing managementregimes. NZ J. Agric. Res. 28, 371–379.
Lambert, M.G., Clark, D.A., Mackay, A.D., Costall, D.A., 2000.Effects of fertiliser application on nutrient status and organicmatter content of hill soils. NZ J. Agric. Res. 43, 127–138.
Leithold, E.L., Blair, N.E., 2001. A watershed control on the carbonloading of marine sedimentary particles? Geochim. Cosmochim.Acta 65, 2231–2240.
Lyons, W.B., Nezat, C.A., Carey, A.E., Hicks, D.M., 2002. Organiccarbon fluxes to the ocean from high-standing islands. Geology30 (5), 443–446.
Merz, J., Mosley, M.P., 1998. Hydrological behaviour of pastoralhill country modified by extensive landsliding, northernHawke’s Bay, New Zealand. J. Hydrol. NZ 37 (2), 113–139.
Milliman, J.D., Syvitski, J.P.M., 1992. Geomorphic/tectonic controlof sediment discharge to the ocean: the importance of smallmountainous rivers. J. Geol. 100, 525–544.
Page, M.J., Trustrum, N.A., 1997. A late Holocene lake sedimentrecord of the erosion response to land use change in a steeplandcatchment, New Zealand. Z. Geomorphol. N.F. 41 (3), 369–392.
Page, M.J., Trustrum, N.A., Dymond, J.R., 1994a. Sediment budgetto assess the geomorphic effect of a cyclonic storm, NewZealand. Geomorphology 9, 169–188.
Page, M.J., Trustrum, N.A., DeRose, R.C., 1994b. A highresolution record of storm-induced erosion from lake sediments,New Zealand. J. Paleolimnol. 11, 333–348.
Page, M.J., Reid, L.M., Lynn, I.H., 1999. Sediment productionfrom Cyclone Bola landslides, Waipaoa catchment. J. Hydrol.NZ 38 (2), 289–308.
Preston, N.J., 1999. Event-induced changes in land surfacecondition—implications for subsequent slope stability. Z.Geomorphol. N.F. Suppl. Bd. 115, 157–173.
Rasmussen, P.E., Albrecht, S.L., 1998. Crop management effectson organic carbon in semi-arid Pacific Northwest soils. In:Lal, R., Kimble, J.M., Follett, R.F., Stewart, B.A. (Eds.),Management of Carbon Sequestration in Soil. CRC Press, BocaRaton, FL, pp. 209–219.
Reid, L.M., Page, M.J., 2002. Magnitude and frequency oflandsliding in a large New Zealand catchment. Geomorphology49 (1–2), 71–88.
Schlesinger, W.H., 1986. Changes in soil carbon storage andassociated properties with disturbance and recovery. In:Trabalka, J.R., Reichle, D.E. (Eds.), The Changing CarbonCycle: A Global Analysis. Springer, New York, pp. 194–220.
Schlesinger, W.H., 1990. Evidence from chronosequence studiesfor a low carbon-storage potential of soils. Nature 348, 232–234.
Scott, N.A., Tate, K.R., Giltrap, D.J., Newsome, P.F., Davis, M.R.,Baisden, W.T., Saggar, S., Trotter, C.M., Walcroft, A.S., White,J.D., Trustrum, N.A., Stephens, P.R., 2001. Critical issues inquantifying land-use change effects on New Zealand’s terrestrialcarbon budget: deforestation, afforestation, and reforestation. In:Proceedings of the Sixth International Conference on CarbonDioxide, vol. 1, Sendai, Japan, 1–5 October 2001 (ExtendedAbstracts).
Sparling, G., Ross, D., Trustrum, N.A., Arnold, G., West, A.,Speir, T., Schipper, L., 2003. Recovery of topsoil characteristics

M. Page et al. / Agriculture, Ecosystems and Environment 103 (2004) 561–579 579
after landslip erosion in dry hill country of New Zealand, anda test of the space-for-time hypothesis. Soil Biol. Biochem. 35,1575–1586.
Stallard, R.F., 1998. Terrestrial sedimentation and the carboncycle: coupling weathering and erosion to carbon burial. GlobalBiogeochem. Cycles 12 (2), 231–257.
Starr, G.C., Lal, R., Malone, R., Hothem, D., Owens, L., Kimble,J., 2000. Modeling soil carbon transported by water erosionprocesses. Land Degrad. Dev. 11, 83–91.
Tate, K.R., Giltrap, D.J., Claydon, J.J., Newsome, P.F., Atkinson,I.A.E., Taylor, M.D., Lee, R., 1997. Organic carbon stocks inNew Zealand’s terrestrial ecosystems. J. R. Soc. NZ 27 (3),315–335.
Tate, K.R., Scott, N.A., Parshotam, A., Brown, L., Wilde, R.H.,Giltrap, D.J., Trustrum, N.A., Gomez, B., Ross, D.J., 2000.A multi-scale analysis of a terrestrial carbon budget: is NewZealand a source or sink of carbon? Agric. Ecosyst. Environ.82, 229–246.
Taylor, N.H., Pohlen, I.J., 1968. Classification of New Zealandsoils. In: Soils of New Zealand. Part 1. NZ Soil Bureau report,vol. 26 (1), Chapter 2, pp. 15–46.
The Royal Society, 2001. The role of land carbon sinks in miti-gating global climate change. Policy document 10/01, 35 pp.
Thomas, V.J., Trustrum, N.A., 1984. A simulation model of soilslip erosion. In: Proceedings of the Symposium on Effects ofForest Land Use on Erosion and Slope Stability. Environmentand Policy Institute, East-West Centre, University of Hawaii,Honolulu, pp. 83–89.
Tomlinson, A.I., 1980. The frequency of high intensity rainfallsin New Zealand. Part 1. Water and Soil Technical Publicationno. 19, 36 pp.
Trustrum, N.A., Blaschke, P.M., DeRose, R.C., West, A.W.,1990. Regolith changes and pastoral productivity declinesfollowing deforestation in steeplands of North Island, NewZealand. In: Transactions of the 14th International Congressof Soil Science, Kyoto, Japan, August 1990, pp. 125–130.
Trustrum, N.A., Gomez, B., Page, M.J., Reid, L.M., Hicks, D.M.,1999. Sediment production, storage and output: the relativerole of large magnitude events in steepland catchments. Z.Geomorphol. N.F. Suppl. Bd. 115, 71–86.
Trustrum, N.A., Tate, K.R., Page, M.J., Sidorchuk, A., Baisden,W.T., 2002. Towards a national assessment of erosion-relatedsoil carbon losses in New Zealand. In: Proceedings of the12th International Soil Conservation Organisation Conferenceon Sustainable Utilization of Global Soil and Water Resources,Technology and Method of Soil and Water Conservation,vol. III, Beijing, China, 26–31 May 2002, pp. 182–186.
Van Noordwijk, M., Cerri, C., Woomer, P.L., Nugroho, K.,Bernoux, M., 1997. Soil carbon dynamics in the humid tropicalforest zone. Geoderma 79, 187–225.
Voroney, R.P., Van Veen, J.A., Paul, E.A., 1981. Organic carbondynamics in grassland soils. 2. Model validation and simulationof long-term effects of cultivation and rainfall erosion. Can. J.Soil Sci. 61, 211–224.