Embed Size (px)
Citation preview

ERCOT STEADY STATE WORKING GROUPPROCEDURAL MANUAL
NovemberAugust 20056
Approved by ROS on January 13, 2006 Submit to ERCOT Reliability and Operations Subcommittee for approval Aug 10, 2006.
1
ERCOT STEADY-STATE WORKING GROUP’S SCOPE
The ERCOT Steady-State Working Group (SSWG) operates under the direction of the Reliability and Operations Subcommittee (ROS). The SSWG’s main objectives are to produce seasonal and future load-flow base cases, coordinate tie-line data, update the Most Limiting Series Element Database, maintain the ERCOT Data Dictionary, update the SSWG Procedural Manual, prepare data for and review seasonal transmission loss factor calculation, and provide requested transmission system data and power-flow support documents to market participants. The SSWG usually meets in June and November to accomplish these tasks, and at other times during the year as needed to resolve any impending load-flow modeling issues or to provide technical support to the ROS. Some of the above responsibilities are further described as follows:
Develop and maintain load-flow base cases for the spring, summer, fall, and winter seasons of the upcoming year. The cases, collectively known as Data Set A, are produced by the SSWG by approximately July 1st on an annual basis. These seasonal cases consist of one on peak and one off-peak case for each of the four seasons.
Develop and maintain load-flow base cases for the five future years following the upcoming year. The cases, collectively known as Data Set B, are produced by the SSWG by approximately November 15th on an annual basis. These future cases consist of five summer on-peak cases, and one minimum case. Data Set B will contain economically dispatched generation (ECO) and congestion constrained dispatch (CSC), as determined by the SSWG.
Maintain and update the ERCOT Data Dictionary to reflect new bus information and SCADA names. This task is performed during the Data Set B work.
Maintain and update the SSWG Procedural Manual to reflect current planning practices and the latest load-flow base case modeling methodologies.
Prepare data for and review seasonal transmission loss factor calculation on an annual basis. This task is to be done by approximately January 1st.
Maintain and update the Most Limiting Series Element Database to reflect the most limiting ratings of transmission and substation equipment. This task is performed annually during Data Set A work.
Assist in development of ERCOT processes for compliance with NERC Planning Standards for both
entity and region-wide requirements.
Coordinate tie-line data submission to ERCOT with neighboring companies. Maintain and update the ERCOT Tie-Line Database for data set A and B. This task is performed during the Data Set A and Data Set B work.
Provide Transmission Project Information Tracking (TPIT) report to ERCOT quarterly.
Maintain and update the contingencies files.
Approved by ROS on January 13, 2006 Submit to ERCOT Reliability and Operations Subcommittee for approval Aug 10, 2006.
2

Address issues identified by ERCOT Reliability Assessment
Perform studies as directed by the ROS.
Approved by ROS on January 13, 2006 Submit to ERCOT Reliability and Operations Subcommittee for approval Aug 10, 2006.
3

Table of Contents
SECTION 1.0 – Data Requirements......................................................................51.1 General ...................................................................................................................61.2 Bus Data .................................................................................................................71.3 Load Data ..............................................................................................................81.4 Generator Data.......................................................................................................91.5 Line Data ..............................................................................................................131.6 Transformer Data ...............................................................................................211.7 Static Reactive Devices .......................................................................................251.8 Dynamic Control Devices ...................................................................................271.9 HVDC Devices......................................................................................................30
SECTION 2.0 – Load-flow Procedures and Schedules.............................................332.1 Data Set A Considerations .................................................................................342.2 Data Set B Considerations...................................................................................362.3 Error Screening and Case Updates....................................................................38
SECTION 3.0 – Other SSWG Activities........................................................................413.1 Transmission Loss Factor Calculation …..........................................................423.2 Voltage Control and Reactive Planning (to be determined)............................43
APPENDICES .........................................................................................................................44A Owner ID, TSP, Bus/Zone Range and Tables...............................................5345B Glossary of Terms............................................................................................5053C TSP Impedance and Line Ratings Assumptions...............................................55D MLSE................................................................................................................8183E TPIT..................................................................................................................8284F Treatment of Mothballed Units in Planning .....................................................85G Load Forecasting Methodology ..........................................................................87
Approved by ROS on January 13, 2006 Submit to ERCOT Reliability and Operations Subcommittee for approval Aug 10, 2006.
4

SECTION 1.0 – Data Requirements
Approved by ROS on January 13, 2006 Submit to ERCOT Reliability and Operations Subcommittee for approval Aug 10, 2006.
5

1.1 GENERAL
The principal function of the SSWG is to provide analytical support of the ERCOT electrical transmission network from a steady state perspective. To accomplish this, the Working Group performs three principal charges: load-flow, voltage control and reactive planning, and transmission loss factor calculation tasks.
1.1.1 Coordination with ERCOT Load-flow base cases provide detailed representation of the electric system for planning and evaluating the current and future high voltage electrical system and the effects of new loads, generating stations, interconnections, and transmission lines.
1.1.2 Model The model represents the high voltage system, branches, buses, bus components, impedances, loads, multi-section lines, ownership, switched shunts, transformers, generators, DC lines and zones. The network model submitted by the TSP shall be in a format compatible with the latest approved PSS/E and rawd ASCII data format based on a 100 MVA base. The model should reflect expected system operation.
1.1.3 DataThe SSWG will take the load data from the ERCOT Annual Load Data Request (ALDR) and build two sets of cases, Data Set A and Data Set B (see Sections 2.1 and 2.2).
Data Set A consists of seasonal cases for the following year. The SSWG must finalize Data Set A by early July to meet ERCOT schedule to perform the commercially significant constraint studies. Data Set B, which is finalized in mid-December, is used for planning purposes and consists of the following:
Future summer peak planning cases A future minimum load planning case ERCOT Data Dictionary
1.1.4 Load-flow Case UsesThe cases being created each year are listed in Sections 2.1 and 2.2. ESPTO and Transmission Service Providers (TSPs) test the interconnected systems modeled in the cases against the ERCOT Planning Criteria to assess system reliability in the coming year and into the future. ROS Working Groups and ERCOT System Operations use SSWG cases as the basis for other types of calculations and studies:
Internal planning studies and generation interconnection studies Voltage control and reactive planning studies Dynamics Working Group stability studies ERCOT transmission loss factor calculation Basis for ERCOT operating cases and FERC 715 filing Commercially significant constraints studies
Approved by ROS on January 13, 2006 Submit to ERCOT Reliability and Operations Subcommittee for approval Aug 10, 2006.
6

1.2 BUS DATA
1.2.1 Areas defined by TSP Each TSP is assigned a unique area name and number denoted in the TSP Bus/Zone Range Table in Appendix A.
1.2.2 Bus Data RecordsAll in-service transmission (60kV and above) and generator terminals shall be modeled in load-flow cases. Each bus record has a bus number, name, base kV, bus type code, real component of shunt admittance, reactive component of shunt admittance, area number, zone number, per-unit bus nominal voltage magnitude, bus voltage phase angle, and owner id. Fixed reactive resources shall be modeled as a fixed component in the switchable shunt data record and not be part of the bus record.
1.2.3 Bus RangesPresently, ERCOT is modeled within a 100,000-bus range. The Chairman of the SSWG allocates bus ranges, new or amended, with confirmation from the SSWG members. Bus ranges are based on high-side bus ownership. (Refer to TSP Bus/Zone Range Table in Appendix A)
Bus numbers from within the TSP’s designated bus range are assigned by the TSP and are to remain in the assigned ranges until the equipment or condition that it represents in the ERCOT load-flow cases changes or is removed.
1.2.4 Zone RangesPresently the Chairman of the SSWG allocates zone ranges, new or amended, with confirmation from SSWG members. Each TSP represents their network in the ERCOT load-flow cases using allocated zone ranges. Zone numbers that have been assigned by the TSP, within the TSP’s designated zone range, may be changed by the TSP as needed to represent their network in the ERCOT load-flow cases. Every zone number assigned must be from the TSP’s designated zone range. Zone identifiers are specified in zone data records. Each data record has a zone number and a zone name identifier. (Refer to TSP Bus/Zone Range Table in Appendix A).
1.2.5 Owner IDsAll TSPs may provide owner IDs for buses. This data is maintained in the Owner ID, TSP Bus/Zone Range Table shown in Appendix A. The generation owner ID’s are not in the cases due to the difficulty in tracking the continuously changing ownership.
1.2.6 Bus Name As of April 1, 2000, bus names shall not identify the customers or owners of loads or generation at new buses unless requested by customers.
Approved by ROS on January 13, 2006 Submit to ERCOT Reliability and Operations Subcommittee for approval Aug 10, 2006.
7
1.3 LOAD DATA
Each bus modeling a load must contain at least one load data record. Each load data record contains a bus number, load identifier, load status, area, zone, real and reactive power components of constant MVA load, real and reactive power components of constant current load, and real and reactive power components of constant admittance load. All loads (MW and MVAR) should be modeled on the high side of transformers serving load at less than 60 kV.
Guidelines:
1.3.1 The bus number in the load data record must be a bus that exists in the base case. As of 2001 owner IDs shall not be associated with any entity in cases.
The load identifier is a two-character alphanumeric identifier used to differentiate between loads at a bus. All self-serve loads greater than 50 MW must be identified by “SS”. See Section 1.4.1. Partial self-serve load should be modeled as a multiple load with “SS” identifying the self-serve portion. Interruptible loads must be identified by TSP. Distributed generation less than 10 MW must be identified by “DG” and modeled as negative load.
1.3.2 The load data record zone number must be in the zone range of the TSP serving the load. It does not have to be the same zone that the bus is assigned to.
1.3.3 Generator auxiliary load should not be modeled at generating station buses. Refer to section 1.4.1. 1.3.4 Unclaimed Load Statement to be added here………Unless other arrangements are being made,
each TSP is ultimately responsible for collecting and submitting the data of any load (including load served by another Genco) that connects to its transmission facilities. It is not uncommon that a customer load served by a Genco (A) through a transmission substation owned by another TSP (B). The matter can be further complicated if the substation cuts into the transmission circuit owned by another TSP (C). In this scenario, TSP B and TSP C need to work out an agreement on who will report the load information just like the way it works with ties. Self –serves should follow the same rule for their load and submit the information to their TSP for case modeling.
1.3.5 Multiple loads from different TSPs at a bus may be used. At this time, each TSP can define a load however it wishes with a load ID of its choice though careful coordination is required between TSP representatives to ensure that the loads at the bus get modeled correctly.
Approved by ROS on January 13, 2006 Submit to ERCOT Reliability and Operations Subcommittee for approval Aug 10, 2006.
8

1.4 GENERATOR DATA
1.4.1 Acquisition of Generator DataOnly net real and reactive generator outputs and ratings should be modeled in load-flow cases. Net generation is equal to the gross generation minus station auxiliaries and other internal power requirements. All non-self-serve generation connected at 60kV and above with at least 10 MW aggregated at the point of interconnect must be explicitly modeled. A generator explicitly modeled must include generator step-up transformer and actual no-load tap position. Generation of less than 10 MW is still required to be modeled, but not explicitly.
Unit reactive limits (leading and lagging) should be determined from the most recent generator reactive unit test. Unit reactive limits (leading and lagging) are tested at least once every two years (ERCOT Protocols, Section 6.10.3.5 and ERCOT Operating Guides, Section 6.2.3). Each generator establishes unit reactive limits (leading and lagging) by supplying a Corrected Unit Reactive Limit (CURL) curve to ERCOT. To be an acceptable test the unit must be operating at or above 95% of its net dependable megawatt capability and the measured reactive capability must be equal to or greater than 90% of the established CURL. The minimum acceptable test duration is 15 minutes. If the test meets all of these requirements the unit reactive limits established on the CURL are approved. If the test does not meet these requirements, ERCOT can request another test or a modified CURL. Note that the CURL MVAr values are gross values at the generator terminals.
Generator reactive limits should be modeled by one value for Qmax and one value for Qmin as described below:
Qmax
Qmax is the maximum net lagging MVAr observed at the low side of the generator step up transformer when the unit is operating at its maximum net dependable MW capability. Qmax is calculated from the lagging CURL value by subtracting any auxiliary MVAr loads and any Load Host MVAr (Self Serve) load served from the low side of the generator step up transformer.
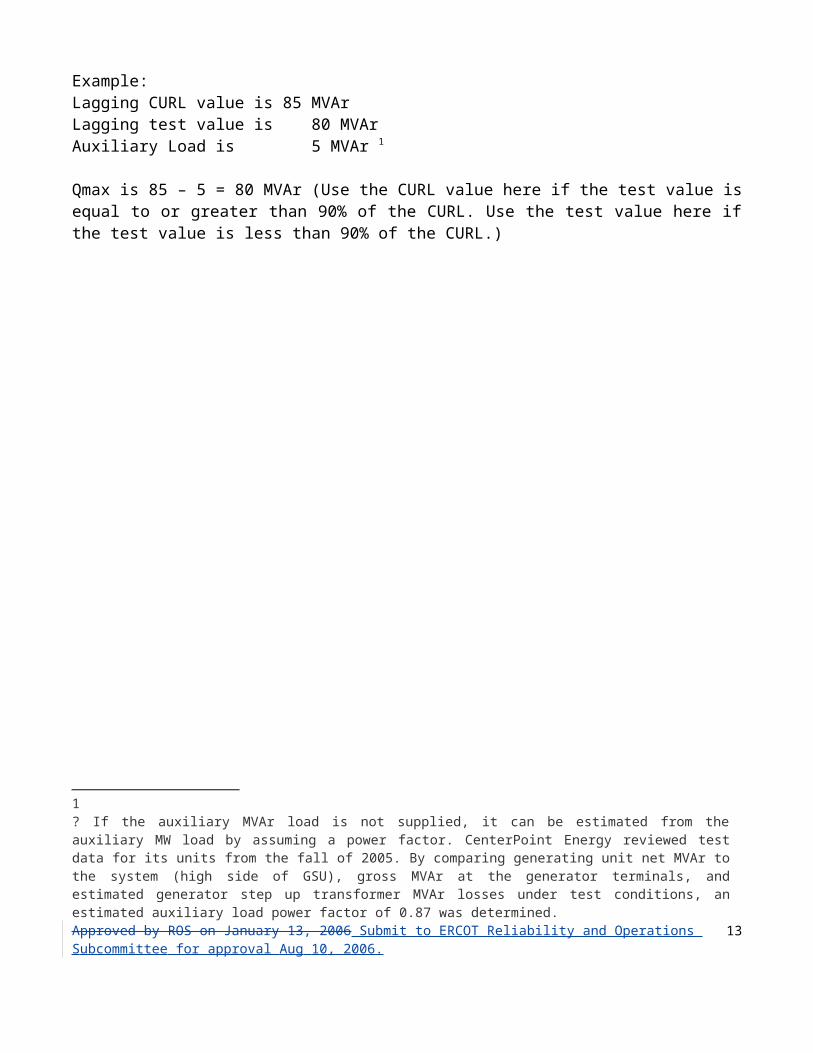
Example:Lagging CURL value is 85 MVArLagging test value is 80 MVArAuxiliary Load is 5 MVAr 1
Qmax is 85 – 5 = 80 MVAr (Use the CURL value here if the test value is equal to or greater than 90% of the CURL. Use the test value here if the test value is less than 90% of the CURL.)
1? If the auxiliary MVAr load is not supplied, it can be estimated from the auxiliary MW load by assuming a power factor. CenterPoint Energy reviewed test data for its units from the fall of 2005. By comparing generating unit net MVAr to the system (high side of GSU), gross MVAr at the generator terminals, and estimated generator step up transformer MVAr losses under test conditions, an estimated auxiliary load power factor of 0.87 was determined.Approved by ROS on January 13, 2006 Submit to ERCOT Reliability and Operations Subcommittee for approval Aug 10, 2006.
9

Qmin
Qmin is the maximum leading MVAr observed at the low side of the generator step up transformer when the unit is operating at its maximum net dependable MW capability. Qmin is calculated from the leading CURL value by adding any auxiliary MVAr loads and any Load Host MVAr (Self Serve) load served from the low side of the generator step up transformer.
Example:
Leading CURL value is -55 MVArAuxiliary Load is 5 MVAr
Qmin is -55 – 5 = -60 MVAr
Self-serve generators serve local load that does not flow through the ERCOT transmission system. Generation data should be submitted for self-serve facilities serving self-serve load modeled in the base case. Total self serve generation MWs shall match total self-serve load MWs. Any generating unit or plant with gross real power output of at least 50 MW. Any self-serve loads with a contract of at least 50 MW of backup power.
1.4.1.1 Coordination with Power Generating CompaniesERCOT shall request Power Generating Companies to provide the following information, in electronic format: Data forms from the ERCOT Generation Interconnection Procedure. See Appendix F. One-line electrical system drawing of the generator’s network and tie to TSP (or equivalent) in
readable electronic format (AutoCAD compatible) Modeling information of the generator’s transmission system in PTI or GE format Units to be retired or taken out for maintenance
1.4.1.2 Coordination with other ERCOT Working Groups All generator data should be coordinated with the Dynamics Working Group and System Protection Working Group members to assure that it is correct before submitting the cases. This will insure that all of the cases have the most current steady state and dynamics information. The following are items that should be coordinated: Unit bus number Unit ID Unit maximum and minimum real power capabilities Unit maximum and minimum reactive power capabilities Unit MVA base Resistive and reactive machine impedances Resistive and reactive generator step-up transformer impedances
Approved by ROS on January 13, 2006 Submit to ERCOT Reliability and Operations Subcommittee for approval Aug 10, 2006.
10

1.4.2 Review Expected Load for Area to ServeBefore the generation schedule can be determined, the expected area load and losses (demand) must be determined. Each MW of demand needs to be accounted for by a MW of generation. The ALDR should be used for all the Data Set A and B cases.
1.4.3 Generation Dispatch MethodologyIn order to simulate the future market, the following methodology for generation dispatch has been adopted for building the Data Set A and Data Set B load flow cases.
Existing and planned units owned by the Non-Opt-In Entities (NOIE) are dispatched according to the NOIE's planning departments; unless a NOIE requests that their units are to be dispatched according to the order that is described below. Unless contracts are known for the full output of a unit, all remaining MWs of NOIE units will be put into the ERCOT dispatch in their respective order.
Private network generation is also dispatched independently. It is believed that cogeneration and self-serve units will have a better financial incentive to run than other plants. These plants are turned on at full output unless actual data is available, in which case they are dispatched to an average of their historical output. DC Ties are modeled as load levels or at generation levels based on historical data. Likewise, wind plants are modeled at generation levels based on historical data.
Units that are solely for black start purposes are to be modeled in the base cases; however, these units should not be dispatched. Black start units are designated with a unit ID that begins with the letter ‘B’ which can be followed by an alphanumeric character (for example, ‘B1’, ‘B2’, etc.).
All other units are dispatched by performing a system simulation using the UPLAN software package. The UPLAN simulation will dispatch units in order to minimize production costs taking into account unit start-up times and cost and heat rates while adhering to the following guidelines for each set of cases:
Data set A cases are dispatched to eliminate base case rate A overloads and maintain CSC and CRE loading below their thresholds. The model simulates the system for the two weeks leading up to the peak hour for each season.
Data set B CSC constrained cases are dispatched to maintain CSC and CRE loading below their thresholds. The model simulates the system for the two weeks leading up to the peak hour for each summer peak case.
Data set B economically constrained cases are dispatched in the most economical way for a given load level with no consideration for overloads. The model simulates the system load for the two weeks leading up to the peak hour for each summer peak case and the two weeks leading up to the minimum load hour for the minimum case.
In all cases spinning reserve is maintained according to ERCOT guides. Mothballed units are treated as described in Appendix F. The dispatch may be modified for data set A cases if necessary to maintain voltages at acceptable levels.
Approved by ROS on January 13, 2006 Submit to ERCOT Reliability and Operations Subcommittee for approval Aug 10, 2006.
11

If a future unit is not on the ERCOT generation web site, it will not be put in the case unless an agreement has been reached between the TSP and the generating entity to do so. Future units that are expected for construction must either have signed an SGIA or have provided an agreement to reimburse the TSP for expenses incurred toward constructing facilities for their generation if the generation project fails to go forward.
SSWG shall be able to review and modify the generation dispatch based on historical information.
Extraordinary Dispatch Conditions
ERCOT power flow cases typically model load at individual TSP peaks instead of at the ERCOT system peak. Additionally, some of the generation reserve modeled in the cases is actually made up from LaaR (Load Acting as a Resource) in system operations. Since LaaR is not modeled in powerflow cases it must be made up from generation resources. For these, and other reasons such as how mothballed generation is counted, the load and generation modeled in powerflow cases usually does not match the load and generation resources estimated in the ERCOT CDR.
These differences can result in future cases without sufficient dispatchable generation resources to match load. When such a condition is encountered in future cases, ERCOT may increase generation resources by taking the indicated action, or adding generation, in the following order:
1. DC ties dispatched to increase transfers into ERCOT to the full capacity of the DC ties.2. Mothballed units that have not announced their return to service.3. Ignore spinning reserve.4. Increase NOIE generation.5. Add publicly announced plants without interconnect agreements.6. Black start Units7. Add generation resources at the sites of retired units.
1.4.4 Voltage Profile Adjustments
1.4.4.1 Schedule Voltage for Generator UnitsAfter generation has been determined, the next step is to set the proper voltage profile for the system. The scheduled voltages should reflect actual voltage set points used by the generator operators.
1.4.4.2 Voltage Control Check the voltages at several key locations within the system when modifying generation voltage and control VARS. When these voltages are not within acceptable parameters, changes in the system VARS are needed. VAR changes can be accomplished by turning on/turning off capacitors or reactors, and by changing the operations of generators (turning on/turning off/redispatching for Var control).
Approved by ROS on January 13, 2006 Submit to ERCOT Reliability and Operations Subcommittee for approval Aug 10, 2006.
12
1.5 LINE DATA
1.5.1 Use of Load-flow Data Fields
1.5.1.1 Bus Specifications The end points of each branch in the ERCOT load-flow case are specified by “from” and “to” bus numbers. In most cases the end point buses are in the same TSP area. However, when the “from” and “to” buses used to specify a branch are in different TSP areas, the branch is considered to be a tie line (See Section 1.5.3, Coordination of Tie Lines). Branch data includes exactly two buses. The end points of Multi-Section Lines (MSL) are defined by two buses specified in a branch data record. (See 1.5.2.) There are other components that are modeled with more than two buses, such as transformers with tertiary that may be represented by three-bus models.
1.5.1.2 Circuit (Branch) Identifier Circuit identifiers are limited to two alphanumeric characters. Each TSP will determine its own naming convention. These identifiers are typically numeric values (e.g. 1 or 2) that indicate the number of branches between two common buses, but many exceptions exist.
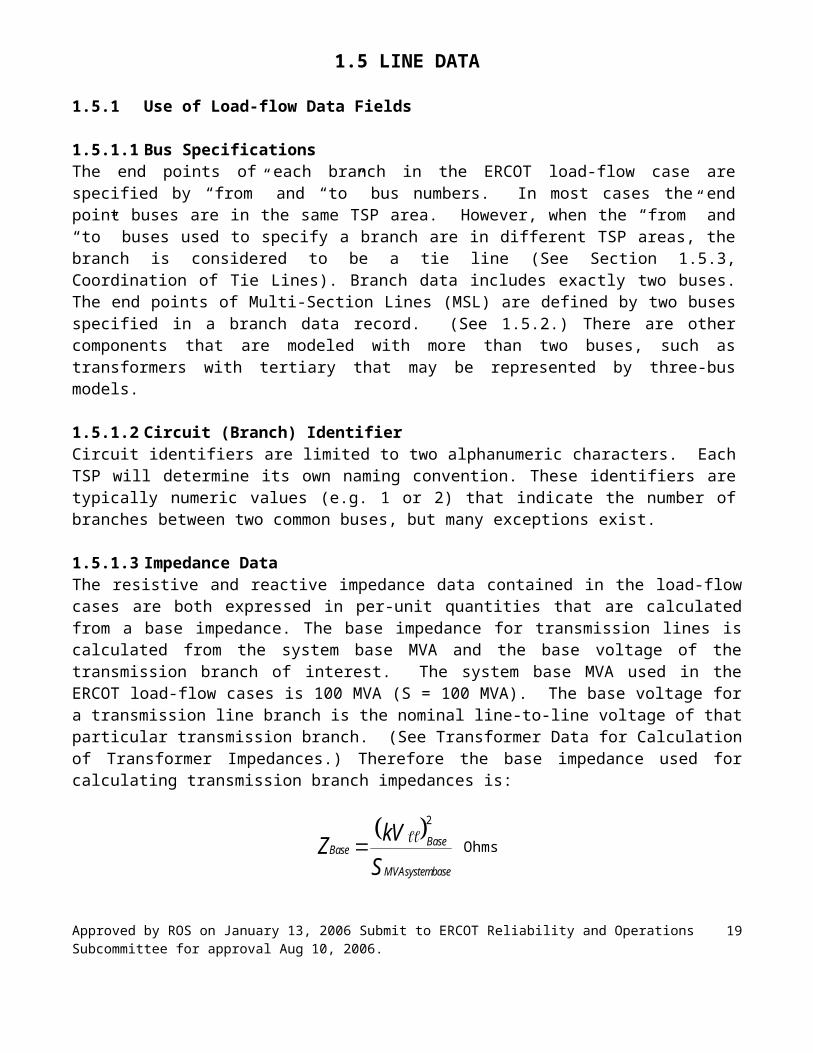
1.5.1.3 Impedance DataThe resistive and reactive impedance data contained in the load-flow cases are both expressed in per-unit quantities that are calculated from a base impedance. The base impedance for transmission lines is calculated from the system base MVA and the base voltage of the transmission branch of interest. The system base MVA used in the ERCOT load-flow cases is 100 MVA (S = 100 MVA). The base voltage for a transmission line branch is the nominal line-to-line voltage of that particular transmission branch. (See Transformer Data for Calculation of Transformer Impedances.) Therefore the base impedance used for calculating transmission branch impedances is:
Z kVS
BaseBase
MVAsystembase
2
Ohms
This base impedance is then used to convert the physical quantities of the transmission line into per-unit values to be used in the load-flow cases.
1.5.1.3.1 ResistanceOnce the total transmission line resistance is known and expressed in ohms, then this value is simply divided by the base impedance to obtain the per-unit resistance to be entered in the load-flow case. This calculation is as follows:
p uTotalTransmissionLine
BaseR R
Z. . ohms
ohms
Approved by ROS on January 13, 2006 Submit to ERCOT Reliability and Operations Subcommittee for approval Aug 10, 2006.
13

1.5.1.3.2 ReactanceOnce the total transmission line reactance is known and expressed in ohms, then this value is divided by the base impedance to obtain the per-unit reactance and entered into the load-flow case. This calculation is as follows:
p uTotalTransmissionLine
BaseX X
Z. .
ohmsohms
1.5.1.3.3 ChargingLine charging is expressed as total branch charging susceptance in per unit on the 100 MVA system base. The total branch charging is expressed in MVARs and divided by the system base MVA to get per unit charging. The equation used to accomplish this depends on the starting point. Typically the charging of a transmission line is known in KVARs. Given the total transmission line charging expressed in KVARs, the equation to calculate the total branch charging susceptance in per unit on the system base is as follows:
p uTotalBranchCh ing
MVAsystembaseB kVars
S. .
arg 310 MVar
MVA
Or, given the total capacitive reactance to neutral expressed in ohms C ohmsX ( ) , the equation to calculate the total branch charging susceptance in per unit on the system base is as follows:
p u
C ohms MVAsystembaseB
kVX S
. .( )
2
1.5.1.4 Facility RatingsERCOT load-flow cases contain fields for three ratings for each branch record. The ratings associated with these three fields are commonly referred to as Rate A, Rate B and Rate C. Methodology used by each TSP shall be kept current in Appendix C. Following are the ERCOT facility ratings definitions:
1.5.1.4.1 Ratings DefinitionsRate A – Normal RatingContinuous Rating: Represents the continuous MVA rating of a Transmission Facility, including substation terminal equipment in series with a conductor or transformer (MLSE) at the applicable ambient temperature. The Transmission Facility can operate at this rating indefinitely without damage, or violation of National Electrical Safety Code (NESC) clearances.
Rate B – Emergency Rating Emergency Rating: Represents the two (2) hour MVA rating of a Transmission Facility, including substation terminal equipment in series with a conductor or transformer (MLSE) at the applicable ambient temperature. The Transmission Facility can operate at this rating for two (2) hours without violation of NESC clearances or equipment failure.
Approved by ROS on January 13, 2006 Submit to ERCOT Reliability and Operations Subcommittee for approval Aug 10, 2006.
14

Rate C – Conductor/Transformer RatingEmergency Rating of the Conductor or Transformer: Represents the two (2) hour MVA rating of the conductor or transformer only, excluding substation terminal equipment in series with a conductor or transformer, at the applicable ambient temperature. The conductor or transformer can operate at this rating for two (2) hours without violation of NESC clearances or equipment failure.
I.e. Rate C ≥ Rate B ≥ Rate A
When performing security studies, ESPTO will default to Rate B, unless the TSP has previously indicated in writing that other ratings (e.g., Rate A) should be used. If problems exist using Rate B and Rate B is significantly different from Rate C, then ESPTO will contact the TSP.
1.5.1.4.2 NERC Planning StandardsCompliance with the NERC Planning Standards for facility ratings is required in the ERCOT load-flow cases. Specifically, these ratings should be in compliance with NERC Planning Standard Measures, which state, "The rating of a system facility (transmission line, transformer, etc.) shall not exceed the rating of the most limiting series element (MLSE) in the circuit or path of the facility, including terminal connections and associated equipment." "In cases where protection systems and control settings constitute a loading limit on a facility, this limit shall become the rating for that facility." “Coordinated ratings for jointly owned facilities shall be documented in a document or database. Joint owners shall agree on the ratings.” NERC Standards require that “Facility owners shall have on file a document or data base identifying the normal and emergency ratings of all of their electrical facilities (e.g., lines, terminal equipment, and transformers) that impact the bulk interconnected transmission system.
1.5.1.4.3 Most Limiting Series Element DatabaseMLSE database contains ratings of all existing elements in series (switches, current transformers, conductors, etc.) between the two end terminals of a transmission line and provides the maximum rating of the transmission line. The maximum rating of the transmission line is the minimum rating of all elements comprising the transmission line. This data is due to ESPTO with the Data Set A work each year. See Appendix D for example output.
1.5.1.5 Complex AdmittanceBranch Data records include four fields for complex admittance for line shunts. These records are rarely used in ERCOT.
1.5.1.6 StatusBranch data records include a field for branch status. Entities are allowed to submit branch data with an out-of-service status for equipment normally out of service. This information will be kept throughout the load-flow data preparation process and returned to all entities with the final ERCOT load-flow cases.
1.5.1.7 Line Length and Ownership
1.5.1.7.1 Line LengthThis data should be provided in miles
Approved by ROS on January 13, 2006 Submit to ERCOT Reliability and Operations Subcommittee for approval Aug 10, 2006.
15
1.5.1.7.2 OwnershipThe load-flow database allows users to specify up to four owners for each branch including percent ownership. Ownership and owner IDs should be included for all branches including transmission lines owned by generation entities. The percent ownership of each line should sum up to 100%. See Appendix A.
1.5.1.7.3 Practices for VerificationTransmission line length for existing lines should be verified from field data before values are entered into the load-flow data. The following equation is an approximation that applies to transmission lines that are completely overhead:
Miles
or assuming MVAsystembaseS 100 MVA then
OverheadCircuit p u p uX B Miles 486 5. ( ). . . .
Approved by ROS on January 13, 2006 Submit to ERCOT Reliability and Operations Subcommittee for approval Aug 10, 2006.
16

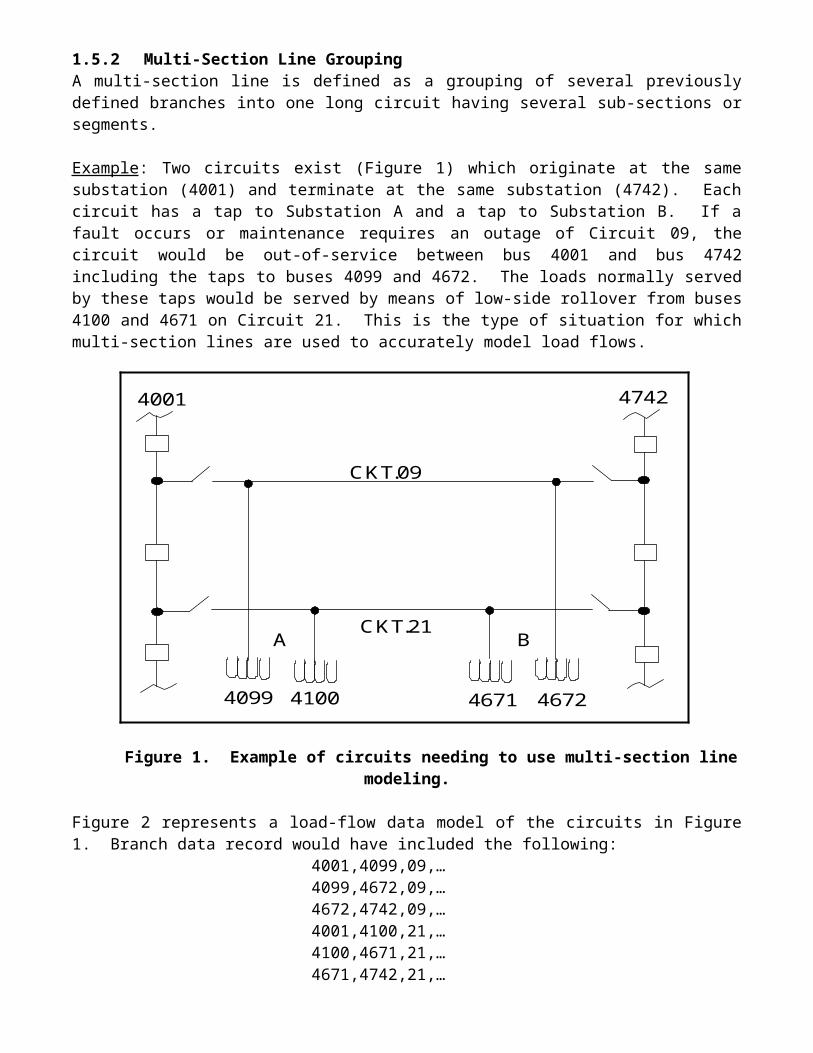
1.5.2 Multi-Section Line Grouping A multi-section line is defined as a grouping of several previously defined branches into one long circuit having several sub-sections or segments.
Example: Two circuits exist (Figure 1) which originate at the same substation (4001) and terminate at the same substation (4742). Each circuit has a tap to Substation A and a tap to Substation B. If a fault occurs or maintenance requires an outage of Circuit 09, the circuit would be out-of-service between bus 4001 and bus 4742 including the taps to buses 4099 and 4672. The loads normally served by these taps would be served by means of low-side rollover from buses 4100 and 4671 on Circuit 21. This is the type of situation for which multi-section lines are used to accurately model load flows.
CKT.09
CKT.21
4099
47424001
4100
A B
4671 4672
Figure 1. Example of circuits needing to use multi-section line modeling.
Figure 2 represents a load-flow data model of the circuits in Figure 1. Branch data record would have included the following:
4001,4099,09,…4099,4672,09,…4672,4742,09,…4001,4100,21,…4100,4671,21,…4671,4742,21,…
along with the necessary bus, load, and shunt data. To identify these two circuits as multi-section lines, entries must be made in the raw data input file. The multi-section line data record format is as follows:
I,J,ID,DUM1,DUM2, … DUM9 where :
I “From bus” number.J “To bus” number. ID Two characters multi-section line grouping identifier. The first character must
be an ampersand (“&”). ID = ‘&1’ by default.DUMi Bus numbers, or extended bus name enclosed in single quotes, of the “dummy
buses” connected by the branches that comprise this multi-section line grouping. No defaults allowed.
Up to 10 line sections (and 9 dummy buses) may be defined in each multi-section line grouping. A branch may be a line section of at most one multi-section line grouping.
Each dummy bus must have exactly two branches connected to it, both of which must be members of the same multi-section line grouping.
The status of line sections and type codes of dummy buses are set such that the multi-section line is treated as a single element.
Figure 2. Load-flow model of example circuits.
For our example, the following would be entered as multi-section line data records:
4001, 4742, &1, 4099, 46724001, 4742, &2, 4100, 4671
Multi-section lines give a great amount of flexibility in performing contingency studies on load-flow base cases. When set up correctly, hundreds of contingencies where the automatic low-side load rollover occurs can be analyzed and reported within minutes.
1.5.3 Coordination of Tie Lines A tie line is a branch that connects two TSP areas in the load-flow case. In a tie line, the bus at one end is in one TSP area and the bus at the other end is in another TSP area. Each of the interconnected TSPs owns some terminal equipment or line sections associated with the tie line. The branch may be a transmission line, transformer, bus section or another electrical component connecting systems together.
Careful coordination and discussion is required among SSWG members to verify all modeled tie-line data. Even in load-flow cases where no new tie lines were installed, there could be many tie-line changes. Construction timings of future points of interconnection can change. As an example, a tie line may need to be deleted from a spring case and added to a summer case. Another example is, if a new substation is installed in the middle of an existing tie line, it redefines the tie-line bus numbers, mileages, impedances and possibly ratings and ownership.
Tie branch models also affect a number of important ERCOT calculations and therefore must accurately reflect real-world conditions. Also missing or erroneous ties can produce unrealistic indications of stability and/or voltage limits. Inaccurate metering points, impedances, ratings, transformer adjustment data, status information, mileages, or ownership data can all have a profound effect on system studies; therefore it is imperative that neighboring entities exercise care in coordinating tie branch data.
1.5.4 Metering PointEach tie line or branch must have a designated metering point and this designation should also be coordinated between neighboring TSP areas. The location of the metering point determines which TSP area will account for losses on the tie branch. The PSS/e load-flow program allocates branch losses to the TSP area of the un-metered bus. For example, if the metering point is located at the “to” bus then branch losses will be allocated to the TSP area of the “from” bus.
The first bus specified in the branch record is the default location of the metering point unless the second bus is entered as a negative number. These are the first and second data fields in the branch record.
1.5.5 Tie-Line RatingsRatings for tie lines should be mutually agreed upon by all involved entities and should comply with NERC Planning Standards: “Ratings of jointly-owned facilities shall be coordinated and provided on a consistent basis.”
1.5.6 Coordination of Tie-Line Data SubmissionIt is imperative for neighboring entities to coordinate tie data in order to allow Data Set A and Data Set B work activities to proceed unimpeded. Entities should exchange written documents detailing tie-line data at least two weeks before the data is due to ESPTO. Coordination of tie data includes timely agreement between entities on the following for each tie line:

In-service/ out-service dates for ties Metering point bus number From bus number To bus number Circuit identifier Impedance and charging data Ratings Transformer adjustment (LTC) data Status of branch Circuit miles Ownership (up to four owners) Entity responsible for submitting data

1.6 TRANSFORMER DATA
1.6.1 Transformer Modeling RecordsTransformers modeled in ERCOT load-flow cases are specified by two sets of data records: Transformer Data and Transformer Impedance Correction Tables. (PSS/E, ver. 29)
1.6.2 Transformer Data Every transformer is to be represented in the transformer data record block. The transformer data block specifies all the data necessary to model transformers in power flow calculations. Both two winding transformers and three winding transformers can be specified in the transformer data record block. Three-winding transformer should be represented by its three-winding model and not by its equivalent two-winding models.
1.6.2.1 Bus NumbersThe end points of each transformer branch in the ERCOT load-flow case are specified by “from” and “to” bus numbers. The “from” bus is the bus connected to the tapped side of the transformer and the “to” bus is connected to the impedance side of the transformer being modeled. In some cases, the “from” and “to” buses used to specify a branch are in two different TSP areas, making the branch a tie line (See Section 1.5.3, Coordination of Tie Lines). The “from” bus is the metered side of the transformer by default, but can be assigned to the other bus by assigning a negative number to the second bus. The metered side determines which TSP area losses due to the transformer are assigned to (TSP area of the un-metered bus). Three winding transformers (transformers with tertiary winding) can be represented by utilizing the “from” and “to” bus numbers and in addition the “last” bus number in the data block to represent the tertiary winding.
1.6.2.2 Transformer Circuit IdentifierCircuit identifiers are limited to two alphanumeric characters. Actual transformer identifiers may be used for circuit identifiers for transformers, however, typically, circuit identifiers are used to indicate which transformer is being defined when more than one transformer is modeled between two common buses. Where practical, TO’s should identify autotransformers with the letter A as the first character of the ID field. Generator Step-Up transformers should be identified with the letter G. Phase-shifting transformers should be identified with the letter P.
1.6.2.3 Impedance DataThe resistance and reactance data for transformers in the load flow database are specified: (1) in per-unit on 100 MVA system base (default), (2) in per-unit on winding base MVA and winding bus base voltage, (3) in transformer load loss in watts and impedance magnitude in per-unit on winding base MVA and winding bus base voltage.
1.6.2.3.1 Resistance Transformer test records should be used to calculate the resistance associated with a transformer branch record. Where transformer test records are unavailable, the resistance should be entered as zero.
1.6.2.3.2 ReactanceTransformer test records or transformer nameplate impedance should be used to calculate the reactance associated with a transformer branch record. Where the transformer resistance component is known, the transformer impedance is calculated on the same base using the known data and the reactance component is determined using the Pythagorean theorem. Where the transformer resistance is assumed to be zero, the calculated transformer impedance can be assumed to be equal to the transformer reactance.

1.6.2.3.3 SusceptanceFor load-flow modeling purposes, the transformer susceptance is always assumed to be zero.
1.6.2.4 Transformer RatingsThe ratings used for transformer branches are defined the same as in Section 1.5.1.4, Facility Ratings.
1.6.2.5 Tap RatiosThe ratio is defined as the transformer off nominal turns ratio and is entered as a non-zero value in per unit. Where the base kV contained in the bus data records for the buses connected to transformer terminals are equal to the rated voltage of the transformer windings connected to those terminals, the transformer off-nominal ratio is equal to 1.00. When the transformer has no-load taps, the transformer off-nominal ratio will be something other than 1 and usually in the range of 0.95 to 1.05. The effects of load tap changing (LTC) transformer taps are also handled in the transformer data record. Actual no-load tap settings will be periodically requested by ERCOT.
1.6.2.6 AngleThe transformer phase shift angle is measured in degrees from the untapped to the tapped side of the transformer. The angle is entered as a positive value for a positive phase shift.
1.6.2.7 Complex AdmittanceComplex admittance data is not required for ERCOT load-flow cases and the values for each of these four fields should be zeros.
1.6.2.8 LengthCircuit mileage has no meaning in a transformer branch record and should be entered as zero.
1.6.2.9 StatusThis field indicates the status of the transformer. A value of 1 indicates the transformer is in-service and a value of zero indicates the transformer is out-of-service.
1.6.2.10 OwnershipThe load-flow case allows users to specify up to four owners for each branch including percent ownership. Ownership and owner IDs should be included for all non-transformer branches. The sum of all percent ownerships should equal 100% for every line.
1.6.2.11 Controlled BusThe bus number of the bus whose voltage is controlled by the transformer LTC and the transformer turns ratio adjustment option of the load-flow solution activities. This record should be non-zero only for voltage controlling transformers.
1.6.2.12 Transformer Adjustment LimitsThese two fields specify the upper and lower limits of the transformer turns ratio adjustment or phase shifter adjustment. For transformers with automatic adjustment, they are typically in the range 0.80 to 1.20.

1.6.2.12.1 Upper LimitThis field defines the maximum upper limit of the off-nominal ratio for voltage or reactive controlling transformers and is entered as a per-unit value. The limit should take into account the no-load tap setting of the transformer, if applicable. For a phase shifting transformer, the value is entered in degrees.
1.6.2.12.2 Lower LimitSimilar to the upper limit, this field defines the lower limit of the off-nominal ratio or phase shift angle for the transformer defined.
1.6.2.13 Voltage or Load-Flow LimitsThese two fields specify the upper and lower voltage limits at the controlled bus or for the real or reactive load flow through the transformer at the tapped side bus before automatic LTC adjustment will be initiated by the load-flow program. As long as bus voltage is between the two limits, no LTC adjustment will take place.
1.6.2.13.1 Upper LimitThis field specifies the upper limit for bus voltage in per unit at the controlled bus or for the reactive load flow in MVAR at the tapped side bus. For a phase shifting transformer, this field specifies the upper limit for the real load flow in MW at the tapped side bus.
1.6.2.13.2 Lower LimitSimilar to the upper limit, this field specifies the lower limit for the bus voltage or the real or reactive load flow for the transformer defined.
1.6.2.14 StepTransformer turns ratio step increment for LTC is defined by this field and entered in per unit. Most LTC transformers have 5/8% or 0.00625 per unit tap steps.
1.6.2.15 TableThe number of a transformer impedance correction table is specified by this field if the transformer's impedance is to be a function of either the off-nominal turns ratio or phase shift angle. ERCOT load-flow cases normally don’t use these tables and this field is set to zero by default.
1.6.2.16 Control EnableThis field enables or disables automatic transformer tap adjustment. Setting this field to one enables automatic adjustment of the LTC or phase shifter as specified by the adjustment data values during load-flow solution activities. Setting this field to zero prohibits automatic adjustment of this transformer during these activities.
1.6.2.17 Load Drop CompensationThese two fields define the real and reactive impedance compensation components for voltage controlling transformers. They are ignored for MW and MVAR flow controlling transformers. ERCOT load-flow cases normally don’t use these fields and they are set to zero by default.
1.6.2.18 Resistive ComponentThe resistive component of load drop compensation entered in per unit is based on the resistance between the location of the LTC and the point in the system at which voltage is to be regulated.

1.6.2.19 Reactive ComponentSimilar to the resistive component of load drop compensation, this value is entered in per unit and is based on the reactance between the location of the LTC and the point in the system at which voltage is to be regulated.
1.6.3 Transformer Impedance Correction TablesUsed to model a change in transformer impedance as off nominal turns ratio or phase-shift angle is adjusted in the load-flow solution. Applied only when the table field in the transformer adjustment record (see Section 1.6.2.7) is set to a non-zero value. Is Section 1.6.2.7 the correct reference?
1.6.3.1 Table NumberThe number of the transformer impedance correction table specified in the table field of the transformer adjustment record.
1.6.3.2 Off-Nominal Turns RatioThe initial off-nominal transformer turns ratio in per unit or the phase-shift angle in degrees.
1.6.3.3 Impedance Scaling FactorThe scaling factor by which the transformer nominal impedance is to be multiplied to obtain the actual transformer impedance for the corresponding off nominal turns ratio or phase- shift angle.
1.7 STATIC REACTIVE DEVICES
Presently all shunt reactors and capacitors that are used to control voltage at the transmission level are to be modeled in the ERCOT load-flow cases to simulate actual transmission operation. There are two distinct static reactive devices currently represented in the ERCOT load-flow cases: bus shunts and series compensated capacitors. For ease of identifying all capacitive shunt devices in the ERCOT load-flow cases shunt devices are modeled as switched shunts.
1.7.1 Switched Shunt Devices
1.7.1.1 Bus ShuntA shunt capacitor or reactor connected to the high side or low side of a substation transformer in a substation should be represented in the ERCOT load-flow case as a switched shunt device to accurately simulate operating conditions. Care should be exercised when specifying the size of cap banks. Be sure that the rated size of the bank is for 1.0 per unit voltage. A fixed bus shunt should be modeled as a fixed switched shunt for easy identification in the ERCOT load-flow cases. Care should be taken to ensure that distribution level capacitors are not modeled in such a way as to be counted twice.
When a switched capacitor or reactor is submitted as the switched shunt data record, there are three modes that it can operate in: fixed, discrete, or continuous. Switched capacitors are to be modeled in the discrete mode.
A switched shunt can be represented as up to eight blocks of admittance, each one consisting of up to nine steps of the specified block admittance. The switched shunt device can be a mixture of reactors and capacitors. The reactor blocks are specified first in the data record (in the order in which they are switched on), followed by the capacitor blocks (in the order in which they are switched on). The complex admittance (p.u.), the desired upper limit voltage (p.u.), desired lower limit voltage (p.u.), and the bus number of the bus whose voltage is regulated must be defined to accurately simulate the switched shunt device.
A positive reactive component of admittance represents a shunt capacitor and a negative reactive component represents a shunt reactor.
1.7.1.2 Dummy Bus Switched ShuntIf a switchable capacitor or reactor were connected to a transmission line instead of a bus, an outage of the transmission line would also cause the capacitor or reactor to be taken out of service (see Figure 3). For these instances, the most accurate model is the switched shunt modeled at a dummy bus connected by a zero impedance branch to the real bus. This dummy bus must have exactly two branches connected to it, both of which must be members of the same multi-section line grouping. The status of the line section is that the multi-section line is treated as a single element. A capacitor or reactor connected to a line but modeled, as a bus shunt will result in load-flow calculations for contingencies that differ from real operating conditions.
Figure 3. Example one-line of line connected capacitor bank
1.7.2 Series Compensated Capacitor BanksAdditional requirements will be developed in the future.

1.8 DYNAMIC CONTOL DEVICES
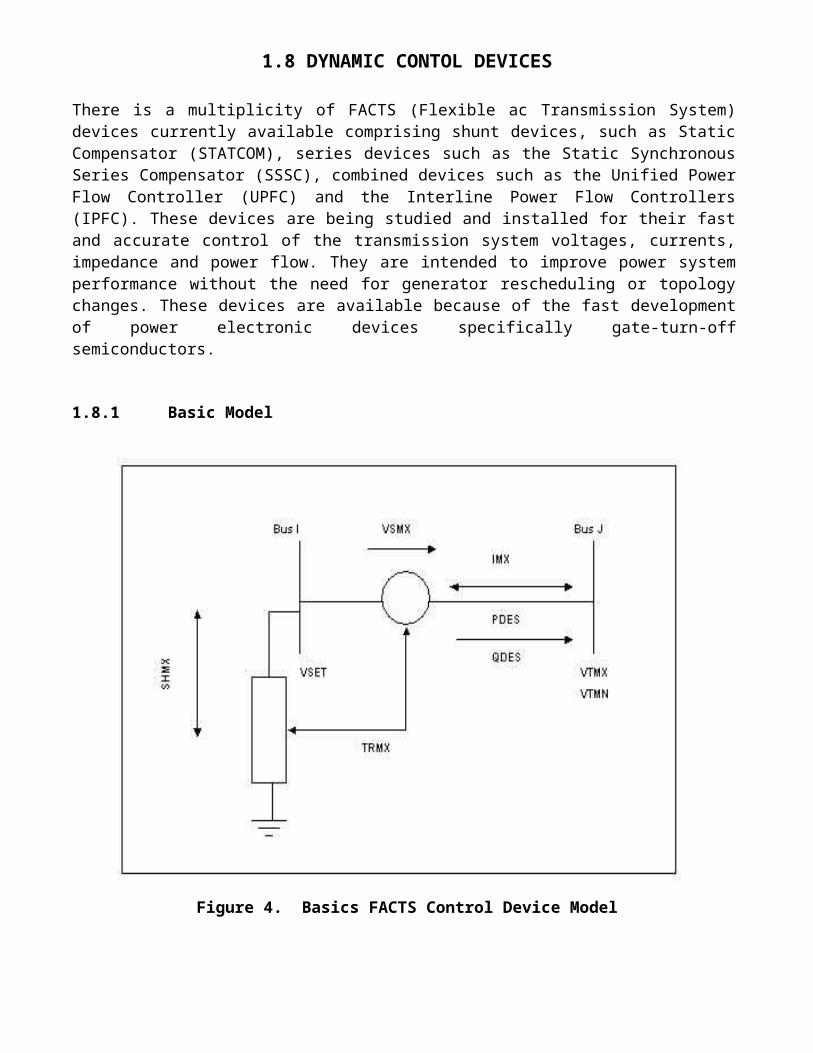
There is a multiplicity of FACTS (Flexible ac Transmission System) devices currently available comprising shunt devices, such as Static Compensator (STATCOM), series devices such as the Static Synchronous Series Compensator (SSSC), combined devices such as the Unified Power Flow Controller (UPFC) and the Interline Power Flow Controllers (IPFC). These devices are being studied and installed for their fast and accurate control of the transmission system voltages, currents, impedance and power flow. They are intended to improve power system performance without the need for generator rescheduling or topology changes. These devices are available because of the fast development of power electronic devices specifically gate-turn-off semiconductors.
1.8.1 Basic Model
Figure 4. Basics FACTS Control Device Model

Each FACTS device data record shall have the following information:
N FACTS control device number
I Sending end bus number
J Terminal end bus number (0 for a STATCOM)
MODE Control mode
PDES Desired real power flow arriving at the terminal end bus in MW (default 0.0)
QDES Desired reactive power flow arriving at the terminal end bus in MVAR (default 0.0)
VSET Voltage set point at the sending end bus in pu (default 1.0)
SHMX Maximum shunt current at sending end bus in MVA at unity voltage (default 9999.)
TRMX Maximum bridge real power transfer in MW (default 9999.)
VTMN Minimum voltage at the terminal end bus in pu (default 0.9)
VTMX Maximum voltage at the terminal end bus in pu (default 1.1)
VSMX Maximum series voltage in pu (default 2.0)
IMX Maximum series current in MVA at unity voltage (default 0.0)
LINX Reactance of dummy series element used in certain solution states in pu (default 0.05)
The FACTS model figure has a series element that is connected between two buses and a shunt element that is connected between the sending end bus and ground. The shunt element at the sending end bus is used to hold the sending end bus voltage magnitude to VSET subject to the sending end shunt current limit SHMX. This is handled in power flow solutions in a manner similar to that of locally controlling synchronous condensers and continuous switched shunts. One or both of these elements may be used depending upon the type of device.
A unified power flow controller (UPFC) has both the series and shunt elements active, and allows for the exchange of active power between the two elements. (i.e. TRMX is positive)
A static series synchronous condenser (SSSC) is modeled by setting both the maximum shunt current limit (SHMX) and the maximum bridge active power transfer limit (TRMX) to zero. (i.e. the shunt element is disabled).
A static synchronous condenser (STATCON) or static compensator (STATCOM) is modeled by a FACTS device for which the terminal end bus is specified as zero. (i.e. the series element is disabled).
An Interline Power Flow Controller (IPFC) is modeled by using two consecutively numbered series FACTS devices. By setting the control mode, one device will be assigned, as the IPFC master device while the other becomes the slave device. Both devices have a series element but no shunt element. Conditions at the master device define the active power exchange between the devices.

1.8.2 Power Flow Handling of FACTS Devices
For an in-service FACTS device to be modeled during power flow solutions, it must satisfy the following conditions:
1. The sending end bus must be either a type 1 or type 2 bus.
2. The sending end bus must not be connected by a zero impedance line to a type 3 bus.
3. If it is specified, the terminal end bus must be a type 1 bus with exactly one in-service AC branch connected to it; this branch must not be a zero impedance line and it must not be in parallel with the FACTS device.
4. If it is specified, the terminal end bus must not have a switched shunt connected to it.
5. If it is specified, the terminal end bus must not be a converter bus of a DC line.
6. A bus, which is specified as the terminal end bus of an in-service FACTS device, may have no other in-service FACTS device connected to it. However, multiple FACTS device sending ends on the same bus are permitted.
7. A bus, which is specified as the terminal end bus of an in-service FACTS device, may not have its voltage controlled by any remote generating plant, switched shunt, or VSC DC line converter.
Submitted to ERCOT Reliability and Operations Subcommittee for approval MarchAug 1610, 20046 29
1.9 HVDC DEVICES
HVDC Devices allow a specified real power flow to be imposed on the DC link. For base case operation, this should be set to the desired interchange across the DC tie. Capacitors, filter banks and reactors should be modeled explicitly and switched in or out of service based on normal DC tie operation. The HVDC model itself normally calculates reactive power consumption.
HVDC ties with external interconnections may be modeled by the use of either the Two Terminal DC Transmission Line Data or Voltage Source Converter DC Line Data.
1.9.1 Two Terminal DC Transmission Line DataConventional HVDC ties should be modeled using Two Terminal DC Transmission Line Data. The Two Terminal DC Transmission Line Data model represents the HVDC terminal equipment, including any converter transformers, thyristers, and the DC link. The model will calculate voltages, converter transformer taps, losses, and VA requirements, based upon the power transfer over the HVDC facility, and the terminal AC bus voltages.
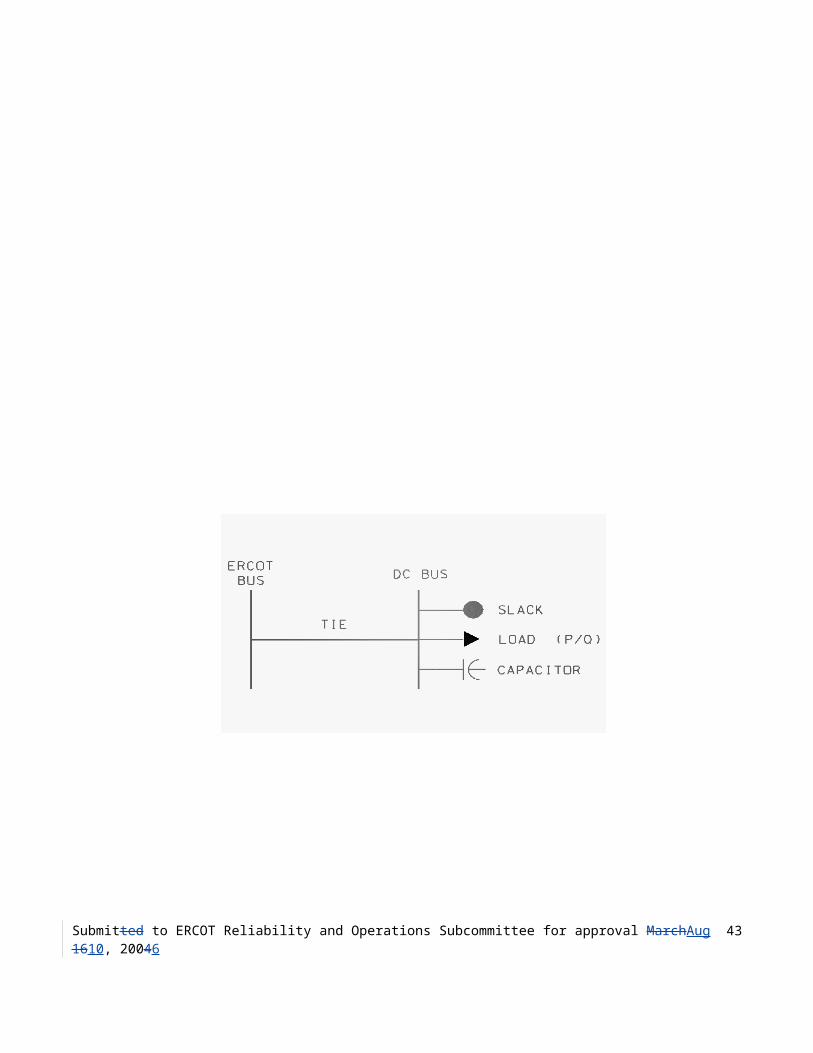
1.9.2 Basic Two-Terminal HVDC Model
Figure 5. Basic Two-Terminal HVDC Model
A type 3 swing bus must be modeled on the bus external to ERCOT. Filters and capacitors, and reactors on the AC terminals should be explicitly modeled, and set to minimize the VAr interchange to the AC system.
1.9.3 Relevant parameter values for Two-Terminal HVDC ModelSubmitted to ERCOT Reliability and Operations Subcommittee for approval MarchAug 1610, 20046 30

I The DC line number.
MDC Control mode: 0 for blocked, 1 for power, 2 for current.
RDC DC line resistance, entered in ohms.
SETVL Current (amps) or power (MW) demand. The sign of SETVL indicates desired power at the rectifier when positive, and desired power at the inverter when negative.
VSCHD Scheduled DC voltage in kV
METER Metered end code of either ‘R’ (for rectifier) or ‘I’ (for inverter).
IPR Rectifier converter bus number
EBASR Rectifier primary base AC voltage in kV.
TAPR Rectifier tap setting
IPI Inverter converter bus number
EBASI Inverter primary base AC voltage in kV.
TAPI Inverter tap setting
Notes:1. The DC line number, I, must be unique, and should be assigned by the ERCOT SSWG, such that
new DC lines do not overlay existing DC lines in the ERCOT cases.2. SETVL may be varied to dispatch the amount of flow over the DC.3. To reverse the flow over the DC, it is necessary to reverse the Rectifier converter bus number,
IPR, and the Inverter converter bus number, IPI.
1.9.4 Voltage Source Converter (VSC) DC Line Data
Voltage Source Converter DC line data can be used to model DC ties that use the voltage source converter technology, for PSS/e Rev. 30 and above.
1.9.4 VSC DC Line Basic Model
Figure 6. Basic VSC DC Line Model
1.9.5 Relevant parameter values for VSC DC Line Data
NAME VSC Lines are designated by a NAME, rather than a number
Submitted to ERCOT Reliability and Operations Subcommittee for approval MarchAug 1610, 20046 31

MDC Control mode: 0 for out-of-service, 1 for in-service.
RDC DC line resistance, entered in ohms.
IBUS Converter bus number
TYPE Type code: 0 for converter out-of-service, 1 for DC voltage control, 2 for MW control.
MODE Converter AC control mode 1 for AC voltage control, 2 for fixed AC power factor.
DCSET If Type=1, the scheduled DC voltage; if Type=2, the power demand, with the sign indicating direction of flow.
ACSET For Mode=1, the regulated AC voltage set point; for Mode=2, the power factor set point.
SMAX Converter MVA rating
IMAX Converter AC current rating
Notes:1. The VSC Name, must be unique, and should be assigned by the ERCOT SSWG, to prevent
overlaying existing VSC DC lines in the ERCOT cases.2. DCSET may be varied to dispatch the amount of flow over the VSC DC, with the sign
indicating the direction of flow. (It is not necessary with VSC DC line data to reverse the rectifier and inverter bus numbers).
3. A type 3 swing bus must be modeled on a bus in the system external to ERCOT. 4. Filters and capacitors, and reactors on the AC terminals should be explicitly modeled, and set
to minimize the VAR interchange to the AC system.
Submitted to ERCOT Reliability and Operations Subcommittee for approval MarchAug 1610, 20046 32

SECTION 2.0 – Load-Flow Procedures and Schedules
Submitted to ERCOT Reliability and Operations Subcommittee for approval MarchAug 1610, 20046 33

2.1 DATA SET A CONSIDERATIONS
The detailed data requirements for the production of the load-flow cases by ESPTO are described in other sections of these guidelines. This section presents a general overview of the items that should be considered when preparing ERCOT load-flow data.
2.1.1 Data Set A UsesThe ‘Data Set A’ cases are used for short-term planning studies, system operations analysis, commercially significant constraint determination, and transmission loss factor calculations. Data Set A cases are submitted by the ERCOT region in response to FERC 715 requirements and are posted on ERCOT web site for general use.
2.1.2 Data Set A Case DefinitionsLoad-flow cases produced by ESPTO are to be divided into two groups. The first group, “Data Set A,” models expected conditions for the following year’s four seasons (eight cases). The second group, “Data Set B,” models cases for the five-year planning horizon.
Data Set A seasons are as follows:
SPG March, April, MaySUM June, July, August, SeptemberFAL October, NovemberWIN December, January, February
ERCOT DATA SET A BASECASES(YR) = FOLLOWING YEAR
BASE CASE NOTES TRANSMISSION IN-SERVICE DATE(YR) SPG1 2 April 1, (YR)(YR) SPG2 3 April 1, (YR)(YR) SUM1 1 July 1, (YR)(YR) SUM2 3 July 1, (YR)(YR) FAL1 2 October 1, (YR)(YR) FAL2 3 October 1, (YR)(YR+1) WIN1 1 January 1, (YR+1)(YR+1) WIN2 3 January 1, (YR+1)
Notes1 Cases to represent the maximum expected load during the season. 2 Cases to represent maximum expected load during month of transmission in-service date.3 Cases to represent lowest load on same day as the corresponding seasonal case (not a
minimum case). For example, (YR) FAL2 case represents the lowest load on the same day as the (YR) FAL1 case.
Submitted to ERCOT Reliability and Operations Subcommittee for approval MarchAug 1610, 20046 34

2.1.3 Entity ResponsibilitiesThe Data Set A load-flow cases are assembled and produced by ESPTO. The responsibilities for providing this data are divided among the various market participants. These data provision responsibilities may overlap among the various market participants because participants may designate their representative or a participant may be a member of more than one market participant group. The market participants can generally be divided into four groups: TSPs, Load Serving Entities, Power Generating Companies, and Marketing Entities. The data responsibilities of each group are as follows:
2.1.3.1 TSPs It is the responsibility of the TSPs to provide all the data required to model the transmission system (line impedances, ratings, transformers, reactive sources, etc.) This will include data for all generator step-up transformers physically tied to the system of the TSP. Transmission providers shall model the load or generation data if they are the designated representatives for load entities or power generating companies.
2.1.3.2 Load Serving Entities It is the responsibility of the load serving entities or their designated representatives to provide the data required to model the loads including the data provided in the ALDR in all cases. This data should be coordinated with ERCOT.
2.1.3.3 Power Generating Companies It is the responsibility of the generation entities to provide all data required to model the generators in all the cases. See Section 1.4. This data should be coordinated with ERCOT and should include but is not limited to unit capabilities.
2.1.3.4 Marketing Entities It is the responsibility of marketers to supply the load and/or generation data if they are the designated representatives for either a load or generating entity or both.
2.1.4 Schedule ESPTO shall post all data and information. As an example:
Mar 1 ALDR due to ESPTOApril 3 ALDR due to SSWG April 21 NOIEs send generation dispatch data to ESPTO May 5 Raw data files due to ESPTO May 12 Pass 1 cases due to SSWG (w/UPLAN economic dispatch)May 19 Pass 1 changes due to ESPTO May 26 Pass 2 cases due to SSWG (w/UPLAN economic dispatch)June 2 Pass 2 changes due to ESPTO June 7 Pass 3 cases due to SSWG (w/UPLAN economic dispatch)June 13-15 SSWG meeting at ESPTO office to finalize cases June 30 Cases posted on the ERCOT web site by ESPTO
Submitted to ERCOT Reliability and Operations Subcommittee for approval MarchAug 1610, 20046 35

2.2 DATA SET B CONSIDERATIONS
2.2.1 Data Set UsesData Set B cases are generally used by TSPs to perform long-range planning studies.
2.2.2 Data Set B Case Definitions
ERCOT DATA SET B BASECASES(YR) = FOLLOWING YEAR
BASE CASE NOTES TRANSMISSION IN-SERVICE DATE
(YR+1) SUM1 1 JULY 1, (YR+1)(YR+2) SUM1 1 JULY 1, (YR+2)(YR+3) MIN 2 JANUARY 1, (YR+3)(YR+3) SUM1 1 JULY 1, (YR+3)(YR+4) SUM1 1 JULY 1, (YR+4)(YR+5) SUM1 1 JULY 1, (YR+5)
Notes1 Cases to represent the maximum expected load during the season.2 Cases to represent the absolute minimum load expected for (YR+3).
2.2.3 Data Set B DispatchingData Set B will contain economically dispatched generation (ECO) and congestion constrained dispatch (CSC), as determined by the SSWG.
2.2.4 ERCOT Data DictionaryEach SSWG member will submit a data file listing all buses that exist in any case from either Data Set A or B 30 days after completion of Data Set B cases. This file is called the ERCOT Data Dictionary. The data dictionary is used by ESPTO to show correlation between base case bus numbers and TSP area SCADA names. Also, the data dictionary without the SCADA names is included as part of ERCOT’s FERC 715 filing. The format will be as follows:
Field Columns Special InstructionsSubmitter Name A TSP Bus Number B From load-flow casesBus Name (as in case) C From load-flow casesBase kV of Bus D From load-flow casesFull Bus Name E Unabbreviated nameCounty where bus located F Do not include the word “County”Load Company Name G Load description (optional)SCADA Station Names H ERCOT ICCP Data link names
There are several naming conventions that should not be used because it creates problems when the data dictionary is used for ESPTO’s operations load-flow model. The following special characters Submitted to ERCOT Reliability and Operations Subcommittee for approval MarchAug 1610, 20046 36

should not be used: ‘$’, ‘%’, ‘:’, ‘!’, ‘@’, ‘&’, ‘(’, ‘)’ or ‘’’. No field should begin with an underscore or a # sign. SCADA names should be a maximum of eight characters long, and there should be no duplicate SCADA names at the same voltage level in the ERCOT Data Dictionary. SCADA names are not required for future substations.
2.2.5 ScheduleESPTO shall post all data and information. As an example:
Sept 108 NOIEs send generation dispatch data to ESPTO Sept 175 Raw data files due to ESPTO Sept 252 Pass 1 cases due to SSWG Sept 3029 SSWG general meeting if neededPass 1 changes due to ESPTOOct 76 Pass 1 changes due to ESPTOPass 2 cases due to SSWG Oct 1413 Pass 2 cases due to SSWGPass 2 changes due to ESPTO Oct 2120 Pass 2 changes due to ESPTOPass 3 cases due to SSWGOct 27 Pass 3 changes due to ESPTO Nov 41-63 SSWG meeting at ESPTO office to finalize cases Nov 1517 Cases posted on the ERCOT web site by ESPTO
Submitted to ERCOT Reliability and Operations Subcommittee for approval MarchAug 1610, 20046 37

2.3 ERROR SCREENING AND CASE UPDATES
SSWG members are responsible for assembling all of the information for the sub-systems they are responsible for and, through a systematic process, creating the load-flow base cases. This requires many steps, each of which may introduce errors. To minimize the potential for errors in the cases, there are many data screens and error checks that should be employed. These can be local or global in nature.
The creation of the load-flow base cases consists of two distinct phases. Therefore, the screening for and correction of errors will be divided into two different processes. These two phases are:
Producing the application for load serving entities’ Annual Load Data Request Creating the cases for Data Set A and Data Set B
2.3.1 Review of ALDR The ALDR provides the detailed load data for each customer that is requesting transmission service. Because of the vastness of the data in the ALDRs, it is critical that they be reviewed and screened with the utmost diligence before their submittal to ESPTO.
Load shall be consistent with ALDR. Load serving entities’ total load plus losses in cases shall be consistent with coincident system load
in the ALDR, excluding self-serve load. Bus numbers should be within TSP designated SSWG bus range
After ESPTO reviews each ALDR, they are sent to all SSWG members who should review them closely before they are used to create load-flow case data. If ALDR problems are found, SSWG members should contact the entities submitting the data. Proper communication between TSP should minimize these problems. Some checks that should be performed (by spreadsheet format) include but are not limited to the following:
The bus number in column D must be included. No duplicate IDs, bus numbers or bus names. The coincidence factors in columns K and Q must be less than or equal to 100%. The Minimum/Peak value in column T must be less than or equal to 100%. All power factors must be less than or equal to 1. There should be a continuity of power factors for loads that have changed from one TSP to another. The county name should be spelled correctly. NA, N/A, or other alphabetic characters should not appear in a numerical field (leave field blank if
not sure). Also #DIV/0! and #VALUE! should be deleted. There should be only one voltage level for each delivery point. In some places the workbook asks for kW or KWH and in some places MW or MWH. The values
must be in the correct measure. The calculated diversity factor in row 33 should be greater than or equal to 100%. Correct TSP code. No missing loads (i.e. loads that have changed from one TSP to another have not been dropped.) No duplicate loads.
2.3.2 Review of Load-Flow Base Case DataChecks should include but are not limited to the following:
Submitted to ERCOT Reliability and Operations Subcommittee for approval MarchAug 1610, 20046 38
Bus numbers should be within that TSP’s designated SSWG bus range Zone numbers should be within that TSP’s designated SSWG zone range No disconnected buses and swingless islands. No buses with blank nominal voltage. No radial distribution buses. No transformers serving non-network distribution buses. Should not be any topology differences between on-peak seasonal cases and corresponding off-peak
seasonal cases (e.g. 98SPG1 vs. 98SPG2) Branch data checks :
- Every branch should have mileage- Mileage comparison to impedance is reasonable- Percentage ownerships total 100% for all lines- No inordinately small impedances (less than 0.0001 p.u.)- No inordinately large impedance (greater than 3.000 p.u.)- No inordinately high R/X ratio (absolute value of R greater than 2 times absolute value of X)- Generally no negative reactances (with the exception of 3 winding transformers)- No inordinately high charging (greater than 5.000 or negative)- Zero impedance branches connected to generation buses - Zero impedance loops (X<0.0001 p.u. on 100 MVA base). Cases will not solve with mismatches
within the zero impedance loops. Transformer data checks :
- No transformer RMAX < RMIN- No transformer VMAX < VMIN- Difference between VMAX and VMIN should be 0.0125 or greater - No inordinately high tap ratios (greater than 1.200)- No inordinately low tap ratios (less than 0.800)- No non-transformer branches between voltages levels- No tap positions bigger than 33 unless verified
Generator data checks: - No zero generator source impedance (CONG)- No maximum generation (PMAX) less than minimum generation (PMIN).- No maximum reactive generation (QMAX) less than minimum reactive generation (QMIN).- Offline generators should be Type 2 with status 0.- No plant specified as remotely regulating itself (remote bus must be zero if self-regulating).- Generators controlling the same remote bus shall have its remote var dispatch factor (RMPCT)
proportional to the generator capability.
2.3.3 Solved Case ChecksA case is considered solved when a power-flow program reaches a solution using the following method: a Fully Coupled Newton-Rhapson iterative algorithm with a tolerance of the largest bus mismatch of .5 MW or MVAR on a 100 MVA base (.005 per unit) or less. Other solution techniques may be applied prior to executing this solution method to converge the case.
A case shall also meet the following conditions: Solve in less than 20 iterations (preferably in less than 12 iterations) Transformer tap stepping enabled. Switched shunts locked enabled
Submitted to ERCOT Reliability and Operations Subcommittee for approval MarchAug 1610, 20046 39

Phase shifters enabled DC transformer tap stepping enabled Generator var limits enforced immediately The system swing generation real output should be within normal operating parameters of the unit. Generally for Data Set A cases all line and equipment loading and voltage levels should be within
applicable rating limits.- No branches loaded above any of Rate A, Rate B or Rate C - No buses with solved voltage above 1.050 p.u.- No buses with solved voltage below 0.950 p.u.
Data Set B cases may contain overloaded branches and voltage levels outside of applicable limits. There should be no voltage control conflicts (for example, PTI’s CNTB ALL). ESPTO will run contingency analysis (contingencies including single line out, multiple lines out,
single generator out) before posting each data set. Before finalizing cases each TSP will verify and acknowledge error checking output produced by
ESPTO
2.3.4 Review of Tie-Line ListingCoordination between TSPs is critical in maintaining the tie-line listing. Some potential problems that need to be reviewed include:
Correct add/remove years Correct from/to bus numbers Correct metering location Correct conductor description Correct ownership Correct mileage and impedance/rating TSPs should agree on all ratings
Once the discrepancies are identified, TSPs need to correct the differences and make appropriate updates both to load-flow cases and the tie-line listing.
2.3.5 Case UpdatesWhen necessary the TSP will document updates, which will be posted by ESPTO. The file name should have a clear description, which will include provider’s acronym and the specific case to be updated.
Submitted to ERCOT Reliability and Operations Subcommittee for approval MarchAug 1610, 20046 40

SECTION 3.0 – Other SSWG Activities
Submitted to ERCOT Reliability and Operations Subcommittee for approval MarchAug 1610, 20046 41

3.1 TRANSMISSION LOSS FACTOR CALCULATIONSTransmission Loss Factors
The transmission loss factors are entered in the ERCOT settlements system to account for losses on the transmission system. Separate calculations are performed for the eight Data Set A cases: spring, summer, fall, and winter with an on and off peak for each season.
The Non Opt In Entities (NOIE) that provide metering information of their system to the ERCOT settlement system from a ring of ERCOT Polled Settlements Meters (EPS) as defined in Protocol 13.4.1 have additional work done for their transmission loss factors.
A general description of the NOIE that send extra data have the EPS settlement meters at their tie lines and their load is determine in the ERCOT settlement process as the net of inflows minus the outflows. Other NOIE send EPS metering data from delivery points, not from the tie lines so these extra calculations are not necessary.
The process with approximate timelines for creating the loss factors is below.
1. Send out a request to SSWG for any case updates, changes to NOIE bus ranges, and latest self serve data. (2 weeks)
2. Verify self-serve data with the ERCOT planning staff that performs the congestion management functions (CSC &TCR). The CSC process tries to verify with ERCOT operations where the self-serve is located.
3. Update base cases. (1 week)4. Update the transmission loss factor spreadsheet. (1/4 day)5. Perform the calculations. (1 day)6. Fill in the yellow shaded squares on the loss factor spreadsheet. (1/4 day)7. Create the DIFF spreadsheet between this year and last year. (1/4 day)8. Send to SSWG for review and approval. (1 week)9. Send to ERCOT settlements (Settlement Metering Manager) to be put into the ERCOT
settlement system and post at http://www.ercot.com/mktinfo/data_agg/index.html http://ercot.com/mktinfo/data_agg/. (1/4 day)
Submitted to ERCOT Reliability and Operations Subcommittee for approval MarchAug 1610, 20046 42
3.2 VOLTAGE CONTROL AND REACTIVE PLANNING(To be determined)
Submitted to ERCOT Reliability and Operations Subcommittee for approval MarchAug 1610, 20046 43

APPENDICES
Submitted to ERCOT Reliability and Operations Subcommittee for approval MarchAug 1610, 20046 44

Appendix A
Owner ID, TSP, Bus/Zone Range Table
TSP ACRONYM
TRAN OWNER
(ID)TSP PSSE
AREA NO# OF BUS
ALLOCATEDZONE
RANGE# OF ZONES ALLOCATED
BUS RANGE 1 - 799 BRAZOS ELECTRIC POWER COOP. BEPC 101 TMPPA 11 4799 7 99 93
33000 - 36999860 - 899 BRYAN, CITY OF BRYN 102 BRYN 22 990 2 2 1
32050 - 32999
900 - 934 DENTON MUNICIPAL UTILITIES, CITY OF CODX 108 CODX 19 35 3 3 1
800 - 859 GARLAND, CITY OF COGX 110 COGX 20 60 4 4 1
935 - 955 GREENVILLE ELECTRIC UTILITY SYSTEM GEUS 113 GEUS 21 21 5 5 1
956 - 999 TEXAS MUNICIPAL POWER AGENCY TMPA 127 TMPA 12 44 6 6 1
1000 - 4999 TXUED TXUED 130 TXUED 1 26000 100 198 9910000 - 31999
32000 - 32049 COLLEGE STATION, CITY OF COCS 104 COCS 23 50 199 199 1
37000 - 39999 TEXAS NEW MEXICO POWER CO. TNMP 128 TMMPA 17 3000 220 249 30
In TNMP TNMP CUSTOMER TNMPC 228
40000 - 49999 CENTERPOINT CNPT 114 CNPTA 4 10000 260 319 60
5000 - 5499 CITY PUBLIC SERVICECPS ENERGY SAN ANTONIO CPST 107 CPSTA 5 5500 340 369 30
50000 - 549995500 - 5899 MEDINA ELECTRIC COOP. MEDX 111 STECA 13 4400 869 898 30
55000 - 589995500 - 5899 SOUTH TEXAS ELECTRIC COOP. STEC 122 STECA 13 4400 869 898 30
55000 - 58999
5910 - 5919 SOUTH TEXAS POWER PLANT STP 114 HLPTA 4 10 260 319 60
5920 - 5929 EAST HIGH VOLTAGE DC TIE AEP 16 10 200 200 1
5930 - 5989 PUBLIC UTILITY BOARD OF BROWNSVILLE PUBX 119 PUBXA 15 660 800 829 30
59300 - 598996000 - 6699 AMERICAN ELECTRIC POWER-
TNC AEP-TNC 131 AEP 6 8700 402 479 7860000 - 67999
In AEN-TNC COLEMAN COUNTY ELECTRIC COOP. CCEC 103
Submitted to ERCOT Reliability and Operations Subcommittee for approval MarchAug 1610, 20046 45
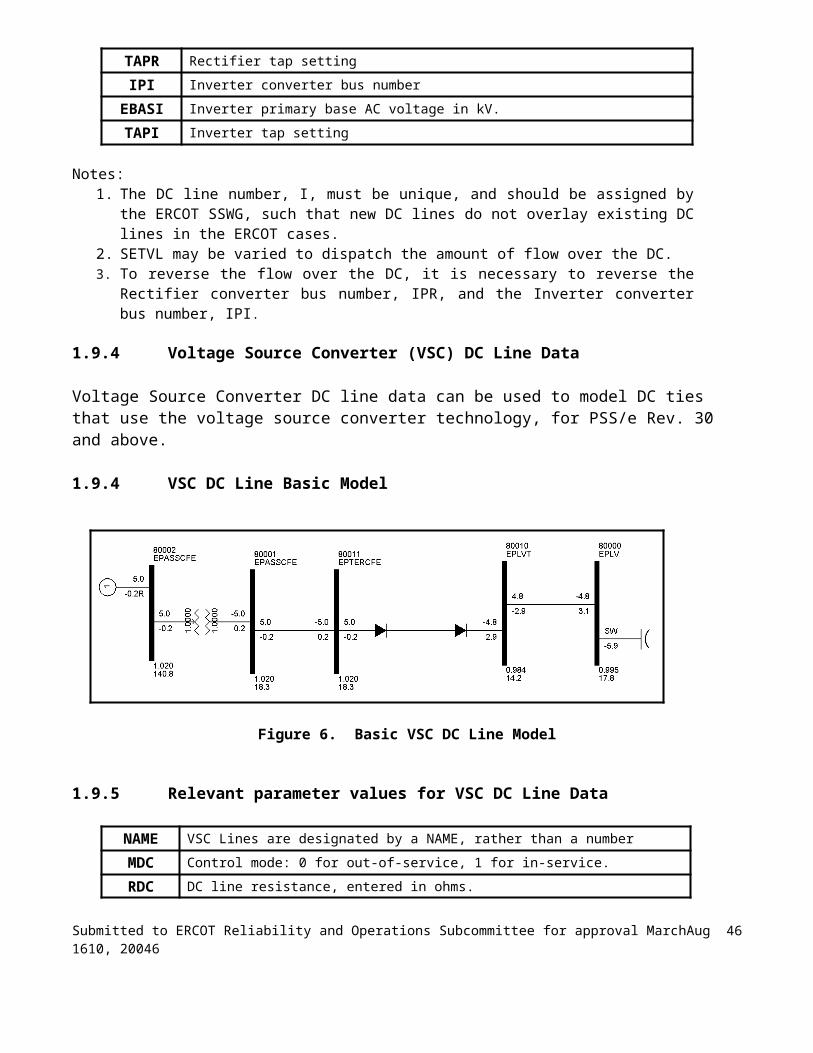
Owner ID, TSP, Bus/Zone Range Table (continue)
TSP ACRONYM
TRAN OWNER
(ID)TSP PSSE
AREA NO# OF BUS
ALLOCATEDZONE
RANGE# OF ZONES ALLOCATED
BUS RANGE
In AEN-TNC CONCHO VALLEY ELECTRIC COOP. CVEC 105
In AEN-TNC MIDWEST ELECTRIC COOP. MWEC 118
In AEN-TNC RIO GRANDE ELECTRIC COOP. RGEC 120
In AEN-TNC SOUTHWEST TEXAS ELECTRIC COOP. SWTE 123
In AEN-TNC STAMFORD ELECTRIC COOP. SECX 124
In AEN-TNC TAYLOR ELECTRIC COOP. TECX 125
6096 - 6096 NORTH HIGH VOLTAGE DC AEP 14 1 394 394 1
6700 - 6749 TEX-LA ELECTRIC COOP. TXLA 130 TUETA 3 50 177 177 1
6800 - 6949 RAYBURN COUNTRY ELECTRIC COOP. RCEC 130 RCEC 2 150 178 178 1
In RCEC GRAYSON COUNTY ELECTRIC COOP. GCEC 112 RCEC 2 11 178 178 1
In RCEC LAMAR ELECTRIC COOP. LCEC 194 RCEC 2 39 178 178 1
In RCEC FARMERS ELECTRIC COOP. FECX 109 RCEC 2 40 178 178 1
In RCEC TRINITY VALLEY ELECTRIC COOP. TVEC 129 RCEC 2 10 178 178 1
7000 - 7899 LOWER COLORADO RIVER AUTHORITY LCRA 116 LCRAA 7 9900 500 589 90
70000 - 78999
7000 - 7899 SOUTHWESTERN ELECTRIC SERVICE CO. SESC 121 LCRAA 7 100 199
8000 - 8999 AMERICAN ELECTRIC POWER - TCC AEP-TCC 106 AEP 8 11000 610 669 60
80000 - 89999
In AEP-TCC MAGIC VALLEY ELECTRIC COOP. MVEC 117 AEP 8 654 655 2
8821 - 8823 SHARYLAND SHRY 18 3 829 829 1
9000 - 9399AUSTIN ENERGY AENX 100 AENXA 9 4400 690 719 30
90000 - 939999400 - 9999
ERCOT SYSTEM PLANNING ESPTO ESPTO 6600 900 999 10094000 - 99999
FACTS Device ID Range Table
Submitted to ERCOT Reliability and Operations Subcommittee for approval MarchAug 1610, 20046 46

FACTS Device ID# Ownership claimed by TSP
1 - 15 American Electric Power16 - 18 Austin Energy
19 20 - 30 TXUED30 - 34 35 - 39 Texas New Mexico Power40 - 50 Centerpoint Energy
Submitted to ERCOT Reliability and Operations Subcommittee for approval MarchAug 1610, 20046 47

Description of Zones in base casesThe number of buses and loads come from the 2006 summer peak base case as a reference.
Zone # Zone Name # buses in zone
# loads in zone Zone Description
2 BRYAN 39 23 City of Bryan3 DENTON 12 12 Denton Municipal Electric4 GARLAND 45 26 Garland Power and Light5 GRNVILLE 12 7 Greenville Electric Utility System6 TMPA 28 3 Texas Municipal Power Agency
11 BEPC 407 325 Brazos Electric Power Coop.120 W FALLS 71 41 TXUED121 EASTLAND 36 20 TXUED124 COMANCHE 21 9 TXUED125 MINERL W 41 25 TXUED130 FT WORTH 140 70 TXUED131 DFW CENT 65 38 TXUED132 DALLAS 332 179 TXUED133 ROANOKE 70 35 TXUED134 VENUS 94 42 TXUED135 DAL SUBS 194 101 TXUED140 GAINESVL 47 24 TXUED141 PARIS 64 15 TXUED142 SULPHR S 32 14 TXUED143 WILLS PT 19 5 TXUED144 TYLER 49 25 TXUED145 ATHENS 32 10 TXUED146 LUFKIN 36 19 TXUED147 PALESTIN 51 26 TXUED148 CORSICAN 53 22 TXUED149 LIMESTON 21 8 TXUED150 RND ROCK 38 25 TXUED151 TEMPLE 23 12 TXUED152 KILLEEN 16 11 TXUED153 WACO 74 34 TXUED154 HILLSBOR 19 13 TXUED160 ODESSA 123 65 TXUED161 MIDLAND 45 28 TXUED162 BIG SPRG 45 31 TXUED163 SWEETWTR 72 34 TXUED177 TEX-LA 18 18 TEX-LA Electric Coop178 RAYBURN 89 88 Rayburn Country Electric Coop199 COCS 4 4 City of College Station200 EHVDC 2 0 East High Voltage DC220 TNP/CLIF 16 16 Texas New Mexico Power Co.221 TNP/WLSP 8 10 Texas New Mexico Power Co.222 TNP/VROG 6 8 Texas New Mexico Power Co.224 TNP/LEW 7 12 Texas New Mexico Power Co.225 TNP/KTRC 9 12 Texas New Mexico Power Co.226 TNP/BELS 5 4 Texas New Mexico Power Co.
Submitted to ERCOT Reliability and Operations Subcommittee for approval MarchAug 1610, 20046 48

Description of Zones in base casesThe number of buses and loads come from the 2006 summer peak base case as a reference.
Zone # Zone Name # buses in zone
# loads in zone Zone Description
227 TNP/CLMX 5 6 Texas New Mexico Power Co.229 TNP/PMWK 20 22 Texas New Mexico Power Co.230 TNP/TC 41 41 Texas New Mexico Power Co.233 TNP/COGN 32 6 Texas New Mexico Power Co.234 TNP/WC 11 13 Texas New Mexico Power Co.235 TNP/HC-F 1 0 Texas New Mexico Power Co.238 TNP/GEN 3 0 Texas New Mexico Power Co.240 TNP/FS 17 11 Texas New Mexico Power Co.260 CNP/DNTN 6 4 CenterPoint Energy - Dist Buses in Downtown261 CNP/INNR 5 4 CenterPoint Energy - Dist Buses in Inner City300 CNPEXNSS 38 22 CenterPoint Energy - Exxon Facility self serve301 CNP/INDS 122 117 CenterPoint Energy - Industrial Customers302 CNP/COGN 63 15 CenterPoint Energy - Cogeneration303 CNP/SS 2 17 CenterPoint Energy - Self Serve304 CNP/DIST 360 318 CenterPoint Energy - Distribution305 CNP/TGN 59 1 CenterPoint Energy306 CNP/IPP 37 0 CenterPoint Energy308 CNP/GALV 14 7 CenterPoint Energy310 STP 3 0 South Texas Project318 2 0 CenterPoint Energy319 CNP/LCAP 24 0 CenterPoint Energy - In Line Capacitor Banks320 CNPDOWSS 37 9 CenterPoint Energy 350 CPS 122 77 City Public ServiceCPS Energy391 WEATHFRD 0 6 American Electric Power - TNC393 TNC/LCRA 13 12 American Electric Power - TNC394 NHVDC 1 0 North High Voltage DC Tie402 WHEARNE 0 1 American Electric Power - TNC424 TRENT 6 4 American Electric Power - TNC428 PUTNAM 25 17 American Electric Power - TNC432 ABILENE 78 38 American Electric Power - TNC434 PECOS 15 9 American Electric Power - TNC438 MCCAMEY 95 50 American Electric Power - TNC442 W CHLDRS 8 5 American Electric Power - TNC444 TUSCOLA 9 10 American Electric Power - TNC446 PADUCAH 15 12 American Electric Power - TNC456 ASPR MNT 37 37 American Electric Power - TNC458 SOUTHERN 4 5 American Electric Power - TNC460 E MUNDAY 30 16 American Electric Power - TNC462 SONORA 21 16 American Electric Power - TNC466 MASON 25 15 American Electric Power - TNC472 PRESIDIO 18 18 American Electric Power - TNC474 SAN ANG 40 23 American Electric Power - TNC477 OKLUNION 20 9 American Electric Power - TNC478 CEDR HIL 31 19 American Electric Power - TNC479 BALLINGR 30 28 American Electric Power - TNC
Submitted to ERCOT Reliability and Operations Subcommittee for approval MarchAug 1610, 20046 49

Description of Zones in base casesThe number of buses and loads come from the 2006 summer peak base case as a reference.
Zone # Zone Name # buses in zone
# loads in zone Zone Description
500 AUSTIN 9 5 Lower Colorado River Authority502 BANDERA 9 8 Lower Colorado River Authority504 BASTROP 30 15 Lower Colorado River Authority506 BLANCO 8 3 Lower Colorado River Authority507 BROWN 1 1 Lower Colorado River Authority508 BURLESON 2 2 Lower Colorado River Authority510 BURNET 20 11 Lower Colorado River Authority512 CALDWELL 12 12 Lower Colorado River Authority514 COLORADO 15 10 Lower Colorado River Authority516 COMAL 21 16 Lower Colorado River Authority522 CULBRSON 2 0 Lower Colorado River Authority525 DEWITT 5 6 Lower Colorado River Authority528 FAYETTE 23 16 Lower Colorado River Authority531 GILESPIE 12 8 Lower Colorado River Authority534 GOLIAD 1 1 Lower Colorado River Authority537 GONZALES 14 11 Lower Colorado River Authority540 GUADLUPE 37 17 Lower Colorado River Authority543 HAYS 30 22 Lower Colorado River Authority546 KENDALL 12 9 Lower Colorado River Authority549 KERR 13 13 Lower Colorado River Authority555 LAMPASAS 7 7 Lower Colorado River Authority558 LAVACA 7 7 Lower Colorado River Authority561 LEE 2 4 Lower Colorado River Authority564 LLANO 22 10 Lower Colorado River Authority575 MILLS 2 2 Lower Colorado River Authority577 REAL 1 3 Lower Colorado River Authority579 SAN SABA 4 3 Lower Colorado River Authority581 TRAVIS 31 12 Lower Colorado River Authority583 WALLER 6 6 Lower Colorado River Authority585 WSHNGTON 12 7 Lower Colorado River Authority587 WILLMSON 16 16 Lower Colorado River Authority589 WILSON 2 2 Lower Colorado River Authority610 E VALLEY 39 33 American Electric Power - TCC615 W VALLEY 66 54 American Electric Power - TCC620 N REGION 113 91 American Electric Power - TCC625 C REGION 104 85 American Electric Power - TCC630 W REGION 54 49 American Electric Power - TCC635 LAREDO 27 21 American Electric Power - TCC636 TRIANGLE 20 14 American Electric Power - TCC640 NORTH LI 25 19 American Electric Power - TCC645 CENT LI 27 22 American Electric Power - TCC650 NR COGEN 15 10 American Electric Power - TCC651 CR COGEN 8 0 American Electric Power - TCC654 MVEC/E 12 12 American Electric Power - TCC655 MVEC/W 19 19 American Electric Power - TCC656 TCC/RGEC 2 2 American Electric Power - TCC
Submitted to ERCOT Reliability and Operations Subcommittee for approval MarchAug 1610, 20046 50

Description of Zones in base casesThe number of buses and loads come from the 2006 summer peak base case as a reference.
Zone # Zone Name # buses in zone
# loads in zone Zone Description
658 TCC/LCRA 2 3 American Electric Power - TCC659 TCC/MEC 2 3 American Electric Power - TCC660 DAV#1GEN 1 0 American Electric Power - TCC661 ROBSTOWN 0 2 American Electric Power - TCC662 KIMBLE 1 1 American Electric Power - TCC691 BAST-AEU 1 0 Austin Energy692 CALD-AEU 2 0 Austin Energy695 FAYE-AEU 1 0 Austin Energy709 TRAV-AEU 93 58 Austin Energy712 WILL-AEU 2 2 Austin Energy800 BPUB 22 13 Public Utility Board of Brownsville870 MEC 51 29 Medina Electric Coop890 STEC 132 78 Medina Electric Coop891 LOAD-EX 2 2 Medina Electric Coop
Submitted to ERCOT Reliability and Operations Subcommittee for approval MarchAug 1610, 20046 51

Submitted to ERCOT Reliability and Operations Subcommittee for approval MarchAug 1610, 20046 52

Appendix BGlossary of Terms
ALDR Annual Load Data Request
BUS A node representing point of electrical connection, such as substation or radial tap point.
CSC Commercially Significant Constraint
ECO Economically Dispatched
ERCOT Electric Reliability Council of Texas
ESPTO ERCOT System Planning IPP Independent power producer
LSE Load serving entity
LTC Load tap changing transformer
MLSE Most limiting series element
MSL Multi-section line
NERC North American Electric Reliability Council
NESC National Electric Safety Code
NOIE Non-opt-in Entity
NUG Non Utility Generator
PUCT Public Utility Commission of Texas
QSE Qualified Scheduling Entity
REP Retail Electric Provider
SSWG Steady State Working Group
TPIT Transmission Project Information Tracking
TSP Transmission Service Provider
VCRP Voltage control and reactive planning
Submitted to ERCOT Reliability and Operations Subcommittee for approval MarchAug 1610, 20046 53

ZONE A predefined sub-system within a load-flow case.
Submitted to ERCOT Reliability and Operations Subcommittee for approval MarchAug 1610, 20046 54

Appendix CTSP Impedance and Line Ratings Assumptions
Comparison of ERCOT TDSP’s Ampacity Assumptions
Center Point TNP CPS LCRA
Austin Energy STEC TXUED BPUB AEP TMPA Garland Denton
Rayburn Country
Wind Velocity (feet per second) 32 2 2.05 2 2 2.05 2 2 2 2.05 2.00
Wind Angle (degrees to conductor) 390 90 90 90 90 90 90
Emissivity 0.57 0.5 0.5 0.5 0.5 0.4 0.5 0.5 0.5
Solar Absorbtion 0.59 0.5 0.5 0.5 0.5 0.4 0.5 0.5 0.5
Ambient Temp Summer ( °c ) 36 25 25 40.55 40 40.55 40 25 40 25 40 43
Normal Conductor Temp Summer ( °c ) 75/90 75 x 90% 75 93.33 100 x 90% 75 x 90% 90 75 x 90% 85 75 x 90% 90 75
Emergency Conductor Temp Summer(°c) 90 75 75 100 75 90 X 110% 75 100 75 50 95
Ambient Temp Winter ( °c ) 20 -7
Normal Conductor Temp Winter ( °c ) 85 38
Emergency Conductor Temp Winter (°c) 100 49
The planning ratings are calculated in accordance with the methodology contained in IEEE Standard 738. Each TDSP has their own set of design parameters and assumptions.
Submitted to ERCOT Reliability and Operations Subcommittee for approval MarchAug 1610, 20046 55

CenterPoint Energy
CenterPoint Energy uses the Line Constants (LC) module of the Computer Aided Protection Engineering (CAPE), which is developed and supported by Electrocon International Incorporated. The LC software calculates the line constant parameters for overhead transmission lines. LC calculates the total self-series positive and zero sequence impedance and self-shunt positive and zero sequence admittance of the main circuit in a given right-of-way section. LC also calculates the total mutual zero sequence series impedance and shunt admittance between the main circuit and all other circuits in the given right-of-way section.
LC does not calculate impedance for underground cables. Instead per-mile impedance data provided by the manufacturer is entered in parameter codes. LC multiplies this per-mile impedance with the actual mileage of the circuit to calculate total impedance for the underground cable.
Data used (conductor catalog, tower design, soil resistivity, parameter codes, right-of-way data, tower string data, line data and line section data) in LC calculation is stored in a database called TLIP.gdb. Calculated parameters are also stored in a TLIP database.
Line ConstantsAssumptions used in the calculations are: Earth resistivity = 10 ohmmeters. Frequency = 60 Hz. Conductor characteristic data from T&D Reference Book, Aluminum Electrical Conductor
Handbook Third Edition 1989 from the Aluminum Association and Southwire Conductor Reference Handbook, 1994.
Conductor temperatures used for calculating impedance: 25oC. Ground wires are included in zero sequence impedance calculations. Actual tower and pole configurations are used in calculations. Actual length of line is used. Sag characteristics are based upon the type of structure being studied.
Transformer ConstantsTransformer impedance is calculated when possible using data from the manufacturer’s test reports and industry accepted formulas to convert the manufacturer's test results data to resistance and reactance values on the required per-unit base. If it is not available, CenterPoint Energy will use typical data from similar transformers in the system
Assumptions used in the calculations are: Frequency = 60 Hz. Temperatures vary depending upon the vendor test data.
Conductor Ratings Conductor ampere ratings are calculated by the IEEE method detailed in ANSI/IEEE Standard 738-93 with the following input parameters:Latitude = 28 NWind Velocity = 2 feet per secondWind Angle = 90° to conductorEmissivity Coefficient = 0.7Solar Absorption Coefficient = 0.9Line Elevation = 500 feet AMSLLine Orientation = North – South
Submitted to ERCOT Reliability and Operations Subcommittee for approval MarchAug 1610, 20046 56
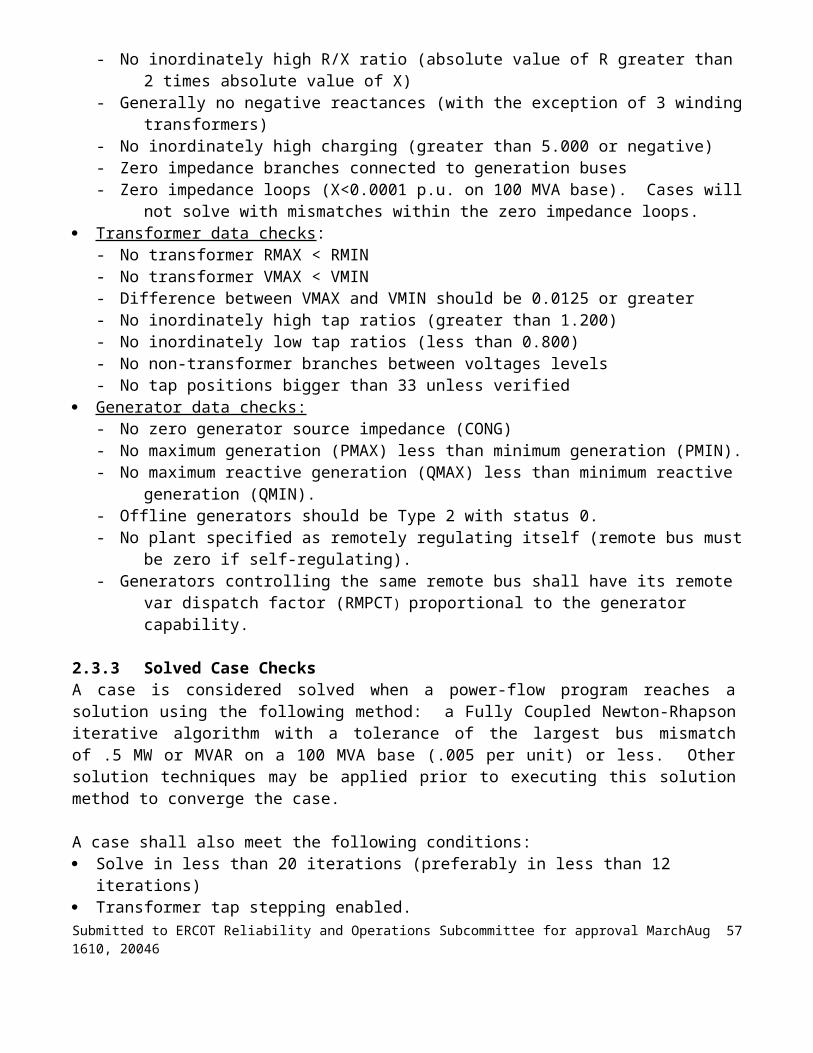
Time of Day = 2 P.M.Atmospheric Condition = IndustrialAir Temperature = 36 C
The normal rating is the maximum current carrying capacity of an element for continuous operation without causing any loss of life. For overhead transmission conductor this capacity is the ampacity of the conductor at 75oC unless the conductor has enough clearance for operating continuously at 90oC The normal rating for switches, breakers, transformers, current transformers, wave traps etc. is the maximum nameplate rating.
The emergency rating is the maximum current carrying capacity of an element for a 2 hour duration with acceptable loss of life. For overhead transmission conductor it is the ampacity of the conductor at 90oC unless the conductor has been surveyed and cleared for operating at a higher temperature for a short duration. For underground transmission conductor the emergency rating is the maximum allowable ampacity for 300 hours of emergency operation. For substation facilities such as switches and wave traps, the emergency rating is 110% of the normal rating. For breakers, the emergency rating is the same as the normal rating.The emergency rating of the conductor is the conductor thermal rating.
Line RatingsThe maximum overall rating of a transmission line is the current carrying capability of the most limiting element in series between the breakers at its two end points. Unless otherwise limited by equipment ratings installed in the transmission line circuit such as breakers, current transformers, switches, disconnects, wave traps, jumpers, the normal and emergency rating of a transmission line is the conductor normal and emergency ratings. Where such equipment has a manufacturer's nameplate continuous current rating less than the conductor normal and/or emergency rating, then that equipment’s continuous rating shall be used for the normal and/or emergency rating of the transmission line.
Transformer RatingsThe normal rating of a transformer is the manufacturer’s highest continuous FA or FOA rating at 65C rise. The emergency rating is the maximum loading for a 2-hour duration.
Submitted to ERCOT Reliability and Operations Subcommittee for approval MarchAug 1610, 20046 57
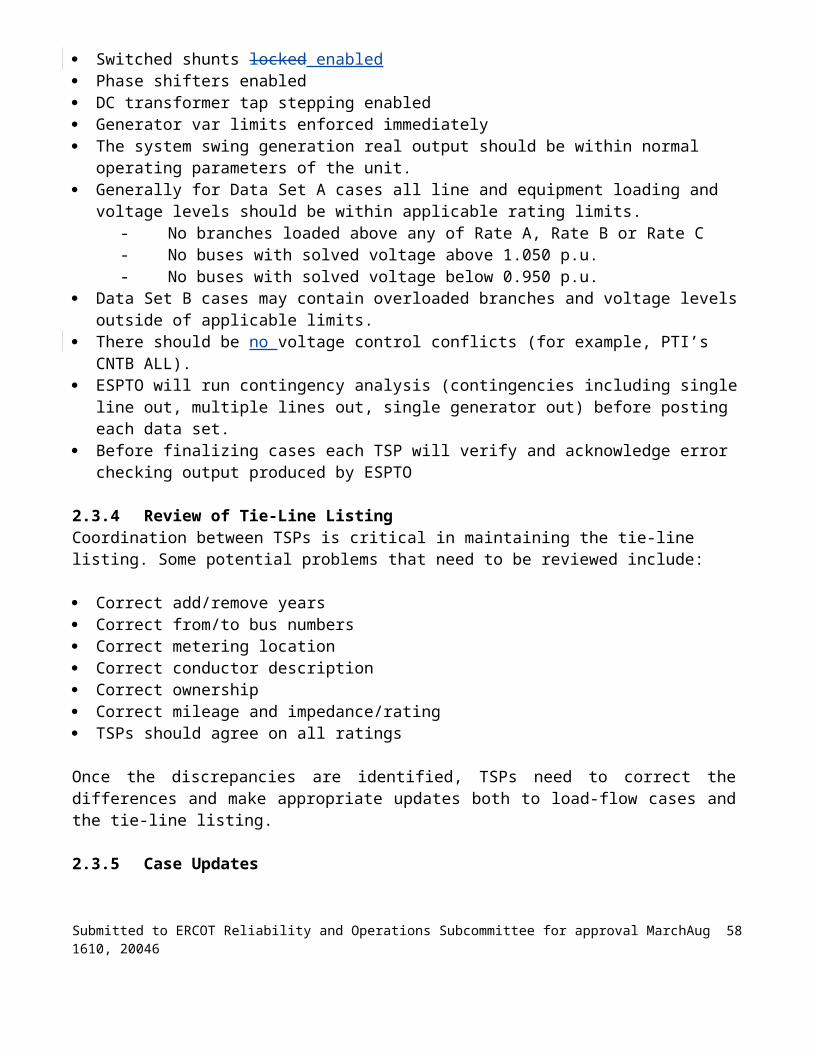
Texas-New Mexico Power Company
Conductor Ratings Conductor thermal ratings for existing transmission lines are calculated by the IEEE method detailed in ANSI/IEEE Standard 738 with the following input parameters:
Latitude = 30 NWind Velocity = 2 feet per secondWind Angle = 90° to conductorEmissivity Coefficient = 0.5Solar Absorption Coefficient = 0.5Line Elevation = 600 feet AMSLLine Orientation = East – WestTime of Day = 2 P.M.Atmospheric Condition = ClearAir Temperature = 25 CConductor Temperature = 75 C
New transmission lines will be designed using the above parameters to calculate load capacity, except that Ambient Temperature will be 38C, and Conductor Temperature will be 100C. In cases where ACSS conductor is installed, Ambient Temperature of 38C and Conductor Temperature of 200C will be used.
The 2-hour rating of the conductor of an existing line is the conductor thermal rating based on a conductor temperature of 75C unless it has been determined that the conductor can operate at a higher temperature and maintain adequate clearance. No allowance is made for design or operational thermal limits such as conductor sag or for circuit elements other than the transmission line conductor.
Line RatingsUnless otherwise limited by equipment ratings installed in the transmission line circuit such as breakers, current transformers, switches, disconnects, wave traps, jumpers, the rating of a transmission line is the conductor rating. Where such equipment has a manufacturer's continuous current rating less than the conductor rating, then that equipment continuous rating shall be used for the rating of the transmission line.
Transformer RatingsThe continuous rating of a transformer is the manufacturer’s highest continuous FA rating at 55C rise.The 2-hour rating of a transformer is the manufacturer’s highest continuous FA rating at 65C rise.
Line ConstantsLine impedance constants are calculated in a TNMP developed Transmission Line Impedance Calculation spreadsheet-using formulas detailed in the Electrical Transmission and Distribution Reference Book by Westinghouse (T&D Reference Book). Factors used in the calculations are: Conductor characteristic data from T&D Reference Book, Electrical Conductor Handbook, or
manufacturer's data sheets Tower or pole and conductor configuration information Actual length of line with no allowance for sag Earth resistivity = 100 ohm-meters Frequency = 60 Hz
Submitted to ERCOT Reliability and Operations Subcommittee for approval MarchAug 1610, 20046 58

Ground wires are included in zero sequence impedance calculations
Transformer ConstantsTransformer impedance is calculated using data from the manufacturer’s test reports and industry accepted formulas to convert the manufacturer's test results data to resistance and reactance values on the required per-unit base.
Submitted to ERCOT Reliability and Operations Subcommittee for approval MarchAug 1610, 20046 59
CPS Energy
Line constantsCPS Energy’s current line constant data was developed with either ASPEN or Bowen & Green. CPS Energy is in the process of implementing CAPE to validate and compute future Line Constants. CPS Energy models each right-of-way in great detail. This includes modeling the towers, tower spacing, circuit mileage, conductor type, conductor separation, and conductor sag. The line constants program calculates positive sequence, negative sequence, zero sequence, and mutual line impedances.
Assumptions used to make calculations: Earth resistivity is 100 ohm-meters. Frequency is 60 Hz. Conductor temperature used for calculating impedance: 50o C. The conductor names follow the convention, 1272AA (AWG or kcmil size, and stranding
class), as described in the Aluminum Association Electrical Conductor Handbook Third Edition 1989.
Typical conductor data for resistance, reactance and size of conductor is used in the calculations. Conductor data comes from Aluminum Association Electrical Conductor Handbook Third Edition 1989 or Electrical T&D Reference Book Westinghouse Electric Corporation Fourth Edition Copyright 1964.
Ground wires are included using diameter, resistance, and reactance in ohms/mile. Actual tower configurations and line lengths are used. Conductor sag is included in the calculation using typical data.
Line RatingsThe maximum overall rating of a transmission line is the current carrying capability of the most limiting series element (MLSE) between its two end points.Unless otherwise limited by MLSE, the emergency rating of the transmission line is the conductor rating. The circuit thermal capabilities are reduced to the ratings of the MLSE as described in the NERC Planning Standards. This includes, but is not limited to substation terminal equipment such as:
Disconnect Switches,Wave Traps and Circuit Breakers are rated based upon the manufacturer’s ratings
Current Transformers are rated as the product of the CT rating and the thermal rating factor.
If these ratings are less than the conductor rating, they are considered as the emergency rating of the circuit
Thermal Line Ratings CalculationConductor ratings are calculated with a program that uses IEEE Standard 738 for Calculation of Bare Overhead Conductor. Conductor characteristics are taken from the Aluminum Association Electrical Conductor Handbook. Loading levels are tolerated until 100% of rating. Planning begins to take action when the line has reached 90% of its rating.
Assumptions used to make calculations: Normal & emergency line ratings are calculated using 25o C ambient temperature, 75o C
conductor temperature. Wind Velocity = 1.4 MPH = 2.05 Feet Per Second Solar emissivity = 0.5. Solar absorption = 0.5. Wind direction S-N or E-W, choice in program.
Submitted to ERCOT Reliability and Operations Subcommittee for approval MarchAug 1610, 20046 60

Elevation is 600 ft above sea level. Latitude = 30o .
Transformer constantsCPS Energy uses either the transformer test report data or the manufacturer specifications sheets for Transformer impedance calculations.
Assumptions used to make calculations: Transformer manufacturer data or test reports. Earth resistivity is 100 ohm-meters. Frequency is 60 Hz. Temperature used for calculating impedance: 85o C. Typical transformer data: resistance, reactance used in the calculations.
Transformers Ratings Calculation Normal transformer ratings are the manufacturer’s highest nameplate rating, either 55o C or 65 o C,
highest FA or FOA rating. Emergency transformer ratings are the same as the normal ratings. This rating is the only rating used for studies concerning transformers.. Assumptions used in making normal and emergency calculation are completely from manufacturer's test reports.
Loading levels are tolerated until 100% of rating. Planning begins to take action when loading had reached 90% of rating.
Submitted to ERCOT Reliability and Operations Subcommittee for approval MarchAug 1610, 20046 61

Lower Colorado River Authority
Line ConstantsThe LCRA utilizes a database to keep tabulated data and perform calculations for positive and zero sequence values (R, X, Ro, Xo) and charging values (B). These calculations and some tabulated values are used for input in a load-flow modeling software (PSS/E). Standard formulas are used and can be found in the Westinghouse Electrical Transmission & Distribution Reference Book or other similar textbooks.
The following assumptions are made in the calculations:Earth resistivity is 100 meters Frequency is 60 HzThe conductor names follow the standard convention, such as Drake & PenguinTypical data (resistance, reactance) from “Southwire Company Overhead Conductor Manual”Conductor temperature used for calculating impedance: 50°CConductor length based on Surveyed Horizontal Plane DistancesStandard Voltage (69kV, 138kV, 345kV, etc.)Actual tower configurations provide values of conductor, bundling, and ground wire spacingMutual effects from parallel circuits are not included as of this time
Ampacity is based on maximum conductor sag allowed based on NESC clearance requirements. Currently all new circuits are designed for a sag at 200°F. However, a few circuits in LCRA’s system are limited to a maximum operating temperature lower than 200°F based on clearance requirements.
Ampacity calculations are performed by using the IEEE Standard for Calculating the Current-Temperature Relationship of Bare Overhead Conductors (IEEE Std 738-1993). There are currently two environmental conditions with different assumptions. Environ_Cond 2 represents one high altitude circuit and Environ_Cond 1 represents all other circuits in the system. The following are the assumptions:
ENVIRON_COND
Elevation(ft)
AzimuthLine
LineLatitude
Time(Military)
Ambient
Wind
Velo
Emissivity
Solar absorptiv
ity
Atmosphere
1 600 0 30 14 105 2 0.5 0.5 CLEAR2 5000 90 30 14 105 2 0.5 0.5 CLEAR
Conductor RatingPlanned transmission line loading will be such that National Electrical Safety Code line-to-ground clearances will be maintained for all anticipated normal and contingency conditions. Transmission system power flow shall not exceed 100% of the conductor thermal rating. Full conductor thermal ratings are assigned as shown in the table below. The conductor ratings are based upon a 93.33 C (200 F) average conductor temperature using coefficients of emissivity and absorptivity of 0.5, a 40.55o C (105 o F) ambient temperature, an elevation of 600 feet above sea level, north-south line orientation, 30 o latitude, 2:00 PM solar conditions, clear atmosphere, and a wind velocity of 2 feet per second normal to the conductor.
TYPICAL CONDUCTOR THERMAL RATINGS
Submitted to ERCOT Reliability and Operations Subcommittee for approval MarchAug 1610, 20046 62

ConductorSize
ConductorAmpacity
MVA Rating(69 kV)
MVA Rating(138 kV)
MVA Rating(345 kV)
1/O ACSR 256 31 Not used Not used
4/O ACSR 396 47 95 Not used
336 ACSR 534 64 128 Not used
336x2 ACSR 1068 128 255 Not used
477 ACSR 666 81 159 Not used
795 ACSR 920 110 220 Not used
795x2 ACSR 1840 220 440 1099
1192.5 ACSR 1168 140 279 Not used
Autotransformer RatingPlanned loading on auto-transformers, during normal, single, or multiple contingency conditions, shall be limited to 100% of the auto-transformer’s nameplate 65 C rise megavoltampere (MVA) rating.
Submitted to ERCOT Reliability and Operations Subcommittee for approval MarchAug 1610, 20046 63
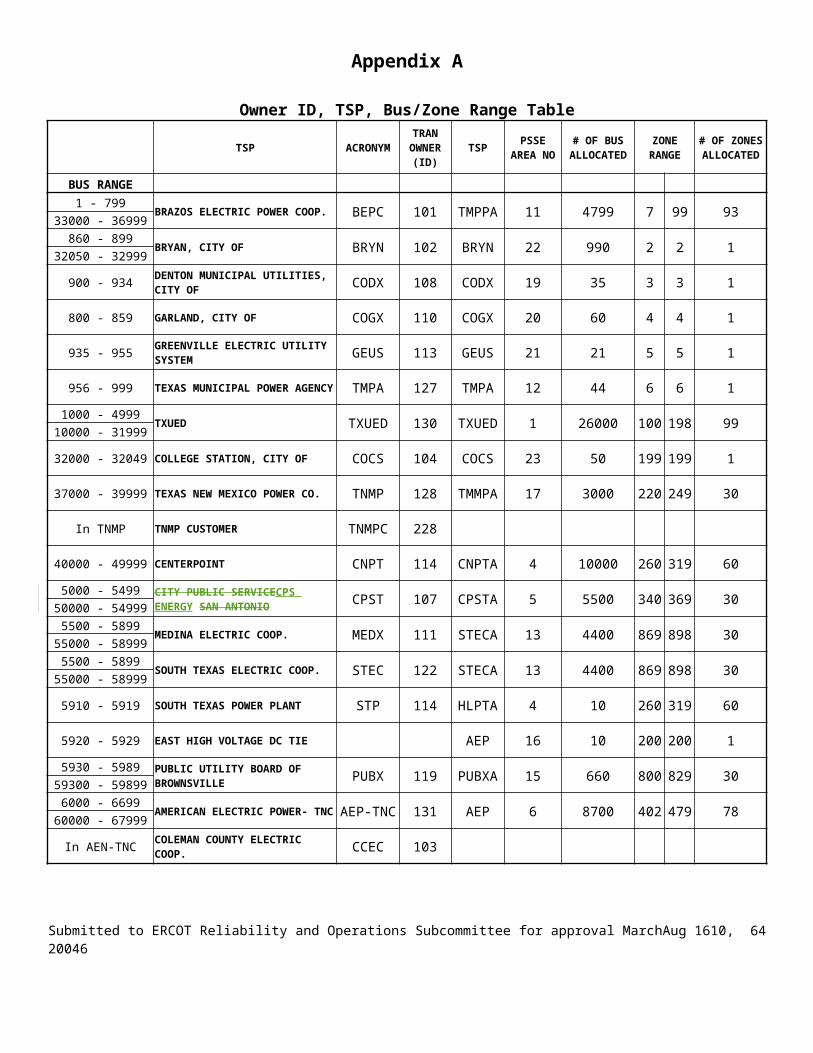
Austin Energy
Line Constants Austin Energy uses PTI’s Transmission Line Characteristics program (TMLC) to calculate the line constants. TMLC accepts input data either interactively or from an ASCII text file. The program requires (1) conductor sag and tower configuration data, (2) conductor characteristic data, (3) the phase location on the tower.
Assumptions used to make the line constant calculations:
Earth resistivity is 100 ohm-meters.Frequency is 60 HzThe conductor names follow the standard convention such as Drake, Rail or Puffin, as described in the Aluminum Association Electrical Conductor Handbook.Conductor temperature used for calculating impedance: 50CTypical conductor data used: Resistance (Rac and Rdc), inductive reactance, capacitive reactance and conductor rating.Data comes from the Electrical Conductor Handbook and Electrical T&D Reference Book.The calculation includes ground wires in the calculations.The actual tower configuration is used in the calculations.The actual length of line is used in the calculations.The conductor sag is included in calculation and it is determined graphically.
Transformer Constants Austin Energy uses either the transformer test report data or the manufacturer specification sheets data.
Assumptions used to make the calculations:Frequency is 60 HzTemperature used for calculating impedance: 75-85CTypical transformer data: resistance, reactance are used in the calculationsData comes from transformer test reports Ratings Calculation Line BranchesAustin Energy utilizes the ampacity table developed by the BICC Utility Cable Company for the transmission line ratings. For the equipment at the substation termination, Austin Energy uses the nameplate ratings for the circuit breakers and the new re-rated ratings for other equipment such as switches, jumpers, and wave traps.
Assumptions used for normal and emergency ratings.For ACSR conductors: Emergency rating at 100C, normal rating set at 90% of emergency rating.For ACSS conductors: Emergency rating at 200C, normal rating set at 90% of emergency rating.Normal line ratings are calculated using 40C ambient temperature.Wind speed = 2 feet/second with sun.Frequency of operation = 60 Hz.Solar absorption/emissivity = 0.5Wave traps, current transformers and load switches can be loaded to the normal rating under normal conditions and can be loaded to the emergency rating under contingency conditions. The normal rating of the most limiting series element (Rate A) is applied under normal condition, and the emergency rating of the most limiting series element (Rate B) is applied under contingency condition.
Submitted to ERCOT Reliability and Operations Subcommittee for approval MarchAug 1610, 20046 64

Transformers BranchesEmergency transformer rating is specified as 100% of manufacturer’s nameplate FA or FOA rating at 65C rise, at an ambient temperature of 20C. Normal transformer ratings are specified as 90% of the emergency transformer rating.
The normal and emergency ratings are good forever.
The newer 345/138 kV autotransformers have FA ratings. The older autotransformers have FOA ratings.
Under normal conditions, the loading of the transmission lines and transformers should be less than the normal ratings, while under contingencies, the loading has to be 100% or less of the emergency ratings. If the loading exceeds the ratings, operational fixes or transmission additions are considered.
Submitted to ERCOT Reliability and Operations Subcommittee for approval MarchAug 1610, 20046 65
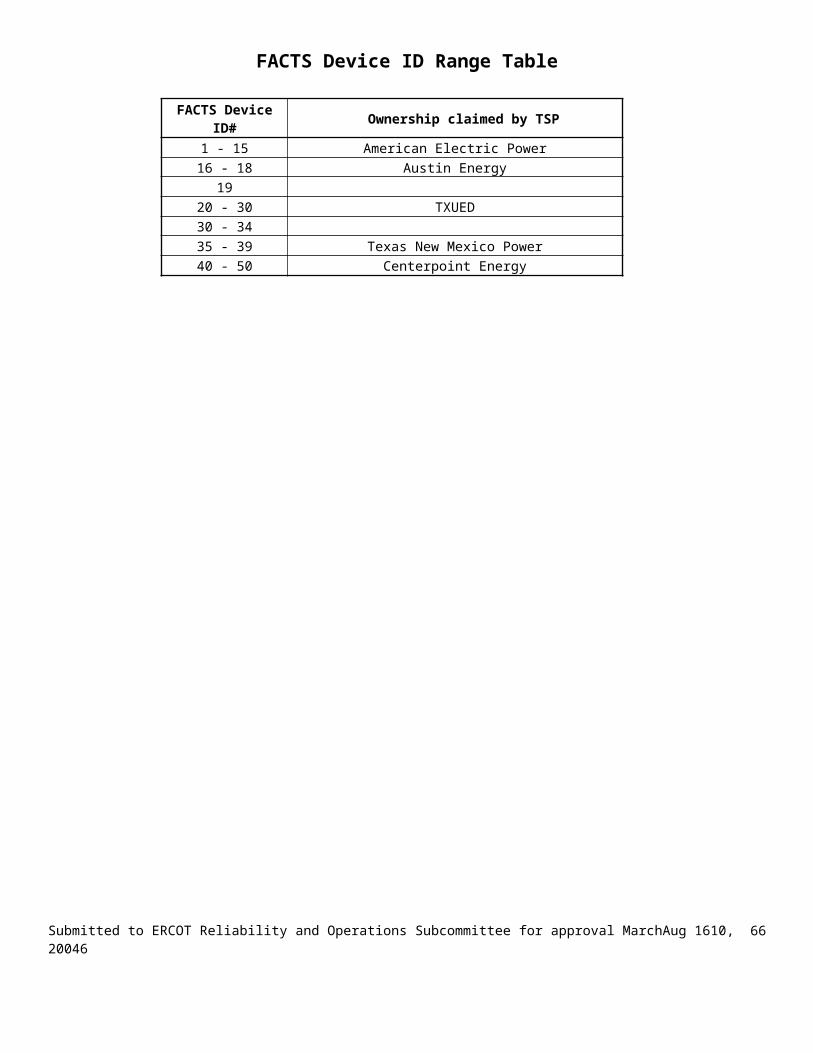
South Texas Electric Cooperative, Inc.
Calculations made with IEEE Rate temp DOS program.
Standard assumptions:Earth resistivity is 100 -meters Frequency is 60 HzThe conductor names follow the standard convention, such as Drake & PenguinTypical data (resistance, reactance) from “Southwire Company Overhead Conductor Manual”Conductor length based on Surveyed Horizontal Plane DistancesStandard Voltage (69kV, 138kV, 345kV, etc.)Actual tower configurations provide values of conductor, bundling, and ground wire spacing
Rating Descriptions:
Normal = 90% of 1.36mph wind, 102 deg ambient temp, 100 deg C conductor, Time 1400 - 1600, Clear skies
Emergency (2 hour) = 1.36 mph wind, 102 deg C ambient, 100 deg C conductor, Time 1400-1600, Clear Skies
Emergency 15 Minute = Capacity for 15 minutes with Normal (A) pre loading
Normal Conditions set are:
Wind Direction (from line) 90 degreesLocation Latitude 29 degreesLocal Sun Time 2 P.M.Line Direction North/SouthLine Elevation 200 ftCoefficient of Emissivity 0.5Coefficient of Solar Absorption 0.5
TYPICAL CONDUCTOR THERMAL RATINGS
Conductor Design Temp Normal Rating Emergency Rating 15 Min. RatingDegrees C 69 kV 138 kV 69 kV 138 kV 69 kV 138 kV
MVA MVA MVA MVA MVA MVA4/0 ACSR 75 32 35 364/0 ACSR 100 40 45 45336 ACSR 100 62 69 70477 ACSR 100 78 156 87 173 89 177795 ACSR 75 161 178 186795 ACSR 100 110 216 122 240 127 2511590 ACSR 100 325 361 389
Notes:
Submitted to ERCOT Reliability and Operations Subcommittee for approval MarchAug 1610, 20046 66

The 69kV STEC lines built in the 1960s met the NESC & RUS codes at that time which specified a minimum ground clearance at 120 degrees F. The codes then changed to include minimum ground clearances regardless of temperature. STEC then built some lines that reached minimum clearances at 75 degrees C. New lines are designed to meet the minimum ground clearances at 100 degrees C.
Autotransformer MVA Ratings
1. Normal rating: Manufacturer’s FOA rating at 55o C rise.2. Emergency rating: Manufacturer’s FOA rating at 65o C rise.
Current Transformer Ratings1. Normal rating: 90% of manufacturer’s specified rating.2. Emergency rating: 100% of manufacturer’s specified rating.
Submitted to ERCOT Reliability and Operations Subcommittee for approval MarchAug 1610, 20046 67

TXU ED
TXU ED Electric Line Constants calculationTXU ED Electric uses the APSEN Line Constants Program for calculating Line Impedance. The ASPEN program consists of two modules, the ASPEN Construction module and the Lines Construction module. The Construction Module contains tower configuration data for each right-of-way in a system. This data consists of tower spacing, sag, bundle separation (if applicable) and conductor type. The Lines Construction module is where the point-to-point line section is constructed. For each line section the mileage data is entered and a tower configuration from the Construction Module is referenced for calculating the impedance. The TXU ED system consists of 621 lines (breaker to breaker) with 3373 total sections. Calculations are performed with the following constants:
Earth resistivity 100 ohms-meterFrequency 60 HzConductor Temp 50 °CGround wires are included in the calculationsTypical sag is assumed for each voltage level.
22.52 feet for 345 kV13.33 feet for 138 kV8.92 feet for 69 kV
Conductor data (resistance, reactance, and outside diameter) is taken from the EPRI Transmission Line Reference book.
Transformer ConstantsTransformer impedance is calculated when possible using data from the manufacturer’s test reports and industry accepted formulas to convert the manufacturer's test results data to resistance and reactance values on the required per-unit base. If actual data is not available, typical data from similar transformers in the system is used.
Conductor Ratings Conductor ampere ratings are calculated by the IEEE method detailed in ANSI/IEEE Standard 738-86 with the following input parameters:Wind speed: 2 feet per second normal to conductorLine orientation: North – SouthCoefficient of emissivity: 0.5Coefficient of solar absorption: 0.5Line elevation above sea level: 600 feetLocal sun time: 2:00 PM.Ambient temperature: 40°CConductor temperature: 90°CLine latitude: 32° northAtmospheric conditions: clear
TXU ED does not use a normal rating for transmission lines. Normal loadings up to the emergency rating are acceptable on a continuous basis. Some TXU ED transmission lines are designed to operate with a conductor temperature greater than 90°C. Each line is rated using the ambient assumptions defined earlier and the maximum conductor temperature unique to that line.
The short-term emergency rating is the maximum current carrying capacity of the conductor for a short duration with acceptable line clearance. For overhead transmission conductor it is 110% of the ampacity of the conductor at 90oC if the line has been surveyed and cleared for operating at a higher
Submitted to ERCOT Reliability and Operations Subcommittee for approval MarchAug 1610, 20046 68

temperature for a short duration and the nameplate rating of the switches, breakers and current traps is greater than or equal to 110% of the conductor rating. For underground transmission conductor the emergency rating is 300 hours of emergency operation at 100°C.
Line RatingsThe maximum overall rating of a transmission line is the current carrying capability of the most limiting element in series between the breakers at its two end points. Unless otherwise limited by equipment installed in the transmission line such as breakers, current transformers, switches, disconnects, wave traps, jumpers, the emergency rating of a transmission line is the conductor emergency rating. Where such equipment has a manufacturer's nameplate continuous current rating less than the conductor emergency rating, then that equipment’s continuous rating shall be used for the emergency rating of the transmission line.
Transformer RatingsBoth normal and emergency ratings are calculated in accordance with either ANSI/IEEE Standard C57.92 (1981) or IEEE Standard 756-1984. Both summer and winter ratings are based upon appropriate daily load and ambient temperature cycles.
Normal ratings are based upon no reduction in normally expected transformer life.
Emergency ratings are based upon the occurrence of two or three long-duration (months) or multiple short-duration (days) contingencies affecting the life of a transformer. They recognize a hottest spot limit to prevent bubble evolution and a limitation in the loss of transformer expected life of no more than 0.2% per daily load cycle. (Tests indicate that bubble evolution may occur in operating power transformer at temperatures of 140°C and above; however, a maximum emergency hottest spot temperature of 135°C is used for planning purposes to allow for abnormally high daily loads and/or ambient temperatures.)Limiting temperatures in degrees C are as follows:
Maximum Hottest Spot Rated Rise Top Oil Normal Emergency 55 100 105 135 65 110 120 135
Summer Ambient – 40o C
Submitted to ERCOT Reliability and Operations Subcommittee for approval MarchAug 1610, 20046 69

TMPA Line and Equipment Ratings
Transmission Line Conductor Emergency ratings are based on 25o C ambient, 75o C Conductor temperature, 1.4 mph wind, sun.Normal ratings are 90% of the emergency rating.
Autotransformer MVA RatingsNormal rating: Manufacturer FOA rating at 55o C rise.Emergency rating: Manufacturer FOA rating at 65 o C rise.
Current Transformer Ratings Normal rating: 90% of manufacturer specified rating.Emergency rating: 100% of manufacturer specified rating.
Substation Bus and Equipment Normal Voltage Ratings69 kV: 65.55 kV – 72.45 kVa. 138 kV: 131.10 kV – 144.9 kVb. 345 kV: 327.75 – 362.25 kV
Oil and Gas Circuit Breaker Current RatingsNormal rating: 90% of manufacturer specified rating. Emergency rating: 100% of manufacturer specified rating.
Submitted to ERCOT Reliability and Operations Subcommittee for approval MarchAug 1610, 20046 70

City of Garland
Line Constants: IEEE Transactions on Power Apparatus and System Textbook Earth resistivity is 100 ohms-meter Frequency is 60 Hz Sag--tests were done assuming no sag, and assuming a reasonable sag value, equal in all phases and in the ground wires Manufacturers data: resistance and reactance per phase per mile Actual length of lines Actual tower configurations Ground wires assumed to be segmented Line Ratings Methodology: The maximum overall rating of a transmission line is the current capability of the most elements in series between its two end points. Unless otherwise limited by equipment ratings installed in the transmission line circuit such as breakers, switches, disconnects, wave traps, jumpers, current transformers, etc. The normal and emergency ratings of a transmission line are the conductor normal and emergency ratings.The transmission line ratings are calculated from a program that uses the IEEE Standard for Calculation of Bare Overhead Conductor. Conductor characteristics are taken from the Aluminum Association Electrical Conductor Handbook. Loading levels are tolerated until 100% of rating. Begin taking action at 90% of rating. Assumptions used to make normal and emergency calculations:Ambient temperature: 40oCConductor temperature: 90oCWind speed: 2 feet per secondEmissivity coefficient: 0.5Solar absorption coefficient: 0.5Line orientation: North-SouthLine elevation above sea level: 600 feetLine latitude: 32o northAtmospheric condition: clearTime of day: 2 PM
Typical conductor information
No. Capacity Rating at Voltage Type Stranding
1 218MW @ 138kV 795 ACSR 26/72 110MW @ 69kV 795 ACSR 26/73 77MW @ 69kV 477 ACSR 26/74 60MW @ 69kV 336 ACSR 26/75 87MW @ 69kV 556 ACSR 26/76 174MW @ 138kV 556 ACSR 26/77 314MW @ 138kV 556 ACSS 26/78 110MW @ 69kV 954 ACSR 54/79 40MW @ 69kV 1/0 ACSR 6/1
10 58MW @ 138kV 1/0 ACSR 6/111 157MW @ 69kV 556 SSAC 26/7
Transformer Constants: Use manufacturer actual nameplate data.
Submitted to ERCOT Reliability and Operations Subcommittee for approval MarchAug 1610, 20046 71

City of Denton
The city of Denton owns only 69kV transmission lines and no transmission voltage transformers. Little historical information is available to indicate the exact methodology used in developing impedance date for the 69kV lines. It appears that the data was developed in the early 1980s using the Westinghouse method. These values were apparently verified, or at least accepted, by TMPA. The values developed are still in use in analytical programs. Line impedance data for line construction or line rebuilds will be developed using the ASPEN program. Evaluation of the potential effect of proposed conductor size changes indicate that the impedance values in use are within reason. Data for all line sections will be reviewed in the future and documentation prepared to describe methodology.
Line Ratings The 50 C conductor ratings are used as the normal and the emergency ratings for existing lines. Almost all transmission lines are under built with one or two distribution circuits. This limits the amount of sag that can be tolerated. Specific historical design information is not available to use in evaluating potential ratings. Studies will be undertaken as needed to determine possible increases in ratings. New lines will be designed for 100 C operation.
Brownsville Public Utilities Board
Line Constants Line impedance constants are calculated using formulas detailed in the Electrical Transmission and Distribution Reference Book by Westinghouse (T&D Reference Book). Factors used in the calculations are: Conductor characteristic data from T&D Reference Book, Electrical Conductor Handbook, or
manufacturer's data sheets Tower or pole and conductor configuration information Actual length of line with no allowance for sag Earth resistivity = 100 ohm-meters Frequency = 60 Hz Ground wires are included in zero sequence impedance calculations
Transformer ConstantsTransformer impedance is calculated using data from the manufacturer’s test reports and industry accepted formulas to convert the manufacturer’s test results data to resistance and reactance values on the required per-unit base. If it is not available, PUB will use typical data from similar transformers.
Conductor Ratings Conductor thermal ratings are calculated using the IEEE method detailed in ANSI/IEEE Standard 738 with the following input parameters:
Latitude = 30 NWind velocity = 2 feet per secondWind angle = 90° to conductorEmissivity coefficient = 0.5Solar absorption coefficient = 0.5Line elevation = 600 feet AMSLLine orientation = East – WestTime of day = 2 P.M.Atmospheric condition = Clear
Submitted to ERCOT Reliability and Operations Subcommittee for approval MarchAug 1610, 20046 72

Air temperature = 25 CConductor temperature = 75 C
The normal rating is 90100% of the conductor thermal rating. The emergency rating of the conductor is 110% of the conductor thermal rating. No allowance is made for design or operational thermal limits such as conductor sag or for circuit elements other than the transmission line conductor.
Line RatingsThe maximum overall rating of a transmission line is the current capability of the most limiting element in series between its two end points. Unless otherwise limited by equipment ratings installed in the transmission line circuit such as breakers, current transformers, switches, disconnects, wave traps, jumpers, the normal and emergency rating of a transmission line is the conductor normal and emergency ratings.
Transformer RatingsThe normal rating of a transformer is the manufacturer’s highest continuous FA rating at 55C rise.The emergency rating of a transformer is the manufacturer’s highest continuous FA rating at 65C rise.
Submitted to ERCOT Reliability and Operations Subcommittee for approval MarchAug 1610, 20046 73

Bryan Texas Utilities’ Facility Ratings Calculations
Line Constants CalculationsBTU uses PTI’s Line Constants program (LineProp30) to calculate line constants. The program requires conductor sag and tower configuration data, conductor sag data, conductor characteristic data, and the phase location on the structure relative to earth.
The following assumptions are used to make calculations: Earth resistivity is 100 ohm-meters. Frequency is 60 Hz
Conductor names follow the standard convention such as Drake (795ACSR), Arbutus (795AAC), etc., as described in the Aluminum Association’s Electrical Conductor Handbook.
Conductor temperature used for calculating impedance is 25C
The calculation includes: The effect of overhead grounded shield wires, Tower configuration, and The length of line.
Transformer Constants CalculationsBTU uses either the manufacturer’s transformer test report data the manufacturer’s specification sheets or, if neither is available, industry-accepted values based on the transformer’s size and type.
Rating Calculations Line SegmentsThe maximum overall rating of a transmission line is the current capability of the most limiting element in series between its two end points. Unless otherwise limited by equipment ratings installed in the transmission line circuit such as breakers, current transformers, switches, disconnects, wave traps, jumpers, etc. the normal and emergency rating of a transmission line is the conductor normal and emergency ratings.
BTU utilizes the ampacity program SWRATE16, Version 2.05 developed by the Southwire Company for transmission line ratings.
For the equipment at the substation termination, BTU uses the nameplate ratings for equipment such as circuit breakers, switches, jumpers, and wave traps.
Assumptions used for ACSR and AAC conductor’s normal and emergency ratings are: Emergency rating at 100C, Normal rating set at 90% of emergency rating.
Conductor thermal ratings are calculated using the IEEE methodology described in IEEE 738 with the following input parameters into the SWRATE16 software:
Conductor code name (Conductor code names follow the standard convention described under Line Constants Calculations)
40C air temperature. Wind speed of 2 feet/second at a 90 angle relative to the conductor. Latitude of BTU is 30N Elevation is 300 feet above mean sea level. Frequency of operation is 60 Hz. Coefficient of emissivity is 0.5 Coefficient of solar absorption is 0.5
Submitted to ERCOT Reliability and Operations Subcommittee for approval MarchAug 1610, 20046 74

Current transformers and switches can be loaded to the normal rating under normal conditions and to the emergency rating under contingency conditions.
The normal rating of the MLSE is applied under normal conditions, and the emergency rating of the MLSE is applied under contingency conditions.
TransformersBTU’s emergency rating for transformers is 100% of manufacturer’s nameplate FA or FOA rating at 65C rise, at an ambient temperature of 20C. Normal transformer ratings are specified as 90% of the emergency transformer rating.
Submitted to ERCOT Reliability and Operations Subcommittee for approval MarchAug 1610, 20046 75
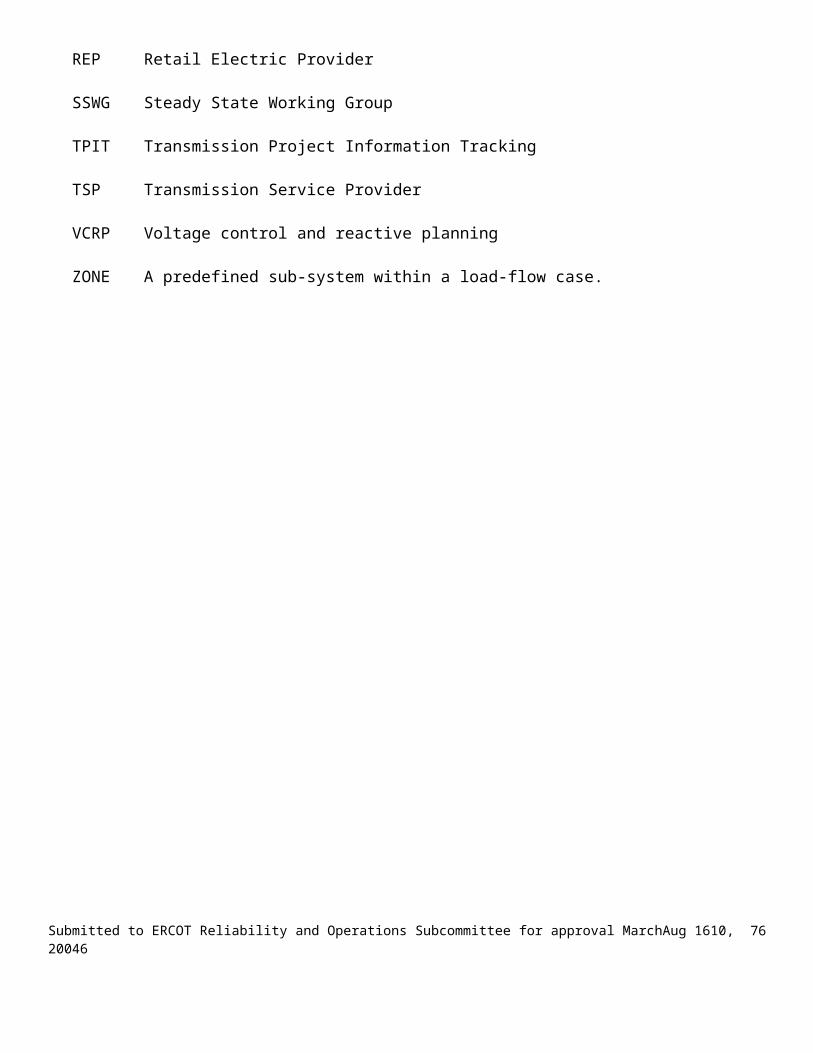
American Electric Power Service Corporation (AEPSC)
Line Constants Calculation
AEPSC uses actual transformer test data in calculating the transformer’s impedance. When actual test data is not available, engineering assumptions and nameplate data are employed to determine the impedance that will be used in modeling the transformers in AEPSC/ERCOT load-flow cases.
American Electric Power Service Corporation (AEPSC)) uses a Transmission Line Constants program (TLC) that was developed by Electric Power Research Institute (EPRI) in 1981 that computes electrical transmission parameters. Inputs to the program are collected from manufacturer’s test reports and data collected from the field and used conjunction with industry-accepted methods to calculate the modeling data required in the AEPSC/ERCOT load-flow cases.
Input Data / Assumptions Nominal Operating Voltages 69kV and above Structure geometry, tower height, including shield wire Conductor length – breaker to breaker Conductor characteristics geometric mean radius, conductor radius, resistance, reactance, etc. Frequency 60 Hz Earth resistivity – Depending on soil type ranges from 1 – 50 ohms-meter Data is obtained from the manufacture or; the Electrical Transmission and Distribution
Reference Book, prepared by Westinghouse Electric Corporation or; EPRI’s Transmission Line Reference Book, 345 kV and Above/ Second Edition
The EPRI program and input data are used to calculate various impedances at 50o C including: Resistance, Reactance, Charging; Sequence Series Impedances; Shunt Admittance; and Mutual Impedances.
American Electric Power Service Corporation Facility Ratings Calculations
In determining the thermal facility ratings of 69 kV and above, AEPSC incorporates Good Utility Practice with actual field data to ensure that the transmission system is in compliance with the ERCOT Reliability Criteria, AEPSC Transmission Planning Reliability Criteria, and North American Reliability Council (NERC).
Transmission Lines Existing transmission lines were designed to meet operating standards that were in effect at the
time the line was built. The National Electric Safety Code (NESC) specified acceptable ground clearances are maintained while allowing for loss of conductor tensile strength. AEP will use thermal ratings that are consistent with the NESC design being practiced at the time the line was built.
Lines are rated in accordance with the AEP’s System Planning Guidelines. The normal and emergency thermal rating for generic pre 1977 lines is based on an operating temperature of 85o
C. The normal rating for generic post 1977 lines is based on a normal operating temperature of 85o C and an emergency operating temperature of 95o C. Lines with documented sag information have an emergency rating based on the maximum operating temperatures a normal rating based on an operating temperature of 95o C.
Other assumptions used in calculating the ratings of AEP transmission lines include:
Submitted to ERCOT Reliability and Operations Subcommittee for approval MarchAug 1610, 20046 76

Wind Speed 2 MPH (2.93 fps)Wind angle to line 60 degreesEmissivity 0.8Absorptivity 0.8Summer Ambient Temperature 40o C Winter Ambient Temperature 20o C
AEP’s transmission lines can operate at the emergency ratings for 1000 hours over the life of the conductor before the loss of strength will cause unacceptable sag conditions. In accordance with this procedure manual, The Emergency Rating represents a 2-hour rating. Operations must take action to reduce the flows below the conductors normal ratings within 2 hours for each occurrence.
Disconnect Switches - Normal and emergency rating shall be 100% of nameplate rating.
Wave Traps - Emergency rating shall be 110% of nameplate rating.
Current Transformers - Normal rating shall be 100% of nameplate rating adjusted for the continuous thermal current rating factor. The Emergency Rating shall be 110% of the Normal rating.
Circuit Breakers - Normal and emergency rating shall be 100% of nameplate rating.
Autotransformers The normal rating for autotransformers shall be its top nameplate rating, including the effects of
forced cooling equipment if it is available. The emergency rating for autotransformers shall be 110% of its top nameplate rating for the first two hours of emergency and 100% thereafter. Alternatively, transformer normal and emergency ratings may be calculated from test data, configuration and past history.
The circuit thermal capabilities should be reduced to the ratings of the “Most Limiting Series Element” (MLSE) as described in the NERC Planning Standards. This includes but is not limited to substation terminal equipment; disconnect switches, wave traps, current transformers, and circuit breakers.
AEPSC uses the above describe assumptions, standards, and good utility practice in determining and applying the facility ratings described in section 1.5.1.4.1 Ratings Definitions for modeling criteria.
Submitted to ERCOT Reliability and Operations Subcommittee for approval MarchAug 1610, 20046 77

Submitted to ERCOT Reliability and Operations Subcommittee for approval MarchAug 1610, 20046 78

Submitted to ERCOT Reliability and Operations Subcommittee for approval MarchAug 1610, 20046 79

Submitted to ERCOT Reliability and Operations Subcommittee for approval MarchAug 1610, 20046 80

RAYBURN COUNTRY ELECTRIC COOPERATIVE, INC.Rockwall, TexasAmpere Rating per Westinghouse T&D ManualOctober 31, 2002 SUMMER BASE
LOADING LEVELSUMMER MAXIMUM PLANNING LEVEL
SUMMER MAXIMUM EMERGENCY (Short Term)
kVA kVA kVA kVA kVA kVADesignation Conductor @ 69kV @ 138kV @ 69kV @ 138kV @ 69kV @ 138kV
110° F Ambient, 167° F Conductor
(43° C/75° C)
110° F Ambient, 202° F Conductor
(43° C/95° C)
110° F Ambient, 212° F Conductor
(43° C/100° C)Single ConductorRAVEN 1/0 ACSR 21,600 43,300 27,500 55,000 28,800 57,600
QUAIL 2/0 ACSR 25,300 50,700 32,300 64,500 33,800 67,600
PIGEON 3/0 ACSR 28,200 56,400 35,900 71,700 37,500 75,100
PENGUIN 4/0 ACSR 32,000 64,100 40,600 81,300 42,500 85,100
LINNET 336 kCM ACSR 49,800 99,700 63,300 126,700 66,300 132,700
IBIS 397 kCM ACSR 55,500 110,900 70,500 141,000 73,900 147,700
HAWK 477 kCM ACSR 63,000 126,000 80,100 160,100 83,900 167,800
DOVE 556 kCM ACSR 68,600 137,200 87,200 174,500 91,400 182,900
GROSBEAK 636 kCM ACSR 73,400 146,800 93,200 186,400 97,600 195,300
DRAKE 795 kCM ACSR 84,600 169,200 107,600 215,100 112,700 225,400
CARDINAL 954 kCM ACSR 95,000 190,000 120,700 241,400 126,400 252,900
PHEASANT 1272 kCM ACSR 112,800 225,600 143,400 286,800 150,200 300,500
Submitted to ERCOT Reliability and Operations Subcommittee for approval MarchAug 1610, 20046 81
RAYBURN COUNTRY ELECTRIC COOPERATIVE, INC.Rockwall, TexasAmpere Rating per Westinghouse T&D ManualOctober 31, 2002
WINTER BASE LOADING LEVEL
WINTER MAXIMUM PLANNING LEVEL
WINTER MAXIMUM EMERGENCY (Short Term)
kVA kVA kVA kVA kVA kVADesignation Conductor @ 69kV @ 138kV @ 69kV @ 138kV @ 69kV @ 138kV
20° F Ambient, 100° F Conductor
(-7° C/ 38° C)
20° F Ambient, 120° F Conductor
(-7° C/ 49° C)
20° F Ambient, 167° F Conductor
(-7° C/ 75° C)Single ConductorRAVEN 1/0 ACSR 27,700 55,500 30,000 60,000 35,900 71,700
QUAIL 2/0 ACSR 32,600 65,300 35,300 70,500 42,100 84,100
PIGEON 3/0 ACSR 36,200 72,400 39,200 78,400 46,700 93,500
PENGUIN 4/0 ACSR 41,000 82,000 44,500 88,900 52,900 105,900
LINNET 336 kCM ACSR 63,900 127,900 69,200 138,400 82,500 164,900
IBIS 397 kCM ACSR 71,200 142,500 77,100 154,200 91,900 183,800
HAWK 477 kCM ACSR 80,800 161,600 87,500 175,000 104,300 208,700
DOVE 556 kCM ACSR 88,100 176,200 95,400 190,700 113,700 227,300
GROSBEAK 636 kCM ACSR 94,100 188,100 101,900 203,900 121,400 242,800
DRAKE 795 kCM ACSR 108,500 217,000 117,600 235,200 140,100 280,100
CARDINAL 954 kCM ACSR 121,800 243,600 131,900 263,900 157,300 314,600
PHEASANT 1272 kCM ACSR
144,700 289,500 156,800 313,600 186,800 373,600
Submitted to ERCOT Reliability and Operations Subcommittee for approval MarchAug 1610, 20046 82

Appendix D Most Limiting Series Element Database Example
Submitted to ERCOT Reliability and Operations Subcommittee for approval MarchAug 1610, 20046 83

Appendix E
Transmission Project and Information Tracking (TPIT)
The TPIT spreadsheet was created to help convey information on future transmission projects to all ERCOT market stakeholders. The main goals of TPIT are below.
Increase Openness of InformationIncrease TransparencyImprove Project TrackingAble to Sort/Search InformationImprove Consistency of BasecasesBetter Work OrganizationIncrease accuracy and project knowledge
TPIT is posted on the controlled access website http://www.ercot.com/tmaps/Login.cfm under the link - Transmission Project & Information Tracking (TPIT)
A sample of the spreadsheet is attached.
Submitted to ERCOT Reliability and Operations Subcommittee for approval MarchAug 1610, 20046 84

Appendix F
Treatment of Mothballed Units in Planning
The treatment described in this paper was developed by a joint workgroup of the Wholesale Market Subcommittee (WMS) and the Reliability and Operations Subcommittee (ROS) at the direction of the Technical Advisory Committee (TAC).
Reserve Margin
The ERCOT-wide reserve margin for assessing generation adequacy will continue to be calculated as recommended by the Generation Adequacy Task Force and approved by TAC in early 2003. However, for the purpose of determining how mothballed units will be treated in the powerflow cases, an alternative reserve margin calculation will be performed. In this alternative calculation, the capacity of mothballed units that have given sufficiently firm indication that they will return to service by a specified year will be included in the reserve calculation for that year and thereafter. However, the capacity of all mothballed units that have not given such indication will not be included in the calculation for any year. From this alternative reserve margin calculation, the year in which the ERCOT reserve margin drops below the target of 12.5% will be determined and will trigger the inclusion of the remaining mothballed units in the powerflow cases.
Powerflow Base Cases
In the first year that has a reserve margin less than 12.5%, based on the alternative reserve margin calculation described above, the mothballed units that have not committed to a specific un-mothballing date will be made available to meet the load requirement that is not able to be met by operational and planned generating units and imports (as included in the Capacity section of the CDR)in the powerflow base cases. However, in order to minimize the effect on transmission plans of the decision to use mothballed units to meet the load requirement, the generation that is needed from mothballed units as a group will be allocated over all the mothballed units on a capacity ratio share basis. If this technique results in some of the mothballed units being dispatched at a level below their minimum load, an economic ranking will be used to remove the least economic units from consideration for that particular case so that the allocation of the load requirement among the remaining mothballed units will result in all of those units being loaded above their minimum loads.
For example, assume that, in some future year, ERCOT has a projected peak demand of 80,000MW and installed capacity of 82,000MW with 3000MW of that installed capacity being units that are mothballed and have not indicated they will return. For this simple example, assume that the mothballed capacity is 20 generating units of equal 150MW size. Ignoring losses, the powerflow case would need to include 1000MW of the 3000MW mothballed capacity in order to match the load. Thus, each of the 20 mothballed units would be set to an output of 50MW in the powerflow case (assuming their minimum load is less than 50MW).
Alternative Dispatch Studies
Submitted to ERCOT Reliability and Operations Subcommittee for approval MarchAug 1610, 20046 85

While this treatment of mothballed units attempts to generally minimize the effect of the assumption that mothballed units will be used to meet the load requirement in the powerflow cases (rather than assumed new generation), the planning process should also consider alternative generation dispatches in instances where this treatment of mothballed units could have a direct effect on transmission plans. Specifically, in instances where having a mothballed unit available would alleviate the need for a transmission project that would be required to meet reliability criteria if the mothballed unit were not to return, the transmission project should not be deferred based on the assumption that the mothballed unit will return to service.
Interconnection Studies
The interconnection screening study should include a “what if” to show the required upgrades if any mothballed units that are electrically-near the new generation interconnection were to return to service. However, if a nearby mothballed unit has not committed to return to service by the date the interconnection study is accomplished, OR if the intended return date is beyond the expected in-service date of the interconnecting unit, then only the upgrades that are necessary to integrate the new unit into the system without the output of the mothballed unit will be recommended. If the mothballed unit does return to service, the market’s congestion management system would be used to ration the transmission capacity between the two units. Any additional upgrades that would be required to allow both the new unit and the mothballed unit to run simultaneously would be considered through the economic planning process once the mothballed unit commits to return.
Submitted to ERCOT Reliability and Operations Subcommittee for approval MarchAug 1610, 20046 86
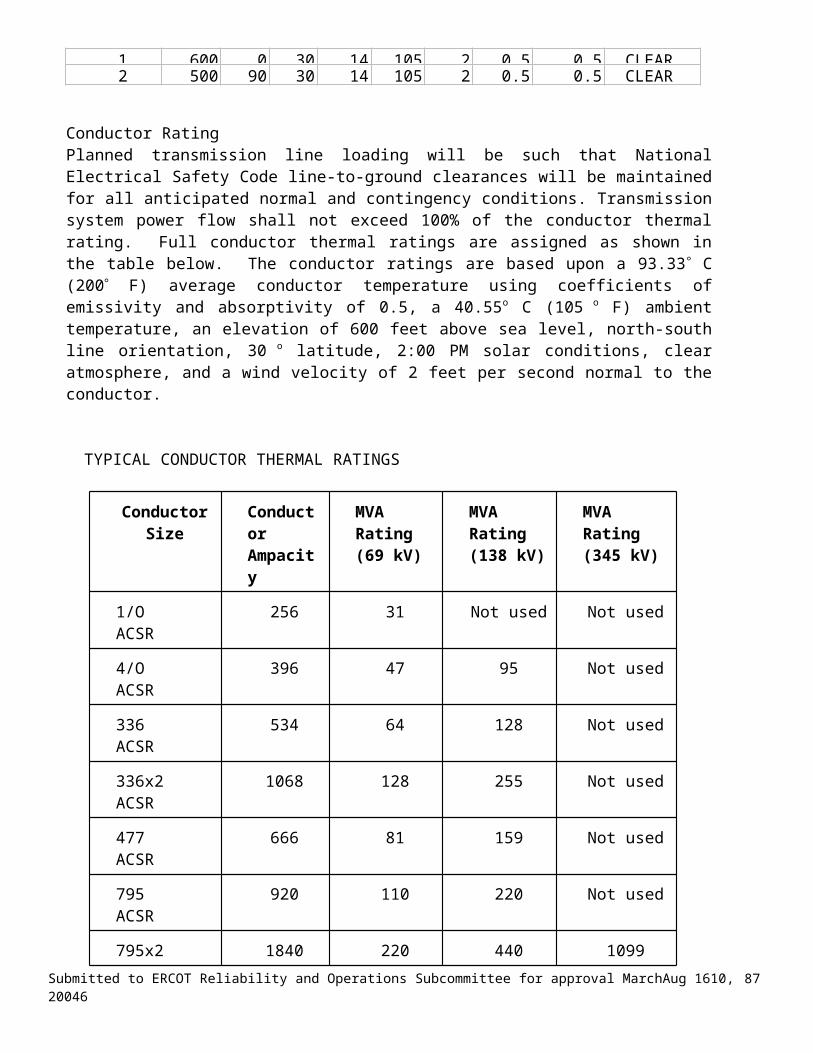
Appendix G
Load Forecasting Methodology
CenterPoint Energy
CenterPoint Energy uses data from multiple sources in order to provide accurate data to SSWG. Data collected from these sources are frequently verified and updated as needed.
Load data
CNP’s load forecast is based on the individual substations’ co-incident peak load with CNP’s peak.
CNP owned distribution substation Transmission Planning receives load data (MW) from Distribution planning for each distribution substation. Based on the assumed power factor of 98% on the low side of the transformer and calculated transformer losses based on the actual transformer nameplate data, Transmission Planning estimates power factor on the high side of the distribution transformer.
Industrial customer owned substation Transmission Planning receives load data (MW and power factor) from Commercial Accounts group for industrial customers. Transmission Planning routinely verifies industrial load data using monthly billing history.
Data update in CAPE
Transmission Planning receives as-built e-mail notification memo from Transmission Projects engineer after the work is completed in the field for each transmission related project. This memo includes description of the work done on the transmission circuit. Transmission Planning enters this information in to CAPE Line Constants database which is utilized to calculate line impedance and rating for the transmission circuit.
Data update in MLSE
Transmission Planning receives as-built e-mail notification from the substation crew leader after the work is completed in the field for each substation related project. Transmission Planning enters this information along with the information from CAPE in to MLSE which is utilized to calculate overall thermal limit for transmission line.
Daily overload notification e-mail used to verify planning base cases
Transmission Planning reviews a previous day’s real-time line overload report daily. This report lists lines and autotransformers with loading at or above 90% of their continuous ratings for the day. Transmission Planning uses this information routinely to verify planning cases.
Updating Planning CasesTransmission Planning engineer provides updated CAPE, MLSE and load data information to SSWG during periodic base case update process. See Attachment A for details.
Submitted to ERCOT Reliability and Operations Subcommittee for approval MarchAug 1610, 20046 87

As built short circuit caseTransmission Planning creates as-built short circuit case twice a year which is based on the up to date CAPE and MLSE. Transmission Planning routinely compares the as-built short circuit case with planning cases to validate the data in planning cases.
Short circuit data verification using fault recorder data
Substation Projects routinely reviews and verifies data from the fault recorder and contacts Transmission Planning if results from the field can not be verified using the applicable software. Transmission Planning and Substation Projects works together to identify the problem and resolves it in a timely manner.
Texas-New Mexico Power Company
TNMP’s forecast loads in the SSWG power flow cases are based on the information provided in the ALDR. The loads at the time of ERCOT’s coincident peak serve as a starting point for each substation within a TNMP business unit. Future load projections for the majority of substations are forecast by escalating at a standard growth rate, typically 1% to 2% depending on general growth expectations of the business unit. Specific unit substations may be escalated at significantly greater rates when factoring in known developments, information from specific customers or if these stations are in areas where rapid growth trends are expected to continue. Occasionally loads at certain substations are shown as decreasing if there are know customer operations that are likely to be discontinued.
The reactive portion of the load is typically based on historical powerfactors as reported in the ALDR. In forecasting, the reactive load may be adjusted for known changes or to incorporate the effect of improvements for maintaining minimum load powerfactor criteria.
CPS Energy
CPS models the load flow cases using CPS system peak load, rather than the ERCOT peak load. This system load forecast comes from the Forecasting & Pricing section. The individual substation peak loads (ALDR) are developed by our Distribution Planning section based on census data, new building permits, etc on very specific parts of CPS area. The peak substation loads are then scaled down such that the total individual substation peak loads add up to the forecasted peak CPS system load. Finally, all substation MVAR loads are then slightly adjusted by scaling so that the case reflects the overall CPS system power factor.
Submitted to ERCOT Reliability and Operations Subcommittee for approval MarchAug 1610, 20046 88

Lower Colorado River Authority
LCRA’s loads in the SSWG load flow cases are based on LCRA system peaks and are derived from the load information provided by its direct connect customers. Each year LCRA’s direct connect customers provide their forecasted noncoincident loads, and LCRA compares these loads against historical actuals to insure consistency with past trends. Applying the previous year’s summer and winter coincident factors to each customer’s summer and winter noncoincident load derives the LCRA summer and winter coincident loads for the SSWG cases. The previous year's summer and winter coincident factors for each load are calculated by dividing each load's value at the time of LCRA’s summer and winter peaks by each loads corresponding noncoincident summer and winter peak values. LCRA’s loads for the spring, fall, and minimum SSWG cases are calculated by multiplying LCRA's coincident summer loads by the previous year's spring/summer, fall/summer, and minimum/summer load ratios.
Austin Energy
The substation area load forecast uses a combination of spatial, load, transmission and distribution planning models together with actual historical data of summer substation peak load to produce a five-year small area load or substation level forecast.
The spatial model is composed of residential, commercial and industrial customer land-use. Thirteen (13) customer classes form the basis of the land-use map that contains highways, water, vacant land, golf courses, restricted areas etc. Within the spatial model are substation locations and boundaries form the basis of the substation area map.The load model is set up using customer profiles, curves or shapes based on hourly energy consumption patterns and multipliers derived from power factors, growth rates, income and employment of each class. Transmission and Distribution Planning model utilizes substation data, voltage levels and equipment, and costs.
The forecasting process starts with the collection of land-use and growth data of especially high growth areas using the company’s site and subdivision development plan database. The models are set up by dividing the entire service area into high-resolution one-acre cells that are used to create substation area base maps. Each cell contains a land-use class that is combined with the customer profiles and multipliers to produce an electric load. A load map is consequently created, and used to ratio out load among the various substations. The process is repeated for each forecast year.
The small area or substation level load forecast is driven the by system load forecast. This means the sum of the summer coincident substation peak loads for each forecast year is calibrated to match exactly the summer system peak load of that particular forecast year.
Submitted to ERCOT Reliability and Operations Subcommittee for approval MarchAug 1610, 20046 89

South Texas Electric Cooperative, Inc.
STEC member cooperatives provide individual substation load data. STEC uses individual substation load data and hourly interval MW and Mvar data to determine the substation power factors for the current year. Member and interval data serves as the basis for individual substation load forecasting. The most recent current year substation power factors are used for future year forecasts. The STEC system demand forecast is obtained from the most recent STEC Electric Power Requirements study. STEC non-coincident peak individual substation load forecast data is scaled to fit the STEC system coincident peak demand forecast from the STEC Power Requirements Study.
TXU ED
TXU Electric DeliveryTXU ED models its loads in the base cases using TXU ED system peak loads that originate from data supplied by our Financial Management Group (FMG). These loads are derived through the four processes outlined below:
1) Service area and U.S. economy forecasts are provided by Global Insight – income, employment, GDP, etc
2) Customers are forecast through a series of fourteen econometric models which are primarily driven by employment in the service area.
3) End-Use models (REEPS, COMMEND, and INFORM) are used to forecast three customer groups; Residential, Commercial and Industrial.
4) Demands are forecast with the Hourly Electric Load Model (HELM) and the MWH sales forecasts from step 3.
FMG provides both the TXU ED system load forecasts and four regional load forecasts which sum to the TXU ED system forecasts.
In addition, the peak load forecasts for TXU ED’s distribution substations are prepared by the Distribution Planning group. A combination of known load additions for projects under development and historical load growth trends are used to produce the substation load forecasts.
The load forecasts for customer-owned substations are obtained from the customer or the customer’s Retail Electric Provider.
All of these substation load forecasts and TXU ED system load forecasts are supplied to ERCOT in the ALDR.
The substation load forecasts from the ALDR along with the system and four regional forecasts are downloaded into a customized in-house program called the Transmission Modeling Information System (TMIS). TMIS also contains historical coincident load factors and distribution design power factors. A Load Manager program inside TMIS then uses all of this data to produce substation loads that sum to the regional load forecasts minus regional transmission losses. The program also calculates transformer reactive losses which are included in the substation reactive load. These new TXU ED diversified substation load values are then modeled in the load flow base cases.
Submitted to ERCOT Reliability and Operations Subcommittee for approval MarchAug 1610, 20046 90

Brownsville Public Utilities Board
BPUB models the load flow cases using the BPUB coincidental system peaks and are derived from results of an econometric load forecast software program. The input data to this program are the historical and present data such as energy, load factor, loss factor, weather, income, earning, and etc. The resulting monthly forecast system peak is then scaled down into each substation using the substation historical peak and the expected growth of each substation. The load is represented on the transmission side and includes transformer losses.
City of Garland
Based on the load growth every year, Garland Power and Light (GPL) has estimated its load increasing at a ratio of around 2% of its total load (not load obligation) for local non-coincident peak load. By using historic document, to obtain and use the non-coincident peak substation loads, we have applied the normal on peak ratios of all substations and scaled the system to the projected local non-coincident peak load above.
City of Denton
DME is at present using a 2.5% projected growth rate for load forecasting and comparing that to a historical curve. The rate is adjusted from time to time to reflect the nature of growth in the area.
Br azos Electric Coop
The load forecasts provided by Brazos Electric in the ERCOT SSWG power flow cases are calculated as follows:
1. In the spring/summer of each year the Brazos Electric member cooperatives and its other wholesale customers provide individual substation load forecasts for the next six years. Provided by each cooperative/customer are the non-coincident summer and winter forecasts for each load.
2. The power factor for each load is calculated from the previous years data. Hourly interval mw and mvar data is available for each of the loads for the previous year. The power factor for each load is that found to occur at the time of each loads non coincident summer or winter peak. This power factor is forecast to remain constant for the forecast period. For new substations the power factor is assumed to be .97 low side.
3. The sum of the individual load forecasts from item 1. plus an estimate for system losses are compared to the corresponding years total Brazos Electric system demand forecast and a ratio is obtained. Each individual load forecast is then multiplied by this ratio so that the sum of the individual loads plus estimated losses will meet the system demand forecast.
Submitted to ERCOT Reliability and Operations Subcommittee for approval MarchAug 1610, 20046 91

4. The system demand forecast is obtained from the Brazos Electric Power Requirements document. This document contains a detailed forecast of the Brazos Electric demand and energy requirements of the next 25 years. This forecast includes allowances for weather and economic variables.
Bryan Texas Utilities
The load forecasts provided by BTU to the ERCOT SSWG power flow cases are determined as follows:
1. In the spring of each year as the ALDR data is gathered, a query is run on BTU’s SCADA database to determine the previous year’s summer and winter ERCOT coincident and noncoincident peak loads for each of BTU’s substations. Since BTU only has archived SCADA data going back for just a few years, data from system logs was used to obtain an additional 8 years of loading. This gives a 10+ year running list of individual substation loadings.
Using this data BTU is able to determine, using Least Squares Regression and some insight into system operations, a scaling factor for each substation’s growth rate is determined. Since different areas of BTU’s service territory grows at different rates, this allows for more accurate load estimation.
2. Also during the ALDR data gathering process, the power factor coincident for each previously mentioned peak for each substation is determined from the previous year’s data. Using these power factors from the substation’s transformer low side, power factor on the high side of the distribution transformer is then estimated. Power factor is assumed to be constant for the study periods. Planned substations’ power factor is assumed to be 0.97 lag on the low side until actual data can be obtained.
3. Adjustments are made for each year to account for anticipated load that will move between substations and/or to account for new, projected loads that will affect substation loading.
American Electric Power Service Corporation (AEPSC)
ERCOT Power flow Case Load Calculation Methodology
1. By March 1 of each year, AEP Economic Forecasting along with Distribution Asset Planning prepares data for the Annual Load Data Request (ALDR) and submits the data to ERCOT. Loads are modeled on the transmission side of the distribution transformer and include transformer losses. Individual substation non-coincident peaks are forecasted from historical metered summer and winter peak loads for the preceding five years data. Load growth at each metering point and time-series methods are used to produce forecasts of individual loads. These individual loads are adjusted to agree with forecasts for larger geographical areas.
2. Forecasts for geographical areas involve detailed analysis of historical data and economic forecasts. Sales data is obtained from the customer information system by revenue town and revenue class. Interval MW data is obtained from SCADA and MV90 recorders via Transmission
Submitted to ERCOT Reliability and Operations Subcommittee for approval MarchAug 1610, 20046 92

Dispatch and Load Research. AEP obtains underlying economic drivers from external subscription sources to national, regional and county economic and demographic forecasts such as population, employment, income and etc. Sales are forecast through the use of revenue class base econometric models. Peaks are forecast through the use of normalized historical load shapes and typical weather for the area. Peak probabilities are derived from a peak normalization model of the interval data.
3. AEP does not have reliable company coincident peak at this time, due to metering issues related to ERCOT’s transition to a single control area, and lack of cooperation from adjoining utilities.
4. ERCOT provides the date and time of the system summer peak, the system winter peak, and system minimum loads for the previous year. AEP obtains the load data for these times along with the peak load at each bus from historical records. The coincidence factor for each bus is calculated by dividing the load coincidental with the system peak by the seasonal peak load at the bus. This provides a percentage (coincidence factor) to calculate the future loads off of the forecasted peak at each bus.
5. AEP Transmission Planning receives the ALDR data from ERCOT the first week of April. Additional data on industrial and self-serve loads is obtained from local area personnel.
6. The ALDR data is analyzed, and suspect bus numbers, power factors, and summer & winter coincidence factors are investigated and corrected. Special attention is given to bus numbers that change from case to case due to voltage conversions.
7. An Access database is used to read in the validated ALDR data for AEP and each of the coops that it serves. Seasonal factors are used to develop case data for seasonal and off-peak cases that aren’t in the ALDR.
8. Loads are adjusted for losses and industrial loads and calibrated to the ERCOT-coincident peak value for each load entity within the AEP transmission system footprint.
Submitted to ERCOT Reliability and Operations Subcommittee for approval MarchAug 1610, 20046 93


![Semantic Sensitive Simultaneous Tensor Factorization · rating prediction accuracy among the existing tensor factorization methods [13]. However, SSTF can not enhance prediction accuracy](https://img.pdfslide.us/doc/110x75/5f1d4c6780c240518420e7f4/semantic-sensitive-simultaneous-tensor-factorization-rating-prediction-accuracy.jpg)