Embed Size (px)
Citation preview

ePlace SolutionsBUSINESS PLAN
Mr. John Jones Phone: 1-800-555-1212
www.sampleplans1.com
Table of ContentsExecutive Summary ........................................................................................ 4
Loan Analysis .................................................................................................... 5
Financial Highlights ......................................................................................... 5
Startup Summary ............................................................................................. 6
Industry at a Glance ......................................................................................... 8
Projected Industry Growth ............................................................................. 9
Key External Drivers .......................................................................................10
Objectives .........................................................................................................10
SWOT Analysis ..................................................................................................11
Marketing ...........................................................................................................11
Management Summary ................................................................................. 12
FInancial Indicators ......................................................................................... 13
Revenue Forecast ............................................................................................14
Break-Even Analysis ....................................................................................... 15
Profit and Loss Statement .............................................................................16
Projected Cash Flow ....................................................................................... 17
Projected Balance Sheet ................................................................................18
Year 1 Personnel Forecast ..............................................................................19
Year 1 Revenue Forecast.................................................................................19
Year 1 Profit & Loss .........................................................................................20
Year 1 Balance Sheet .......................................................................................21
Executive SummaryEPlace Solutions will be an innovative online e-commerce portal offering a variety of products to consumers throughout the globe.
Founded by Mr. John Jones, a seasoned business visionary with an eye towards profit and achievement, the organization is set to
enter the market during 2012. The timing of market entry is nothing less than exceptional as consumers throughout the globe have
begun releasing pent-up spending that was held as a result of the global recession. Online shopping is at an all-time high with new
consumer mindsets calling for them to shop for the types of deals and bargains that will be so much a part of the EPlace Solutions
business model. While the market has a great deal of potential and is filled with incredible opportunities, in order to capitalize on
them, a strong infusion of working capital must be acquired. Working capital will be used in a variety of areas including marketing,
logistics, insurance, management as well as the financing of the day to day operations of a business of this type. The founder projects
needing a working capital sum of 100K for his venture with repayment of this sum coming from profits made through the website.
Marketing for EPlace Solutions will be done primarily through the Internet. The founder will develop a strong online presence that is
user-friendly, easy to navigate and encourages consumers to engage in longer stays that increase the probability of a purchase. In
addition to the home website, plans also call for the organization to develop a strong social media presence using Facebook.com and
Twitter.com; the world’s premier social networks with over 1 billion persons in their combined communities. The social media pages
will be updated on a daily basis with information that will drive the marketing message and allow it to resonate with the members of
the core audience. Long-term plans call for the founder to possibly explore mass media marketing including print, radio and television
but at this time, those mediums simply will not yield an optimal return on investment. For this reason, the founder has decided to
forego them but does reserve the right to revisit them as the needs and resources of the business allow.
Financials for EPlace Solutions are strong and show patterns of consistent growth over the course of the next five years. Overhead
costs are extremely low and do not in any way threaten the projected profit position of the organization in any of the five years that are
outlined in the financials. There are no large salaries involved in the financial mix as the founder does not project to immediately need
to hire a staff of any type as the majority of the functions can be handled alone. All of these factors bode extremely well for EPlace
Solutions as the organization looks to become one of the online commerce’s signature brands and a true market leader.
4
5
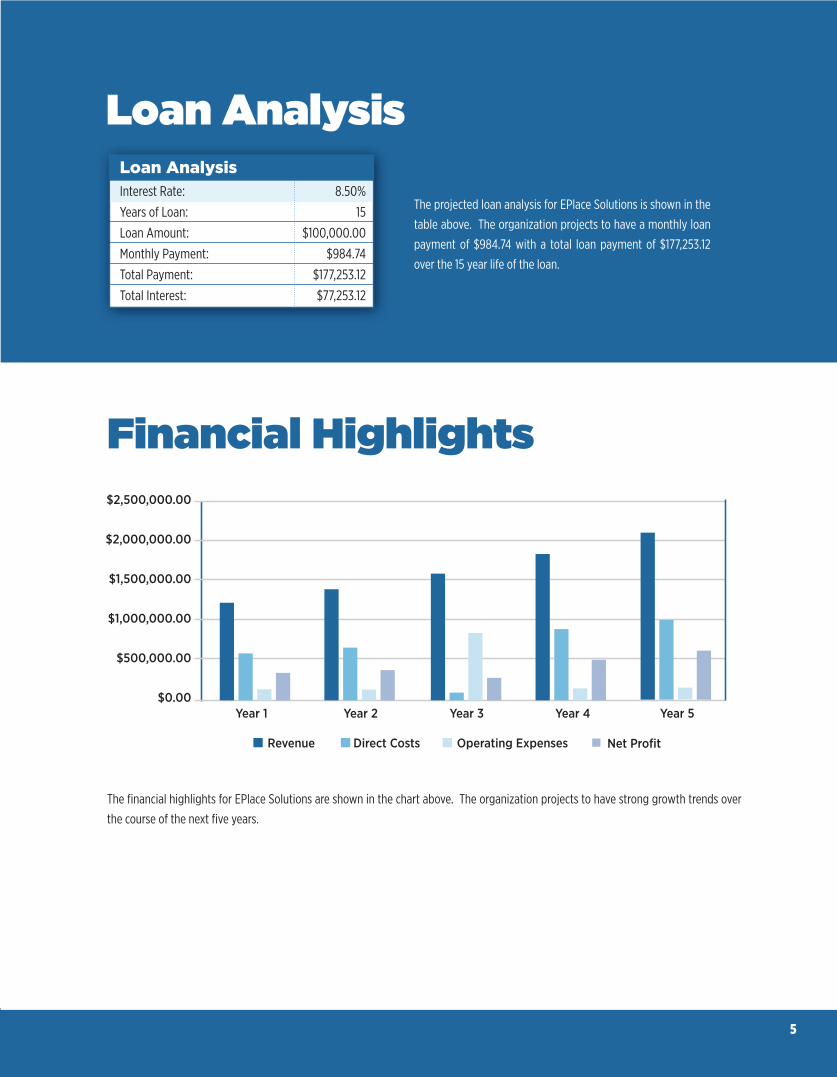
Loan AnalysisInterest Rate: 8.50%
Years of Loan: 15
Loan Amount: $100,000.00
Monthly Payment: $984.74
Total Payment: $177,253.12
Total Interest: $77,253.12
Loan Analysis
The projected loan analysis for EPlace Solutions is shown in the
table above. The organization projects to have a monthly loan
payment of $984.74 with a total loan payment of $177,253.12
over the 15 year life of the loan.
Financial Highlights
The fi nancial highlights for EPlace Solutions are shown in the chart above. The organization projects to have strong growth trends over
the course of the next fi ve years.
Direct CostsRevenue Operating Expenses Net Profi t
$2,500,000.00
$2,000,000.00
$1,500,000.00
$1,000,000.00
$500,000.00
$0.00 Year 1 Year 2 Year 3 Year 4 Year 5
5
Startup Summary
5
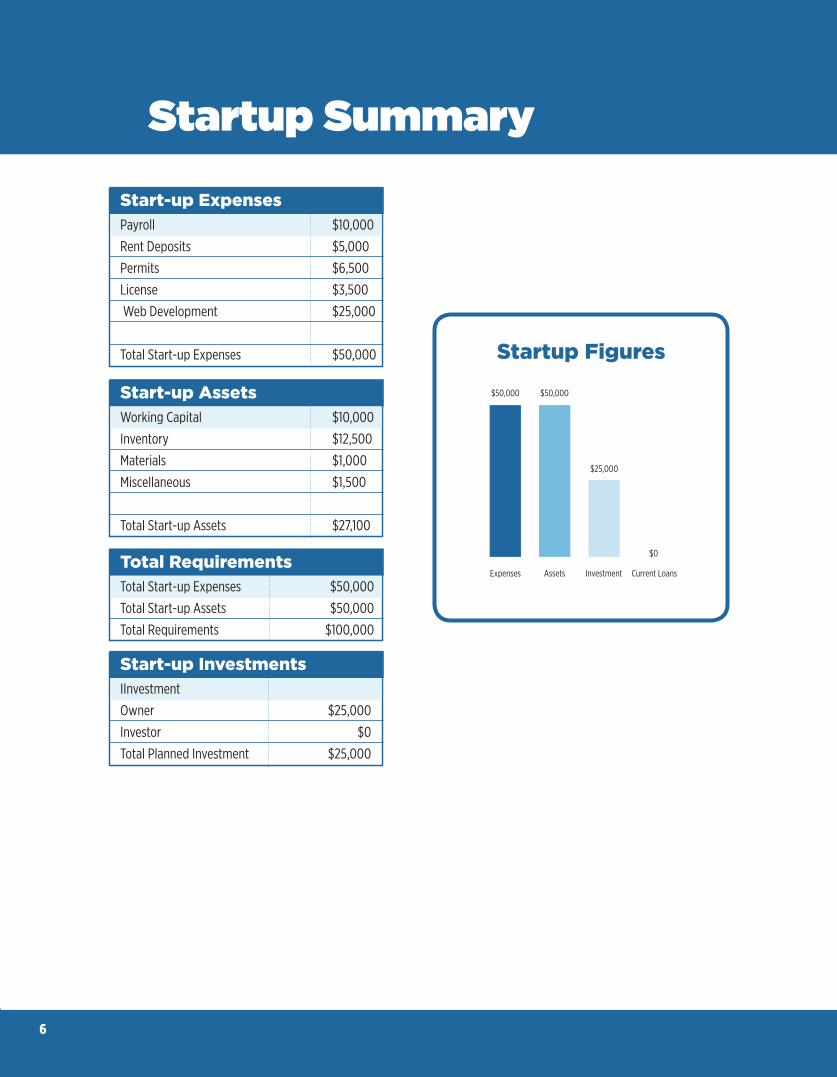
Working Capital $10,000
Inventory $12,500
Materials $1,000
Miscellaneous $1,500
Total Start-up Assets $27,100
Start-up Assets
Total Start-up Expenses $50,000
Total Start-up Assets $50,000
Total Requirements $100,000
Total Requirements
IInvestment
Owner $25,000
Investor $0
Total Planned Investment $25,000
Start-up Investments
Payroll $10,000
Rent Deposits $5,000
Permits $6,500
License $3,500
Web Development $25,000
Total Start-up Expenses $50,000
Start-up Expenses
Startup Figures
Expenses Assets Investment Current Loans
$50,000 $50,000
$25,000
$0
6
Mission StatementThe mission of EPlace Solutions is to provide a reliable online marketplace for consumers that offer quality products at a reasonable
price that drives profits for the parent company while adding value to our brand constituents.
Company OwnershipJohn Jones is the sole owner of EPlace Solutions. There are no other parties with the ability to claim an ownership stake in this
venture. It should however be noted that Mr. Jones is currently soliciting offers from investors or investment groups that share in his
long-term vision for profit and success.
Business LocationEPlace Solutions will be located in San Diego, California with the ability to serve clients throughout the globe. Long-term plans are
for this to remain the base of operations due to the familiarity of the founder with the area and the reach that the Internet provides.
Products and ServicesEPlace Solutions will offer a security online marketplace for consumers looking to transact purchases for reduced cost items. The
organization will have a drop shipping approach which will greatly enhance the appeal and lower the overall overhead costs that are
incurred.
About the FounderMr. John Jones is the founder of EPlace Solutions. Mr. Jones is a seasoned business professional with the ability to develop strategies
that yield optimal financial results. His background in architecture will be invaluable as he looks to meticulously create a business
model and approach that allow EPlace Solutions to become recognized as a true market leader.
7
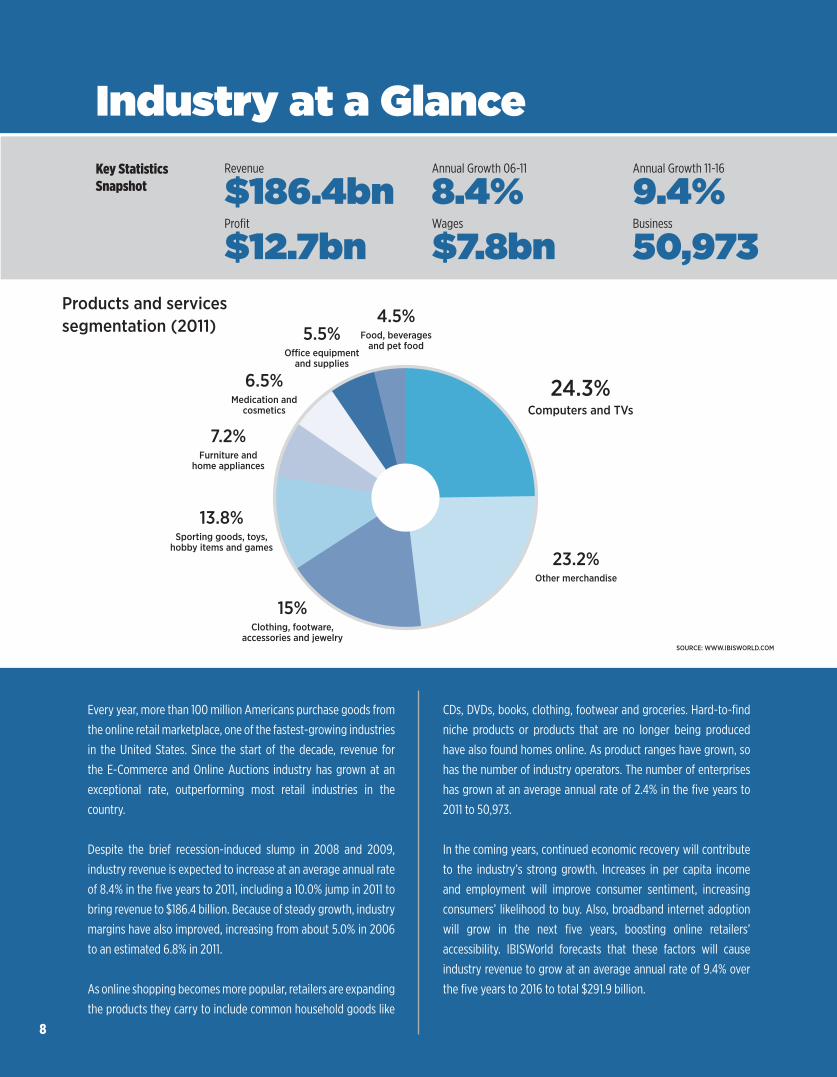
Industry at a GlanceKey StatisticsSnapshot
Revenue Annual Growth 06-11 Annual Growth 11-16
$186.4bn 8.4% 9.4%Profit Wages Business
$12.7bn $7.8bn 50,973
8
Products and services segmentation (2011)
SOURCE: WWW.IBISWORLD.COM
Every year, more than 100 million Americans purchase goods from
the online retail marketplace, one of the fastest-growing industries
in the United States. Since the start of the decade, revenue for
the E-Commerce and Online Auctions industry has grown at an
exceptional rate, outperforming most retail industries in the
country.
Despite the brief recession-induced slump in 2008 and 2009,
industry revenue is expected to increase at an average annual rate
of 8.4% in the five years to 2011, including a 10.0% jump in 2011 to
bring revenue to $186.4 billion. Because of steady growth, industry
margins have also improved, increasing from about 5.0% in 2006
to an estimated 6.8% in 2011.
As online shopping becomes more popular, retailers are expanding
the products they carry to include common household goods like
CDs, DVDs, books, clothing, footwear and groceries. Hard-to-find
niche products or products that are no longer being produced
have also found homes online. As product ranges have grown, so
has the number of industry operators. The number of enterprises
has grown at an average annual rate of 2.4% in the five years to
2011 to 50,973.
In the coming years, continued economic recovery will contribute
to the industry’s strong growth. Increases in per capita income
and employment will improve consumer sentiment, increasing
consumers’ likelihood to buy. Also, broadband internet adoption
will grow in the next five years, boosting online retailers’
accessibility. IBISWorld forecasts that these factors will cause
industry revenue to grow at an average annual rate of 9.4% over
the five years to 2016 to total $291.9 billion.
4.5%Food, beverages
and pet food5.5%
Office equipmentand supplies
6.5%Medication and
cosmetics
7.2%Furniture and
home appliances
13.8%Sporting goods, toys,
hobby items and games
15%Clothing, footware,
accessories and jewelry
23.2%Other merchandise
24.3%Computers and TVs

In the 10 years to 2016, industry value added, which measures the E-Commerce and Online Auctions industry’s contribution to the US economy,
is expected to increase by an average annual rate of 11.0%, while US GDP is forecast to rise by an average annual rate of 2.0% over this same
period. This indicates that the industry is in growth phase of its life cycle, as its growth rate outpaces GDP over a 10-year period. Rising industry
participation and new forms of businesses also indicate a growing industry.
Over the five years to 2011, the number of online retailers and auction sites has increased at an average annual rate of 2.4% to 50,973
businesses. This growth in industry participation can be attributed to an increase in e-commerce demand, mainly driven by the rising
prevalence of broadband connections and other high-speed internet services. Such services have allowed more consumers to surf the net
and buy products without experiencing any lag time; consequently, more consumers have been able to make purchases online with added
convenience. Furthermore, the industry’s low barriers to entry and skill requirements has allowed for companies to enter the industry without
much difficulties, leading to higher participation. In the five years to 2016, the number of operators is expected to further rise with higher
demand for e-commerce websites. Total number of players is forecast to increase by 2.4% annually to total 57,428 businesses.
In recent years, a relatively new form of e-commerce known as social commerce has emerged within the industry. Unlike traditional e-tailers,
social commerce involves using social media, online media that encourages online interaction and user contribution, to assist in the online
buying and selling of goods. This subset of e-commerce retailers has gained wide acceptance to consumers in the five years to 2011, by
providing engaging content and discounted (or wholesale) prices through user interaction (i.e. sharing information and purchasing as groups).
IBISWorld expects more form of social media or new e-commerce businesses to arise in the next five years to 2016, further contributing to the
growth stage designation of the industry.
Projected Industry Growth
9
10
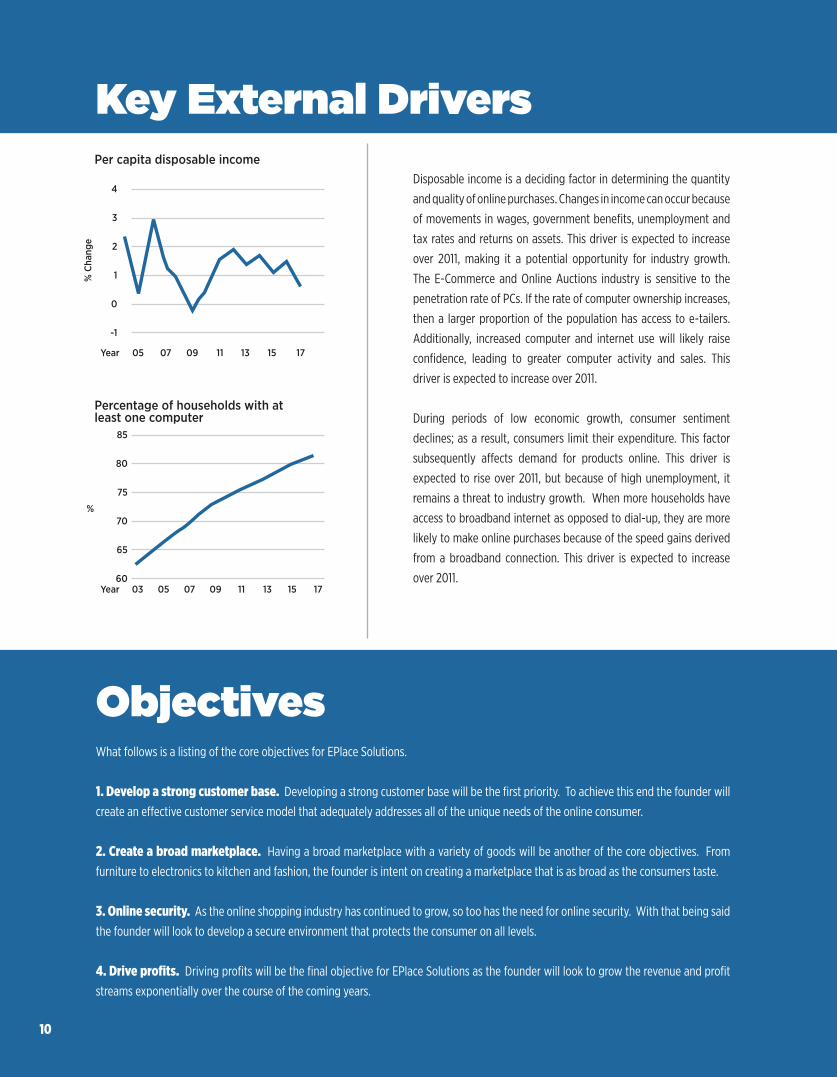
Key External Drivers
ObjectivesWhat follows is a listing of the core objectives for EPlace Solutions.
1. Develop a strong customer base. Developing a strong customer base will be the first priority. To achieve this end the founder will
create an effective customer service model that adequately addresses all of the unique needs of the online consumer.
2. Create a broad marketplace. Having a broad marketplace with a variety of goods will be another of the core objectives. From
furniture to electronics to kitchen and fashion, the founder is intent on creating a marketplace that is as broad as the consumers taste.
3. Online security. As the online shopping industry has continued to grow, so too has the need for online security. With that being said
the founder will look to develop a secure environment that protects the consumer on all levels.
4. Drive profits. Driving profits will be the final objective for EPlace Solutions as the founder will look to grow the revenue and profit
streams exponentially over the course of the coming years.
Disposable income is a deciding factor in determining the quantity
and quality of online purchases. Changes in income can occur because
of movements in wages, government benefits, unemployment and
tax rates and returns on assets. This driver is expected to increase
over 2011, making it a potential opportunity for industry growth.
The E-Commerce and Online Auctions industry is sensitive to the
penetration rate of PCs. If the rate of computer ownership increases,
then a larger proportion of the population has access to e-tailers.
Additionally, increased computer and internet use will likely raise
confidence, leading to greater computer activity and sales. This
driver is expected to increase over 2011.
During periods of low economic growth, consumer sentiment
declines; as a result, consumers limit their expenditure. This factor
subsequently affects demand for products online. This driver is
expected to rise over 2011, but because of high unemployment, it
remains a threat to industry growth. When more households have
access to broadband internet as opposed to dial-up, they are more
likely to make online purchases because of the speed gains derived
from a broadband connection. This driver is expected to increase
over 2011.
4
3
2
1
0
-1
% C
hang
e
Per capita disposable income
Year 05 07 09 11 13 15 17
85
80
75
70
65
60
%
Percentage of households with at least one computer
Year 03 05 07 09 11 13 15 17
Strengths
1. Knowledge of the founder. EPlace Solutions founder Mr.
John Jones is a seasoned business professional who is well
attuned to the e-commerce and Internet driven marketplace. His
broad skill set will be invaluable during all phases of business
growth and evolution.
2. Low overhead costs. EPlace Solutions will have extremely
low overhead costs due to the fact that the business will not carry
inventory or need office space to operate effectively.
3. Growth of the industry. The growth of the industry is
another of the core strengths of the EPlace Solutions business
model. With more and more shopping traffic going online, the
long-term prospects for EPlace Solutions are nothing less than
promising.
Weaknesses
1. Lack of funding. Lack of funding is the primary weakness for
EPlace Solutions as all of the other components of the business
model and approach are extremely sound.
Opportunities
1. Increase in online activity among minorities. Minorities
are beginning to turn to the Internet for their shopping needs in
large quantities. Research conducted via IBISworld.com shows
that appealing to this segment of the market will be one of the
keys to success for companies like EPlace Solutions that are
looking for long-term sustainability.
Threats
1. Larger competitors. Larger competitors such as Ebay.
com and Amazon.com pose a threat as they are already firmly
entrenched in the marketplace and have acquired a large share of
the online shopping market.
SWOT AnalysisWhat follows is an analysis of the core strengths and weaknesses of the EPlace Solutions business model as well as the opportunities and
threats that currently exist within the marketplace.
9
MarketingEPlace Solutions will rely primarily on the Internet to drive the marketing efforts. Planned marketing efforts include the creation of a user
friendly website developed using all of the latest in design and online technologies. The website will also feature SEO (Search Engine
Optimization) which will allow it to rank higher with popular search engines including Yahoo.com and Google.com among others. Social
networking using Facebook.com and Twitter.com will round out the EPlace Solutions marketing model and approach with each being used
extensively throughout the course of each calendar year.
11
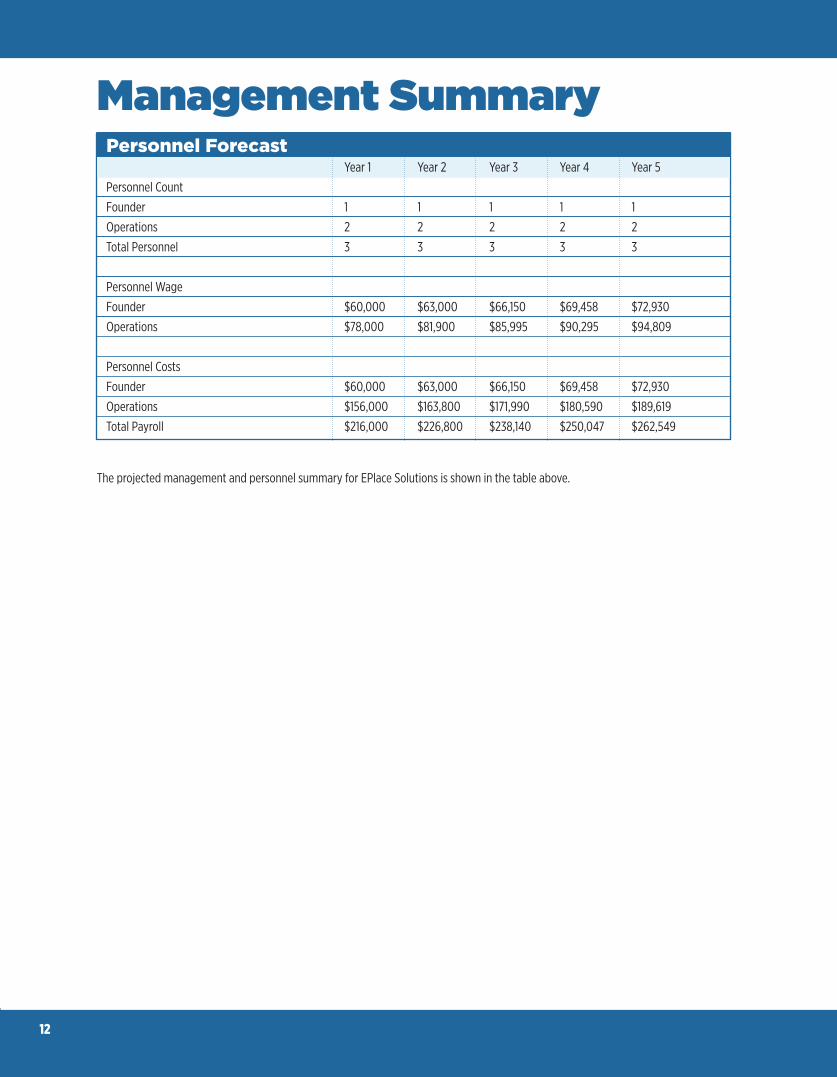
Management Summary
The projected management and personnel summary for EPlace Solutions is shown in the table above.
1111
Personnel Forecast Year 1 Year 2 Year 3 Year 4 Year 5
Personnel Count
Founder 1 1 1 1 1
Operations 2 2 2 2 2
Total Personnel 3 3 3 3 3
Personnel Wage
Founder $60,000 $63,000 $66,150 $69,458 $72,930
Operations $78,000 $81,900 $85,995 $90,295 $94,809
Personnel Costs
Founder $60,000 $63,000 $66,150 $69,458 $72,930
Operations $156,000 $163,800 $171,990 $180,590 $189,619
Total Payroll $216,000 $226,800 $238,140 $250,047 $262,549
Personnel Forecast
12
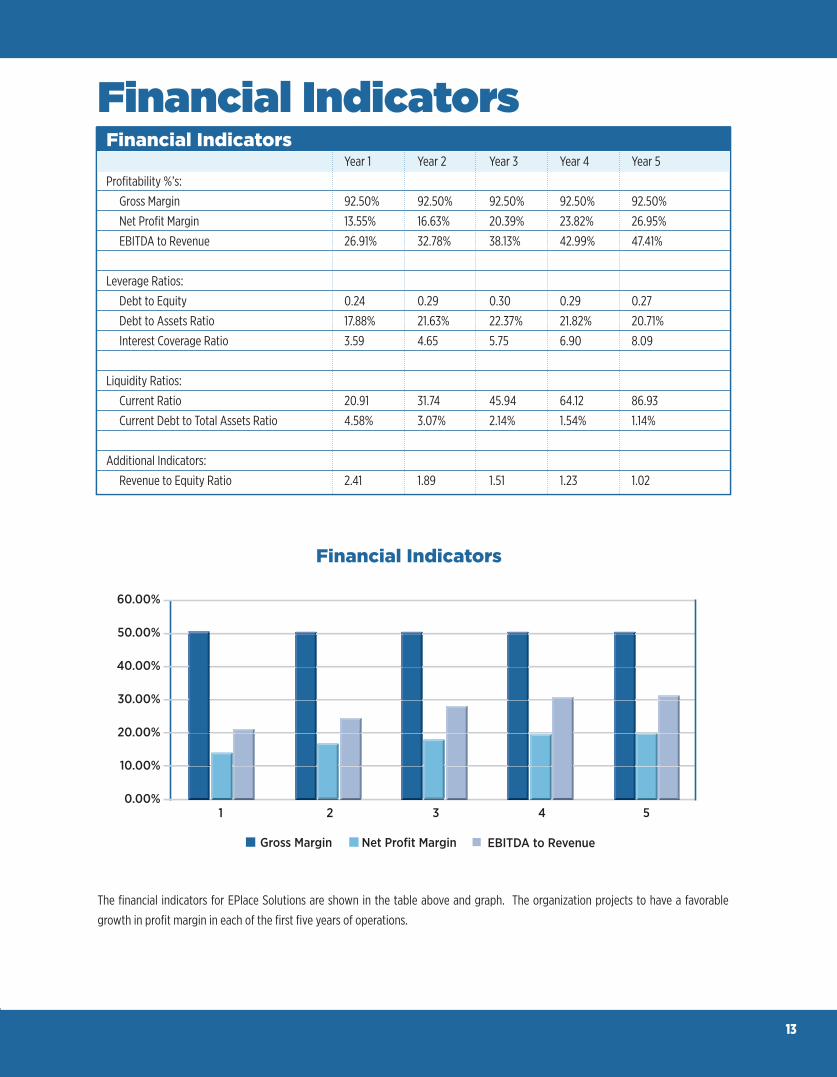
Financial Indicators
The fi nancial indicators for EPlace Solutions are shown in the table above and graph. The organization projects to have a favorable
growth in profi t margin in each of the fi rst fi ve years of operations.
Year 1 Year 2 Year 3 Year 4 Year 5
Personnel Count
Joseph Serrone 1 1 1 1 1
Brandon Bueno 1 1 1 1 1
Vickie Bueno-Serrone 1 1 1 1 1
Total Personnel 3 3 3 3 3
Personnel Wage
Joseph Serrone $11,196 $11,756 $12,344 $12,961 $13,609
Brandon Bueno $11,196 $11,756 $12,344 $12,961 $13,609
Vickie Bueno-Serrone $11,196 $11,756 $12,344 $12,961 $13,609
Personnel Costs
Joseph Serrone $11,196 $11,756 $12,344 $12,961 $13,609
Brandon Bueno $11,196 $11,756 $12,344 $12,961 $13,609
Vickie Bueno-Serrone $11,196 $11,756 $12,344 $12,961 $13,609
Total Payroll $33,588 $35,267 $37,031 $38,882 $40,826
Personnel Forecast Year 1 Year 2 Year 3 Year 4 Year 5
Profi tability %’s:
Gross Margin 92.50% 92.50% 92.50% 92.50% 92.50%
Net Profi t Margin 13.55% 16.63% 20.39% 23.82% 26.95%
EBITDA to Revenue 26.91% 32.78% 38.13% 42.99% 47.41%
Leverage Ratios:
Debt to Equity 0.24 0.29 0.30 0.29 0.27
Debt to Assets Ratio 17.88% 21.63% 22.37% 21.82% 20.71%
Interest Coverage Ratio 3.59 4.65 5.75 6.90 8.09
Liquidity Ratios:
Current Ratio 20.91 31.74 45.94 64.12 86.93
Current Debt to Total Assets Ratio 4.58% 3.07% 2.14% 1.54% 1.14%
Additional Indicators:
Revenue to Equity Ratio 2.41 1.89 1.51 1.23 1.02
Financial Indicators
Net Profi t MarginGross Margin EBITDA to Revenue
60.00%
50.00%
40.00%
30.00%
20.00%
10.00%
0.00% 1 2 3 4 5
Financial Indicators
13
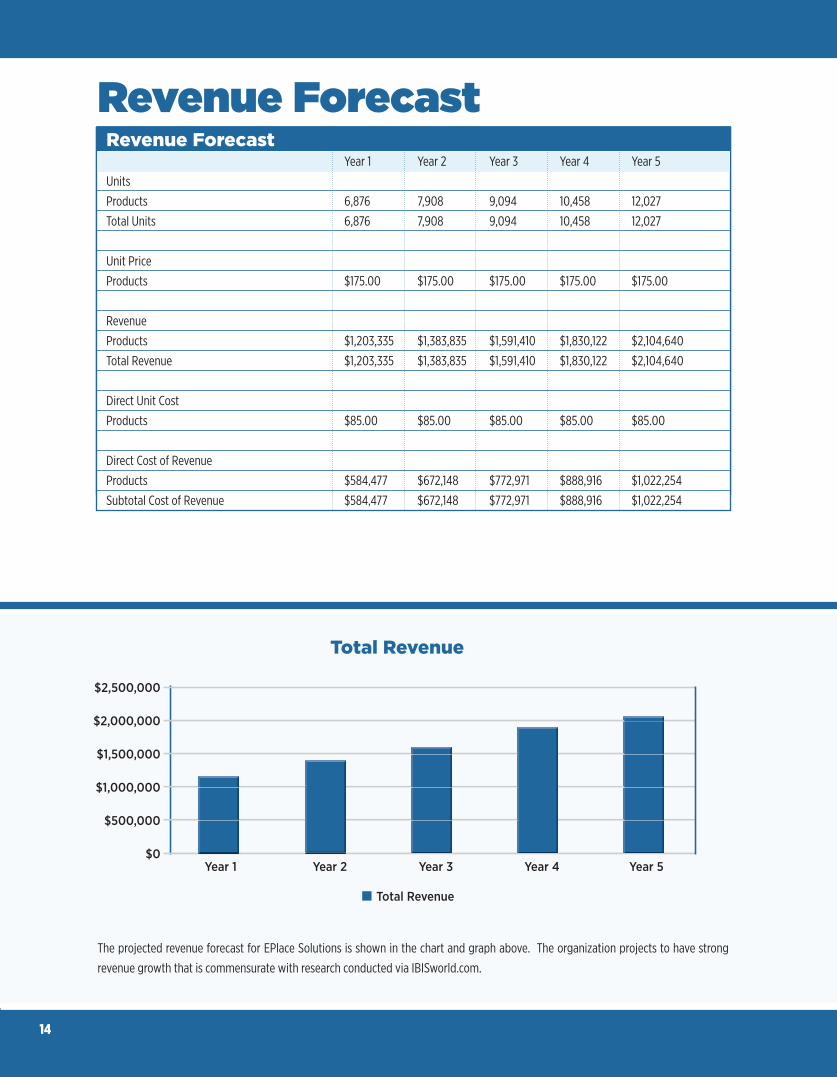
Revenue Forecast
The projected revenue forecast for EPlace Solutions is shown in the chart and graph above. The organization projects to have strong
revenue growth that is commensurate with research conducted via IBISworld.com.
Year 1 Year 2 Year 3 Year 4 Year 5
Personnel Count
Joseph Serrone 1 1 1 1 1
Brandon Bueno 1 1 1 1 1
Vickie Bueno-Serrone 1 1 1 1 1
Total Personnel 3 3 3 3 3
Personnel Wage
Joseph Serrone $11,196 $11,756 $12,344 $12,961 $13,609
Brandon Bueno $11,196 $11,756 $12,344 $12,961 $13,609
Vickie Bueno-Serrone $11,196 $11,756 $12,344 $12,961 $13,609
Personnel Costs
Joseph Serrone $11,196 $11,756 $12,344 $12,961 $13,609
Brandon Bueno $11,196 $11,756 $12,344 $12,961 $13,609
Vickie Bueno-Serrone $11,196 $11,756 $12,344 $12,961 $13,609
Total Payroll $33,588 $35,267 $37,031 $38,882 $40,826
Personnel Forecast Year 1 Year 2 Year 3 Year 4 Year 5
Units
Products 6,876 7,908 9,094 10,458 12,027
Total Units 6,876 7,908 9,094 10,458 12,027
Unit Price
Products $175.00 $175.00 $175.00 $175.00 $175.00
Revenue
Products $1,203,335 $1,383,835 $1,591,410 $1,830,122 $2,104,640
Total Revenue $1,203,335 $1,383,835 $1,591,410 $1,830,122 $2,104,640
Direct Unit Cost
Products $85.00 $85.00 $85.00 $85.00 $85.00
Direct Cost of Revenue
Products $584,477 $672,148 $772,971 $888,916 $1,022,254
Subtotal Cost of Revenue $584,477 $672,148 $772,971 $888,916 $1,022,254
Revenue Forecast
Total Revenue
$2,500,000
$2,000,000
$1,500,000
$1,000,000
$500,000
$0 Year 1 Year 2 Year 3 Year 4 Year 5
Total Revenue
14
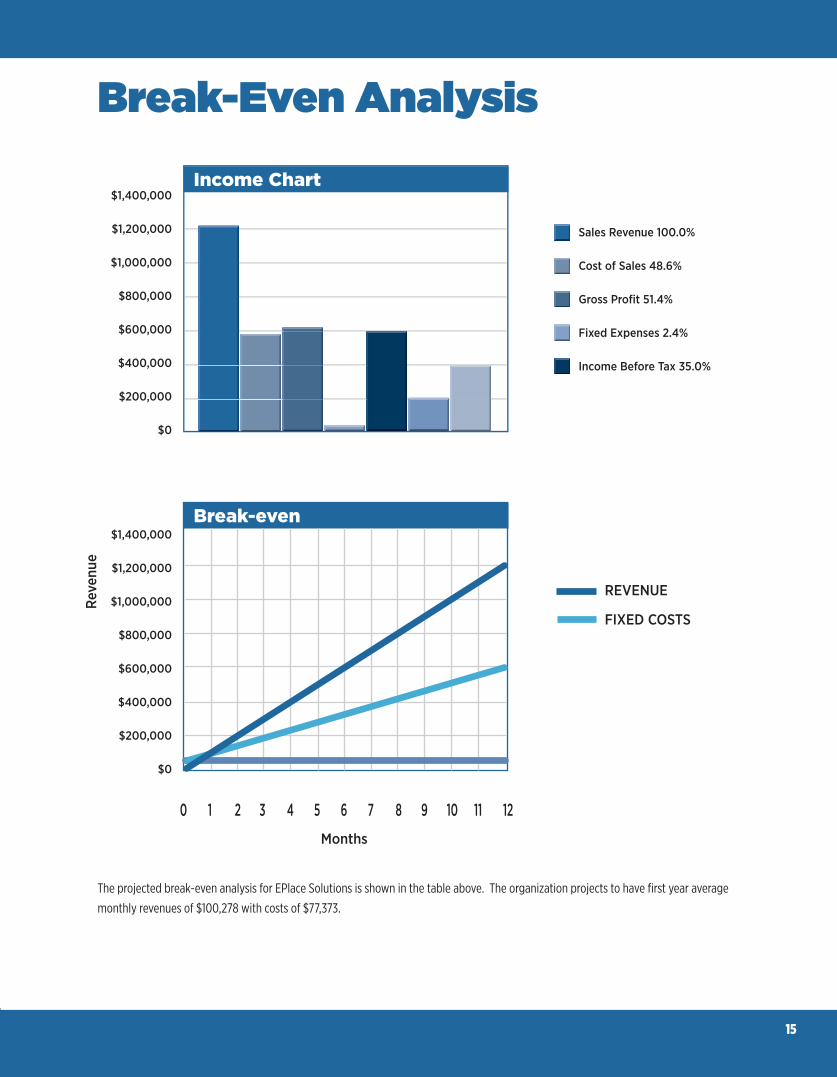
Break-Even Analysis
The projected break-even analysis for EPlace Solutions is shown in the table above. The organization projects to have fi rst year average
monthly revenues of $100,278 with costs of $77,373.
Reve
nue
Months
REVENUE
FIXED COSTS
$1,400,000
$1,200,000
$1,000,000
$800,000
$600,000
$400,000
$200,000
$0
0 1 2 3 4 5 6 7 8 9 10 11 12
Break-even
Income Chart$1,400,000
$1,200,000
$1,000,000
$800,000
$600,000
$400,000
$200,000
$0
Sales Revenue 100.0%
Cost of Sales 48.6%
Gross Profi t 51.4%
Fixed Expenses 2.4%
Income Before Tax 35.0%
15
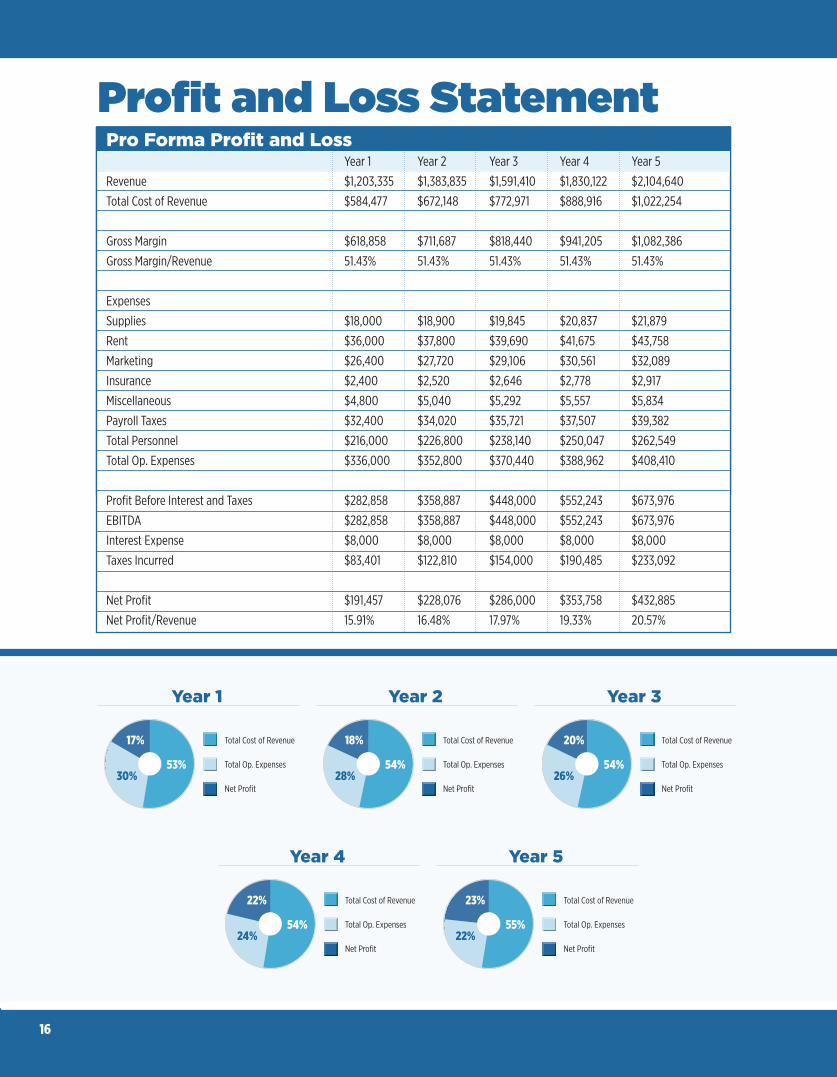
Profi t and Loss Statement Year 1 Year 2 Year 3 Year 4 Year 5
Personnel Count
Joseph Serrone 1 1 1 1 1
Brandon Bueno 1 1 1 1 1
Vickie Bueno-Serrone 1 1 1 1 1
Total Personnel 3 3 3 3 3
Personnel Wage
Joseph Serrone $11,196 $11,756 $12,344 $12,961 $13,609
Brandon Bueno $11,196 $11,756 $12,344 $12,961 $13,609
Vickie Bueno-Serrone $11,196 $11,756 $12,344 $12,961 $13,609
Personnel Costs
Joseph Serrone $11,196 $11,756 $12,344 $12,961 $13,609
Brandon Bueno $11,196 $11,756 $12,344 $12,961 $13,609
Vickie Bueno-Serrone $11,196 $11,756 $12,344 $12,961 $13,609
Total Payroll $33,588 $35,267 $37,031 $38,882 $40,826
Personnel Forecast Year 1 Year 2 Year 3 Year 4 Year 5
Revenue $1,203,335 $1,383,835 $1,591,410 $1,830,122 $2,104,640
Total Cost of Revenue $584,477 $672,148 $772,971 $888,916 $1,022,254
Gross Margin $618,858 $711,687 $818,440 $941,205 $1,082,386
Gross Margin/Revenue 51.43% 51.43% 51.43% 51.43% 51.43%
Expenses
Supplies $18,000 $18,900 $19,845 $20,837 $21,879
Rent $36,000 $37,800 $39,690 $41,675 $43,758
Marketing $26,400 $27,720 $29,106 $30,561 $32,089
Insurance $2,400 $2,520 $2,646 $2,778 $2,917
Miscellaneous $4,800 $5,040 $5,292 $5,557 $5,834
Payroll Taxes $32,400 $34,020 $35,721 $37,507 $39,382
Total Personnel $216,000 $226,800 $238,140 $250,047 $262,549
Total Op. Expenses $336,000 $352,800 $370,440 $388,962 $408,410
Profi t Before Interest and Taxes $282,858 $358,887 $448,000 $552,243 $673,976
EBITDA $282,858 $358,887 $448,000 $552,243 $673,976
Interest Expense $8,000 $8,000 $8,000 $8,000 $8,000
Taxes Incurred $83,401 $122,810 $154,000 $190,485 $233,092
Net Profi t $191,457 $228,076 $286,000 $353,758 $432,885
Net Profi t/Revenue 15.91% 16.48% 17.97% 19.33% 20.57%
Pro Forma Profi t and Loss
Year 1
17%
53%30%
Total Cost of Revenue
Total Op. Expenses
Net Profi t
Year 4
22%
54%24%
Total Cost of Revenue
Total Op. Expenses
Net Profi t
Year 2
18%
54%28%
Total Cost of Revenue
Total Op. Expenses
Net Profi t
Year 5
23%
55%22%
Total Cost of Revenue
Total Op. Expenses
Net Profi t
Year 3
20%
54%26%
Total Cost of Revenue
Total Op. Expenses
Net Profi t
16
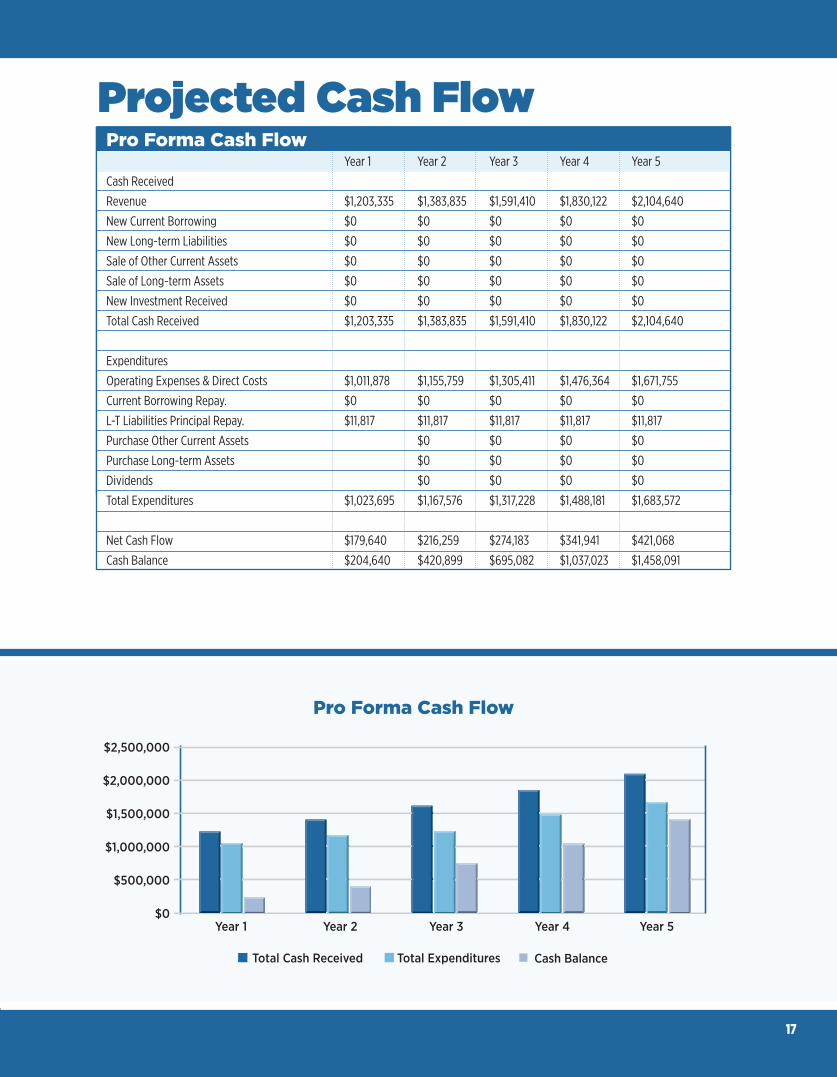
Projected Cash Flow Year 1 Year 2 Year 3 Year 4 Year 5
Personnel Count
Joseph Serrone 1 1 1 1 1
Brandon Bueno 1 1 1 1 1
Vickie Bueno-Serrone 1 1 1 1 1
Total Personnel 3 3 3 3 3
Personnel Wage
Joseph Serrone $11,196 $11,756 $12,344 $12,961 $13,609
Brandon Bueno $11,196 $11,756 $12,344 $12,961 $13,609
Vickie Bueno-Serrone $11,196 $11,756 $12,344 $12,961 $13,609
Personnel Costs
Joseph Serrone $11,196 $11,756 $12,344 $12,961 $13,609
Brandon Bueno $11,196 $11,756 $12,344 $12,961 $13,609
Vickie Bueno-Serrone $11,196 $11,756 $12,344 $12,961 $13,609
Total Payroll $33,588 $35,267 $37,031 $38,882 $40,826
Personnel Forecast Year 1 Year 2 Year 3 Year 4 Year 5
Cash Received
Revenue $1,203,335 $1,383,835 $1,591,410 $1,830,122 $2,104,640
New Current Borrowing $0 $0 $0 $0 $0
New Long-term Liabilities $0 $0 $0 $0 $0
Sale of Other Current Assets $0 $0 $0 $0 $0
Sale of Long-term Assets $0 $0 $0 $0 $0
New Investment Received $0 $0 $0 $0 $0
Total Cash Received $1,203,335 $1,383,835 $1,591,410 $1,830,122 $2,104,640
Expenditures
Operating Expenses & Direct Costs $1,011,878 $1,155,759 $1,305,411 $1,476,364 $1,671,755
Current Borrowing Repay. $0 $0 $0 $0 $0
L-T Liabilities Principal Repay. $11,817 $11,817 $11,817 $11,817 $11,817
Purchase Other Current Assets $0 $0 $0 $0
Purchase Long-term Assets $0 $0 $0 $0
Dividends $0 $0 $0 $0
Total Expenditures $1,023,695 $1,167,576 $1,317,228 $1,488,181 $1,683,572
Net Cash Flow $179,640 $216,259 $274,183 $341,941 $421,068
Cash Balance $204,640 $420,899 $695,082 $1,037,023 $1,458,091
Pro Forma Cash Flow
Total ExpendituresTotal Cash Received Cash Balance
$2,500,000
$2,000,000
$1,500,000
$1,000,000
$500,000
$0 Year 1 Year 2 Year 3 Year 4 Year 5
Pro Forma Cash Flow
17
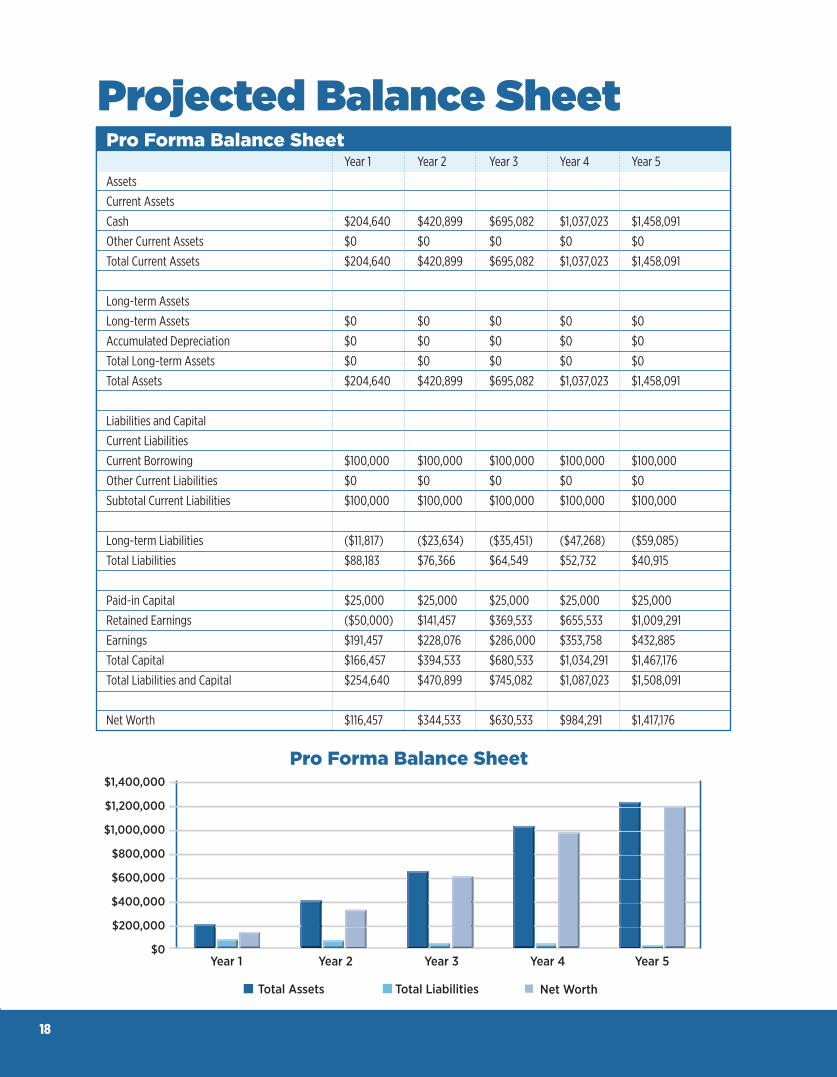
Projected Balance Sheet
Total LiabilitiesTotal Assets Net Worth
$1,400,000
$1,200,000
$1,000,000
$800,000
$600,000
$400,000
$200,000
$0 Year 1 Year 2 Year 3 Year 4 Year 5
Pro Forma Balance Sheet
Year 1 Year 2 Year 3 Year 4 Year 5
Personnel Count
Joseph Serrone 1 1 1 1 1
Brandon Bueno 1 1 1 1 1
Vickie Bueno-Serrone 1 1 1 1 1
Total Personnel 3 3 3 3 3
Personnel Wage
Joseph Serrone $11,196 $11,756 $12,344 $12,961 $13,609
Brandon Bueno $11,196 $11,756 $12,344 $12,961 $13,609
Vickie Bueno-Serrone $11,196 $11,756 $12,344 $12,961 $13,609
Personnel Costs
Joseph Serrone $11,196 $11,756 $12,344 $12,961 $13,609
Brandon Bueno $11,196 $11,756 $12,344 $12,961 $13,609
Vickie Bueno-Serrone $11,196 $11,756 $12,344 $12,961 $13,609
Total Payroll $33,588 $35,267 $37,031 $38,882 $40,826
Personnel Forecast Year 1 Year 2 Year 3 Year 4 Year 5
Assets
Current Assets
Cash $204,640 $420,899 $695,082 $1,037,023 $1,458,091
Other Current Assets $0 $0 $0 $0 $0
Total Current Assets $204,640 $420,899 $695,082 $1,037,023 $1,458,091
Long-term Assets
Long-term Assets $0 $0 $0 $0 $0
Accumulated Depreciation $0 $0 $0 $0 $0
Total Long-term Assets $0 $0 $0 $0 $0
Total Assets $204,640 $420,899 $695,082 $1,037,023 $1,458,091
Liabilities and Capital
Current Liabilities
Current Borrowing $100,000 $100,000 $100,000 $100,000 $100,000
Other Current Liabilities $0 $0 $0 $0 $0
Subtotal Current Liabilities $100,000 $100,000 $100,000 $100,000 $100,000
Long-term Liabilities ($11,817) ($23,634) ($35,451) ($47,268) ($59,085)
Total Liabilities $88,183 $76,366 $64,549 $52,732 $40,915
Paid-in Capital $25,000 $25,000 $25,000 $25,000 $25,000
Retained Earnings ($50,000) $141,457 $369,533 $655,533 $1,009,291
Earnings $191,457 $228,076 $286,000 $353,758 $432,885
Total Capital $166,457 $394,533 $680,533 $1,034,291 $1,467,176
Total Liabilities and Capital $254,640 $470,899 $745,082 $1,087,023 $1,508,091
Net Worth $116,457 $344,533 $630,533 $984,291 $1,417,176
Pro Forma Balance Sheet
18
19
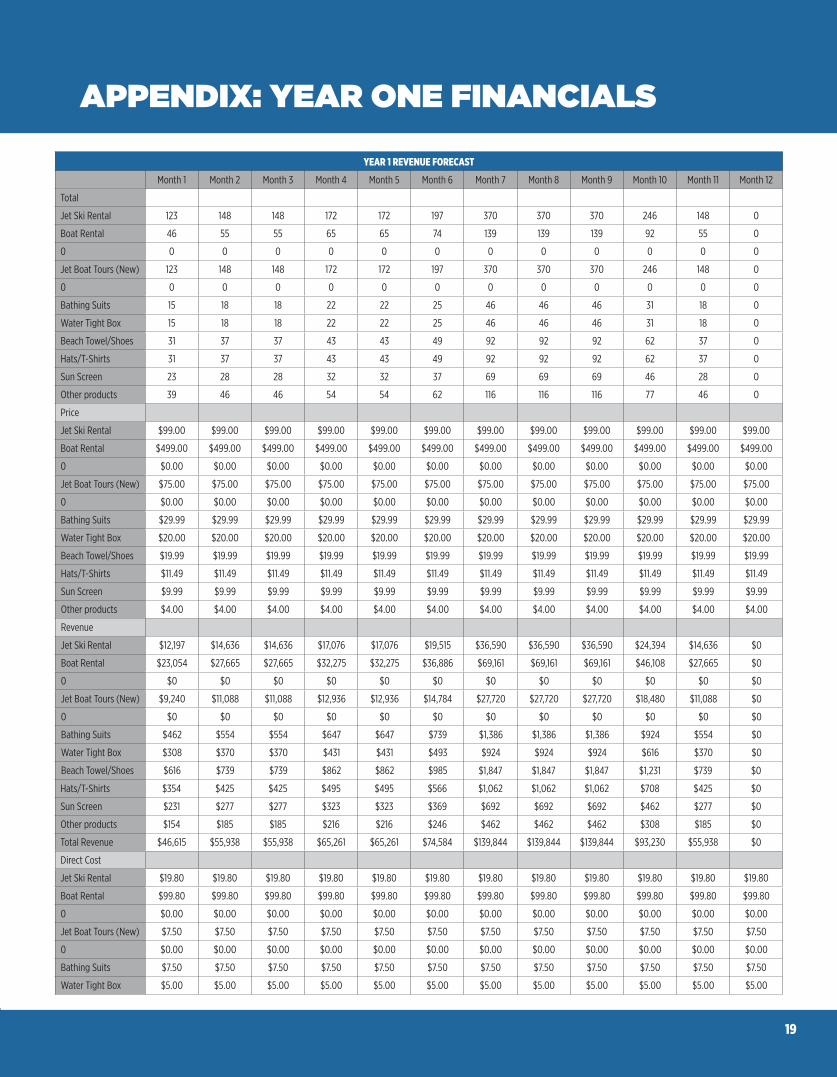
YEAR 1 REVENUE FORECAST
Month 1 Month 2 Month 3 Month 4 Month 5 Month 6 Month 7 Month 8 Month 9 Month 10 Month 11 Month 12
Total
Jet Ski Rental 123 148 148 172 172 197 370 370 370 246 148 0
Boat Rental 46 55 55 65 65 74 139 139 139 92 55 0
0 0 0 0 0 0 0 0 0 0 0 0 0
Jet Boat Tours (New) 123 148 148 172 172 197 370 370 370 246 148 0
0 0 0 0 0 0 0 0 0 0 0 0 0
Bathing Suits 15 18 18 22 22 25 46 46 46 31 18 0
Water Tight Box 15 18 18 22 22 25 46 46 46 31 18 0
Beach Towel/Shoes 31 37 37 43 43 49 92 92 92 62 37 0
Hats/T-Shirts 31 37 37 43 43 49 92 92 92 62 37 0
Sun Screen 23 28 28 32 32 37 69 69 69 46 28 0
Other products 39 46 46 54 54 62 116 116 116 77 46 0
Price
Jet Ski Rental $99.00 $99.00 $99.00 $99.00 $99.00 $99.00 $99.00 $99.00 $99.00 $99.00 $99.00 $99.00
Boat Rental $499.00 $499.00 $499.00 $499.00 $499.00 $499.00 $499.00 $499.00 $499.00 $499.00 $499.00 $499.00
0 $0.00 $0.00 $0.00 $0.00 $0.00 $0.00 $0.00 $0.00 $0.00 $0.00 $0.00 $0.00
Jet Boat Tours (New) $75.00 $75.00 $75.00 $75.00 $75.00 $75.00 $75.00 $75.00 $75.00 $75.00 $75.00 $75.00
0 $0.00 $0.00 $0.00 $0.00 $0.00 $0.00 $0.00 $0.00 $0.00 $0.00 $0.00 $0.00
Bathing Suits $29.99 $29.99 $29.99 $29.99 $29.99 $29.99 $29.99 $29.99 $29.99 $29.99 $29.99 $29.99
Water Tight Box $20.00 $20.00 $20.00 $20.00 $20.00 $20.00 $20.00 $20.00 $20.00 $20.00 $20.00 $20.00
Beach Towel/Shoes $19.99 $19.99 $19.99 $19.99 $19.99 $19.99 $19.99 $19.99 $19.99 $19.99 $19.99 $19.99
Hats/T-Shirts $11.49 $11.49 $11.49 $11.49 $11.49 $11.49 $11.49 $11.49 $11.49 $11.49 $11.49 $11.49
Sun Screen $9.99 $9.99 $9.99 $9.99 $9.99 $9.99 $9.99 $9.99 $9.99 $9.99 $9.99 $9.99
Other products $4.00 $4.00 $4.00 $4.00 $4.00 $4.00 $4.00 $4.00 $4.00 $4.00 $4.00 $4.00
Revenue
Jet Ski Rental $12,197 $14,636 $14,636 $17,076 $17,076 $19,515 $36,590 $36,590 $36,590 $24,394 $14,636 $0
Boat Rental $23,054 $27,665 $27,665 $32,275 $32,275 $36,886 $69,161 $69,161 $69,161 $46,108 $27,665 $0
0 $0 $0 $0 $0 $0 $0 $0 $0 $0 $0 $0 $0
Jet Boat Tours (New) $9,240 $11,088 $11,088 $12,936 $12,936 $14,784 $27,720 $27,720 $27,720 $18,480 $11,088 $0
0 $0 $0 $0 $0 $0 $0 $0 $0 $0 $0 $0 $0
Bathing Suits $462 $554 $554 $647 $647 $739 $1,386 $1,386 $1,386 $924 $554 $0
Water Tight Box $308 $370 $370 $431 $431 $493 $924 $924 $924 $616 $370 $0
Beach Towel/Shoes $616 $739 $739 $862 $862 $985 $1,847 $1,847 $1,847 $1,231 $739 $0
Hats/T-Shirts $354 $425 $425 $495 $495 $566 $1,062 $1,062 $1,062 $708 $425 $0
Sun Screen $231 $277 $277 $323 $323 $369 $692 $692 $692 $462 $277 $0
Other products $154 $185 $185 $216 $216 $246 $462 $462 $462 $308 $185 $0
Total Revenue $46,615 $55,938 $55,938 $65,261 $65,261 $74,584 $139,844 $139,844 $139,844 $93,230 $55,938 $0
Direct Cost
Jet Ski Rental $19.80 $19.80 $19.80 $19.80 $19.80 $19.80 $19.80 $19.80 $19.80 $19.80 $19.80 $19.80
Boat Rental $99.80 $99.80 $99.80 $99.80 $99.80 $99.80 $99.80 $99.80 $99.80 $99.80 $99.80 $99.80
0 $0.00 $0.00 $0.00 $0.00 $0.00 $0.00 $0.00 $0.00 $0.00 $0.00 $0.00 $0.00
Jet Boat Tours (New) $7.50 $7.50 $7.50 $7.50 $7.50 $7.50 $7.50 $7.50 $7.50 $7.50 $7.50 $7.50
0 $0.00 $0.00 $0.00 $0.00 $0.00 $0.00 $0.00 $0.00 $0.00 $0.00 $0.00 $0.00
Bathing Suits $7.50 $7.50 $7.50 $7.50 $7.50 $7.50 $7.50 $7.50 $7.50 $7.50 $7.50 $7.50
Water Tight Box $5.00 $5.00 $5.00 $5.00 $5.00 $5.00 $5.00 $5.00 $5.00 $5.00 $5.00 $5.00
APPENDIX: YEAR ONE FINANCIALS
20
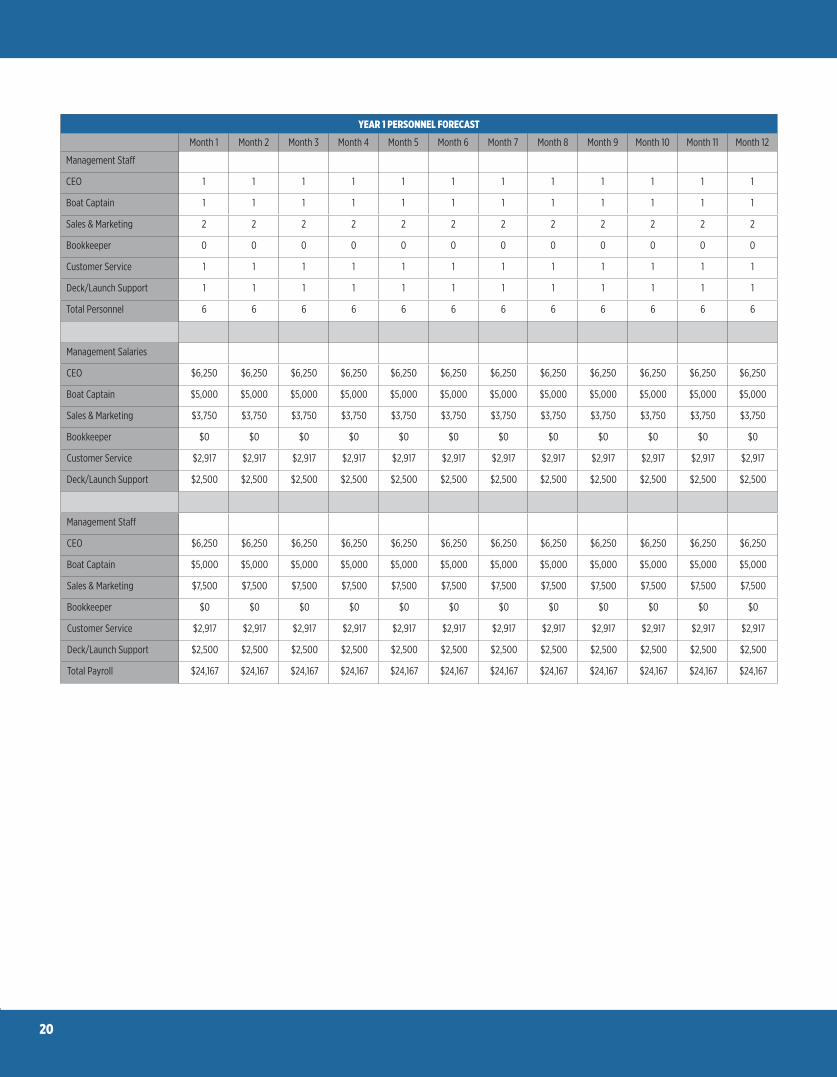
YEAR 1 PERSONNEL FORECAST
Month 1 Month 2 Month 3 Month 4 Month 5 Month 6 Month 7 Month 8 Month 9 Month 10 Month 11 Month 12
Management Staff
CEO 1 1 1 1 1 1 1 1 1 1 1 1
Boat Captain 1 1 1 1 1 1 1 1 1 1 1 1
Sales & Marketing 2 2 2 2 2 2 2 2 2 2 2 2
Bookkeeper 0 0 0 0 0 0 0 0 0 0 0 0
Customer Service 1 1 1 1 1 1 1 1 1 1 1 1
Deck/Launch Support 1 1 1 1 1 1 1 1 1 1 1 1
Total Personnel 6 6 6 6 6 6 6 6 6 6 6 6
Management Salaries
CEO $6,250 $6,250 $6,250 $6,250 $6,250 $6,250 $6,250 $6,250 $6,250 $6,250 $6,250 $6,250
Boat Captain $5,000 $5,000 $5,000 $5,000 $5,000 $5,000 $5,000 $5,000 $5,000 $5,000 $5,000 $5,000
Sales & Marketing $3,750 $3,750 $3,750 $3,750 $3,750 $3,750 $3,750 $3,750 $3,750 $3,750 $3,750 $3,750
Bookkeeper $0 $0 $0 $0 $0 $0 $0 $0 $0 $0 $0 $0
Customer Service $2,917 $2,917 $2,917 $2,917 $2,917 $2,917 $2,917 $2,917 $2,917 $2,917 $2,917 $2,917
Deck/Launch Support $2,500 $2,500 $2,500 $2,500 $2,500 $2,500 $2,500 $2,500 $2,500 $2,500 $2,500 $2,500
Management Staff
CEO $6,250 $6,250 $6,250 $6,250 $6,250 $6,250 $6,250 $6,250 $6,250 $6,250 $6,250 $6,250
Boat Captain $5,000 $5,000 $5,000 $5,000 $5,000 $5,000 $5,000 $5,000 $5,000 $5,000 $5,000 $5,000
Sales & Marketing $7,500 $7,500 $7,500 $7,500 $7,500 $7,500 $7,500 $7,500 $7,500 $7,500 $7,500 $7,500
Bookkeeper $0 $0 $0 $0 $0 $0 $0 $0 $0 $0 $0 $0
Customer Service $2,917 $2,917 $2,917 $2,917 $2,917 $2,917 $2,917 $2,917 $2,917 $2,917 $2,917 $2,917
Deck/Launch Support $2,500 $2,500 $2,500 $2,500 $2,500 $2,500 $2,500 $2,500 $2,500 $2,500 $2,500 $2,500
Total Payroll $24,167 $24,167 $24,167 $24,167 $24,167 $24,167 $24,167 $24,167 $24,167 $24,167 $24,167 $24,167
21
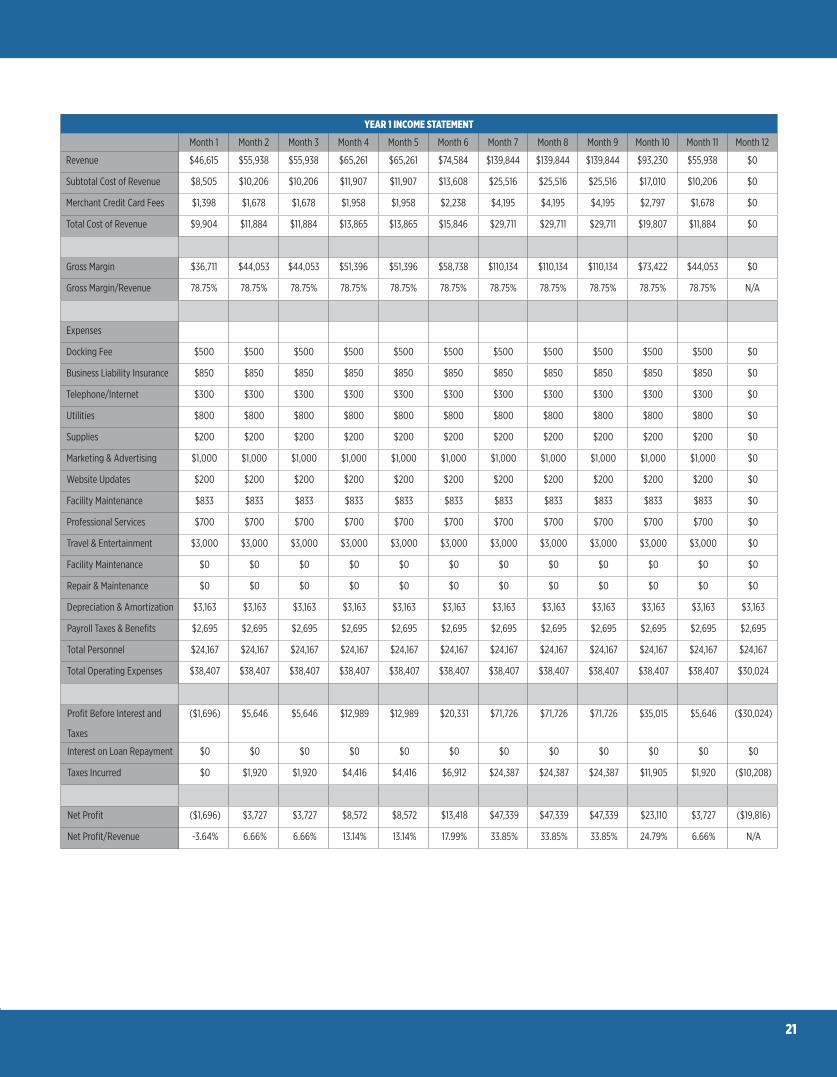
YEAR 1 INCOME STATEMENT
Month 1 Month 2 Month 3 Month 4 Month 5 Month 6 Month 7 Month 8 Month 9 Month 10 Month 11 Month 12
Revenue $46,615 $55,938 $55,938 $65,261 $65,261 $74,584 $139,844 $139,844 $139,844 $93,230 $55,938 $0
Subtotal Cost of Revenue $8,505 $10,206 $10,206 $11,907 $11,907 $13,608 $25,516 $25,516 $25,516 $17,010 $10,206 $0
Merchant Credit Card Fees $1,398 $1,678 $1,678 $1,958 $1,958 $2,238 $4,195 $4,195 $4,195 $2,797 $1,678 $0
Total Cost of Revenue $9,904 $11,884 $11,884 $13,865 $13,865 $15,846 $29,711 $29,711 $29,711 $19,807 $11,884 $0
Gross Margin $36,711 $44,053 $44,053 $51,396 $51,396 $58,738 $110,134 $110,134 $110,134 $73,422 $44,053 $0
Gross Margin/Revenue 78.75% 78.75% 78.75% 78.75% 78.75% 78.75% 78.75% 78.75% 78.75% 78.75% 78.75% N/A
Expenses
Docking Fee $500 $500 $500 $500 $500 $500 $500 $500 $500 $500 $500 $0
Business Liability Insurance $850 $850 $850 $850 $850 $850 $850 $850 $850 $850 $850 $0
Telephone/Internet $300 $300 $300 $300 $300 $300 $300 $300 $300 $300 $300 $0
Utilities $800 $800 $800 $800 $800 $800 $800 $800 $800 $800 $800 $0
Supplies $200 $200 $200 $200 $200 $200 $200 $200 $200 $200 $200 $0
Marketing & Advertising $1,000 $1,000 $1,000 $1,000 $1,000 $1,000 $1,000 $1,000 $1,000 $1,000 $1,000 $0
Website Updates $200 $200 $200 $200 $200 $200 $200 $200 $200 $200 $200 $0
Facility Maintenance $833 $833 $833 $833 $833 $833 $833 $833 $833 $833 $833 $0
Professional Services $700 $700 $700 $700 $700 $700 $700 $700 $700 $700 $700 $0
Travel & Entertainment $3,000 $3,000 $3,000 $3,000 $3,000 $3,000 $3,000 $3,000 $3,000 $3,000 $3,000 $0
Facility Maintenance $0 $0 $0 $0 $0 $0 $0 $0 $0 $0 $0 $0
Repair & Maintenance $0 $0 $0 $0 $0 $0 $0 $0 $0 $0 $0 $0
Depreciation & Amortization $3,163 $3,163 $3,163 $3,163 $3,163 $3,163 $3,163 $3,163 $3,163 $3,163 $3,163 $3,163
Payroll Taxes & Benefits $2,695 $2,695 $2,695 $2,695 $2,695 $2,695 $2,695 $2,695 $2,695 $2,695 $2,695 $2,695
Total Personnel $24,167 $24,167 $24,167 $24,167 $24,167 $24,167 $24,167 $24,167 $24,167 $24,167 $24,167 $24,167
Total Operating Expenses $38,407 $38,407 $38,407 $38,407 $38,407 $38,407 $38,407 $38,407 $38,407 $38,407 $38,407 $30,024
Profit Before Interest and
Taxes
($1,696) $5,646 $5,646 $12,989 $12,989 $20,331 $71,726 $71,726 $71,726 $35,015 $5,646 ($30,024)
Interest on Loan Repayment $0 $0 $0 $0 $0 $0 $0 $0 $0 $0 $0 $0
Taxes Incurred $0 $1,920 $1,920 $4,416 $4,416 $6,912 $24,387 $24,387 $24,387 $11,905 $1,920 ($10,208)
Net Profit ($1,696) $3,727 $3,727 $8,572 $8,572 $13,418 $47,339 $47,339 $47,339 $23,110 $3,727 ($19,816)
Net Profit/Revenue -3.64% 6.66% 6.66% 13.14% 13.14% 17.99% 33.85% 33.85% 33.85% 24.79% 6.66% N/A
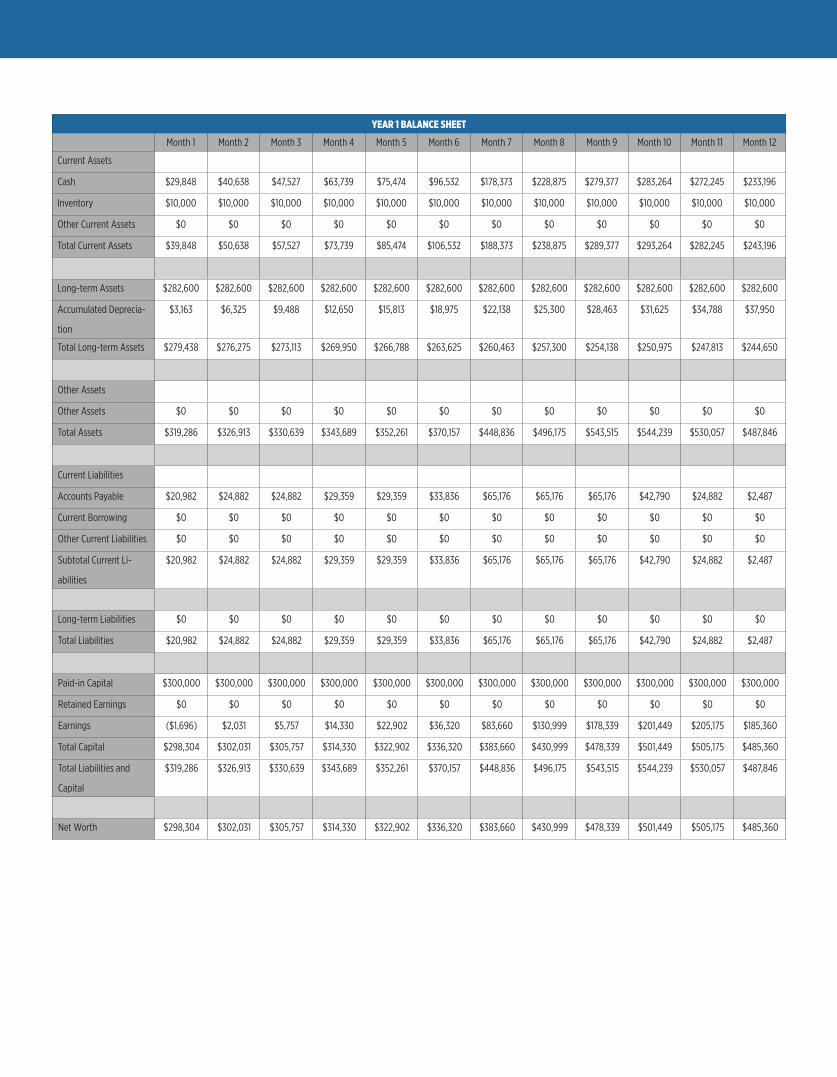
YEAR 1 BALANCE SHEET
Month 1 Month 2 Month 3 Month 4 Month 5 Month 6 Month 7 Month 8 Month 9 Month 10 Month 11 Month 12
Current Assets
Cash $29,848 $40,638 $47,527 $63,739 $75,474 $96,532 $178,373 $228,875 $279,377 $283,264 $272,245 $233,196
Inventory $10,000 $10,000 $10,000 $10,000 $10,000 $10,000 $10,000 $10,000 $10,000 $10,000 $10,000 $10,000
Other Current Assets $0 $0 $0 $0 $0 $0 $0 $0 $0 $0 $0 $0
Total Current Assets $39,848 $50,638 $57,527 $73,739 $85,474 $106,532 $188,373 $238,875 $289,377 $293,264 $282,245 $243,196
Long-term Assets $282,600 $282,600 $282,600 $282,600 $282,600 $282,600 $282,600 $282,600 $282,600 $282,600 $282,600 $282,600
Accumulated Deprecia-
tion
$3,163 $6,325 $9,488 $12,650 $15,813 $18,975 $22,138 $25,300 $28,463 $31,625 $34,788 $37,950
Total Long-term Assets $279,438 $276,275 $273,113 $269,950 $266,788 $263,625 $260,463 $257,300 $254,138 $250,975 $247,813 $244,650
Other Assets
Other Assets $0 $0 $0 $0 $0 $0 $0 $0 $0 $0 $0 $0
Total Assets $319,286 $326,913 $330,639 $343,689 $352,261 $370,157 $448,836 $496,175 $543,515 $544,239 $530,057 $487,846
Current Liabilities
Accounts Payable $20,982 $24,882 $24,882 $29,359 $29,359 $33,836 $65,176 $65,176 $65,176 $42,790 $24,882 $2,487
Current Borrowing $0 $0 $0 $0 $0 $0 $0 $0 $0 $0 $0 $0
Other Current Liabilities $0 $0 $0 $0 $0 $0 $0 $0 $0 $0 $0 $0
Subtotal Current Li-
abilities
$20,982 $24,882 $24,882 $29,359 $29,359 $33,836 $65,176 $65,176 $65,176 $42,790 $24,882 $2,487
Long-term Liabilities $0 $0 $0 $0 $0 $0 $0 $0 $0 $0 $0 $0
Total Liabilities $20,982 $24,882 $24,882 $29,359 $29,359 $33,836 $65,176 $65,176 $65,176 $42,790 $24,882 $2,487
Paid-in Capital $300,000 $300,000 $300,000 $300,000 $300,000 $300,000 $300,000 $300,000 $300,000 $300,000 $300,000 $300,000
Retained Earnings $0 $0 $0 $0 $0 $0 $0 $0 $0 $0 $0 $0
Earnings ($1,696) $2,031 $5,757 $14,330 $22,902 $36,320 $83,660 $130,999 $178,339 $201,449 $205,175 $185,360
Total Capital $298,304 $302,031 $305,757 $314,330 $322,902 $336,320 $383,660 $430,999 $478,339 $501,449 $505,175 $485,360
Total Liabilities and
Capital
$319,286 $326,913 $330,639 $343,689 $352,261 $370,157 $448,836 $496,175 $543,515 $544,239 $530,057 $487,846
Net Worth $298,304 $302,031 $305,757 $314,330 $322,902 $336,320 $383,660 $430,999 $478,339 $501,449 $505,175 $485,360
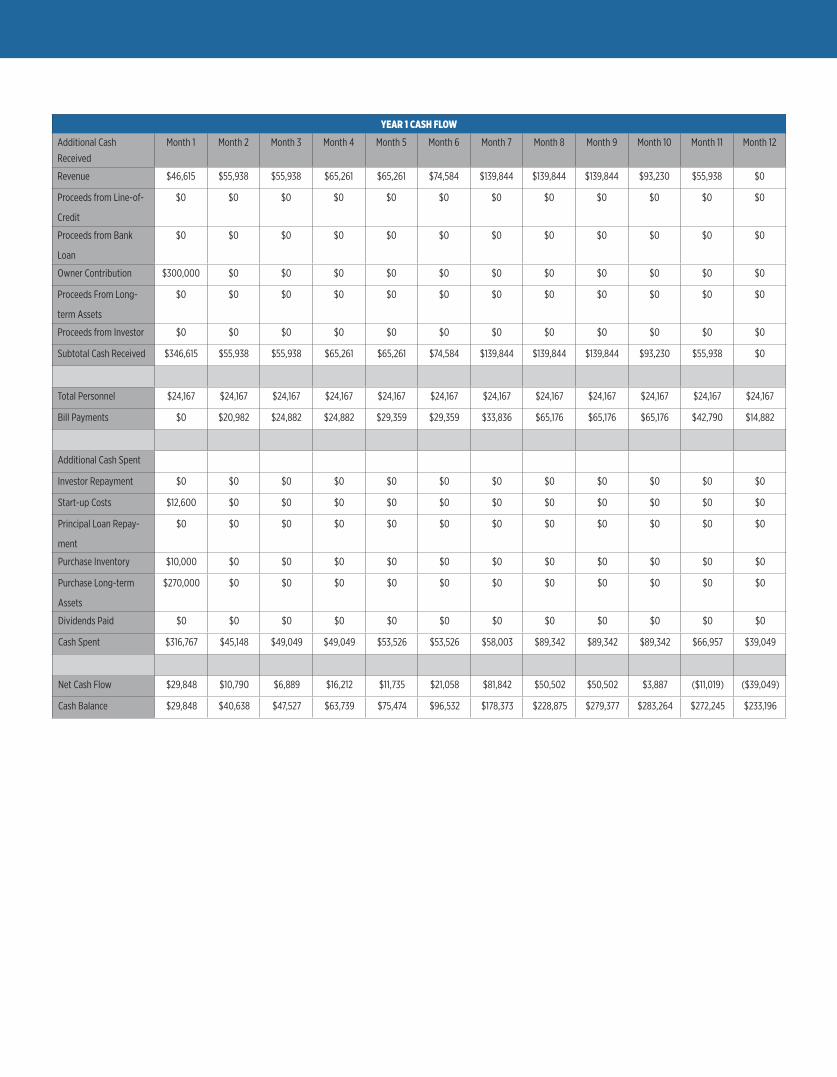
YEAR 1 CASH FLOW
Additional Cash
Received
Month 1 Month 2 Month 3 Month 4 Month 5 Month 6 Month 7 Month 8 Month 9 Month 10 Month 11 Month 12
Revenue $46,615 $55,938 $55,938 $65,261 $65,261 $74,584 $139,844 $139,844 $139,844 $93,230 $55,938 $0
Proceeds from Line-of-
Credit
$0 $0 $0 $0 $0 $0 $0 $0 $0 $0 $0 $0
Proceeds from Bank
Loan
$0 $0 $0 $0 $0 $0 $0 $0 $0 $0 $0 $0
Owner Contribution $300,000 $0 $0 $0 $0 $0 $0 $0 $0 $0 $0 $0
Proceeds From Long-
term Assets
$0 $0 $0 $0 $0 $0 $0 $0 $0 $0 $0 $0
Proceeds from Investor $0 $0 $0 $0 $0 $0 $0 $0 $0 $0 $0 $0
Subtotal Cash Received $346,615 $55,938 $55,938 $65,261 $65,261 $74,584 $139,844 $139,844 $139,844 $93,230 $55,938 $0
Total Personnel $24,167 $24,167 $24,167 $24,167 $24,167 $24,167 $24,167 $24,167 $24,167 $24,167 $24,167 $24,167
Bill Payments $0 $20,982 $24,882 $24,882 $29,359 $29,359 $33,836 $65,176 $65,176 $65,176 $42,790 $14,882
Additional Cash Spent
Investor Repayment $0 $0 $0 $0 $0 $0 $0 $0 $0 $0 $0 $0
Start-up Costs $12,600 $0 $0 $0 $0 $0 $0 $0 $0 $0 $0 $0
Principal Loan Repay-
ment
$0 $0 $0 $0 $0 $0 $0 $0 $0 $0 $0 $0
Purchase Inventory $10,000 $0 $0 $0 $0 $0 $0 $0 $0 $0 $0 $0
Purchase Long-term
Assets
$270,000 $0 $0 $0 $0 $0 $0 $0 $0 $0 $0 $0
Dividends Paid $0 $0 $0 $0 $0 $0 $0 $0 $0 $0 $0 $0
Cash Spent $316,767 $45,148 $49,049 $49,049 $53,526 $53,526 $58,003 $89,342 $89,342 $89,342 $66,957 $39,049
Net Cash Flow $29,848 $10,790 $6,889 $16,212 $11,735 $21,058 $81,842 $50,502 $50,502 $3,887 ($11,019) ($39,049)
Cash Balance $29,848 $40,638 $47,527 $63,739 $75,474 $96,532 $178,373 $228,875 $279,377 $283,264 $272,245 $233,196

![Daytona Daily News. (Daytona, Florida) 1909-12-03 [p 3].ufdcimages.uflib.ufl.edu/UF/00/07/58/94/00360/00008.pdf · golden 120000 giaats eplace Lt-Cost Ormond Indian agency ... salty](https://img.pdfslide.us/doc/110x75/5a939aa27f8b9ab6188b894b/daytona-daily-news-daytona-florida-1909-12-03-p-3-120000-giaats-eplace-lt-cost.jpg)


![ePlace-MS: Electrostatics based Placement for Mixed-Size ...jlu/papers/eplace-ms-tcad14/paper.pdf · Place3.0 [46] performs selective grid resizing to accommodate large macros with](https://img.pdfslide.us/doc/110x75/600254d79e7be43f002ff6eb/eplace-ms-electrostatics-based-placement-for-mixed-size-jlupaperseplace-ms-tcad14paperpdf.jpg)


![RePlAce: Advancing Solution Quality and Routability ... · Furthermore, ePlace [27] [28] [29] cannot produce routable placements, e.g., for SUPERBLUE12 [39] ePlace routing hotspots](https://img.pdfslide.us/doc/110x75/5fb42c622e9412109a7b7ac8/replace-advancing-solution-quality-and-routability-furthermore-eplace-27.jpg)


![Initiation `a Unix Cours 1 - Pr´esentation...[chemin vers fichier destination] → d´eplace un fichier source en le renommant si le chemin du fichier destination contient un nom](https://img.pdfslide.us/doc/110x75/5fe0c1394fdde935d848ebe4/initiation-a-unix-cours-1-presentation-chemin-vers-fichier-destination.jpg)