Embed Size (px)
Citation preview
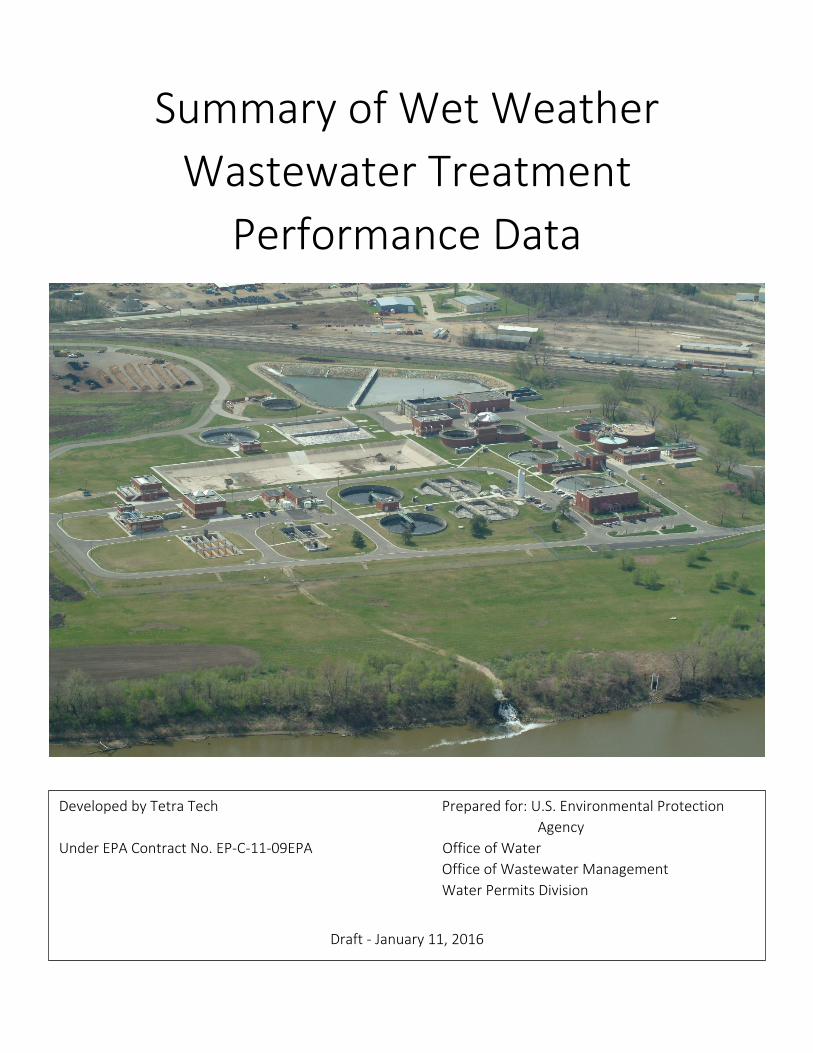
Summary of Wet Weather Wastewater Treatment
Performance Data
Developed by Tetra Tech
Under EPA Contract No. EP-C-11-09EPA
Prepared for: U.S. Environmental Protection Agency
Office of Water Office of Wastewater Management Water Permits Division
Draft - January 11, 2016

Summary of Wet Weather Wastewater Treatment Performance Data DRAFT – January 11, 2016
NOTICES
This document has been drafted for the Water Permits Division of the Office of Wastewater Management. Mention of trade names or commercial products does not constitute endorsement or recommendation for use.
This document presents data describing the performance of wet weather treatment. This document is not intended to provide the Agency’s interpretation of the application of National Pollutant Discharge Elimination System regulations or Clean Water Act requirements to the various treatment scenarios presented.
Cover photo: Kaw River WWTP with an ACTIFLOW treatment system in Lawrence, Kansas. Photo courtesy of the City of Lawrence Department of Utilities
i
Summary of Wet Weather Wastewater Treatment Performance Data DRAFT – January 11, 2016
Contents 1 Introduction .......................................................................................................................... 1-1
2 Summary of Effluent Data for Different Blending Scenarios .............................................. 2-1
2.1 Blending without Additional Side-stream Treatment other than Primary Treatment ... 2-1
2.2 Blending with Side-stream Treatment via Ballasted High-Rate Flocculation .............. 2-7
2.2.1 Actiflo as Side-stream Treatment .......................................................................... 2-7
2.2.2 DensaDeg as Side-stream Treatment ..................................................................... 2-8
3 Performance of Primary Treatment Units During Wet weather Conditions ........................ 3-1
3.1 Primary Treatment ......................................................................................................... 3-1
3.2 Chemically Enhanced Primary Treatment .................................................................... 3-1
4 Performance of Wet Weather Side-Stream Treatment Units ............................................... 4-1
4.1 Actiflo Ballasted High Rate Clarification (HRC) ......................................................... 4-1
4.2 DensaDeg Ballasted High Rate Clarification (HRC) .................................................... 4-2
4.3 Ballasted Flocculation coupled with Suspended Growth Biocontact (BioActiflo) ....... 4-3
4.4 Filtration Technologies ................................................................................................. 4-4
4.4.1 Disc and Traveling Bridge Filters .......................................................................... 4-4
4.4.2 Compressed Media Filtration ................................................................................. 4-5
4.4.3 Upflow Floating Media Filters............................................................................... 4-6
5 Performance of Technologies Used to Increase Biological Treatment Capacity without Blending ....................................................................................................................................... 5-1
5.1 Step Feed and Contact Stabilization .............................................................................. 5-1
5.2 Ballasted Flocculation of Biological Treatment Units .................................................. 5-1
6 References ............................................................................................................................ 6-1
ii

Summary of Wet Weather Wastewater Treatment Performance Data DRAFT – January 11, 2016
1 Introduction This document presents a summary of wet weather treatment technology performance data that EPA has collected to date. The majority of the data is from publicly available technical reports/papers/articles but some data was obtained directly from sources associated with the design, installation, operation and/or testing of the treatment technologies. EPA, with the assistance of a contractor, investigated and contacted a variety of sources in search of relevant data, documents and reports. Data for this document was solicited from the following sources:
• Technology and industry experts • Literature and internet searches • The Water Environment Federation • The National Association of Clean Water Agencies • Consulting firms that design install and test wet weather technologies • Technology vendors • Contacts with personnel at numerous municipal treatment plants that were identified as
employing wet weather treatment technologies
1-1
Summary of Wet Weather Wastewater Treatment Performance Data DRAFT – January 11, 2016
2 Summary of Effluent Data for Different Blending Scenarios This chapter summarizes effluent data from facilities that blend flows diverted around biological treatment units with flows that receive biological treatment during wet weather. The data is generated from sampling points that are located after the flows are blended. The chapter organization is based on the presence or type of side-stream treatment technology employed for diverted flow.
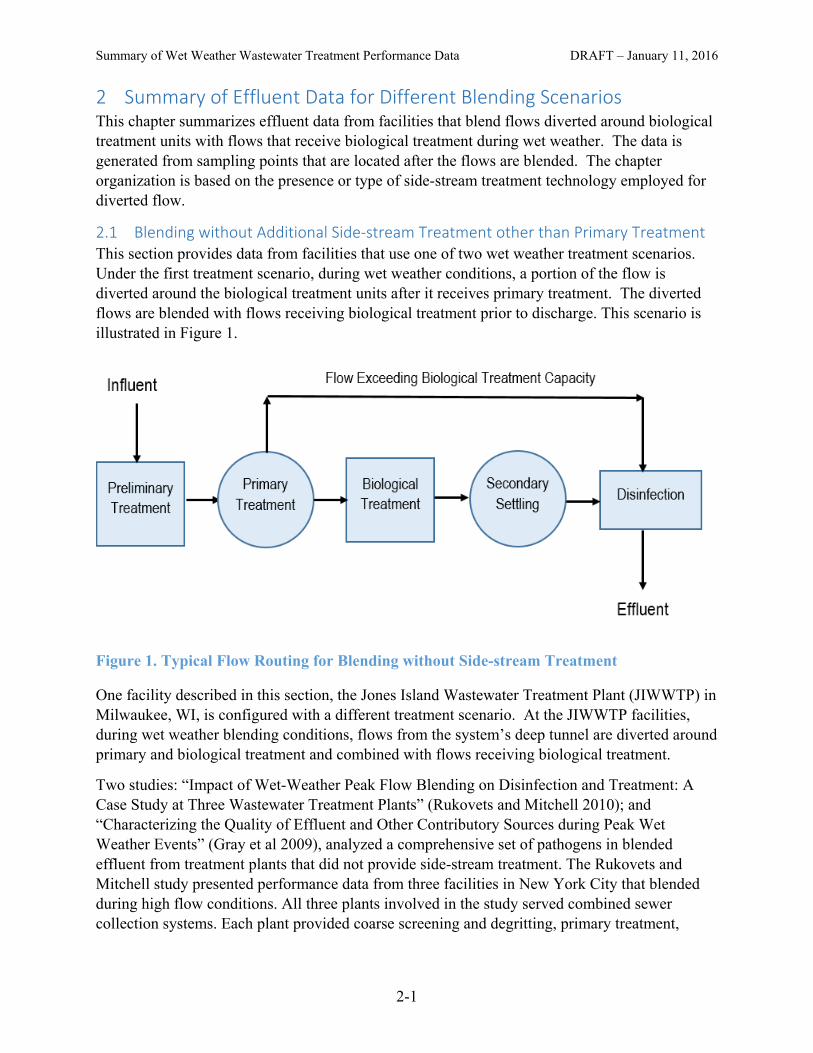
2.1 Blending without Additional Side-stream Treatment other than Primary Treatment This section provides data from facilities that use one of two wet weather treatment scenarios. Under the first treatment scenario, during wet weather conditions, a portion of the flow is diverted around the biological treatment units after it receives primary treatment. The diverted flows are blended with flows receiving biological treatment prior to discharge. This scenario is illustrated in Figure 1.
Figure 1. Typical Flow Routing for Blending without Side-stream Treatment
One facility described in this section, the Jones Island Wastewater Treatment Plant (JIWWTP) in Milwaukee, WI, is configured with a different treatment scenario. At the JIWWTP facilities, during wet weather blending conditions, flows from the system’s deep tunnel are diverted around primary and biological treatment and combined with flows receiving biological treatment.
Two studies: “Impact of Wet-Weather Peak Flow Blending on Disinfection and Treatment: A Case Study at Three Wastewater Treatment Plants” (Rukovets and Mitchell 2010); and “Characterizing the Quality of Effluent and Other Contributory Sources during Peak Wet Weather Events” (Gray et al 2009), analyzed a comprehensive set of pathogens in blended effluent from treatment plants that did not provide side-stream treatment. The Rukovets and Mitchell study presented performance data from three facilities in New York City that blended during high flow conditions. All three plants involved in the study served combined sewer collection systems. Each plant provided coarse screening and degritting, primary treatment,
2-1
Summary of Wet Weather Wastewater Treatment Performance Data DRAFT – January 11, 2016 activated sludge treatment, and chlorine disinfection. At WWTP 1, the blending flow ratio1 ranged from 9 to 29 percent, with an average value of 22 percent. The project team estimated 29 percent as the average blending ratio for WWTP 2 and 11 percent as the average blending ratio for WWTP 3 (Rukovets and Mitchell 2010).
WWTP 3 was undergoing a partial construction upgrade when performance data was collected. At various times during the project, as much as 3 out of 13 aeration tanks and 8 out of 39 final tanks were out of service for the upgrade. This reduction in capacity at the wastewater treatment plant (WWTP) could have had an adverse impact on the treatment quality, especially during blending at peak wet weather flows.
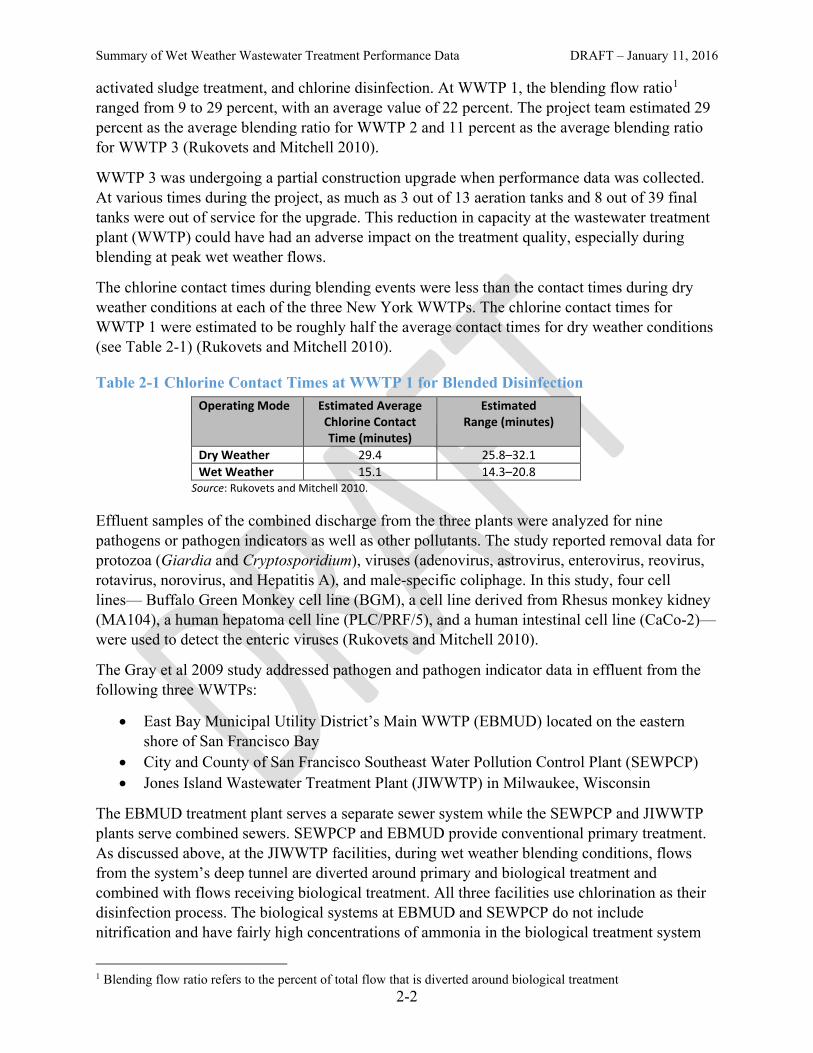
The chlorine contact times during blending events were less than the contact times during dry weather conditions at each of the three New York WWTPs. The chlorine contact times for WWTP 1 were estimated to be roughly half the average contact times for dry weather conditions (see Table 2-1) (Rukovets and Mitchell 2010).
Table 2-1 Chlorine Contact Times at WWTP 1 for Blended Disinfection Operating Mode Estimated Average
Chlorine Contact Time (minutes)
Estimated Range (minutes)
Dry Weather 29.4 25.8–32.1 Wet Weather 15.1 14.3–20.8
Source: Rukovets and Mitchell 2010.
Effluent samples of the combined discharge from the three plants were analyzed for nine pathogens or pathogen indicators as well as other pollutants. The study reported removal data for protozoa (Giardia and Cryptosporidium), viruses (adenovirus, astrovirus, enterovirus, reovirus, rotavirus, norovirus, and Hepatitis A), and male-specific coliphage. In this study, four cell lines— Buffalo Green Monkey cell line (BGM), a cell line derived from Rhesus monkey kidney (MA104), a human hepatoma cell line (PLC/PRF/5), and a human intestinal cell line (CaCo-2)—were used to detect the enteric viruses (Rukovets and Mitchell 2010).
The Gray et al 2009 study addressed pathogen and pathogen indicator data in effluent from the following three WWTPs:
• East Bay Municipal Utility District’s Main WWTP (EBMUD) located on the eastern shore of San Francisco Bay
• City and County of San Francisco Southeast Water Pollution Control Plant (SEWPCP) • Jones Island Wastewater Treatment Plant (JIWWTP) in Milwaukee, Wisconsin
The EBMUD treatment plant serves a separate sewer system while the SEWPCP and JIWWTP plants serve combined sewers. SEWPCP and EBMUD provide conventional primary treatment. As discussed above, at the JIWWTP facilities, during wet weather blending conditions, flows from the system’s deep tunnel are diverted around primary and biological treatment and combined with flows receiving biological treatment. All three facilities use chlorination as their disinfection process. The biological systems at EBMUD and SEWPCP do not include nitrification and have fairly high concentrations of ammonia in the biological treatment system
1 Blending flow ratio refers to the percent of total flow that is diverted around biological treatment 2-2
Summary of Wet Weather Wastewater Treatment Performance Data DRAFT – January 11, 2016 effluent. JIWWTP employs nitrification and had very low concentrations of ammonia in the biological system effluent. The bypass ratio for JIWWTP was only 7.8 percent during the wet weather blending event that was sampled, so ammonia levels in the blended effluent might have remained low even during wet weather flow diversion. Only EBMUD sampled the flows from the biological treatment system prior to blending. Samples of flows from the primary and biological treatment units were collected prior to disinfection. Samples were collected under three different operating conditions:
• “Dry weather” events were defined as sampling events following a period of at least 72 hours without rainfall.
• “Wet weather non-blending” events were defined as storm events that caused a minimum 2:1 peaking factor, but did not require blending.
• “Wet weather blending” events were events that required blending and were representative of high plant influent flows.
Bacteria and protozoa levels in dry weather effluent and wet weather blended and non-blended effluent from both studies are reported in Table 2-2. Virus and coliphage levels in dry weather effluent and wet weather blended and non-blended effluent from both studies are reported in Table 2-3.
2-3
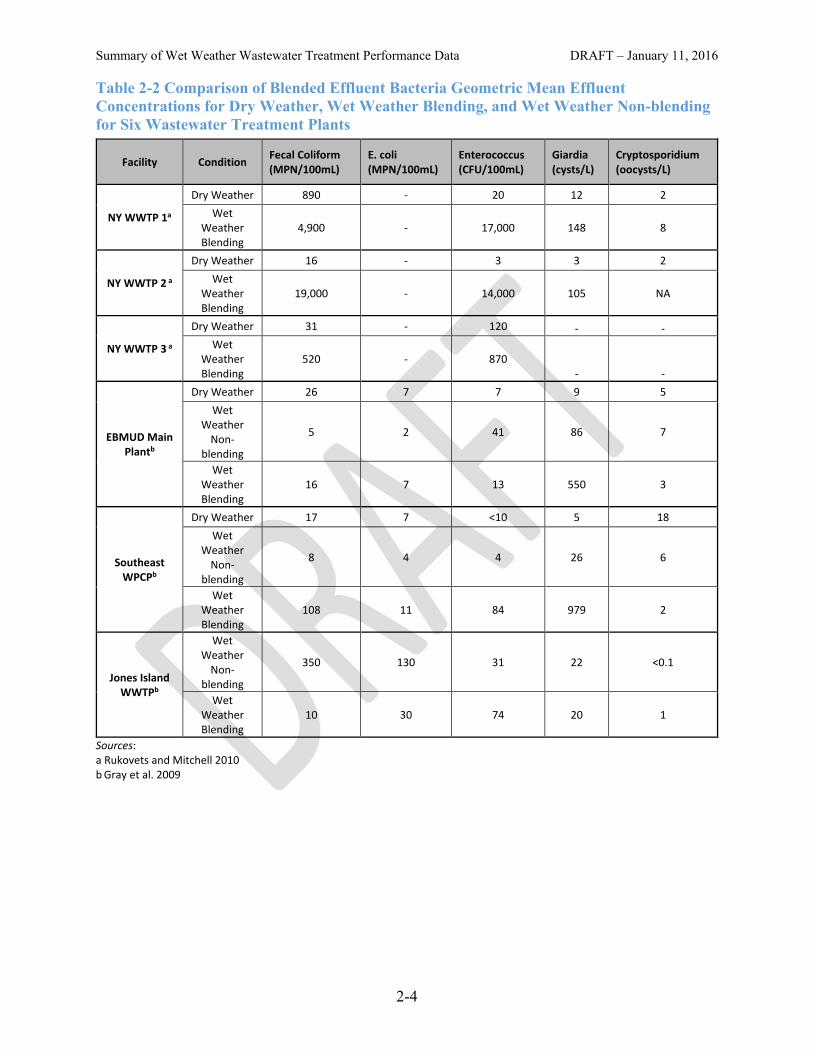
Summary of Wet Weather Wastewater Treatment Performance Data DRAFT – January 11, 2016 Table 2-2 Comparison of Blended Effluent Bacteria Geometric Mean Effluent Concentrations for Dry Weather, Wet Weather Blending, and Wet Weather Non-blending for Six Wastewater Treatment Plants
Facility Condition Fecal Coliform (MPN/100mL)
E. coli (MPN/100mL)
Enterococcus (CFU/100mL)
Giardia (cysts/L)
Cryptosporidium (oocysts/L)
NY WWTP 1a
Dry Weather 890 - 20 12 2 Wet
Weather Blending
4,900 - 17,000 148 8
NY WWTP 2 a
Dry Weather 16 - 3 3 2 Wet
Weather Blending
19,000 - 14,000 105 NA
NY WWTP 3 a
Dry Weather 31 - 120 - - Wet
Weather Blending
520 - 870 - -
EBMUD Main Plantb
Dry Weather 26 7 7 9 5 Wet
Weather Non-
blending
5 2 41 86 7
Wet Weather Blending
16 7 13 550 3
Southeast WPCPb
Dry Weather 17 7 <10 5 18 Wet
Weather Non-
blending
8 4 4 26 6
Wet Weather Blending
108 11 84 979 2
Jones Island WWTPb
Wet Weather
Non-blending
350 130 31 22 <0.1
Wet Weather Blending
10 30 74 20 1
Sources: a Rukovets and Mitchell 2010 b Gray et al. 2009
2-4
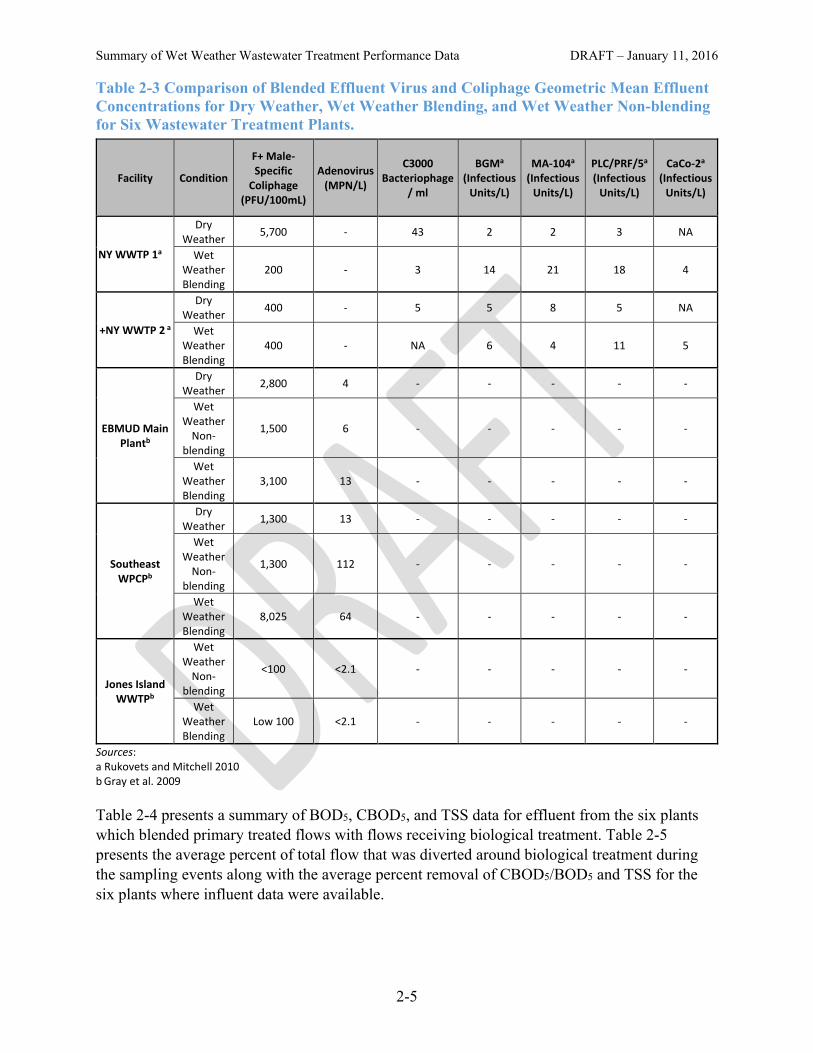
Summary of Wet Weather Wastewater Treatment Performance Data DRAFT – January 11, 2016 Table 2-3 Comparison of Blended Effluent Virus and Coliphage Geometric Mean Effluent Concentrations for Dry Weather, Wet Weather Blending, and Wet Weather Non-blending for Six Wastewater Treatment Plants.
Facility Condition
F+ Male-Specific
Coliphage (PFU/100mL)
Adenovirus (MPN/L)
C3000 Bacteriophage
/ ml
BGMa (Infectious
Units/L)
MA-104a (Infectious
Units/L)
PLC/PRF/5a (Infectious
Units/L)
CaCo-2a (Infectious
Units/L)
NY WWTP 1a
Dry Weather 5,700 - 43 2 2 3 NA
Wet Weather Blending
200 - 3 14 21 18 4
+NY WWTP 2 a
Dry Weather 400 - 5 5 8 5 NA
Wet Weather Blending
400 - NA 6 4 11 5
EBMUD Main Plantb
Dry Weather 2,800 4 - - - - -
Wet Weather
Non-blending
1,500 6 - - - - -
Wet Weather Blending
3,100 13 - - - - -
Southeast WPCPb
Dry Weather 1,300 13 - - - - -
Wet Weather
Non-blending
1,300 112 - - - - -
Wet Weather Blending
8,025 64 - - - - -
Jones Island WWTPb
Wet Weather
Non-blending
<100 <2.1 - - - - -
Wet Weather Blending
Low 100 <2.1 - - - - -
Sources: a Rukovets and Mitchell 2010 b Gray et al. 2009
Table 2-4 presents a summary of BOD5, CBOD5, and TSS data for effluent from the six plants which blended primary treated flows with flows receiving biological treatment. Table 2-5 presents the average percent of total flow that was diverted around biological treatment during the sampling events along with the average percent removal of CBOD5/BOD5 and TSS for the six plants where influent data were available.
2-5
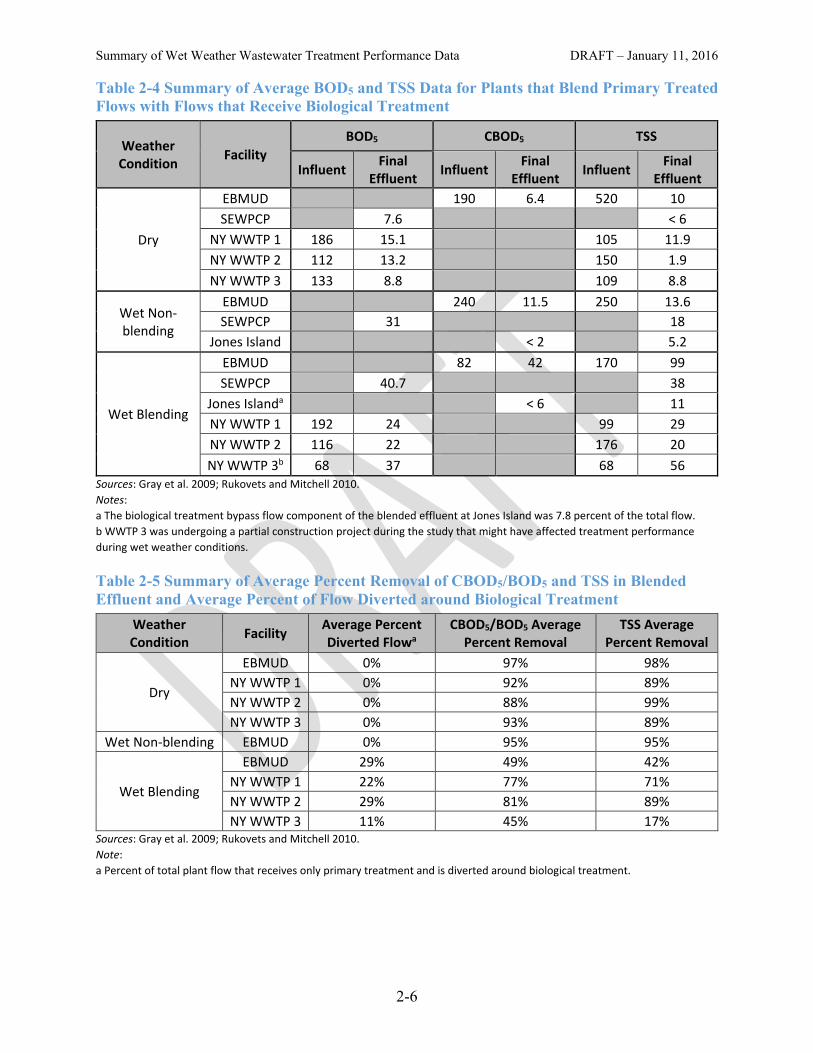
Summary of Wet Weather Wastewater Treatment Performance Data DRAFT – January 11, 2016 Table 2-4 Summary of Average BOD5 and TSS Data for Plants that Blend Primary Treated Flows with Flows that Receive Biological Treatment
Weather Condition Facility
BOD5 CBOD5 TSS
Influent Final Effluent Influent Final
Effluent Influent Final Effluent
Dry
EBMUD 190 6.4 520 10 SEWPCP 7.6 < 6
NY WWTP 1 186 15.1 105 11.9 NY WWTP 2 112 13.2 150 1.9 NY WWTP 3 133 8.8 109 8.8
Wet Non-blending
EBMUD 240 11.5 250 13.6 SEWPCP 31 18
Jones Island < 2 5.2
Wet Blending
EBMUD 82 42 170 99 SEWPCP 40.7 38
Jones Islanda < 6 11 NY WWTP 1 192 24 99 29 NY WWTP 2 116 22 176 20 NY WWTP 3b 68 37 68 56
Sources: Gray et al. 2009; Rukovets and Mitchell 2010. Notes: a The biological treatment bypass flow component of the blended effluent at Jones Island was 7.8 percent of the total flow. b WWTP 3 was undergoing a partial construction project during the study that might have affected treatment performance during wet weather conditions.
Table 2-5 Summary of Average Percent Removal of CBOD5/BOD5 and TSS in Blended Effluent and Average Percent of Flow Diverted around Biological Treatment
Weather Condition Facility Average Percent
Diverted Flowa CBOD5/BOD5 Average
Percent Removal TSS Average
Percent Removal
Dry
EBMUD 0% 97% 98% NY WWTP 1 0% 92% 89% NY WWTP 2 0% 88% 99% NY WWTP 3 0% 93% 89%
Wet Non-blending EBMUD 0% 95% 95%
Wet Blending
EBMUD 29% 49% 42% NY WWTP 1 22% 77% 71% NY WWTP 2 29% 81% 89% NY WWTP 3 11% 45% 17%
Sources: Gray et al. 2009; Rukovets and Mitchell 2010. Note: a Percent of total plant flow that receives only primary treatment and is diverted around biological treatment.
2-6
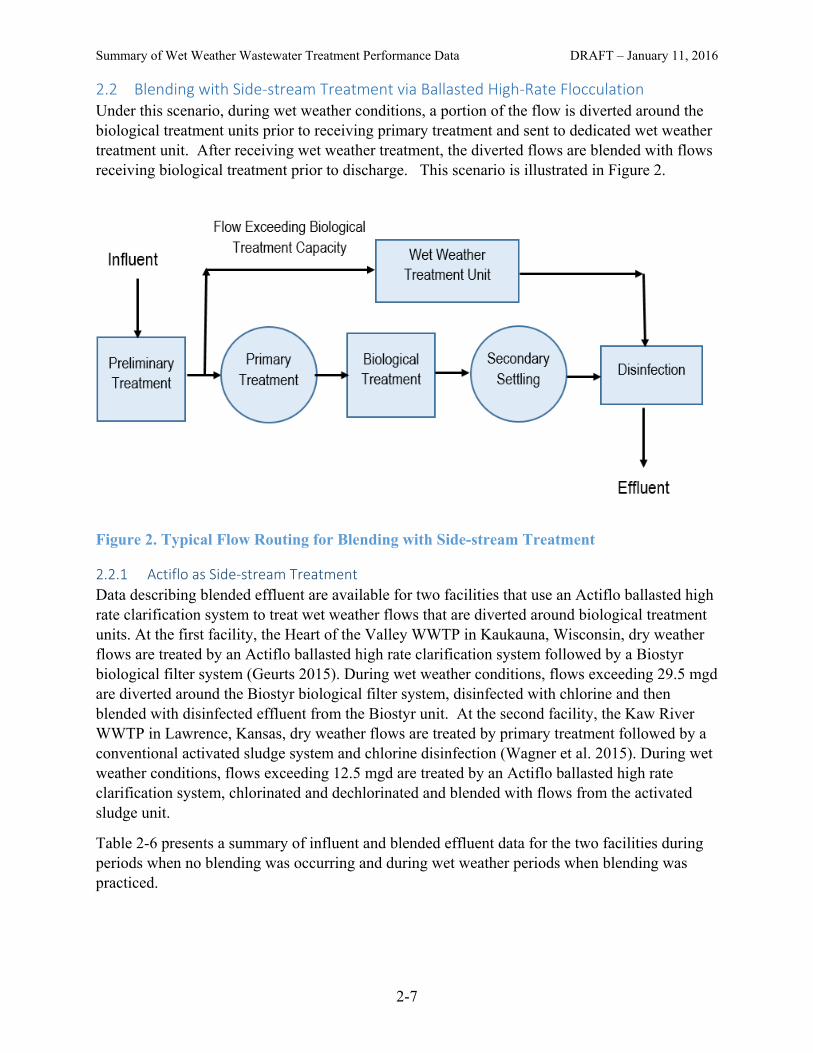
Summary of Wet Weather Wastewater Treatment Performance Data DRAFT – January 11, 2016 2.2 Blending with Side-stream Treatment via Ballasted High-Rate Flocculation Under this scenario, during wet weather conditions, a portion of the flow is diverted around the biological treatment units prior to receiving primary treatment and sent to dedicated wet weather treatment unit. After receiving wet weather treatment, the diverted flows are blended with flows receiving biological treatment prior to discharge. This scenario is illustrated in Figure 2.
Figure 2. Typical Flow Routing for Blending with Side-stream Treatment
2.2.1 Actiflo as Side-stream Treatment Data describing blended effluent are available for two facilities that use an Actiflo ballasted high rate clarification system to treat wet weather flows that are diverted around biological treatment units. At the first facility, the Heart of the Valley WWTP in Kaukauna, Wisconsin, dry weather flows are treated by an Actiflo ballasted high rate clarification system followed by a Biostyr biological filter system (Geurts 2015). During wet weather conditions, flows exceeding 29.5 mgd are diverted around the Biostyr biological filter system, disinfected with chlorine and then blended with disinfected effluent from the Biostyr unit. At the second facility, the Kaw River WWTP in Lawrence, Kansas, dry weather flows are treated by primary treatment followed by a conventional activated sludge system and chlorine disinfection (Wagner et al. 2015). During wet weather conditions, flows exceeding 12.5 mgd are treated by an Actiflo ballasted high rate clarification system, chlorinated and dechlorinated and blended with flows from the activated sludge unit.
Table 2-6 presents a summary of influent and blended effluent data for the two facilities during periods when no blending was occurring and during wet weather periods when blending was practiced.
2-7
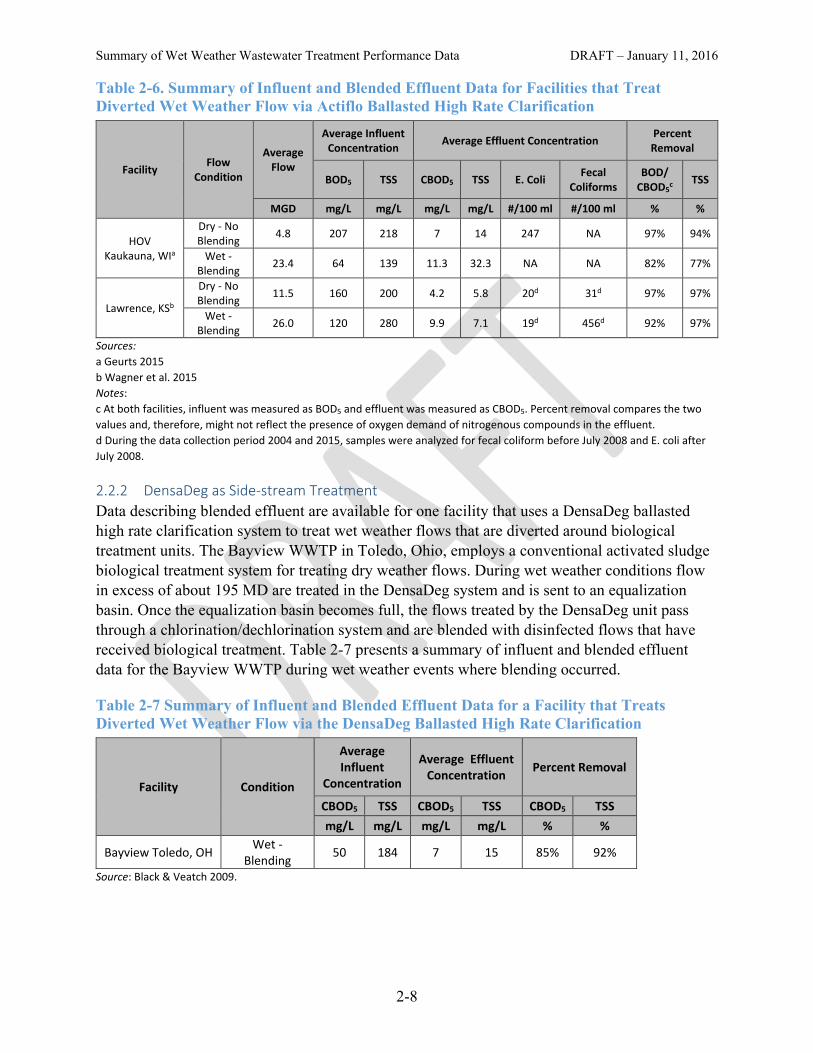
Summary of Wet Weather Wastewater Treatment Performance Data DRAFT – January 11, 2016 Table 2-6. Summary of Influent and Blended Effluent Data for Facilities that Treat Diverted Wet Weather Flow via Actiflo Ballasted High Rate Clarification
Facility Flow Condition
Average Flow
Average Influent Concentration Average Effluent Concentration Percent
Removal
BOD5 TSS CBOD5 TSS E. Coli Fecal Coliforms
BOD/ CBOD5
c TSS
MGD mg/L mg/L mg/L mg/L #/100 ml #/100 ml % %
HOV Kaukauna, WIa
Dry - No Blending 4.8 207 218 7 14 247 NA 97% 94%
Wet - Blending 23.4 64 139 11.3 32.3 NA NA 82% 77%
Lawrence, KSb
Dry - No Blending 11.5 160 200 4.2 5.8 20d 31d 97% 97%
Wet - Blending 26.0 120 280 9.9 7.1 19d 456d 92% 97%
Sources: a Geurts 2015 b Wagner et al. 2015 Notes: c At both facilities, influent was measured as BOD5 and effluent was measured as CBOD5. Percent removal compares the two values and, therefore, might not reflect the presence of oxygen demand of nitrogenous compounds in the effluent. d During the data collection period 2004 and 2015, samples were analyzed for fecal coliform before July 2008 and E. coli after July 2008.
2.2.2 DensaDeg as Side-stream Treatment Data describing blended effluent are available for one facility that uses a DensaDeg ballasted high rate clarification system to treat wet weather flows that are diverted around biological treatment units. The Bayview WWTP in Toledo, Ohio, employs a conventional activated sludge biological treatment system for treating dry weather flows. During wet weather conditions flow in excess of about 195 MD are treated in the DensaDeg system and is sent to an equalization basin. Once the equalization basin becomes full, the flows treated by the DensaDeg unit pass through a chlorination/dechlorination system and are blended with disinfected flows that have received biological treatment. Table 2-7 presents a summary of influent and blended effluent data for the Bayview WWTP during wet weather events where blending occurred.
Table 2-7 Summary of Influent and Blended Effluent Data for a Facility that Treats Diverted Wet Weather Flow via the DensaDeg Ballasted High Rate Clarification
Facility Condition
Average Influent
Concentration
Average Effluent Concentration Percent Removal
CBOD5 TSS CBOD5 TSS CBOD5 TSS mg/L mg/L mg/L mg/L % %
Bayview Toledo, OH Wet - Blending 50 184 7 15 85% 92%
Source: Black & Veatch 2009.
2-8
Summary of Wet Weather Wastewater Treatment Performance Data DRAFT – January 11, 2016
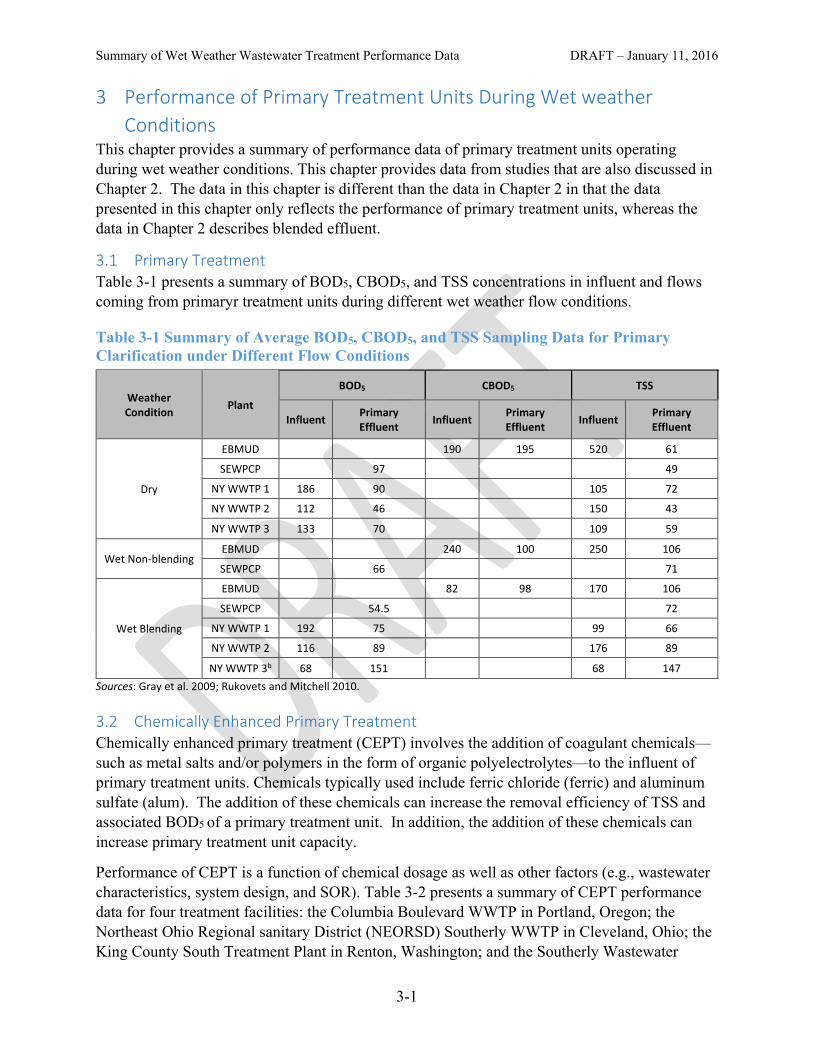
3 Performance of Primary Treatment Units During Wet weather Conditions
This chapter provides a summary of performance data of primary treatment units operating during wet weather conditions. This chapter provides data from studies that are also discussed in Chapter 2. The data in this chapter is different than the data in Chapter 2 in that the data presented in this chapter only reflects the performance of primary treatment units, whereas the data in Chapter 2 describes blended effluent.
3.1 Primary Treatment Table 3-1 presents a summary of BOD5, CBOD5, and TSS concentrations in influent and flows coming from primaryr treatment units during different wet weather flow conditions.
Table 3-1 Summary of Average BOD5, CBOD5, and TSS Sampling Data for Primary Clarification under Different Flow Conditions
Weather Condition Plant
BOD5 CBOD5 TSS
Influent Primary Effluent Influent Primary
Effluent Influent Primary Effluent
Dry
EBMUD 190 195 520 61
SEWPCP 97 49
NY WWTP 1 186 90 105 72
NY WWTP 2 112 46 150 43
NY WWTP 3 133 70 109 59
Wet Non-blending EBMUD 240 100 250 106
SEWPCP 66 71
Wet Blending
EBMUD 82 98 170 106
SEWPCP 54.5 72
NY WWTP 1 192 75 99 66
NY WWTP 2 116 89 176 89
NY WWTP 3b 68 151 68 147 Sources: Gray et al. 2009; Rukovets and Mitchell 2010.
3.2 Chemically Enhanced Primary Treatment Chemically enhanced primary treatment (CEPT) involves the addition of coagulant chemicals—such as metal salts and/or polymers in the form of organic polyelectrolytes—to the influent of primary treatment units. Chemicals typically used include ferric chloride (ferric) and aluminum sulfate (alum). The addition of these chemicals can increase the removal efficiency of TSS and associated BOD5 of a primary treatment unit. In addition, the addition of these chemicals can increase primary treatment unit capacity.
Performance of CEPT is a function of chemical dosage as well as other factors (e.g., wastewater characteristics, system design, and SOR). Table 3-2 presents a summary of CEPT performance data for four treatment facilities: the Columbia Boulevard WWTP in Portland, Oregon; the Northeast Ohio Regional sanitary District (NEORSD) Southerly WWTP in Cleveland, Ohio; the King County South Treatment Plant in Renton, Washington; and the Southerly Wastewater
3-1

Summary of Wet Weather Wastewater Treatment Performance Data DRAFT – January 11, 2016 Treatment Plant (SWWTP) in Columbus, Ohio. TSS removals for the facilities ranged between 72 percent and 85 percent and BOD5 removals ranged between 45 percent and 70 percent.
Table 3-2 Summary of CEPT Performance Data
Facility Constituent Units Weather Condition
Average Concentration Percent Removal
Surface Overflow
Rate (gpd/ft2) Influent CEPT Effluent
Columbia Blvd. WWTP Portland,
ORa
BOD5 mg/L Wet 147 54 57%e
3,160f TSS mg/L Wet 196 35 72%e
E. Coli (Outfall
001)
MPN/ 100 mL
Wet NA 22 NA
NEORSD Southerlyb
BOD5 mg/L Wet 91 17.2 72%
2,784 (1,870-3,436)
TSS mg/L Wet 218 23 82%
E. coli MPN/ 100 mL
Wet 241,316 156 3.9 (Log10)
King County South Plantc
BOD5 mg/L Wet 70% 3,000
Wet 45% 5,500
TSS mg/L Wet 85% 3,000
Wet 75% 5,500
SWWTP Columbus, Ohiod
CBOD5 mg/L Wet 70 20 72% 1,870
TSS mg/L Wet 114 23 80% 1,870 Sources: a City of Portland 2015 b Brown and Caldwell 2015 c Melcer et al. 2011 d Blake et al. 2015 Notes: e Values shown are average of daily percent reductions. f SOR at peak design flow is 3,160 gpd/ ft2. Actual SOR not reported.
CEPT can increase the capacity of primary treatment units as well as the removal efficiencies. The design peak surface overflow rate (SOR) for primary treatment units that do not provide chemical enhancement is typically around 1,500 to 3,000 gpd/sf ft2 The design peak SOR for the Columbia Boulevard WWT; P was 3,161 gpd/ft2 with all units in operation. Tests at other facilities have indicated that SORs of up to 4,200 and 5,500 gpd/ft2 can be achieved (Brown and Caldwell 2015; Melcer et al. 2011).
Table 3-3 presents a comparison of the average TSS and BOD5 effluent concentrations and removals for conventional primary treatment, CEPT, and conventional primary followed by biological treatment systems at multiple WWTPs. The data presented represent multiple plants and include a range of conditions, including dry weather and wet weather events.
3-2
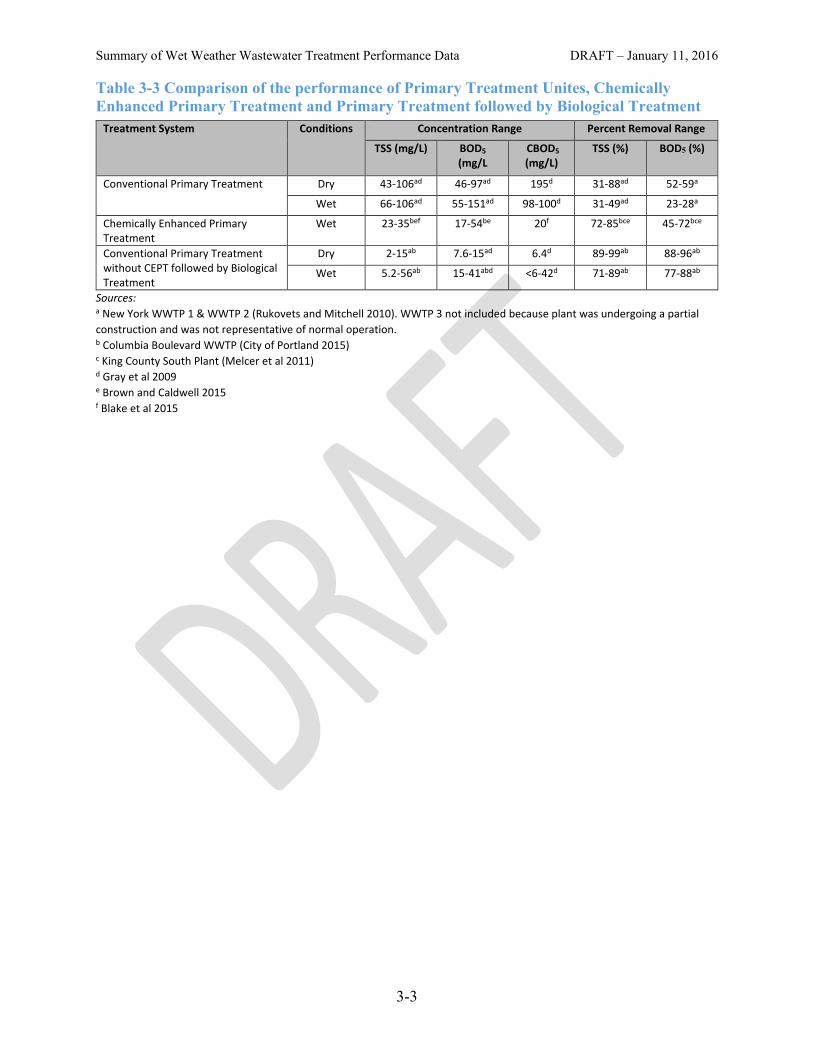
Summary of Wet Weather Wastewater Treatment Performance Data DRAFT – January 11, 2016 Table 3-3 Comparison of the performance of Primary Treatment Unites, Chemically Enhanced Primary Treatment and Primary Treatment followed by Biological Treatment
Treatment System Conditions Concentration Range Percent Removal Range
TSS (mg/L) BOD5
(mg/L CBOD5
(mg/L) TSS (%) BOD5 (%)
Conventional Primary Treatment Dry 43-106ad 46-97ad 195d 31-88ad 52-59a
Wet 66-106ad 55-151ad 98-100d 31-49ad 23-28a
Chemically Enhanced Primary Treatment
Wet 23-35bef 17-54be 20f 72-85bce 45-72bce
Conventional Primary Treatment without CEPT followed by Biological Treatment
Dry 2-15ab 7.6-15ad 6.4d 89-99ab 88-96ab
Wet 5.2-56ab 15-41abd <6-42d 71-89ab 77-88ab
Sources: a New York WWTP 1 & WWTP 2 (Rukovets and Mitchell 2010). WWTP 3 not included because plant was undergoing a partial construction and was not representative of normal operation. b Columbia Boulevard WWTP (City of Portland 2015) c King County South Plant (Melcer et al 2011) d Gray et al 2009 e Brown and Caldwell 2015 f Blake et al 2015
3-3

Summary of Wet Weather Wastewater Treatment Performance Data DRAFT – January 11, 2016
4 Performance of Wet Weather Side-Stream Treatment Units This chapter provides a summary of performance data for wet weather treatment units that can be used to provide side-stream treatment of wet weather flows diverted around biological treatment units. This chapter provides data from studies that are also discussed in Chapter 2. The data in this chapter is different than the data in Chapter 2 in that the data presented in this chapter only reflects the performance of the side-stream treatment unit, whereas the data in Chapter 2 describes blended effluent.
4.1 Actiflo Ballasted High Rate Clarification (HRC) Table 4-1 presents a summary of concentrations and percent removal data describing the performance of eight Actiflo Ballasted HRC facilities. The facilities are: the Kaw River WWTP in Lawrence, Kansas; the Heart of the Valley WWTP in Kaukauna, Wisconsin; the Greenfield Indiana WWTP; the Port Clinton Ohio WWTP; the Newark Ohio WWTP; the Sycamore Creek WWTP in Cincinnati Ohio; the River Road WWTF in Salem Oregon; and the SSO-700 high rate treatment (HRT) facility in Cincinnati Ohio. With the exception of Greenfield, Port Clinton, and Sycamore Creek, the wet weather HRC treatment systems include a separate disinfection step and the data in this chapter for facilities with separate a disinfection system describe samples taken after disinfection. Until October 2014, the Sycamore Creek HRC system experienced problems with poor performance during the initial stages of wet weather events. The poor performance of the unit was thought to occur because the initial flow to the unit was septic sewage. The sewage became septic in a large transfer force main within the plant. The poor performance of the treatment unit resulted in high TSS and CBOD5 values on low -flow days and days after the system had been idle for long periods. After October 2014, a procedure to flush the force main with flows from the biological treatment units was employed, and, during the 13 days of operation from January throu.gh July 2015, the system performance improved significantly.
Table 4-1 Summary of Actiflo HRC Treatment System Performance Facility TSS CBOD5 Phosphorus Ammonia E. Coli
Average Effluent
Conc. (mg/L)
% Removal
(%)
Average Effluent Conc.
(mg/L)
% Removal
(%)
Average Effluent Conc.
(mg/L)
Average Effluent Conc.
(mg/L)
Average Effluent Conc.
(#/ 100mL)
Lawrence, KSa 9.9 96% 11.6 90% - 5.3 24 HOV Kaukauna, WIb 57i - 23.9 - 1.1 4.0 - Greenfield, INc - 88% - 78% - - Port Clinton, OHd 18.5 - 21.6 - - - - Newark, OHe 116 - 20.5 - 4.0 - 1,373 Sycamore Creek, OH (Jan 2009–Jul 2014)f
112j - 32j - - 3.6 -
Sycamore Creek, OH (Jan 2015–Jul 2015)f
9j -
8j -
-
3.4 -
River Road WWTF Salem, ORg
7-24k
-
15-48k -
-
-
-
SSO-700 HRT Cincinnati, OHh
34 56% 51 66% 134,719
Sources: a Wagner et al. 2015
b Geurts 2015 c Ponist 2006
4-1
Summary of Wet Weather Wastewater Treatment Performance Data DRAFT – January 11, 2016 d OHEPA 2014d e OHEPA 2014b f OHEPA 2015 g Fitzpatrick et al 2013 h Murray 2015 Notes:
i The value of 57 includes an outlier of 209 mg/L that was due to the failure of the polymer feed system that day. If this value is excluded, the average becomes 31 mg/L.
j Sycamore Creek data is divided into periods before and after the operational problem regarding septic sewage in the transfer main was resolved.
k Range of concentrations during most active wet weather period after initial optimization adjustments had been made.
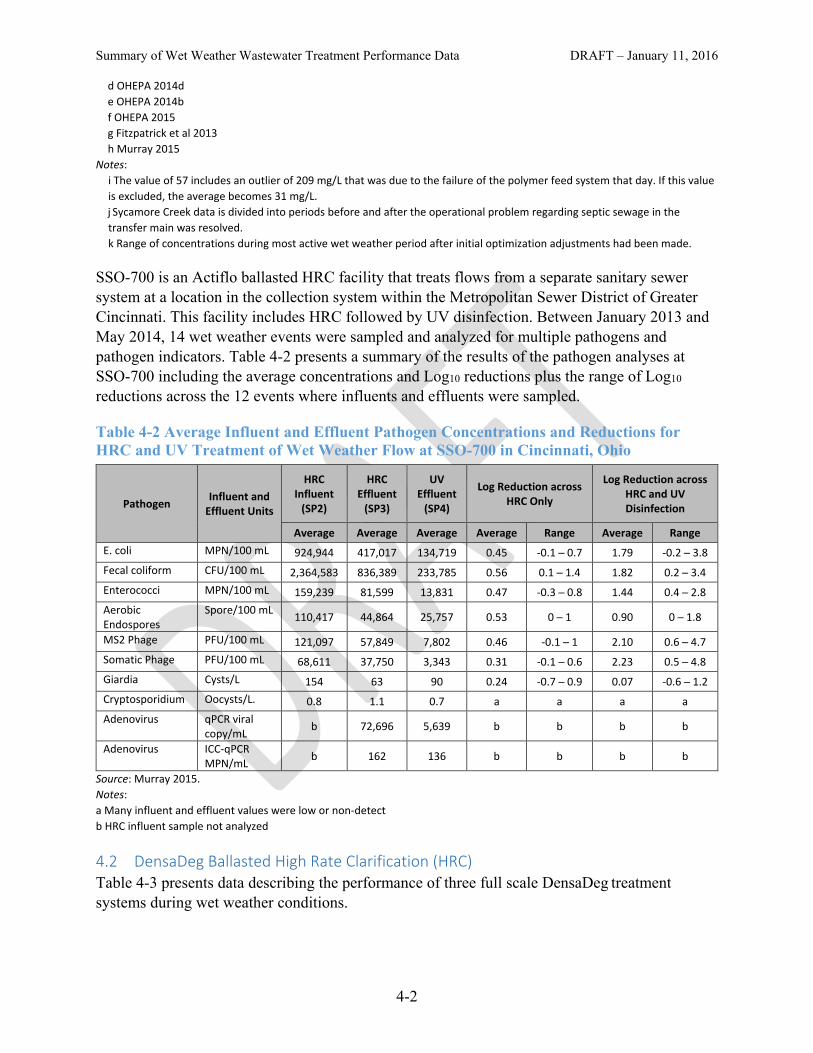
SSO-700 is an Actiflo ballasted HRC facility that treats flows from a separate sanitary sewer system at a location in the collection system within the Metropolitan Sewer District of Greater Cincinnati. This facility includes HRC followed by UV disinfection. Between January 2013 and May 2014, 14 wet weather events were sampled and analyzed for multiple pathogens and pathogen indicators. Table 4-2 presents a summary of the results of the pathogen analyses at SSO-700 including the average concentrations and Log10 reductions plus the range of Log10 reductions across the 12 events where influents and effluents were sampled.
Table 4-2 Average Influent and Effluent Pathogen Concentrations and Reductions for HRC and UV Treatment of Wet Weather Flow at SSO-700 in Cincinnati, Ohio
Pathogen Influent and Effluent Units
HRC Influent
(SP2)
HRC Effluent
(SP3)
UV Effluent
(SP4)
Log Reduction across HRC Only
Log Reduction across HRC and UV Disinfection
Average Average Average Average Range Average Range E. coli MPN/100 mL 924,944 417,017 134,719 0.45 -0.1 ─ 0.7 1.79 -0.2 ─ 3.8 Fecal coliform CFU/100 mL 2,364,583 836,389 233,785 0.56 0.1 ─ 1.4 1.82 0.2 ─ 3.4 Enterococci MPN/100 mL 159,239 81,599 13,831 0.47 -0.3 ─ 0.8 1.44 0.4 ─ 2.8 Aerobic Endospores
Spore/100 mL 110,417 44,864 25,757 0.53 0 ─ 1 0.90 0 ─ 1.8
MS2 Phage PFU/100 mL 121,097 57,849 7,802 0.46 -0.1 ─ 1 2.10 0.6 ─ 4.7 Somatic Phage PFU/100 mL 68,611 37,750 3,343 0.31 -0.1 ─ 0.6 2.23 0.5 ─ 4.8 Giardia Cysts/L 154 63 90 0.24 -0.7 ─ 0.9 0.07 -0.6 ─ 1.2 Cryptosporidium Oocysts/L. 0.8 1.1 0.7 a a a a Adenovirus qPCR viral
copy/mL b 72,696 5,639 b b b b
Adenovirus ICC-qPCR MPN/mL b 162 136 b b b b
Source: Murray 2015. Notes:
a Many influent and effluent values were low or non-detect b HRC influent sample not analyzed
4.2 DensaDeg Ballasted High Rate Clarification (HRC) Table 4-3 presents data describing the performance of three full scale DensaDeg treatment systems during wet weather conditions.
4-2
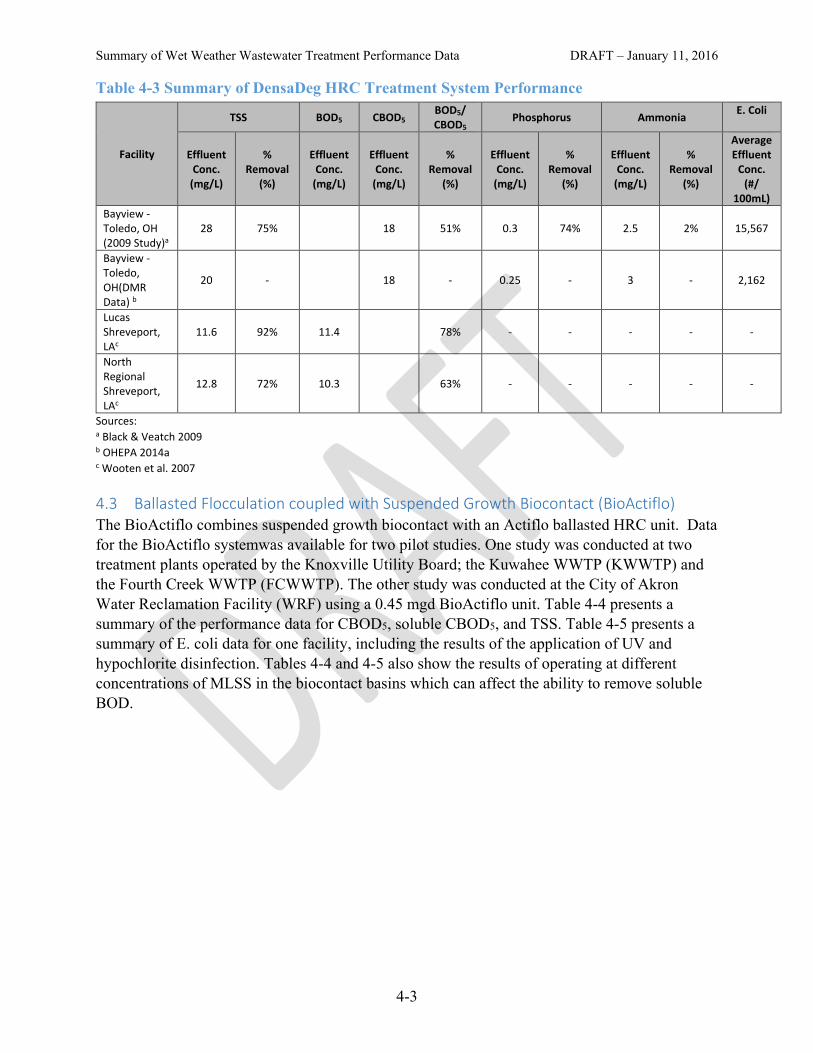
Summary of Wet Weather Wastewater Treatment Performance Data DRAFT – January 11, 2016 Table 4-3 Summary of DensaDeg HRC Treatment System Performance
Facility
TSS BOD5 CBOD5 BOD5/ CBOD5 Phosphorus Ammonia E. Coli
Effluent Conc.
(mg/L)
% Removal
(%)
Effluent Conc.
(mg/L)
Effluent Conc.
(mg/L)
% Removal
(%)
Effluent Conc.
(mg/L)
% Removal
(%)
Effluent Conc.
(mg/L)
% Removal
(%)
Average Effluent
Conc. (#/
100mL) Bayview -Toledo, OH (2009 Study)a
28 75% 18 51% 0.3 74% 2.5 2% 15,567
Bayview -Toledo, OH(DMR Data) b
20 - 18 - 0.25 - 3 - 2,162
Lucas Shreveport, LAc
11.6 92% 11.4 78% - - - - -
North Regional Shreveport, LAc
12.8 72% 10.3 63% - - - - -
Sources: a Black & Veatch 2009
b OHEPA 2014a c Wooten et al. 2007
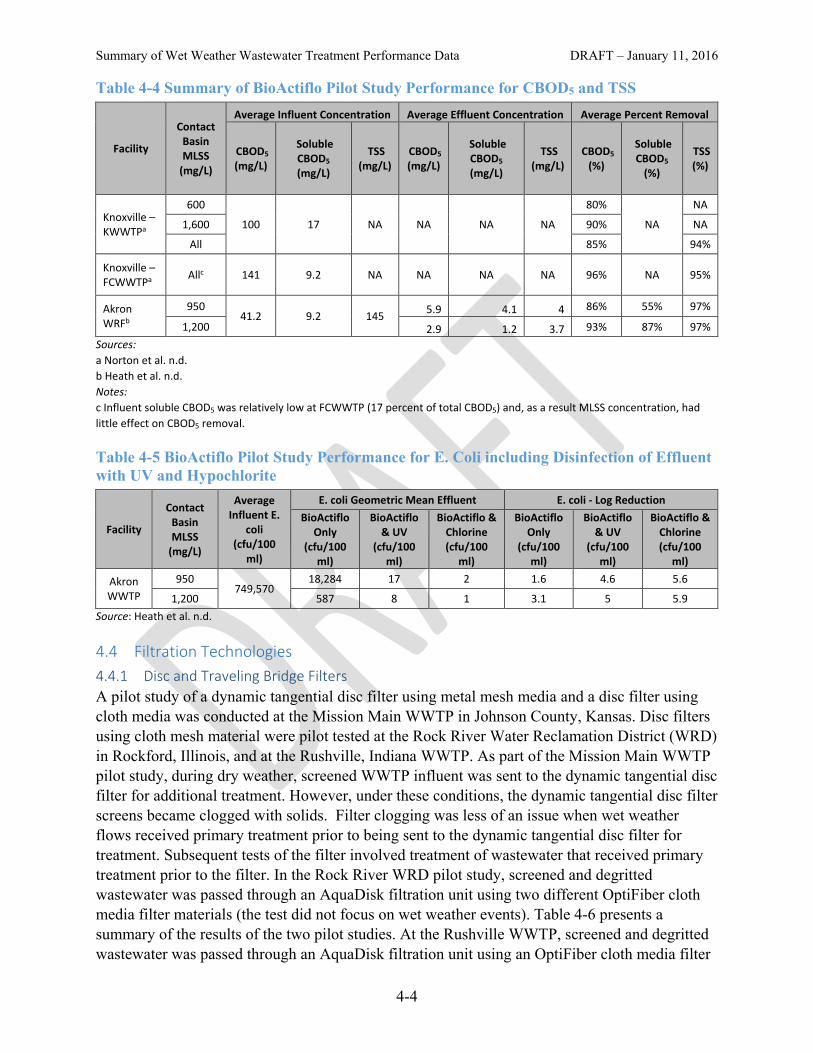
4.3 Ballasted Flocculation coupled with Suspended Growth Biocontact (BioActiflo) The BioActiflo combines suspended growth biocontact with an Actiflo ballasted HRC unit. Data for the BioActiflo systemwas available for two pilot studies. One study was conducted at two treatment plants operated by the Knoxville Utility Board; the Kuwahee WWTP (KWWTP) and the Fourth Creek WWTP (FCWWTP). The other study was conducted at the City of Akron Water Reclamation Facility (WRF) using a 0.45 mgd BioActiflo unit. Table 4-4 presents a summary of the performance data for CBOD5, soluble CBOD5, and TSS. Table 4-5 presents a summary of E. coli data for one facility, including the results of the application of UV and hypochlorite disinfection. Tables 4-4 and 4-5 also show the results of operating at different concentrations of MLSS in the biocontact basins which can affect the ability to remove soluble BOD.
4-3
Summary of Wet Weather Wastewater Treatment Performance Data DRAFT – January 11, 2016 Table 4-4 Summary of BioActiflo Pilot Study Performance for CBOD5 and TSS
Facility
Contact Basin MLSS
(mg/L)
Average Influent Concentration Average Effluent Concentration Average Percent Removal
CBOD5
(mg/L)
Soluble CBOD5
(mg/L)
TSS (mg/L)
CBOD5
(mg/L)
Soluble CBOD5
(mg/L)
TSS (mg/L)
CBOD5
(%)
Soluble CBOD5
(%)
TSS (%)
Knoxville – KWWTPa
600
100 17 NA NA NA NA
80%
NA
NA
1,600 90% NA
All 85% 94%
Knoxville – FCWWTPa Allc 141 9.2 NA NA NA NA 96% NA 95%
Akron WRFb
950 41.2 9.2 145 5.9 4.1 4 86% 55% 97%
1,200 2.9 1.2 3.7 93% 87% 97% Sources: a Norton et al. n.d. b Heath et al. n.d. Notes: c Influent soluble CBOD5 was relatively low at FCWWTP (17 percent of total CBOD5) and, as a result MLSS concentration, had little effect on CBOD5 removal.
Table 4-5 BioActiflo Pilot Study Performance for E. Coli including Disinfection of Effluent with UV and Hypochlorite
Facility
Contact Basin MLSS
(mg/L)
Average Influent E.
coli (cfu/100
ml)
E. coli Geometric Mean Effluent E. coli - Log Reduction BioActiflo
Only (cfu/100
ml)
BioActiflo & UV
(cfu/100 ml)
BioActiflo & Chlorine (cfu/100
ml)
BioActiflo Only
(cfu/100 ml)
BioActiflo & UV
(cfu/100 ml)
BioActiflo & Chlorine (cfu/100
ml)
Akron WWTP
950 749,570
18,284 17 2 1.6 4.6 5.6
1,200 587 8 1 3.1 5 5.9 Source: Heath et al. n.d.
4.4 Filtration Technologies 4.4.1 Disc and Traveling Bridge Filters A pilot study of a dynamic tangential disc filter using metal mesh media and a disc filter using cloth media was conducted at the Mission Main WWTP in Johnson County, Kansas. Disc filters using cloth mesh material were pilot tested at the Rock River Water Reclamation District (WRD) in Rockford, Illinois, and at the Rushville, Indiana WWTP. As part of the Mission Main WWTP pilot study, during dry weather, screened WWTP influent was sent to the dynamic tangential disc filter for additional treatment. However, under these conditions, the dynamic tangential disc filter screens became clogged with solids. Filter clogging was less of an issue when wet weather flows received primary treatment prior to being sent to the dynamic tangential disc filter for treatment. Subsequent tests of the filter involved treatment of wastewater that received primary treatment prior to the filter. In the Rock River WRD pilot study, screened and degritted wastewater was passed through an AquaDisk filtration unit using two different OptiFiber cloth media filter materials (the test did not focus on wet weather events). Table 4-6 presents a summary of the results of the two pilot studies. At the Rushville WWTP, screened and degritted wastewater was passed through an AquaDisk filtration unit using an OptiFiber cloth media filter
4-4
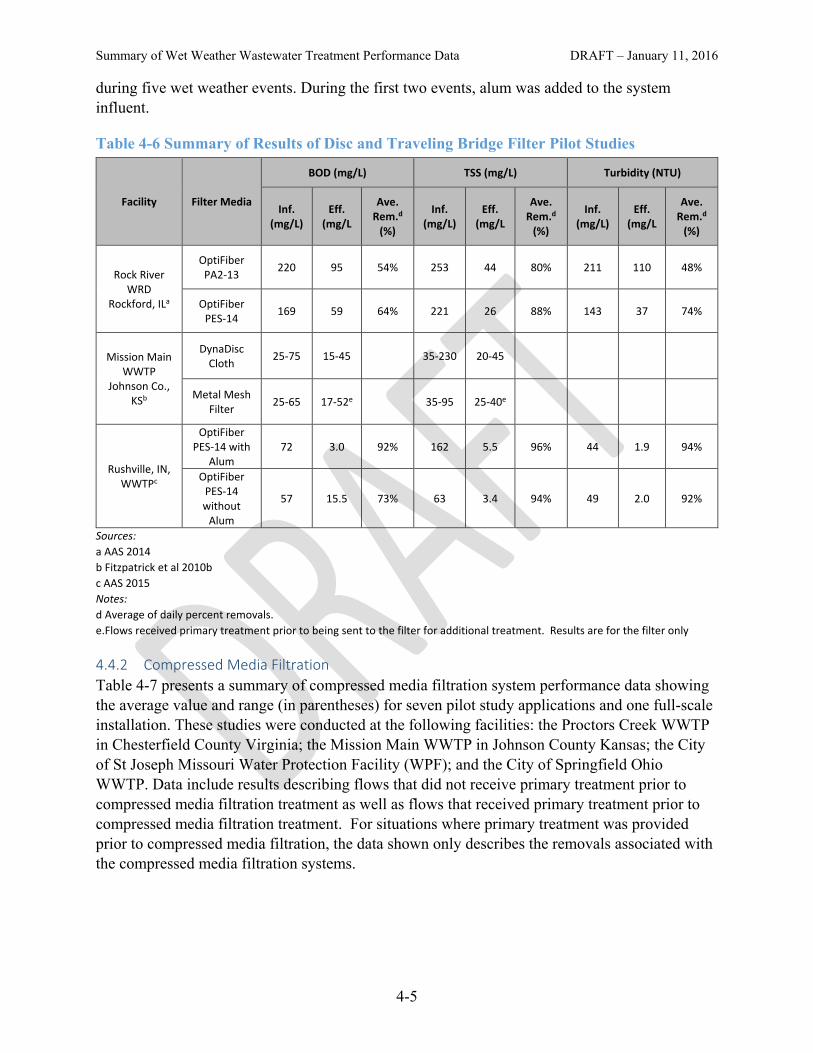
Summary of Wet Weather Wastewater Treatment Performance Data DRAFT – January 11, 2016 during five wet weather events. During the first two events, alum was added to the system influent.
Table 4-6 Summary of Results of Disc and Traveling Bridge Filter Pilot Studies
Facility Filter Media
BOD (mg/L) TSS (mg/L) Turbidity (NTU)
Inf. (mg/L)
Eff. (mg/L
Ave. Rem.d
(%)
Inf. (mg/L)
Eff. (mg/L
Ave. Rem.d
(%)
Inf. (mg/L)
Eff. (mg/L
Ave. Rem.d
(%)
Rock River WRD
Rockford, ILa
OptiFiber PA2-13 220 95 54% 253 44 80% 211 110 48%
OptiFiber PES-14 169 59 64% 221 26 88% 143 37 74%
Mission Main WWTP
Johnson Co., KSb
DynaDisc Cloth 25-75 15-45 35-230 20-45
Metal Mesh Filter 25-65 17-52e 35-95 25-40e
Rushville, IN, WWTPc
OptiFiber PES-14 with
Alum 72 3.0 92% 162 5.5 96% 44 1.9 94%
OptiFiber PES-14 without
Alum
57 15.5 73% 63 3.4 94% 49 2.0 92%
Sources: a AAS 2014 b Fitzpatrick et al 2010b c AAS 2015 Notes:
d Average of daily percent removals. e.Flows received primary treatment prior to being sent to the filter for additional treatment. Results are for the filter only
4.4.2 Compressed Media Filtration Table 4-7 presents a summary of compressed media filtration system performance data showing the average value and range (in parentheses) for seven pilot study applications and one full-scale installation. These studies were conducted at the following facilities: the Proctors Creek WWTP in Chesterfield County Virginia; the Mission Main WWTP in Johnson County Kansas; the City of St Joseph Missouri Water Protection Facility (WPF); and the City of Springfield Ohio WWTP. Data include results describing flows that did not receive primary treatment prior to compressed media filtration treatment as well as flows that received primary treatment prior to compressed media filtration treatment. For situations where primary treatment was provided prior to compressed media filtration, the data shown only describes the removals associated with the compressed media filtration systems.
4-5

Summary of Wet Weather Wastewater Treatment Performance Data DRAFT – January 11, 2016 Table 4-7 Summary of Pilot Scale and Full-Scale Compressed Media Filtration Performance Data
Facility Wastewater Source to Compressed Media Filtration Unit
TSS CBOD5
Effluent Conc.
CMF System
% Removal
Effluent Conc.
CMF System % Removal
mg/L % mg/L % Pilot Scale Studies
Proctors Creek WWTP, Chesterfield County , VAa
Untreated Influent 19 (11-35) 89% (82-93%) - -
Primary Treatment prior to compressed media filtration 17 (6-29) 70% (29-
88%) - -
Mission Main WWTP Johnson Co, KSa
Untreated Influent Dry Weather 29 (19-36) 87% (85-90%) - -
Untreated Influent Wet Weather (sanitary sewer collection system)
19 (14-26) 83% (75-88%) - -
Primary Treatment prior to compressed media filtration:
Dry Weather conditions
16 (10-24) 76% (70-86%) - -
Primary Treatment prior to compressed media filtration
Wet Weather (sanitary sewer collection system)
20 (7-36) 62% (25-83%) - -
St. Joseph, MOa Untreated Influent (combined sewer collection system)
6 94% 12 66%
Full-Scale Installation Springfield, OHb Untreated Influent during wet
weather 19 (5-64) 84 (61-
96)% 24 (16-54) 34 (0-57)%
Sources: a Boner 2015. b Fitzpatrich et al 2015.
4.4.3 Upflow Floating Media Filters A pilot study testing the performance of a BioFiltration upflow floating media filtration system manufactured by BKT was conducted using wet weather grit chamber effluent at the Seonam WWTP in Seoul, Korea. This system, which included chemical coagulation using alum and polymer, removed an average of 76 percent of BOD5 for all wet weather events tested with a range of 72–80 percent and removed an average of 81 percent of TSS with a range of 67–89 percent (Yoon et al 2012).
4-6

Summary of Wet Weather Wastewater Treatment Performance Data DRAFT – January 11, 2016
5 Performance of Technologies Used to Increase Biological Treatment Capacity without Blending
5.1 Step Feed and Contact Stabilization The goal of step feed and contact stabilization is to increase the hydraulic capacity of biological treatment systems without construction of additional aeration tank capacity. Table 5-1 presents a summary of the achievable increase in biological system hydraulic capacity resulting from switching to step feed or contact stabilization during wet weather events. Effluent quality data was not available.
Table 5-1 Summary of Biological System Hydraulic Capacity Increase Due to Use of Step Feed/Contact Stabilization
Facility Technology Performance Greencastle, Indiana WWTPa
Switch to contact stabilization in vertical loop reactor system.
Plant daily effluent values stayed within monthly average NPDES BOD5, TSS, and ammonia limits during wet weather flow that is five times dry weather flow.
Columbia Blvd. WWTP Portland, ORb
Switch to step feed from modified plug flow AS.
Can increase biological system capacity by 35%.
Ward Island NY Battery Ea
Redistribute current step feed distribution toward last pass of 4-pass system.
Increased MLSS inventory and maintained ability to meet total nitrogen and ammonia NPDES limits during wet weather event of about two times normal flow.
City of Akron, Ohio WRCc
Modified unit 6 to operate in step feed mode and modified secondary clarifiers by adding density current baffles, larger and deeper center wells, and energy dissipating inlets.
Biological system capacity of unit 6 increased by 39% from 18.3 MGD to 30 MGD. Clarifier stress tests indicate higher capacities might be achievable.
Sources: a Gelner et al. 2012 b Ciolli 2015 c Siczka et al. 2015
5.2 Ballasted Flocculation of Biological Treatment Units The BioMag ballasted biological flocculation technology has been installed at two publicly owned treatment works (POTW) facilities in the United States. At each plant, the existing biological system infrastructure was upgraded. At a POTW in Sturbridge, Massachusetts, the BioMag system increased the rated system capacity of the biological treatment units by about a factor of two from 0.75 to 1.3 MGD (Catlow and Woodard 2012). At the second plant in Allenstown, New Hampshire, the new plant capacity has not yet been determined. During a start-up test using influent amended with canal water, the facility was capable of meeting permit limits for TSS, CBOD5, and phosphorus at a sustained flow rate nearly four times the previously rated plant capacity for a duration of 4 days (Backman 2015). Prior to the upgrade, the Allenstown POTW had experienced problems meeting their NPDES limits at the rated capacity, particularly during episodes of high filamentous bacteria. During the test, the Allenstown facility did not meet its E. coli limit because the disinfection system had not yet been upgraded to handle the increased flow.
5-1
Summary of Wet Weather Wastewater Treatment Performance Data DRAFT – January 11, 2016
6 References AAS (Aqua-Aerobic Systems, Inc.). 2014. The Evaluation of OptiFiber PA2-13 and PES-14® Cloth Media Filtration for Primary Treatment of Screened and De-gritted Municipal Sewage. AAS Test Report.
AAS (Aqua-Aerobic Systems, Inc.). 2015. The Evaluation of OptiFiber PES-14 Cloth Media Filtration for Application in Combined Sewer Overflow Treatment.
Backman, J. 2015. Assistant Superintendent Allenstown NH WWTP, personal communication, April 10, 2015.
Black & Veatch. 2009. Ballasted Flocculation Performance Testing 2-Year Final Report. Project Nos. 132633/161731/162478. Prepared for City of Toledo – Bayview Wastewater Treatment Plant by Black & Veatch.
Blake, D., T. Phelps, S. Eckenwiler, J. Lee, K. Smith, and B. Burroughs. 2015. Chemically Enhanced Primary Treatment in the Next Step in Columbus’ Wet Weather Plan. Paper presented at 88th Annual Water Environment Federation Technical Exhibition and Conference (WEFTEC), September 26–30, 2015, Chicago, Illinois.
Boner, M. 2015. (WesTec), Personal communication, March 6, 2015.
Brown and Caldwell. 2015. Chemically Enhanced High-Rate Treatment (CEHRT) - Demonstration Performance Report - Southerly WWTC. Prepared for Northeast Ohio Regional Sewer District by Brown and Caldwell, Seattle, Washington.
Catlow, I., and S. Woodard. 2012. Startup of the Nation’s First Combined BioMag/CoMag Treatment Facility: Challenges and Successes. Paper presented at 2012 Water Environment Federation Technical Exhibition and Conference September 29, 2012 - October 3, 2012. New Orleans, Louisiana.
Ciolli, M. 2015. Operations Manager Columbia Blvd WWTP, personal communication, April 28, 2015.
City of Portland (City of Portland Bureau of Environmental Services). 2015. Data Spreadsheet Response to Public Records Request for Columbia Blvd WWTP Effluent Data. City of Portland Bureau of Environmental Services, OR.
Fitzpatrick, J., D. Gilpin, A. Kadava, A. Kliewer, S. Pekarek, J. Schlaman, and S. Tarallo. 2010b. Wet Weather Pilot Studies Demonstrate Effectiveness of High-Rate Filtration Technologies. Paper presented at 2010 Water Environment Federation Technical Exhibition and Conference, October 2 to 6, 2010. New Orleans, Louisiana.
Fitzpatrick, J., J. Broz1, S. Eisner, B. George, G. Hunter, T. Lu, G. Robinson, and A. Shields. 2013. Decades of Pathogen Protection with Auxiliary High-Rate Treatment Technologies. Paper presented at 2013 Water Environment Federation Technical Exhibition and Conference, October 5 to 9, 2013. Chicago, Illinois.
6-1

Summary of Wet Weather Wastewater Treatment Performance Data DRAFT – January 11, 2016
Fitzpatrick, J., J. Champion, J. Hutchins, S. McCreary, C.R. O’Bryan, T. Weaver, W. Young, and J. Ussher. 2015. Taking an Emerging Enhanced High-Rate Treatment Technology from Concept to 100-MGD Reality. Paper presented at 88th Annual Water Environment Federation Technical Exhibition and Conference, September 26–30, 2015, Chicago, Illinois.
Gelner, W.J., D. Miklos, C. Tabor, J. Sandino, J. Fitzpatrick, P.J. Bradley, D. Ott, and A. Jenkins. 2012. What Happens When Everyone “Flushes” at the Same Time? Paper presented at 2012 Water Environment Federation Technical Exhibition and Conference, September 29, 2012 - October 3, 2012, New Orleans, Louisiana.
Geurts, G.H. 2015. Heart of the Valley WWTP District Manager personal communication, February 18, 2015.
Gray, D.M., Y. Shang, J.M. Hake, V.P. De Lange, M.H. Chien, E.R. Gardner, J. Konnan, and S. Grinbergs. 2009. Characterizing the Quality of Effluent and Other Contributory Sources during Peak Wet Weather Events. WERF 03-CTS-12PP/PPa. Water Environment Research Foundation, Alexandria, VA, and IWA Publishing, London, UK.
Heath, G., P. Gsellman, G. Hanna, and D. Starkey. n.d. Pilot Testing of BIOACTIFLOTM for Wet Weather Treatment at the Akron, Ohio Water Reclamation Facility. Paper presented at 2014 Water Environment Federation Technical Exhibition and Conference, September 27, 2014 to October 1, 2014, New Orleans, Louisiana.
Melcer, H., A. Klein, G. Land, R. Butler, P. Carter, M. Ciolli, and R. Lilienthal. 2011. Revisiting a wet weather option: Optimizing chemically enhanced primary treatment. Water Environment Federation - WE&T Magazine. July 2011.
Murray, D. 2015. Evaluation of a Decentralized, High-Rate Wastewater Treatment Plant for Wet Weather Flows. PowerPoint presentation. EPA ORD National Risk Management Research Laboratory, Cincinnati Ohio.
Norton, J., K.Y. Bell, and J. Johnson. n.d. Pilot Plant Results of Biologically Enhanced High-Rate Clarification for Wet-Weather Treatment.
OHEPA (Ohio Environmental Protection Agency). 2014a. DMR Data for Outfall 603 Toledo Bay View WWTP. Ohio Environmental Protection Agency, Columbus, OH.
OHEPA (Ohio Environmental Protection Agency). 2014b. DMR Data for Outfall No 034 Newark WWTP. Ohio Environmental Protection Agency, Columbus, OH.
OHEPA (Ohio Environmental Protection Agency). 2014d. Summary DMR Data for Outfall 604 Port Clinton WWTP. Ohio Environmental Protection Agency, Columbus, OH.
OHEPA (Ohio Environmental Protection Agency). 2015. Summary DMR Data for Outfall 604 Sycamore Creek WWTP. Ohio Environmental Protection Agency, Columbus, OH.
Ponist, J., and D. Scheiter. 2006. Ballasted High Rate Clarification Process Removes City Of Greenfield, Indiana As A CSO Community. Paper presented at the 2006 Water Environment Federation Technical Exhibition and Conference, Dallas, Texas.
6-2

Summary of Wet Weather Wastewater Treatment Performance Data DRAFT – January 11, 2016
Rukovets, R.B., and B.J. Mitchell. 2010. Impact of Wet-Weather Peak Flow Blending on Disinfection and Treatment: A Case Study at Three Wastewater Treatment Plants. EPA/600/R-10/003. U.S. Environmental Protection Agency, Office of Research and Development, National Risk Management Research Laboratory, Water Supply and Water Resources Division, Cincinnati, OH.
Siczka, J., T. Smith, E. Hanna, G. Daigger, J. Cooper, and D. Frank. 2015. Using Existing Facility to Maximize the Wet Weather Treatment Capacity of the Akron, Ohio, Water Reclamation Facility: Sludge Settling Theory and State Point Analysis Do Not Characterize Ultimate Capacity of Shallow Clarifiers. Paper presented at 88th Annual Water Environment Federation Technical Exhibition and Conference (WEFTEC), September 26–30, 2015, Chicago, Illinois.
Wagner, D., M. Lawless, M. Hegeman, T. Wilson, R. Whaley, A. Ensz, A. Shields, and B. Sturm. 2015. City of Lawrence Wet Weather Flow Management and Performance.
Wooten A., J. Wesley, B. Featherston, and J. Loston. 2007. High Rate Clarifier Start-Up And Operation In Shreveport, Louisiana. Paper presented at the 2007 Water Environment Federation Technical Exhibition and Conference, October 13 to 17 October 2007 San Diego, California.
Yoon, Y.J., I.G. Park, M.K. Jung, D.H. Rhu, Y.J. Eum, and J.H. Min. 2012. Primary Treatment of Domestic Wastewater and Wet Weather Flow Using High Rate Up-flow Filtration System with Floating Media in Mega City Seoul. Paper presented at 2012 Water Environment Federation Technical Exhibition and Conference, September 29, 2012 - October 3, 2012, New Orleans, Louisiana.
6-3