Embed Size (px)
Citation preview

Wet Weather Planning for Wastewater Treatment Plants
June 23, 2017
Peak Flow Management: Collection vs. Treatment Collection System Peak Flow
Management Single 24 hour design storm I/I reduction SSO elimination by increasing system
capacity
WWTP Peak Flow Management All flows go to the WWTP Increased peak flows to the WWTP Single storm event is not indicative of wet
weather event Wet weather periods of longer duration
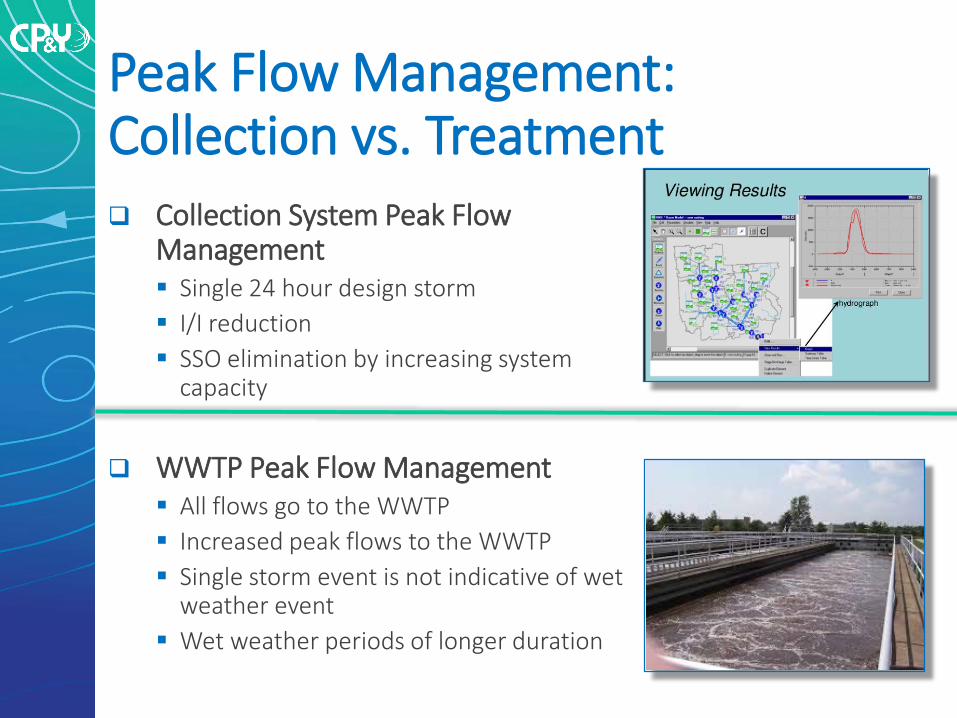
5 YR, 24 Hour Peak Flow Hydrograph
0 4 8 12 16 20 24
1.0
0
3.5
1.5
2.5
2.0
3.0
4.0
Time (Hrs)
Peak
Flo
w M
ultip
lier x
Qav
g
Collection System Hydrograph
SSO
sFl
ows M
eter
ed
Peak
at W
WTP

Pre I/I and SSO Reduction Program
Base Flow
Inflow
Infiltration
InflowInflow
Inflow
Infiltration
Infiltration
Infiltration
ManholeManhole
Manhole
Wastewater Treatment Plant
OverflowOverflow
Infiltration / Inflow
Base Flow
Plant Influent Flow
System Outflows
Flow Profile, Pre SSO Reduction
Overflow
2.5 x Qavg
1.5 x Qavg
Sanitary Sewer Overflows (SSOs)

5 YR, 24 Hour Peak Flow System Hydrograph
0 4 8 12 16 20 24
1.0
0
3.5
1.5
2.5
2.0
3.0
4.0
Time (Hrs)
Peak
Flo
w M
ultip
lier x
Qav
g
I/I Reduction & SSO Elimination
Proj
ecte
d Pe
ak F
low
s to
WW
TP
15% I/I Reduction

Post I/I and SSO Reduction Program
Base Flow
Infiltration
InflowInflow
InfiltrationManhole
Manhole
Manhole
Wastewater Treatment Plant
Surcharge
Inflow
Flow Profile Post SSO Reduction
I/I Reduction and SSO Elimination
Plant Influent Flow
System Outflows Eliminated
Infiltration / Inflow
Base Flow
3.25 x Qavg

Reality of I/I and SSO Reduction at the WWTP
Infiltration / Inflow
Base FlowPlant Influent
Flows
Collection System Outflows
Pre I/I and SSO Reduction
Infiltration / Inflow
Base Flow
Post I/I and SSO Reduction
Increased Peak Flow
3.25
x Q
avg
2.5
x Q
avg

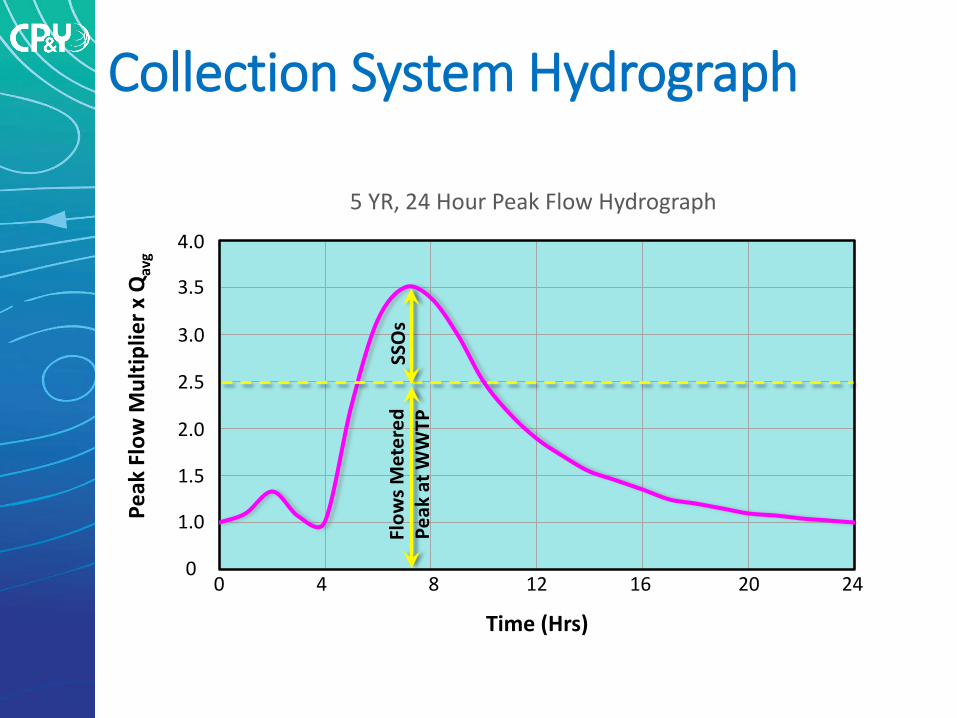
Wet Weather Event Duration Peak wet weather flows to WWTPs are not
representative of a single 5-yr. 24 hr. Storm event Typical wet weather events last 7 to 10 days Events may not or may not contain a 5-yr. 24 storm event Daily rainfall totals are key to designing a representative
Wet Weather Event
Rainfall Hydrographs
Building Representative WWE Flow 7Q
4Q
3Q
2Q
1Q
0
5Q
6Q
24 168 192 2161441209672480
Time (Hrs)
Flow
(MG
D)
240 48
Coupling SS Modeling Results w/ Measured Flows
WWE Recorded Influent Flow (Q)Modeled Hydrographs for WWE Daily Rainfall

Representative WWE Design Flows
7Q
4Q
3Q
2Q
1Q
0
5Q
6Q
24 168 192 2161441209672480
Time (Hrs)
Flow
(MG
D)
Recorded Flow Data Coupled w/ SS Modeling Results
Design WWE (Q)Recorded Influent Flow (Q)Historical Diurnal Flow Pattern (Q)
2 hr. Peaks
Average Sustained Peak Flow

Historic Peak Rainfall Intensity

Peak TSS Loadings “Pollutographs”

Developing Peak Solids (TSS) Loading
Requires data sets; Peak TSS concentration for increasing antecedent dry
weather conditions. Peak TSS loadings during measured peak influent flows.
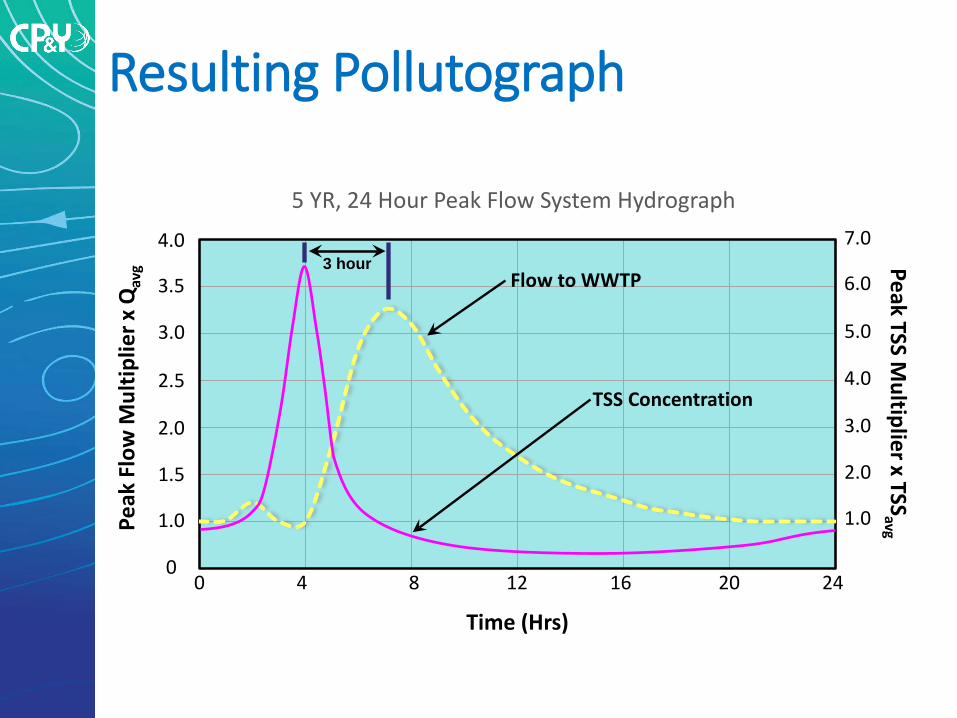
5 YR, 24 Hour Peak Flow System Hydrograph
0 4 8 12 16 20 24
1.0
0
3.5
1.5
2.5
2.0
3.0
4.0
1.0
6.0
2.0
4.0
3.0
5.0
7.0
Time (Hrs)
Peak
Flo
w M
ultip
lier x
Qav
g
Resulting Pollutograph
Flow to WWTP
TSS Concentration
Peak TSS Multiplier x TSS
avg
3 hour

Design WWE Solids Loading Profile:“First Flush Pollutograph”
7Q
4Q
3Q
2Q
1Q
0
5Q
6Q
24 168 192 2161441209672480
Time (Hrs)
Flow
(Q)
1,400
1,200
1,000
800
600
400
200
0
TSS
( mg/
L)
Design WWE (Q)Historical Diurnal Flow Pattern (Q)TSS Concentration (mg/L)
15 hour1,380 mg/L
2.2 Q
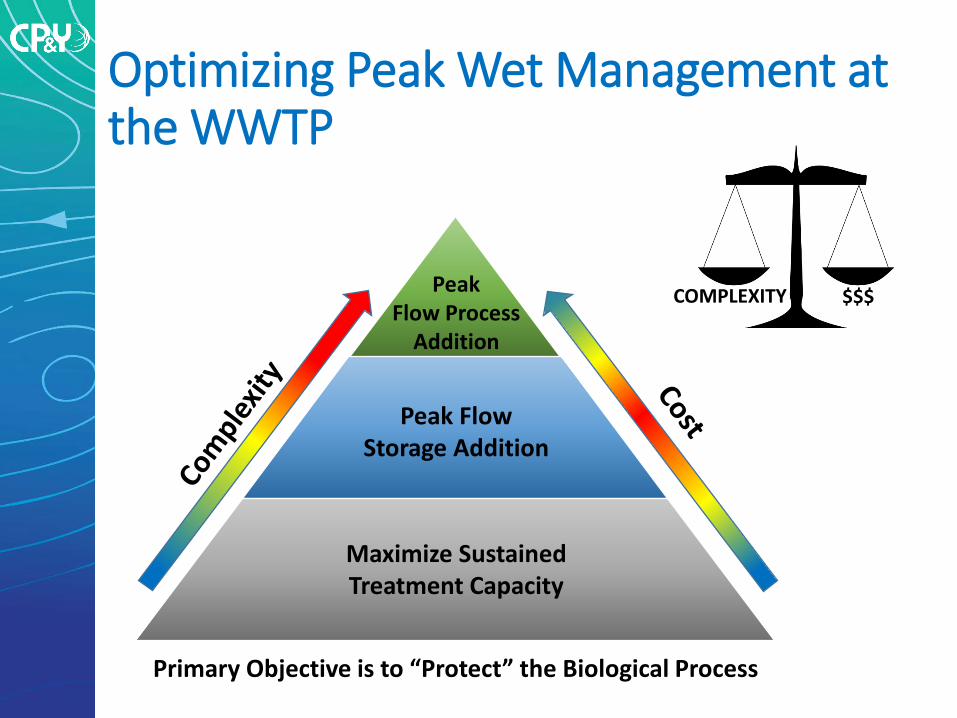
Optimizing Peak Wet Management at the WWTP
Peak Flow Process
Addition
Peak Flow Storage Addition
Maximize Sustained Treatment Capacity
Primary Objective is to “Protect” the Biological Process
$$$COMPLEXITY

7Q
4Q
3Q
2Q
1Q
0
5Q
6Q
24 168 192 2161441209672480
Time (Hrs)
Flow
(Q)
1,400
1,200
1,000
800
600
400
200
0
TSS
( mg/
L)
Design WWE (Q)Historical Diurnal Flow Pattern (Q)Total Mass Loading (mg/L)Sustained Treatment Capacity
Excess Flow
Sustained Treatment
Sustained Treatment Capacity & Remaining Excess Flow
3.8 Q

Step Feed Addition Maximizes Sustained Peak Flow Treatment
Primary Clarifier
Aeration Basin
Secondary Clarifier Effluent FiltersVortex Grit
Disinfection
Step Feed Arrangement
RAS
Step Feed
Cost effective, no permitting required, and slightly increases complexity.
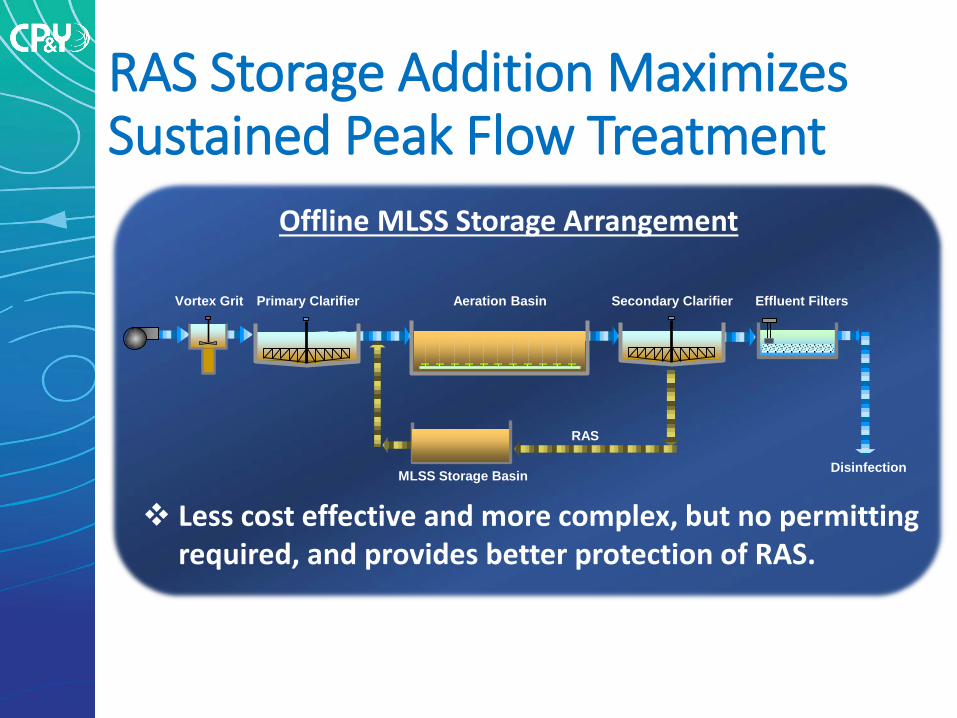
Primary Clarifier Aeration Basin Secondary Clarifier Effluent FiltersVortex Grit
DisinfectionMLSS Storage Basin
Offline MLSS Storage Arrangement
RAS Storage Addition Maximizes Sustained Peak Flow Treatment
RAS
Less cost effective and more complex, but no permitting required, and provides better protection of RAS.

Addition of Offline Storage Increases Peak Flow Capacity
Primary Clarifier Aeration Basin Secondary Clarifier Effluent FiltersVortex Grit
Disinfection
Raw Offline Influent Storage
EQ Basins
Cost effective, easily permitted, but increases complexity, and isn’t as aesthetically acceptable.
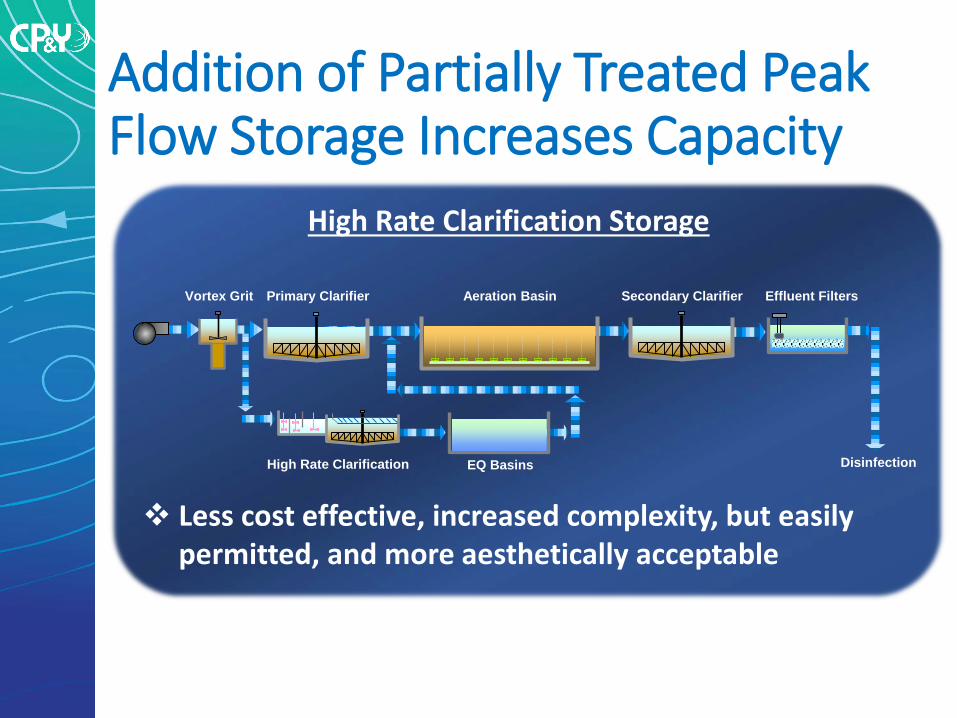
Addition of Partially Treated Peak Flow Storage Increases Capacity
Primary Clarifier Aeration Basin Secondary Clarifier Effluent FiltersVortex Grit
Disinfection
High Rate Clarification Storage
EQ BasinsHigh Rate Clarification
Less cost effective, increased complexity, but easily permitted, and more aesthetically acceptable

Addition of Parallel Phys./Chem. Process Increases Treatment Capacity
Primary Clarifier Aeration Basin Secondary Clarifier Effluent FiltersVortex Grit
High Rate Clarification Disinfection
Enhanced High Rate Clarification
Cost effective, but difficult to permit, and complex to operate intermittently.

Addition of Parallel Peak Flow Biological Process Increases Treatment Capacity
Primary Clarifier Aeration Basin Secondary Clarifier Effluent FiltersVortex Grit
High Rate Biological Process
High Rate Biological Treatment Arrangement
Disinfection
Less cost effective and more complex to operate intermittently, but easily permitted.

Analyze Conventional/High Rate Treatment vs. Storage
7Q
4Q
3Q
2Q
1Q
0
5Q
6Q
24 168 192 2161441209672480
Time (Hrs)
Flow
(Q)
1,400
1,200
1,000
800
600
400
0
TSS
( mg/
L)
Design WWE (Q)Peak Flow Treatment Capacity (Q)Total Mass Loading (mg/L)Sustained Treatment Capacity (Q)
Storage Volume
200
Peak Flow Treatment
Sustained Conventional Treatment
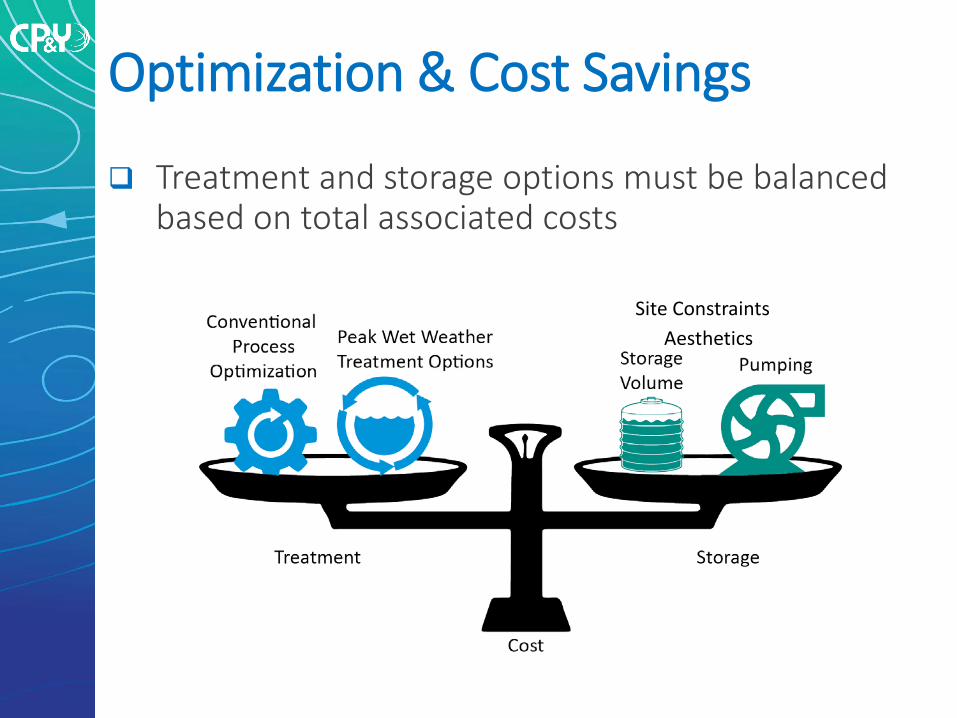
Optimization & Cost Savings
Treatment and storage options must be balanced based on total associated costs
Site ConstraintsAesthetics

Question & Answers