Embed Size (px)
Citation preview
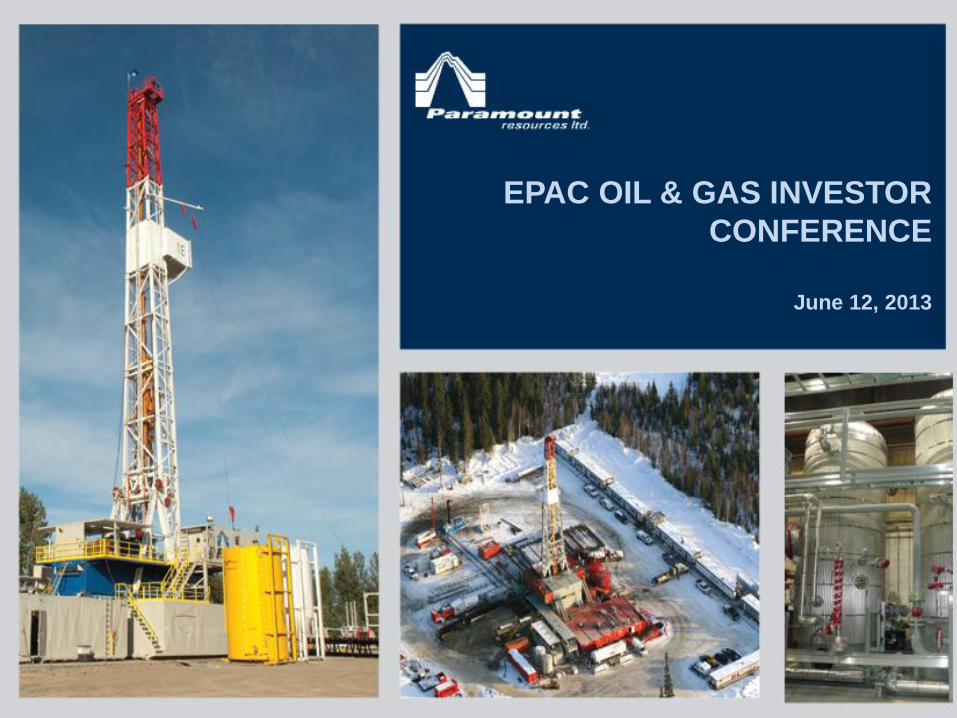
EPAC OIL & GAS INVESTOR
CONFERENCE
June 12, 2013
1
• In the interest of providing information regarding Paramount Resources Ltd.
("Paramount" or the "Company"), including management's assessment of
the Company's future plans and operations, this presentation contains
certain forward-looking information and forward-looking statements.
• The projections, estimates and beliefs contained in such forward-looking
information and statements necessarily involve a number of assumptions
and are subject to known and unknown risks and uncertainties which may
cause the Company's actual performance and financial results in future
periods to differ materially from any estimates or projections of future
performance or results expressed or implied by such forward-looking
statements. The material assumptions, risks and uncertainties are referred
to in the advisories contained in Appendix A.
• Accordingly, shareholders and potential investors are cautioned that events
or circumstances could cause actual results to differ materially from those
predicted.
• Any use of information contained within this presentation is expressly
forbidden.
Future Oriented Information (See additional advisories at the end of this document)
2
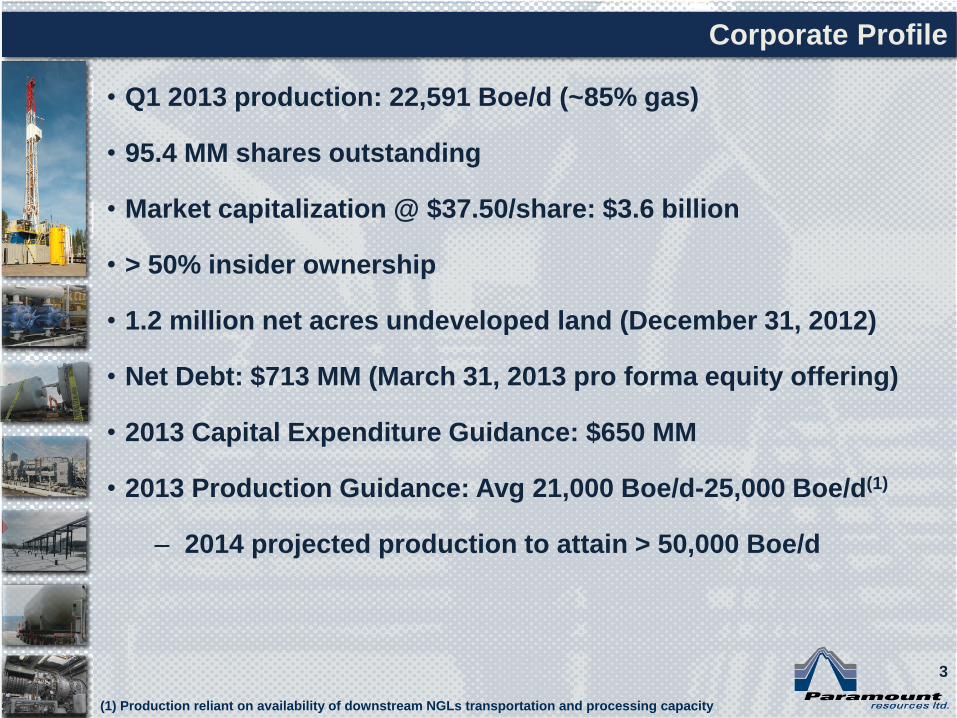
• Q1 2013 production: 22,591 Boe/d (~85% gas)
• 95.4 MM shares outstanding
• Market capitalization @ $37.50/share: $3.6 billion
• > 50% insider ownership
• 1.2 million net acres undeveloped land (December 31, 2012)
• Net Debt: $713 MM (March 31, 2013 pro forma equity offering)
• 2013 Capital Expenditure Guidance: $650 MM
• 2013 Production Guidance: Avg 21,000 Boe/d-25,000 Boe/d(1)
– 2014 projected production to attain > 50,000 Boe/d
Corporate Profile
(1) Production reliant on availability of downstream NGLs transportation and processing capacity
3
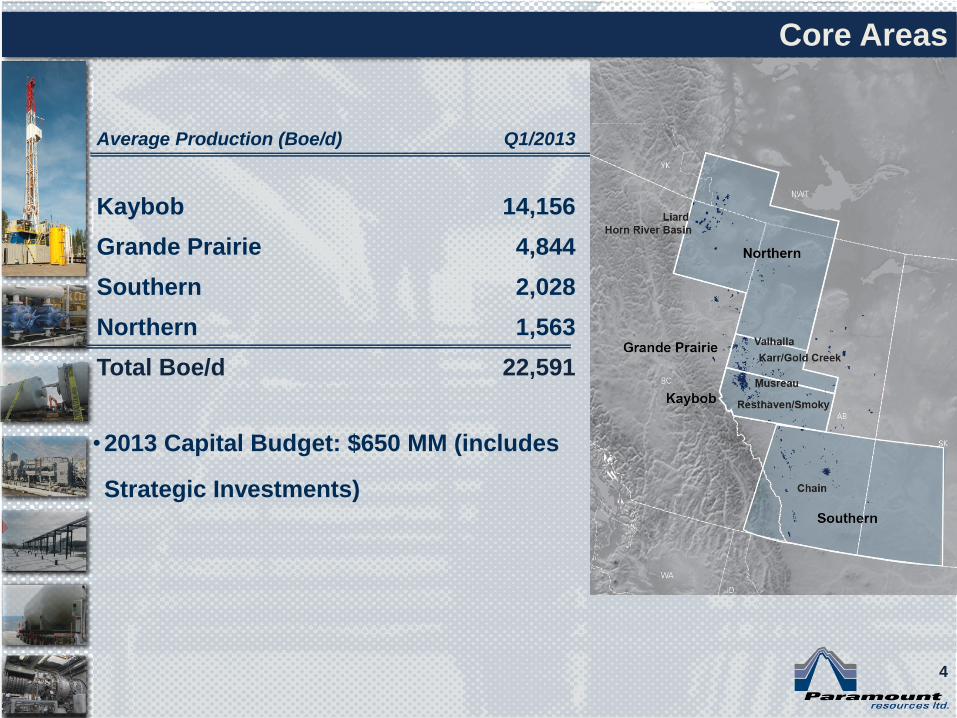
Average Production (Boe/d) Q1/2013
Kaybob 14,156
Grande Prairie 4,844
Southern 2,028
Northern 1,563
Total Boe/d 22,591
Core Areas
•2013 Capital Budget: $650 MM (includes
Strategic Investments)
4
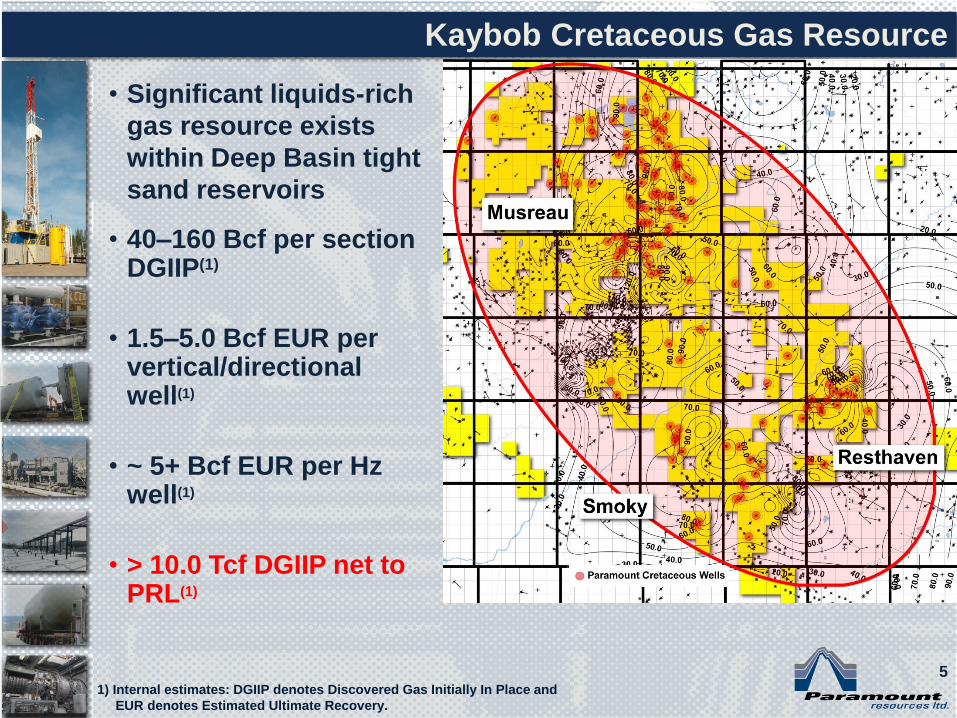
• Significant liquids-rich
gas resource exists
within Deep Basin tight
sand reservoirs
• 40–160 Bcf per section DGIIP(1)
• 1.5–5.0 Bcf EUR per vertical/directional well(1)
• ~ 5+ Bcf EUR per Hz well(1)
• > 10.0 Tcf DGIIP net to PRL(1)
Kaybob Cretaceous Gas Resource
1) Internal estimates: DGIIP denotes Discovered Gas Initially In Place and
EUR denotes Estimated Ultimate Recovery.
70 Bcf/Section Average DGIIP(1)
CRETACEOUS GAS SANDS DGIIP PER SECTION
5
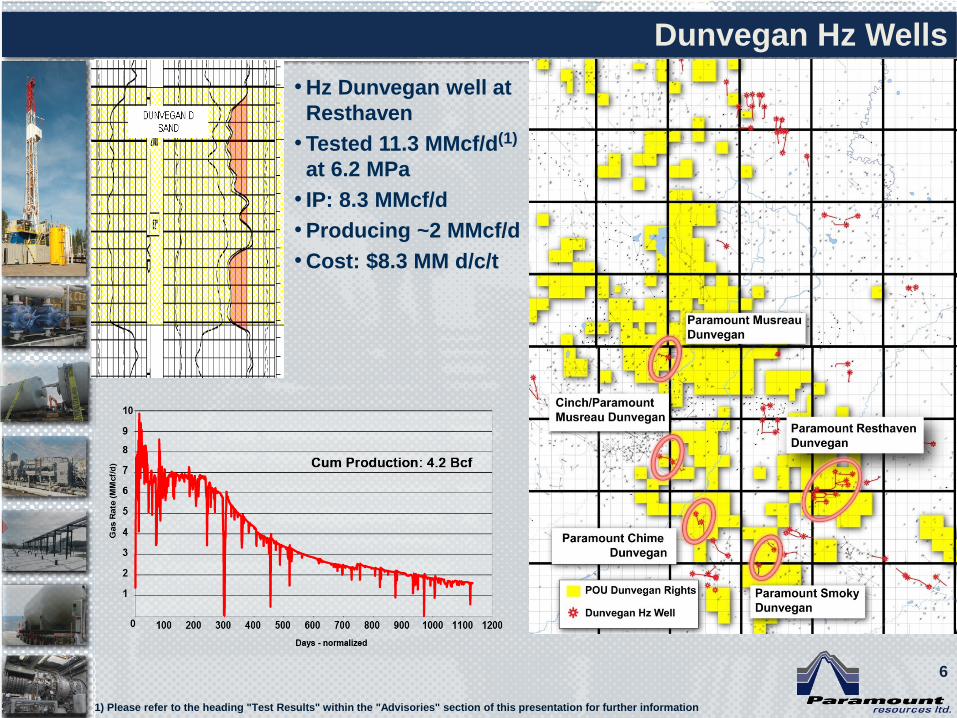
Dunvegan Hz Wells
•Hz Dunvegan well at
Resthaven
•Tested 11.3 MMcf/d(1)
at 6.2 MPa
• IP: 8.3 MMcf/d
•Producing ~2 MMcf/d
•Cost: $8.3 MM d/c/t
1) Please refer to the heading "Test Results" within the "Advisories" section of this presentation for further information
6

• Hz Falher well at
Musreau
• Tested 16.4 MMcf/d(1)
at 20.8 MPa
• IP: 12 MMcf/d
• Producing ~2 MMcf/d
• Cost: $8.6 MM d/c/t
Falher Hz Wells
1) Please refer to the heading "Test Results" within the "Advisories" section of this presentation for further information
7
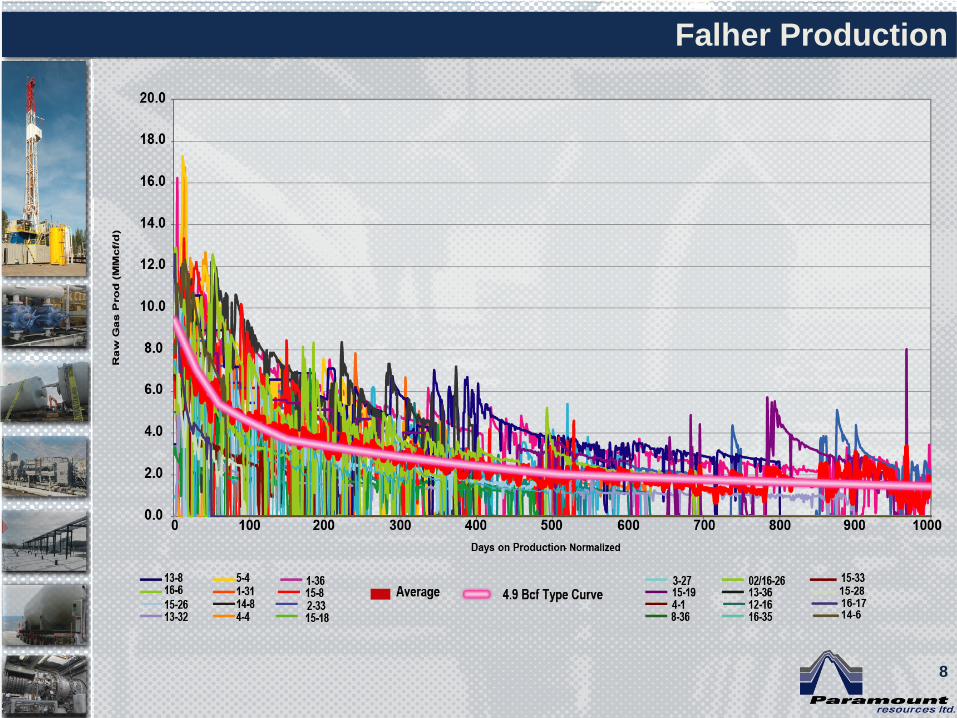
Falher Production
8
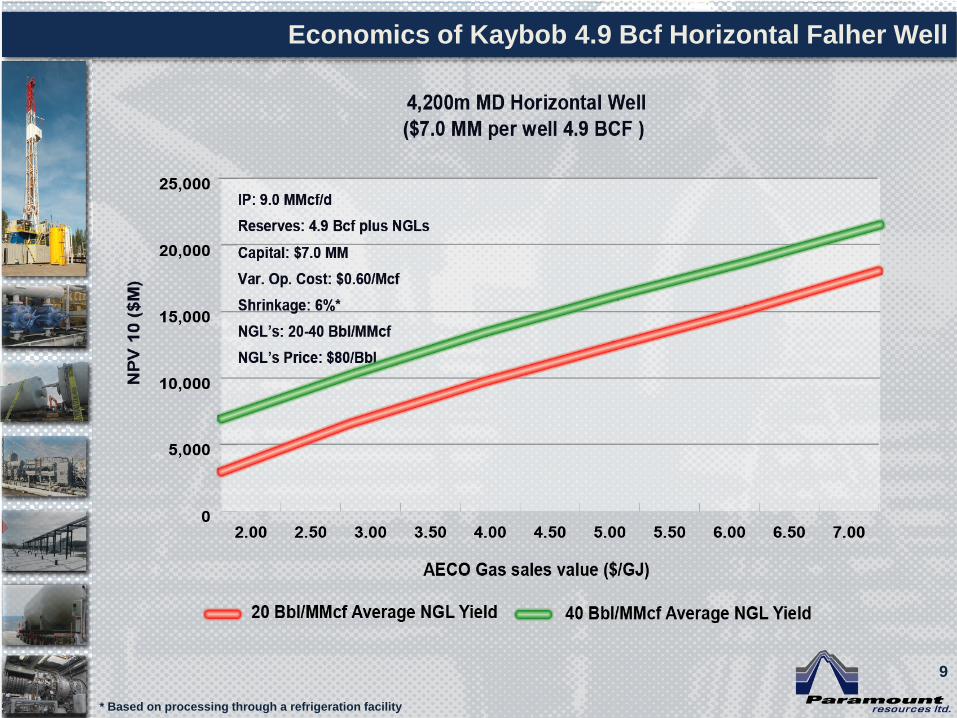
Economics of Kaybob 4.9 Bcf Horizontal Falher Well
* Based on processing through a refrigeration facility
9
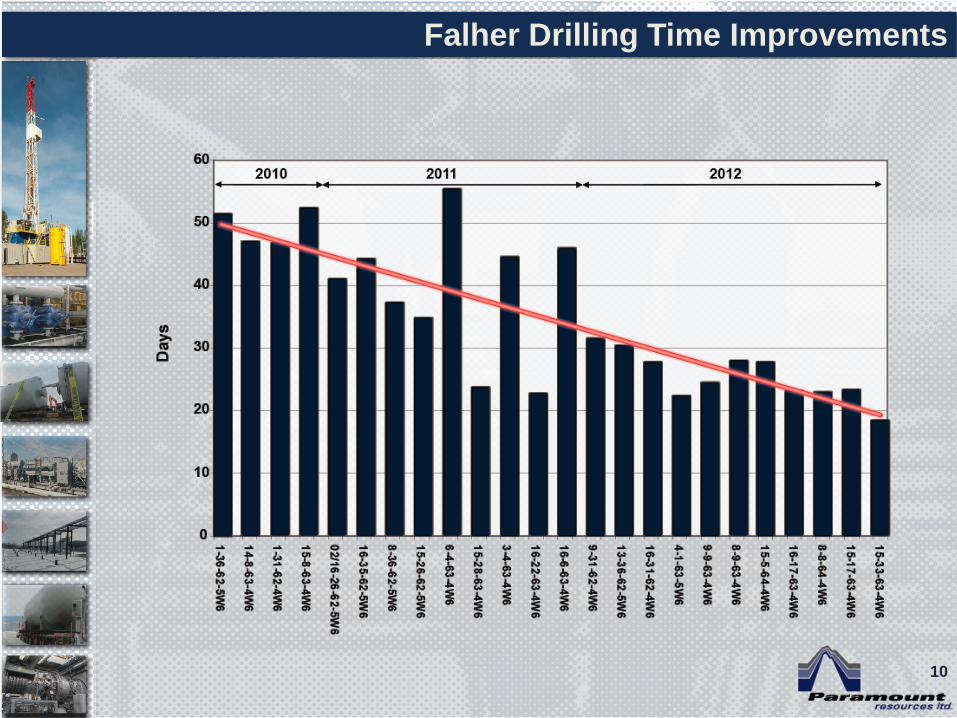
Falher Drilling Time Improvements
10
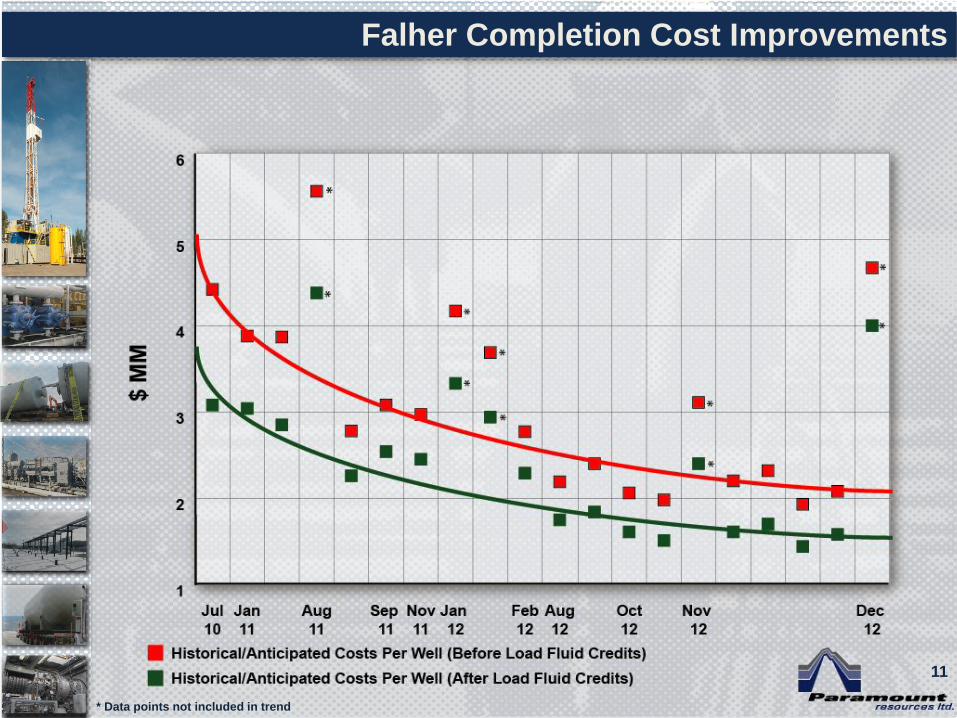
Falher Completion Cost Improvements
* Data points not included in trend
11
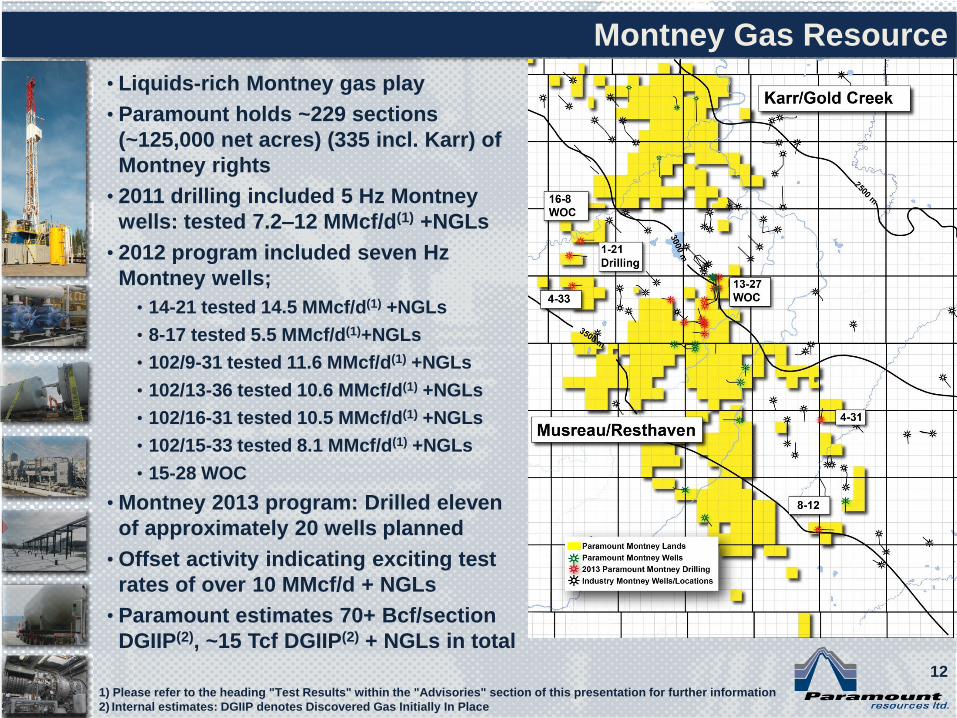
• Liquids-rich Montney gas play
• Paramount holds ~229 sections
(~125,000 net acres) (335 incl. Karr) of
Montney rights
• 2011 drilling included 5 Hz Montney
wells: tested 7.2–12 MMcf/d(1) +NGLs
• 2012 program included seven Hz
Montney wells;
• 14-21 tested 14.5 MMcf/d(1) +NGLs
• 8-17 tested 5.5 MMcf/d(1)+NGLs
• 102/9-31 tested 11.6 MMcf/d(1) +NGLs
• 102/13-36 tested 10.6 MMcf/d(1) +NGLs
• 102/16-31 tested 10.5 MMcf/d(1) +NGLs
• 102/15-33 tested 8.1 MMcf/d(1) +NGLs
• 15-28 WOC
• Montney 2013 program: Drilled eleven
of approximately 20 wells planned
• Offset activity indicating exciting test
rates of over 10 MMcf/d + NGLs
• Paramount estimates 70+ Bcf/section
DGIIP(2), ~15 Tcf DGIIP(2) + NGLs in total
Montney Gas Resource
1) Please refer to the heading "Test Results" within the "Advisories" section of this presentation for further information
2) Internal estimates: DGIIP denotes Discovered Gas Initially In Place
12
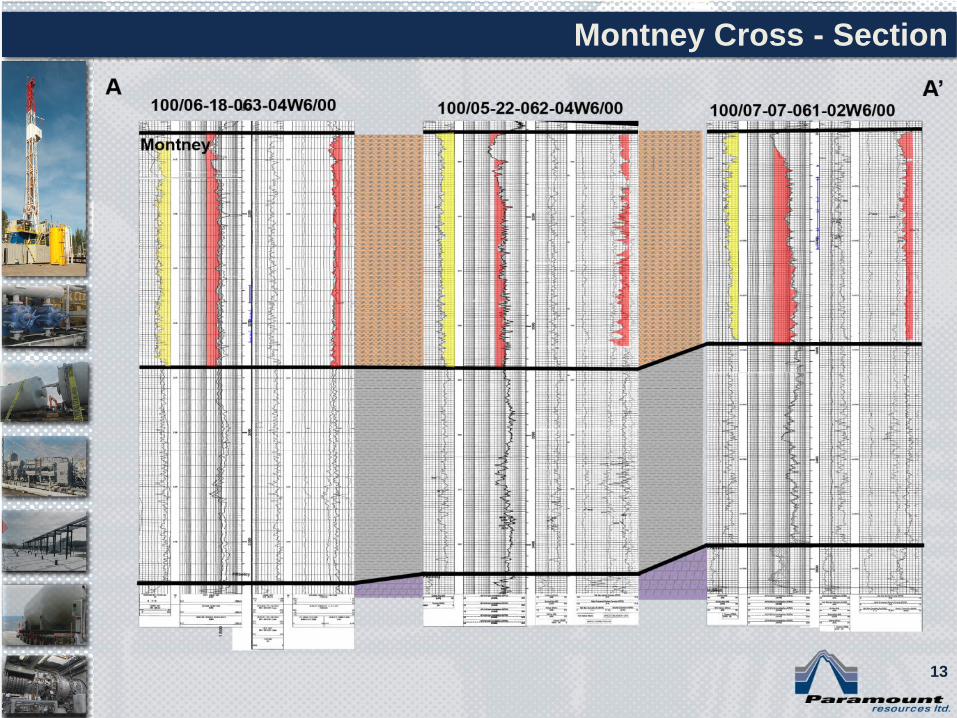
Montney Cross - Section
13
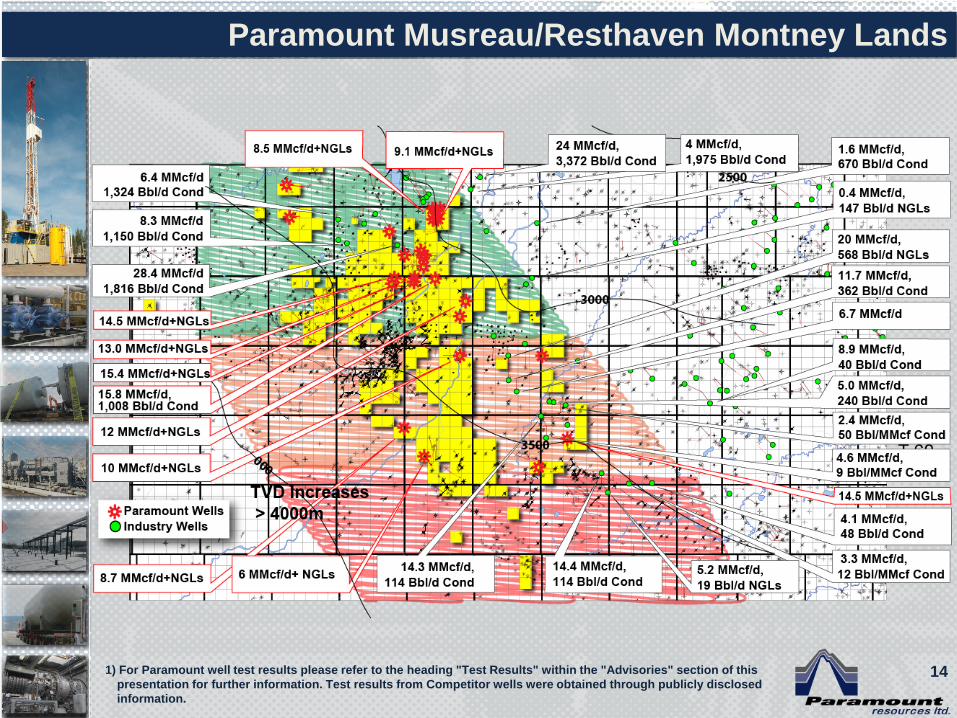
Paramount Musreau/Resthaven Montney Lands
1) For Paramount well test results please refer to the heading "Test Results" within the "Advisories" section of this
presentation for further information. Test results from Competitor wells were obtained through publicly disclosed
information.
14
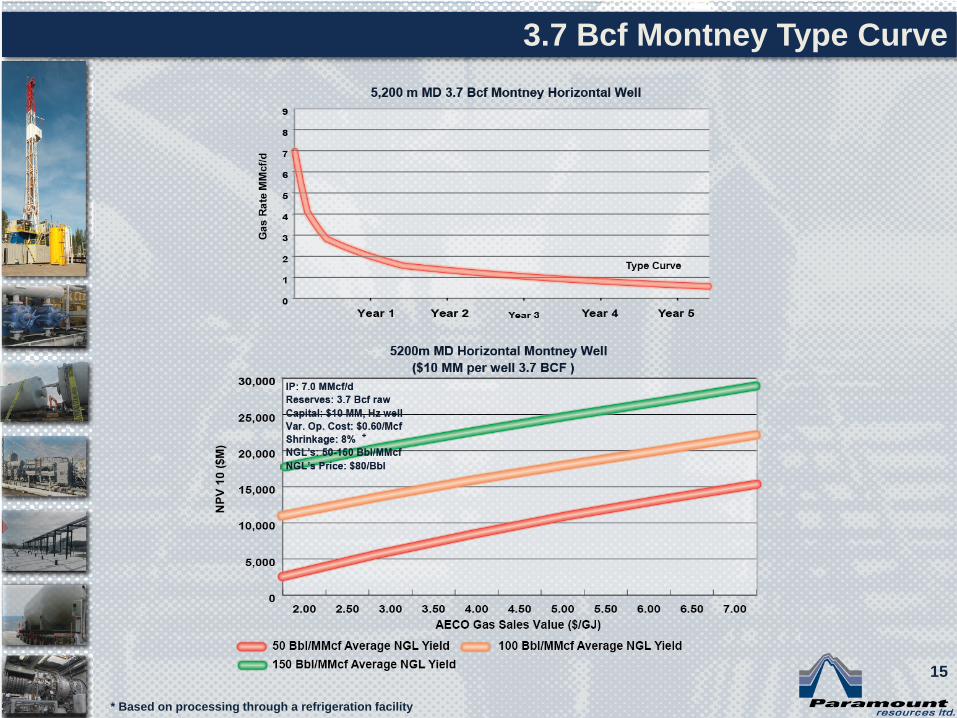
3.7 Bcf Montney Type Curve
* Based on processing through a refrigeration facility
15
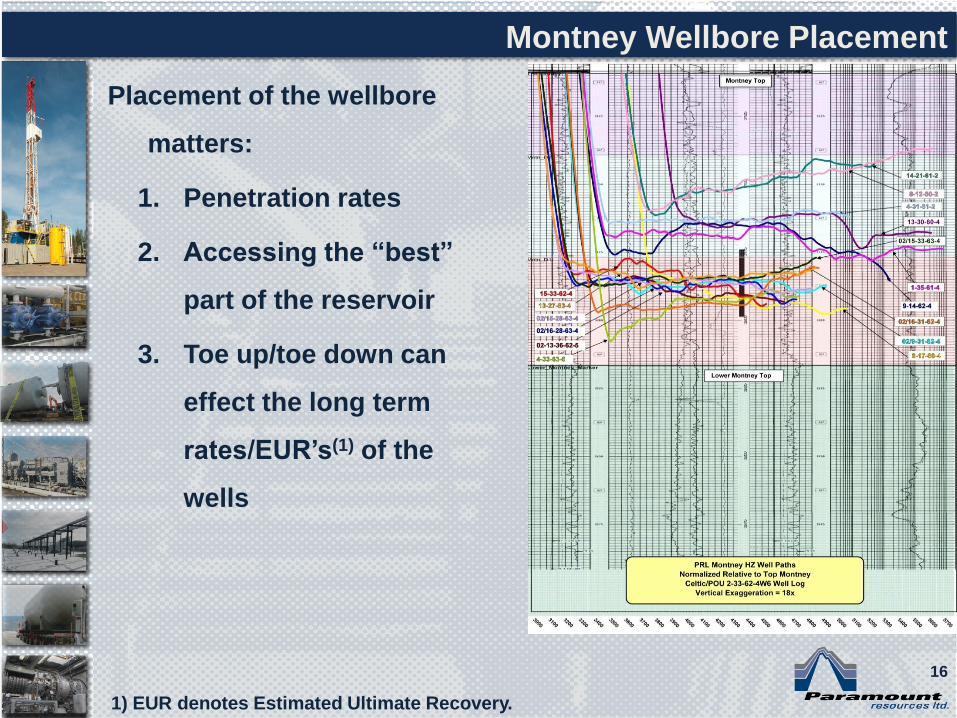
Placement of the wellbore
matters:
1. Penetration rates
2. Accessing the “best”
part of the reservoir
3. Toe up/toe down can
effect the long term
rates/EUR’s(1) of the
wells
Montney Wellbore Placement
1) EUR denotes Estimated Ultimate Recovery.
16
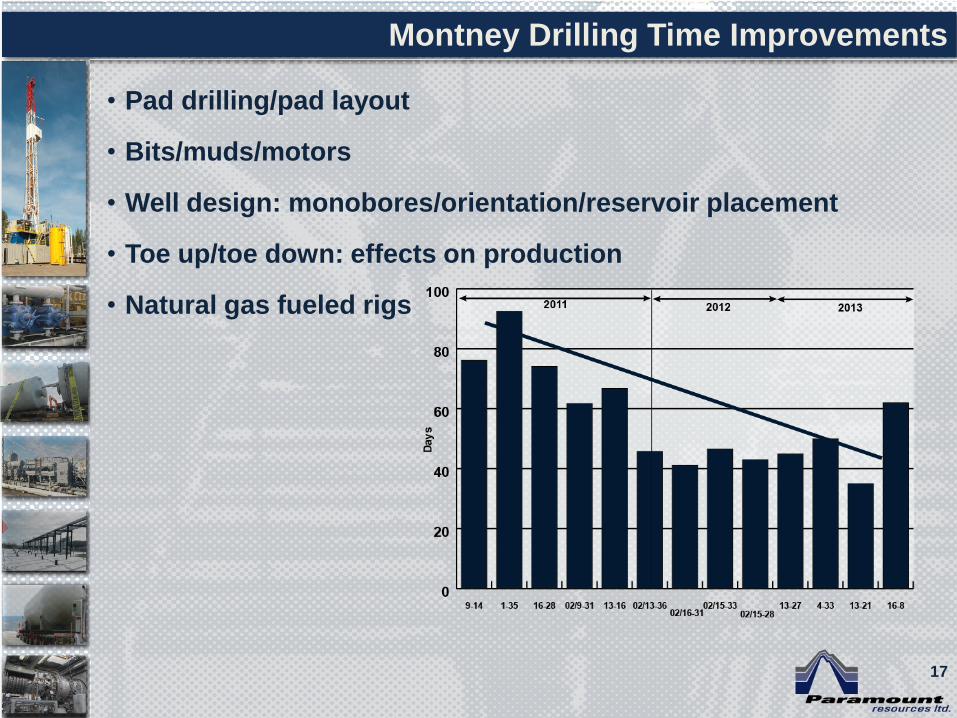
• Pad drilling/pad layout
• Bits/muds/motors
• Well design: monobores/orientation/reservoir placement
• Toe up/toe down: effects on production
• Natural gas fueled rigs
Montney Drilling Time Improvements
17
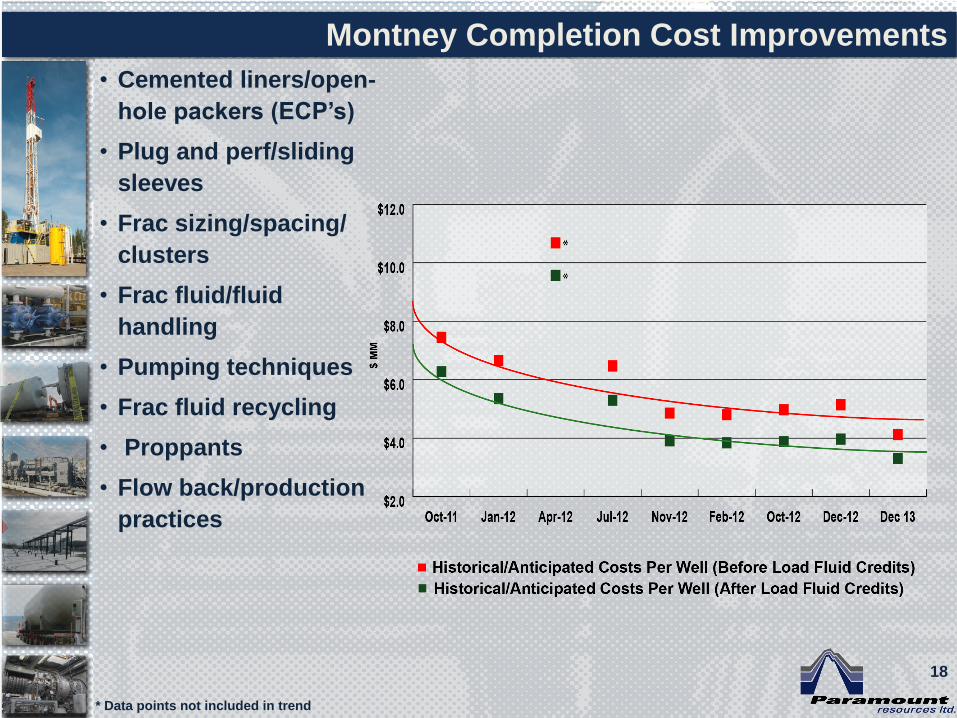
• Cemented liners/open-
hole packers (ECP’s)
• Plug and perf/sliding
sleeves
• Frac sizing/spacing/
clusters
• Frac fluid/fluid
handling
• Pumping techniques
• Frac fluid recycling
• Proppants
• Flow back/production
practices
Montney Completion Cost Improvements
* Data points not included in trend
18
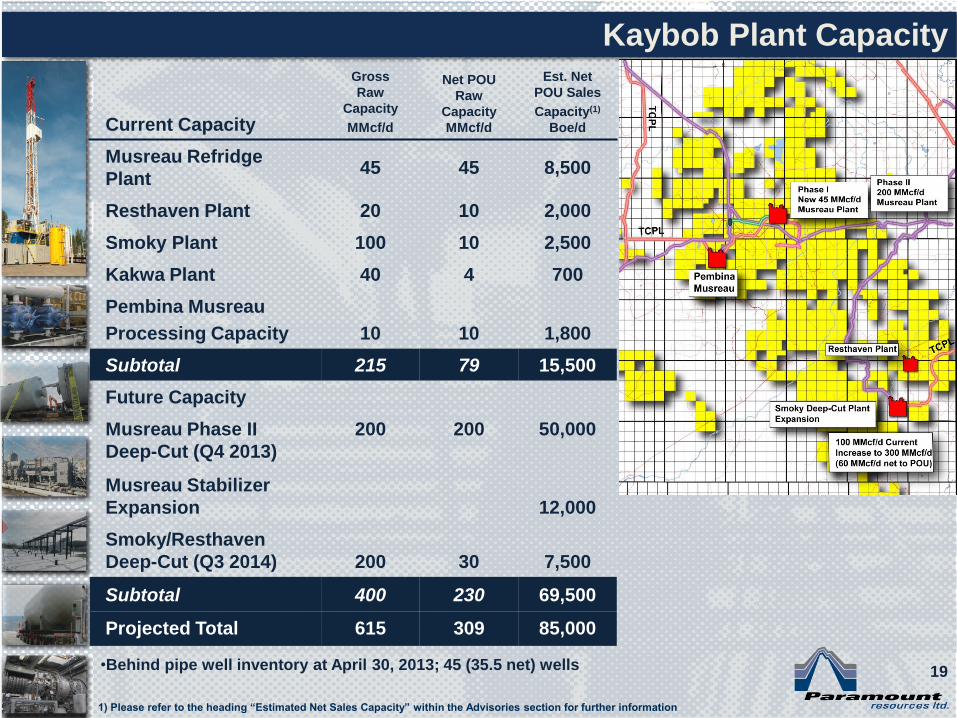
Current Capacity
Gross
Raw
Capacity
MMcf/d
Net POU
Raw
Capacity
MMcf/d
Est. Net
POU Sales
Capacity(1)
Boe/d
Musreau Refridge
Plant 45 45 8,500
Resthaven Plant 20 10 2,000
Smoky Plant 100 10 2,500
Kakwa Plant 40 4 700
Pembina Musreau
Processing Capacity 10 10 1,800
Subtotal 215 79 15,500
Future Capacity
Musreau Phase II
Deep-Cut (Q4 2013)
200 200 50,000
Musreau Stabilizer
Expansion 12,000
Smoky/Resthaven
Deep-Cut (Q3 2014) 200 30 7,500
Subtotal 400 230 69,500
Projected Total 615 309 85,000
Kaybob Plant Capacity
•Behind pipe well inventory at April 30, 2013; 45 (35.5 net) wells
1) Please refer to the heading “Estimated Net Sales Capacity” within the Advisories section for further information
19
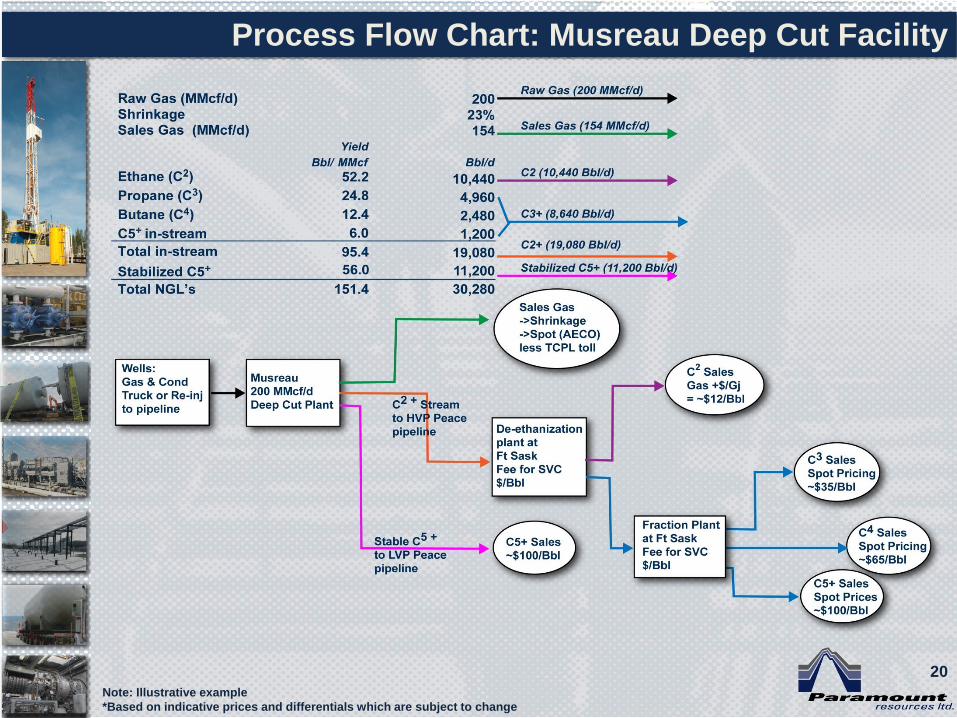
Process Flow Chart: Musreau Deep Cut Facility
Note: Illustrative example
*Based on indicative prices and differentials which are subject to change
20
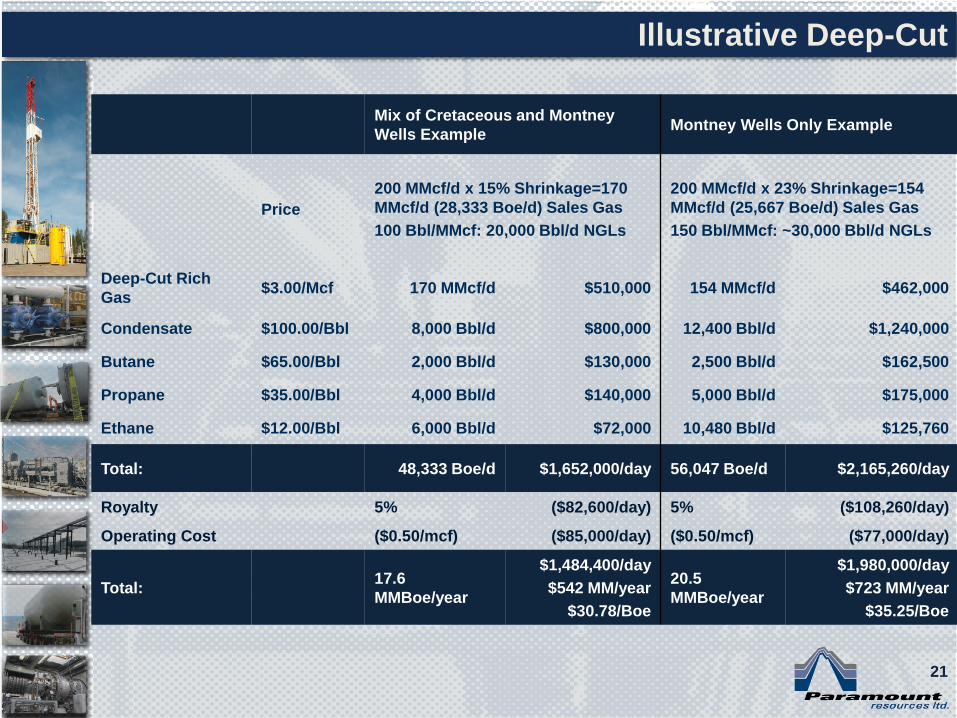
Mix of Cretaceous and Montney
Wells Example Montney Wells Only Example
Price
200 MMcf/d x 15% Shrinkage=170
MMcf/d (28,333 Boe/d) Sales Gas
100 Bbl/MMcf: 20,000 Bbl/d NGLs
200 MMcf/d x 23% Shrinkage=154
MMcf/d (25,667 Boe/d) Sales Gas
150 Bbl/MMcf: ~30,000 Bbl/d NGLs
Deep-Cut Rich
Gas $3.00/Mcf 170 MMcf/d $510,000 154 MMcf/d $462,000
Condensate $100.00/Bbl 8,000 Bbl/d $800,000 12,400 Bbl/d $1,240,000
Butane $65.00/Bbl 2,000 Bbl/d $130,000 2,500 Bbl/d $162,500
Propane $35.00/Bbl 4,000 Bbl/d $140,000 5,000 Bbl/d $175,000
Ethane $12.00/Bbl 6,000 Bbl/d $72,000 10,480 Bbl/d $125,760
Total: 48,333 Boe/d $1,652,000/day 56,047 Boe/d $2,165,260/day
Royalty 5% ($82,600/day) 5% ($108,260/day)
Operating Cost ($0.50/mcf) ($85,000/day) ($0.50/mcf) ($77,000/day)
Total: 17.6
MMBoe/year
$1,484,400/day
$542 MM/year
$30.78/Boe
20.5
MMBoe/year
$1,980,000/day
$723 MM/year
$35.25/Boe
Illustrative Deep-Cut
21
• Paramount’s shallow rights will add substantially to the RLI
• Paramount has de-risked a substantial amount of its land base and
thus could have the potential to do this many times
• Simple Payout after start up is 1.1 - 1.75 years
Paramount Deep-Cut Montney - Illustrative Project Economics
Resource Needed:
200 MMcf/d x 365 ~ 73 Bcf/year x 10 year RLI = 730 Bcf
70 Bcf/section @ ~ 50% recovery = ~ 20 Sections
Cost
40 (5 MMcf/d wells) x $10 MM/well = $400 MM
Gas Plant = $200 MM
Total: $600 MM
Annual Deep-Cut Cash
Flow
$542 MM/year - $723 MM/year
Annual Capital = 20 (3.5 Bcf) wells x $10 MM/well $200 MM/year
Free Cash Flow $342 MM - $523 MM/year
22
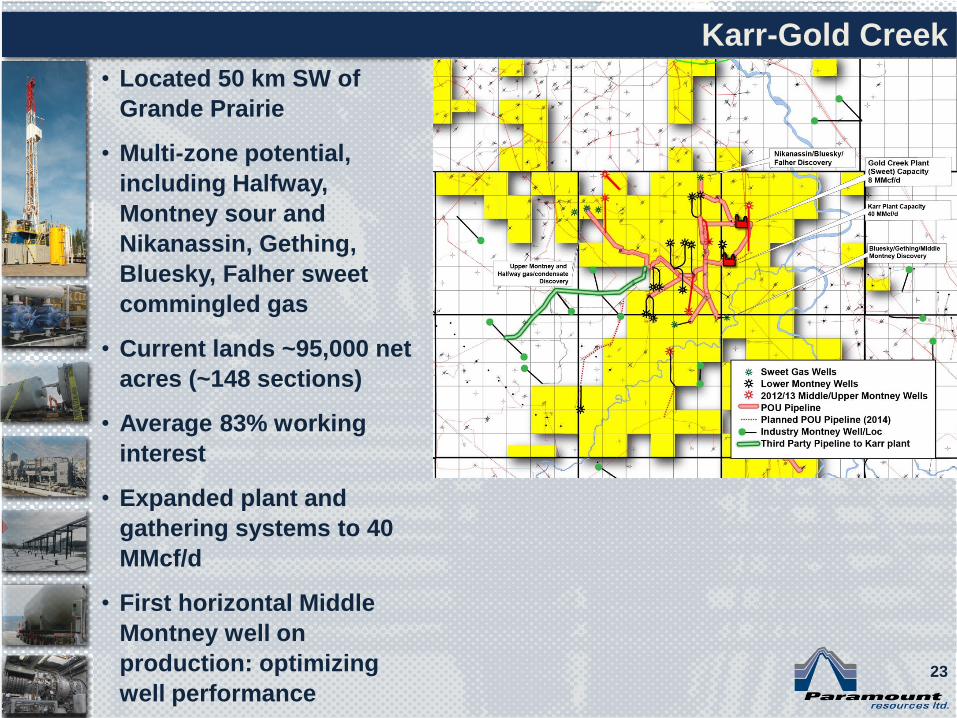
• Located 50 km SW of
Grande Prairie
• Multi-zone potential,
including Halfway,
Montney sour and
Nikanassin, Gething,
Bluesky, Falher sweet
commingled gas
• Current lands ~95,000 net
acres (~148 sections)
• Average 83% working
interest
• Expanded plant and
gathering systems to 40
MMcf/d
• First horizontal Middle
Montney well on
production: optimizing
well performance
Karr-Gold Creek
23
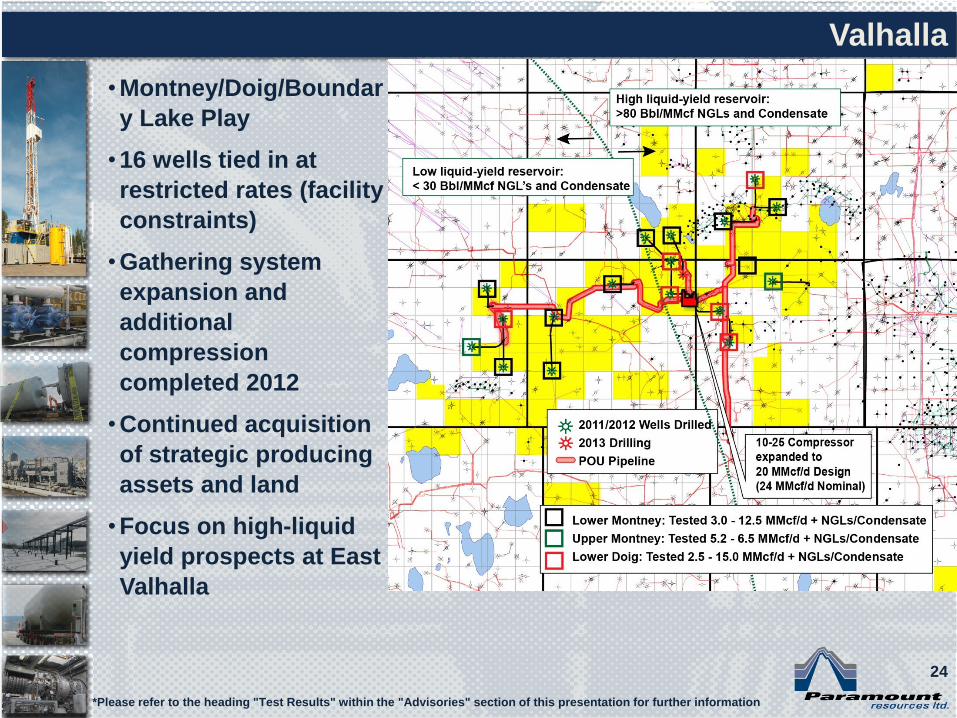
•Montney/Doig/Boundar
y Lake Play
•16 wells tied in at
restricted rates (facility
constraints)
•Gathering system
expansion and
additional
compression
completed 2012
•Continued acquisition
of strategic producing
assets and land
•Focus on high-liquid
yield prospects at East
Valhalla
Valhalla
*Please refer to the heading "Test Results" within the "Advisories" section of this presentation for further information
24
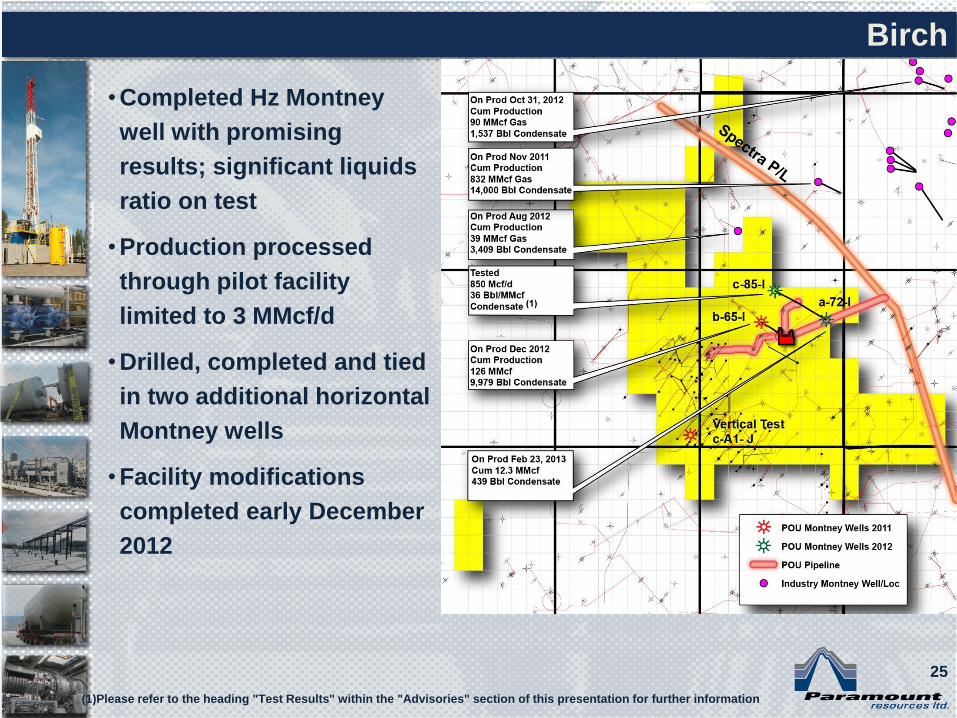
•Completed Hz Montney
well with promising
results; significant liquids
ratio on test
•Production processed
through pilot facility
limited to 3 MMcf/d
•Drilled, completed and tied
in two additional horizontal
Montney wells
•Facility modifications
completed early December
2012
Birch
(1)Please refer to the heading "Test Results" within the "Advisories" section of this presentation for further information
25
PARAMOUNT INVESTMENTS
26
CAVALIER ENERGY INC.
28
• Created in December 2011
• Experienced team led by CEO Dr. Will Roach (ex UTS)
• Paramount has contributed its oilsands assets and seed
capital to Cavalier Energy
• Funding at the Cavalier level will be via a combination of
equity and debt
• Assets retained as 100% WI within Cavalier Energy
• Regulatory application for the development of the first 10,000
Bbl/d SAGD project at Hoole filed November 2012
Cavalier Energy Inc.
29
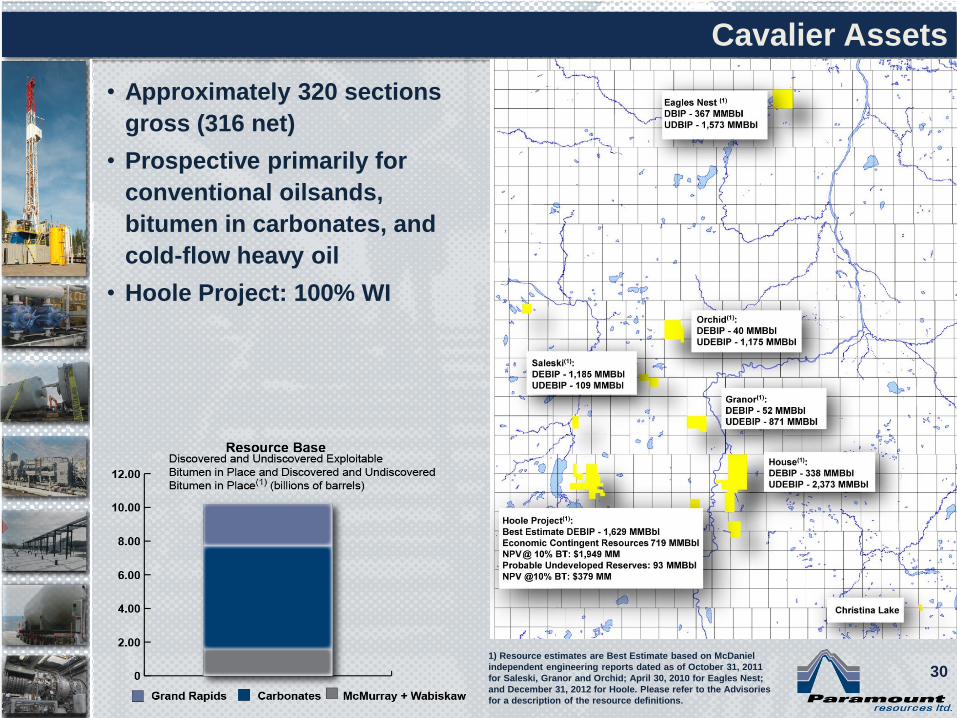
• Approximately 320 sections
gross (316 net)
• Prospective primarily for
conventional oilsands,
bitumen in carbonates, and
cold-flow heavy oil
• Hoole Project: 100% WI
Cavalier Assets
1) Resource estimates are Best Estimate based on McDaniel
independent engineering reports dated as of October 31, 2011
for Saleski, Granor and Orchid; April 30, 2010 for Eagles Nest;
and December 31, 2012 for Hoole. Please refer to the Advisories
for a description of the resource definitions.
30
UWID: 1AA/06-13-081-24W4/00 Well Name: PARA HOOLE 6-13-81-24 ~~~~~~~~~~~~~~~~~~~~~~~~~~~~~~~~~~~~~~~~~~~~~~~~~~~~~~~~~~~~~~~~~~~~~~~~~~~~~~~~~~~~~~~~~~~~ CURR OPER: Paramount Rsrcs Ltd [0AW4] LIC#: 0302898 ORIG OPER: Paramount Rsrcs Ltd [%463] Date: 2004/01/28 LIC Substance: Crude Bitumen
GOVT KB: 614.1m GL: 609.9m MD: TVD: 483.0m LOGS KB: 613.9m GL: 609.9m PROJ DPTH: 482.0m PROJ FM@TD: Dwabamun FM@TD: Kmcmurray
BH COORDS: N 583.6m SW 13-081-24W4 BH LAT: 56°1'7.104" N : E 608.9m BH LON:113°37'21.648" W
SPUD: 2004/02/25 CMPL DRL: 2004/02/27 DAYS: 3 RR: 2004/02/28 DRL RIG: Artisan Corp #32
STAT: 2004/01/28 Location;2004/02/28 Drld & ABD CASG: 177.8mm SRF @ 126.0m LOGS: (PWT, Rm=3.200@25C) CS (126.2 ~ 461.3m), CNFD (126.2 ~ 473.7m), DISF (126.2 ~ 481.2m) ~~~~~~~~~~~~~~~~~~~~~~~~~~~~~~~~~~~~~~~~~~~~~~~~~~~~~~~~~~~~~~~~~~~~~~~~~~~~~~~~~~~~~~~~~~~~ USER FORMATION TOPS geoSCOUT REF ELEV: 614.1m FORMATION TVD ELEV FORMATION TVD ELEV Kbfs 181.2 +432.9 Klloyd_ss 325.5 +288.6 Kviking 213.7 +400.4 Kclearwtr 340.4 +273.7 Kvik_ss 220.7 +393.4 Kmcmurray 439.4 +174.7 Kjoli_fou 239.3 +374.8 Kwabiskaw 439.5 +174.6 Kgrand_rp 252.0 +362.1 ~~~~~~~~~~~~~~~~~~~~~~~~~~~~~~~~~~~~~~~~~~~~~~~~~~~~~~~~~~~~~~~~~~~~~~~~~~~~~~~~~~~~~~~~~~~~ CORES #01. 440.0 ~ 449.0m Kmcmurray Rec 0.0m #02. 449.0 ~ 458.0m " " Rec 0.0m
250
275
300
Kgrand_rp
Kjoli_fou
614.1
Paramount Kwabiskaw
Paramount 2004/02/28
483.0
1AA/06-13-081-24W4/00
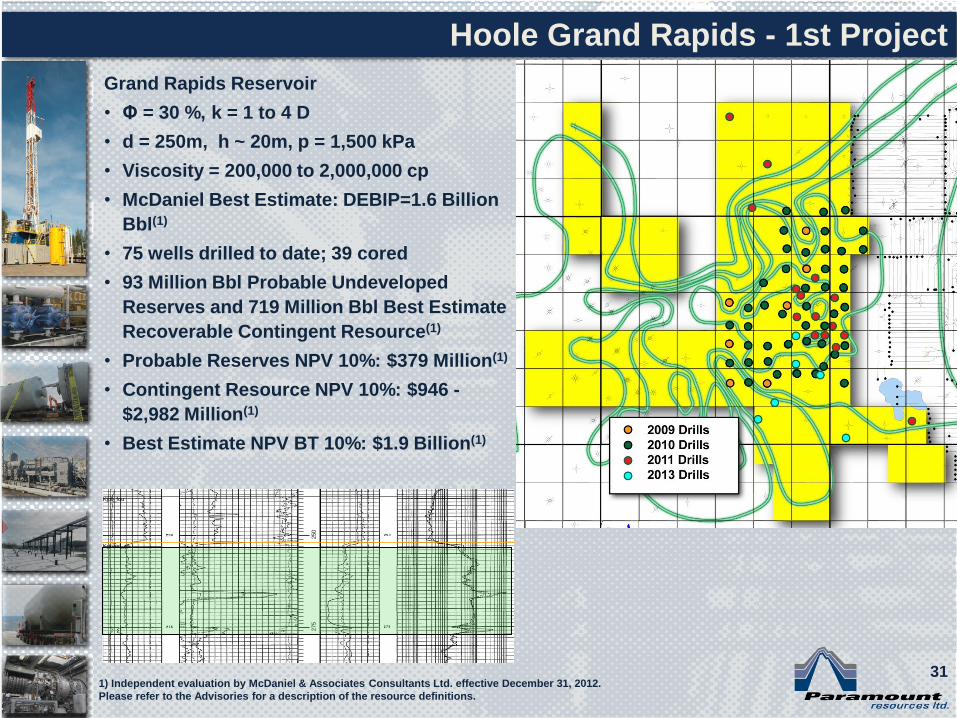
Grand Rapids Reservoir
• Φ = 30 %, k = 1 to 4 D
• d = 250m, h ~ 20m, p = 1,500 kPa
• Viscosity = 200,000 to 2,000,000 cp
• McDaniel Best Estimate: DEBIP=1.6 Billion
Bbl(1)
• 75 wells drilled to date; 39 cored
• 93 Million Bbl Probable Undeveloped
Reserves and 719 Million Bbl Best Estimate
Recoverable Contingent Resource(1)
• Probable Reserves NPV 10%: $379 Million(1)
• Contingent Resource NPV 10%: $946 -
$2,982 Million(1)
• Best Estimate NPV BT 10%: $1.9 Billion(1)
Hoole Grand Rapids - 1st Project
31 1) Independent evaluation by McDaniel & Associates Consultants Ltd. effective December 31, 2012.
Please refer to the Advisories for a description of the resource definitions.
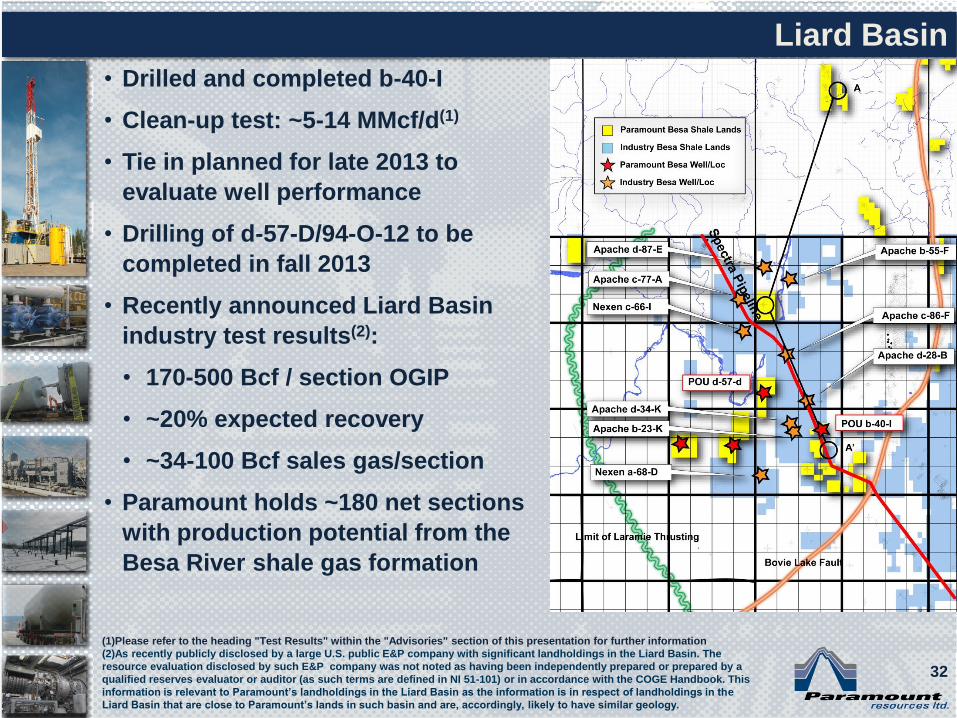
• Drilled and completed b-40-I
• Clean-up test: ~5-14 MMcf/d(1)
• Tie in planned for late 2013 to
evaluate well performance
• Drilling of d-57-D/94-O-12 to be
completed in fall 2013
• Recently announced Liard Basin
industry test results(2):
• 170-500 Bcf / section OGIP
• ~20% expected recovery
• ~34-100 Bcf sales gas/section
• Paramount holds ~180 net sections
with production potential from the
Besa River shale gas formation
Liard Basin
(1)Please refer to the heading "Test Results" within the "Advisories" section of this presentation for further information
(2)As recently publicly disclosed by a large U.S. public E&P company with significant landholdings in the Liard Basin. The
resource evaluation disclosed by such E&P company was not noted as having been independently prepared or prepared by a
qualified reserves evaluator or auditor (as such terms are defined in NI 51-101) or in accordance with the COGE Handbook. This
information is relevant to Paramount’s landholdings in the Liard Basin as the information is in respect of landholdings in the
Liard Basin that are close to Paramount’s lands in such basin and are, accordingly, likely to have similar geology.
32
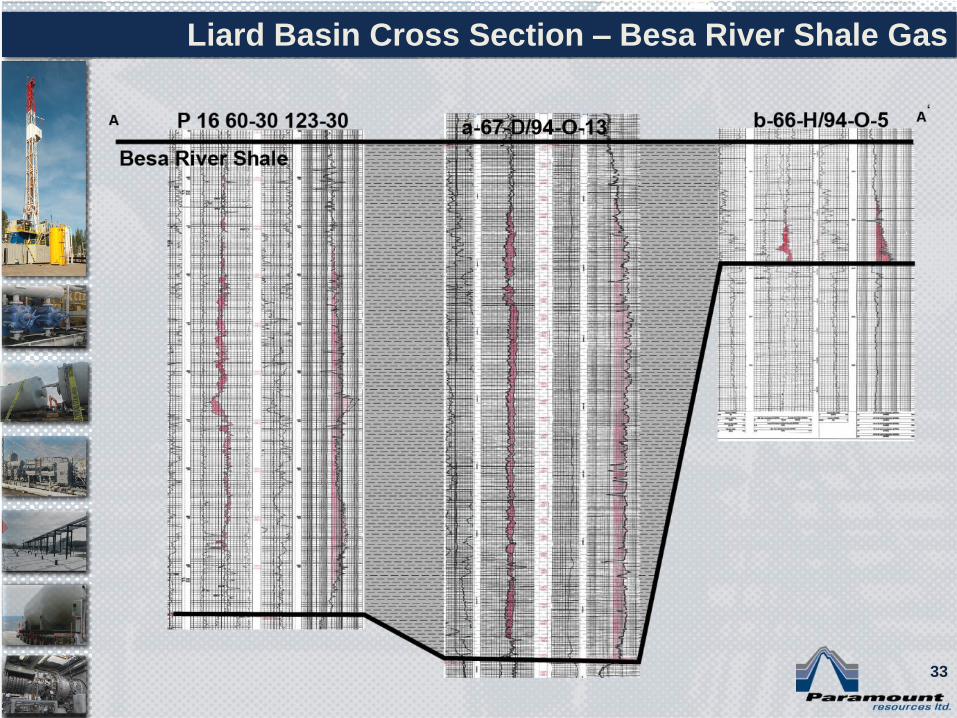
Liard Basin Cross Section – Besa River Shale Gas
33
33
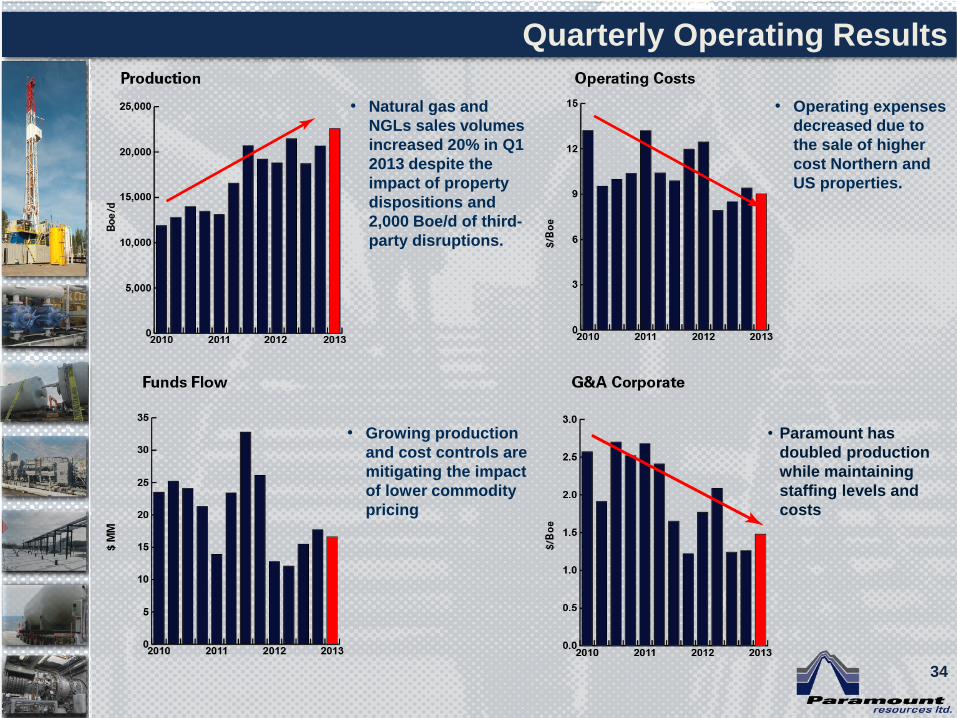
Quarterly Operating Results
• Natural gas and
NGLs sales volumes
increased 20% in Q1
2013 despite the
impact of property
dispositions and
2,000 Boe/d of third-
party disruptions.
• Growing production
and cost controls are
mitigating the impact
of lower commodity
pricing
• Operating expenses
decreased due to
the sale of higher
cost Northern and
US properties.
• Paramount has
doubled production
while maintaining
staffing levels and
costs
34
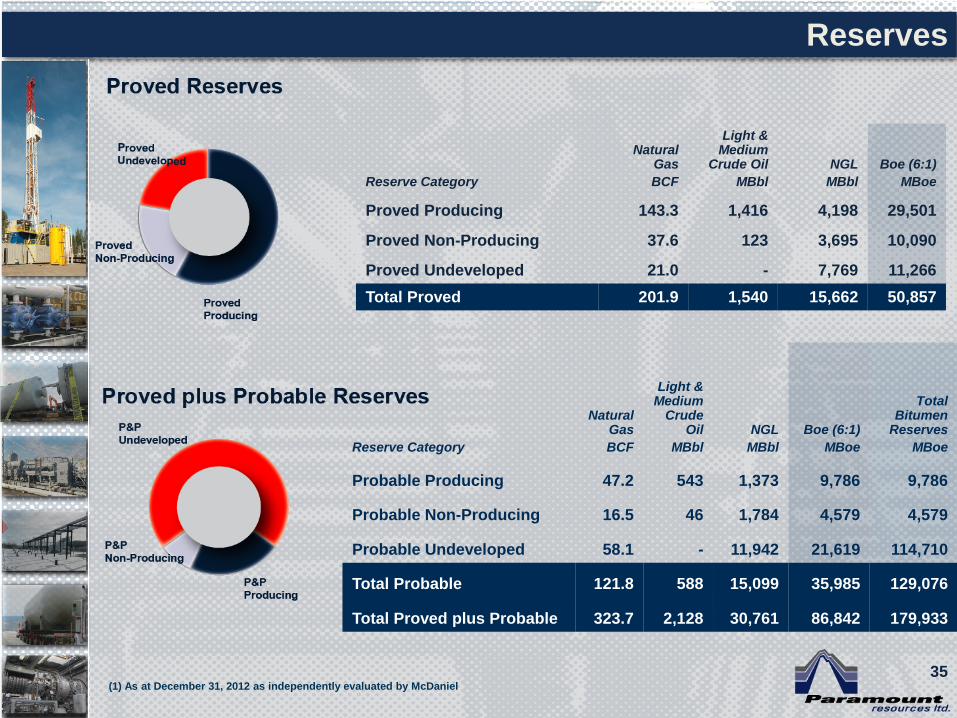
Reserves
Reserve Category
Natural Gas
BCF
Light & Medium
Crude Oil
MBbl
NGL
MBbl
Boe (6:1)
MBoe
Proved Producing 143.3 1,416 4,198 29,501
Proved Non-Producing 37.6 123 3,695 10,090
Proved Undeveloped 21.0 - 7,769 11,266
Total Proved 201.9 1,540 15,662 50,857
Reserve Category
Natural Gas
BCF
Light & Medium
Crude Oil
MBbl
NGL
MBbl
Boe (6:1)
MBoe
Total Bitumen
Reserves
MBoe
Probable Producing 47.2 543 1,373 9,786 9,786
Probable Non-Producing 16.5 46 1,784 4,579 4,579
Probable Undeveloped 58.1 - 11,942 21,619 114,710
Total Probable 121.8 588 15,099 35,985 129,076
Total Proved plus Probable 323.7 2,128 30,761 86,842 179,933
35 (1) As at December 31, 2012 as independently evaluated by McDaniel
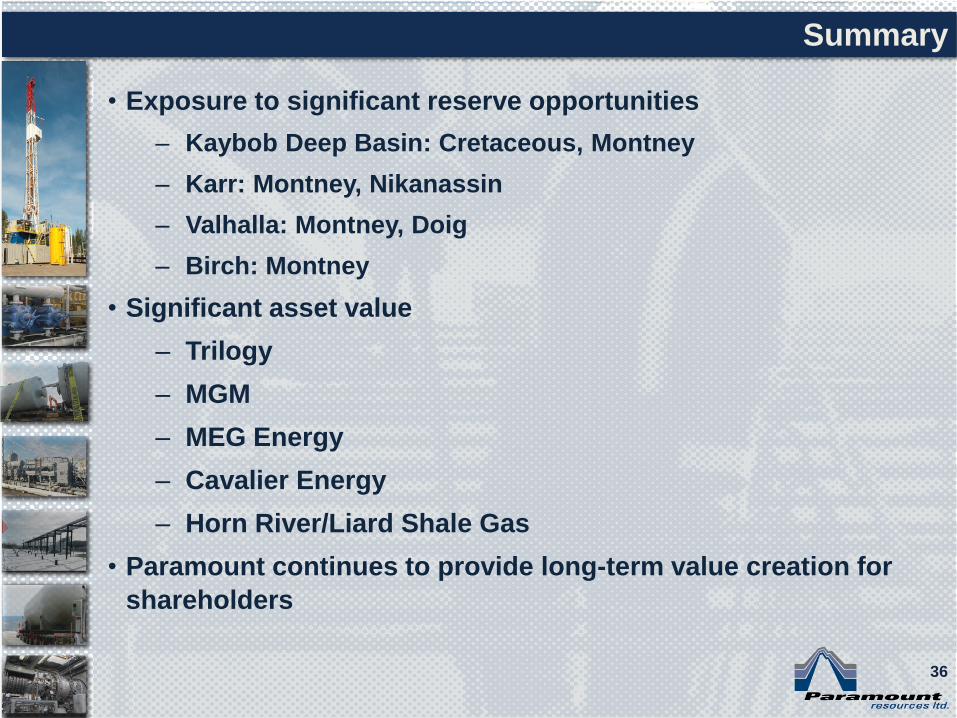
• Exposure to significant reserve opportunities
– Kaybob Deep Basin: Cretaceous, Montney
– Karr: Montney, Nikanassin
– Valhalla: Montney, Doig
– Birch: Montney
• Significant asset value
– Trilogy
– MGM
– MEG Energy
– Cavalier Energy
– Horn River/Liard Shale Gas
• Paramount continues to provide long-term value creation for
shareholders
Summary
36
4700 Bankers Hall West
888 Third Street S.W.
Calgary, Alberta
Canada T2P 5C5
Telephone: (403) 290-3600
Facsimile: (403) 262-7994
www.paramountres.com
42