Embed Size (px)
Citation preview
NAL Resources Management Limited
EPAC Oil & Gas Investor Showcase
June 12, 2013
Disclaimers
2
• Forward Looking Statements
• This document contains statements that constitute “forward-looking information” within the meaning of applicable securities legislation as to NAL
Resources Management Limited (“NAL’s”) internal projections, expectations and beliefs relating to future events or future performance. This forward-
looking information includes, among others, statements regarding: NAL’s strategic focus, business strategy and plans and budgets; business plans for
drilling, exploration and development, including drilling locations; estimates of production and operations performance; forecasted commodity price
estimates of future sales; estimated amounts, allocation and timing of capital expenditures; estimates of operating costs and unit operating costs; the
estimated timing and results of new development programs; estimates of anticipated funds from operations, cash flow, netbacks, dividends, working
capital and debt levels; estimated rates of return; the anticipated results of NAL’s divestiture program; various tax matters related to NAL; NAL’s
hedging program; NAL’s prospect inventory; and other expectations, beliefs, plans, goals, objectives, assumptions, information and statements about
possible future events, conditions, results of operations or performance.
• Various assumptions were used in drawing the conclusions or making the forecasts and projections contained in the forward-looking information
contained in this presentation including, without limitation, with respect to commodity prices, interest rates, exchange rates, royalty rates, general
and administrative expenses, the success of NAL's drilling programs and the production profile of NAL's oil and natural gas reserves. Forward-looking
information is based on current expectations, estimates and projections that involve a number of risks, which could cause actual results to vary and in
some instances to differ materially from those anticipated by NAL and described in the forward-looking information contained in this document. Undue
reliance should not be placed on forward-looking information. The material risk factors include, but are not limited to: the risks of the oil and gas
industry, such as operational risks in exploring for, developing and producing oil and natural gas, market demand and unpredictable facilities outages;
risks and uncertainties involving the geology of oil and gas deposits; the uncertainty of estimates and projections relating to production, costs and
expenses; potential delays or changes in plans with respect to exploration or development projects or capital expenditures; risk that adequate pipeline
capacity to transport oil and natural gas to market may not be available; fluctuations in oil and gas prices, foreign currency exchange rates and interest
rates; the outcome and effects of any future acquisitions and dispositions; safety and environmental risks; uncertainties as to the availability and cost
of financing and changes in capital markets; competitive actions of other industry participants; changes in general economic and business conditions;
the possibility that government policies or laws may change or governmental approvals may be delayed or withheld; changes in tax laws; changes in
royalty rates; the results of NAL’s risk mitigation strategies, including insurance; and NAL’s ability to implement its business strategy. Readers are
cautioned that the foregoing list of risk factors is not exhaustive.
• Forward-looking information is based on the estimates and opinions of NAL’s management at the time the information is released.
• Boe Conversion
• All dollar amounts in Canadian dollars, unless otherwise stated.
3
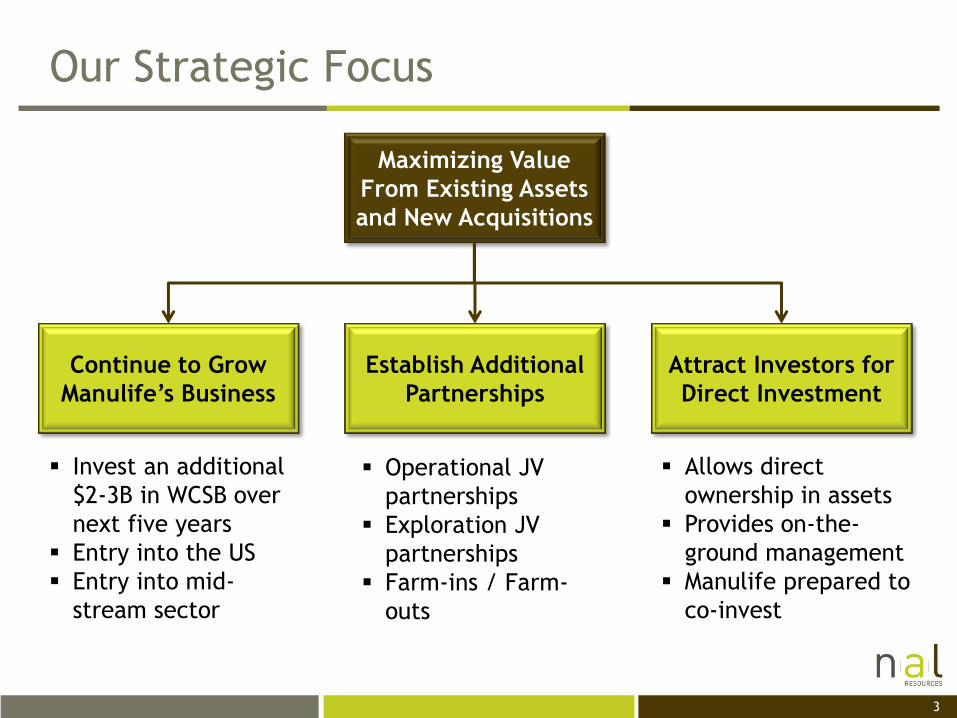
Our Strategic Focus
Maximizing Value
From Existing Assets
and New Acquisitions
Establish Additional
Partnerships
Attract Investors for
Direct Investment
Continue to Grow
Manulife’s Business
Invest an additional
$2-3B in WCSB over
next five years
Entry into the US
Entry into mid-
stream sector
Operational JV
partnerships
Exploration JV
partnerships
Farm-ins / Farm-
outs
Allows direct
ownership in assets
Provides on-the-
ground management
Manulife prepared to
co-invest
4
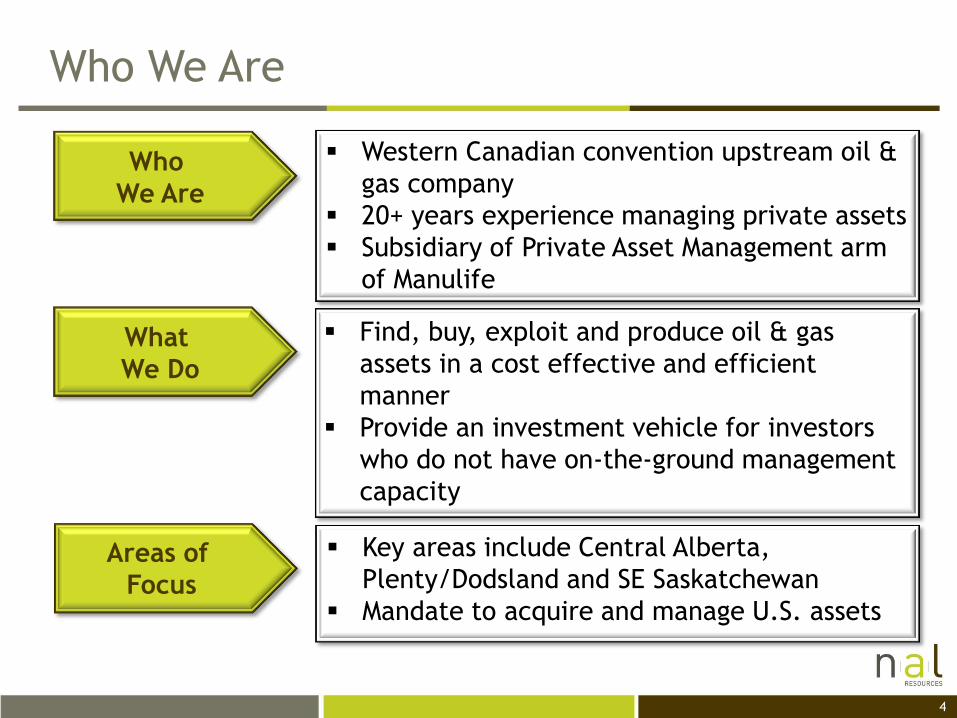
Who We Are
Who
We Are
What
We Do
Areas of
Focus
Western Canadian convention upstream oil &
gas company
20+ years experience managing private assets
Subsidiary of Private Asset Management arm
of Manulife
Find, buy, exploit and produce oil & gas
assets in a cost effective and efficient
manner
Provide an investment vehicle for investors
who do not have on-the-ground management
capacity
Key areas include Central Alberta,
Plenty/Dodsland and SE Saskatchewan
Mandate to acquire and manage U.S. assets
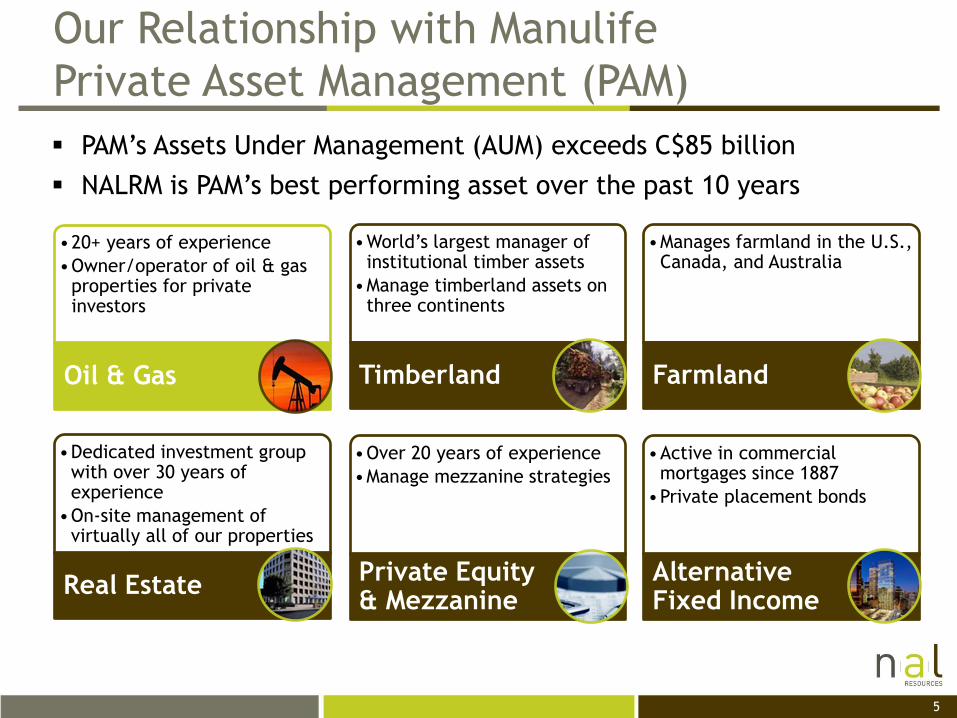
Our Relationship with Manulife
Private Asset Management (PAM)
5
•Dedicated investment group with over 30 years of experience
•On-site management of virtually all of our properties
Real Estate
•World’s largest manager of institutional timber assets
•Manage timberland assets on three continents
Timberland
•Manages farmland in the U.S., Canada, and Australia
Farmland
•20+ years of experience
•Owner/operator of oil & gas properties for private investors
Oil & Gas
•Over 20 years of experience
•Manage mezzanine strategies
Private Equity & Mezzanine
•Active in commercial mortgages since 1887
•Private placement bonds
Alternative Fixed Income
PAM’s Assets Under Management (AUM) exceeds C$85 billion
NALRM is PAM’s best performing asset over the past 10 years
6
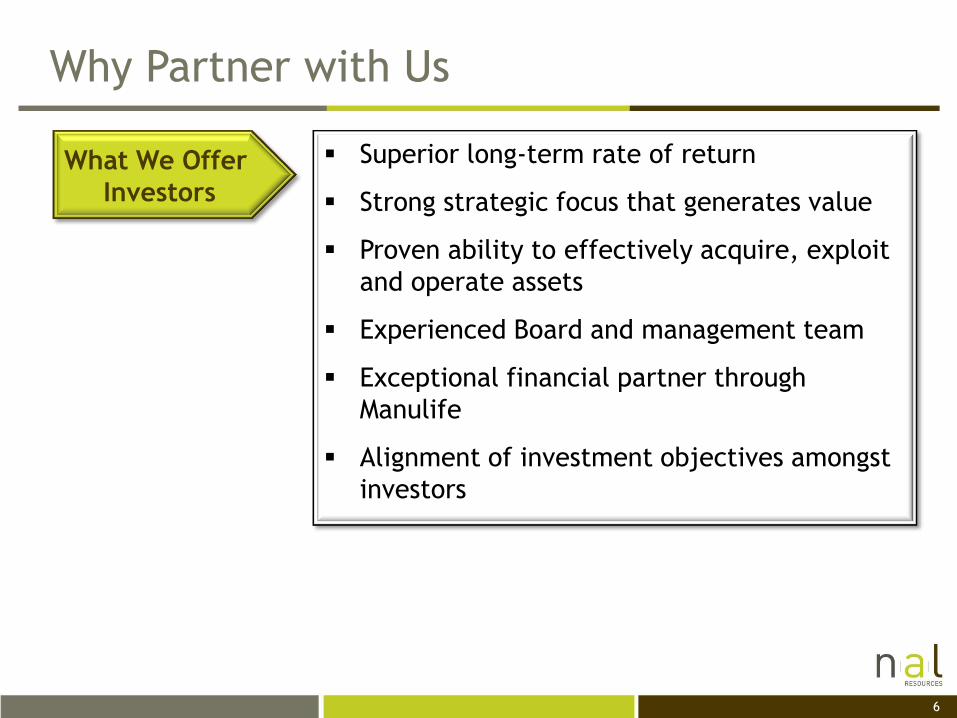
What We Offer
Investors
Superior long-term rate of return
Strong strategic focus that generates value
Proven ability to effectively acquire, exploit
and operate assets
Experienced Board and management team
Exceptional financial partner through
Manulife
Alignment of investment objectives amongst
investors
Why Partner with Us
7
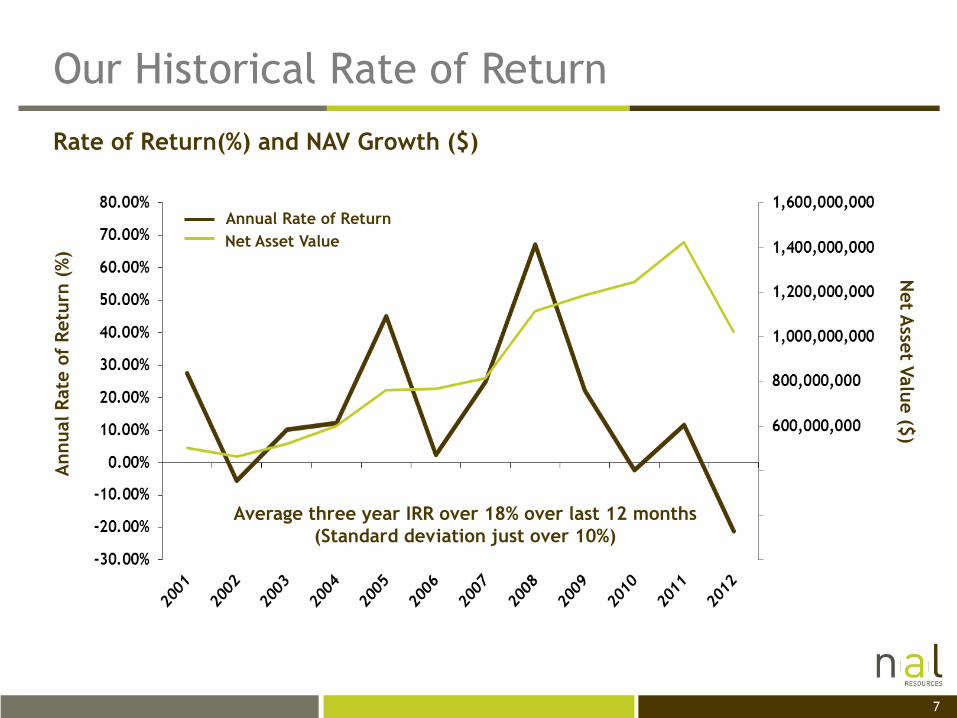
Our Historical Rate of Return
Rate of Return(%) and NAV Growth ($)
Average three year IRR over 18% over last 12 months
(Standard deviation just over 10%)
Annual Rate of Return
Net Asset Value
Annual R
ate
of
Retu
rn (
%)
Net A
sset V
alu
e ($
)
8
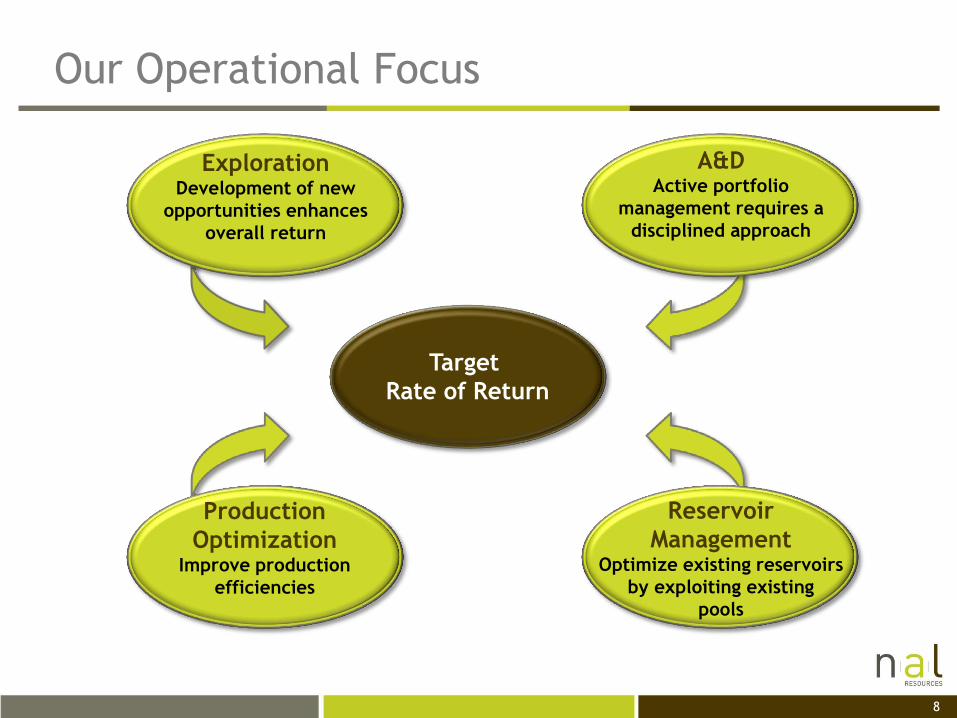
Our Operational Focus
Exploration Development of new
opportunities enhances
overall return
A&D Active portfolio
management requires a
disciplined approach
Production
Optimization Improve production
efficiencies
Reservoir
Management Optimize existing reservoirs
by exploiting existing
pools
Target
Rate of Return
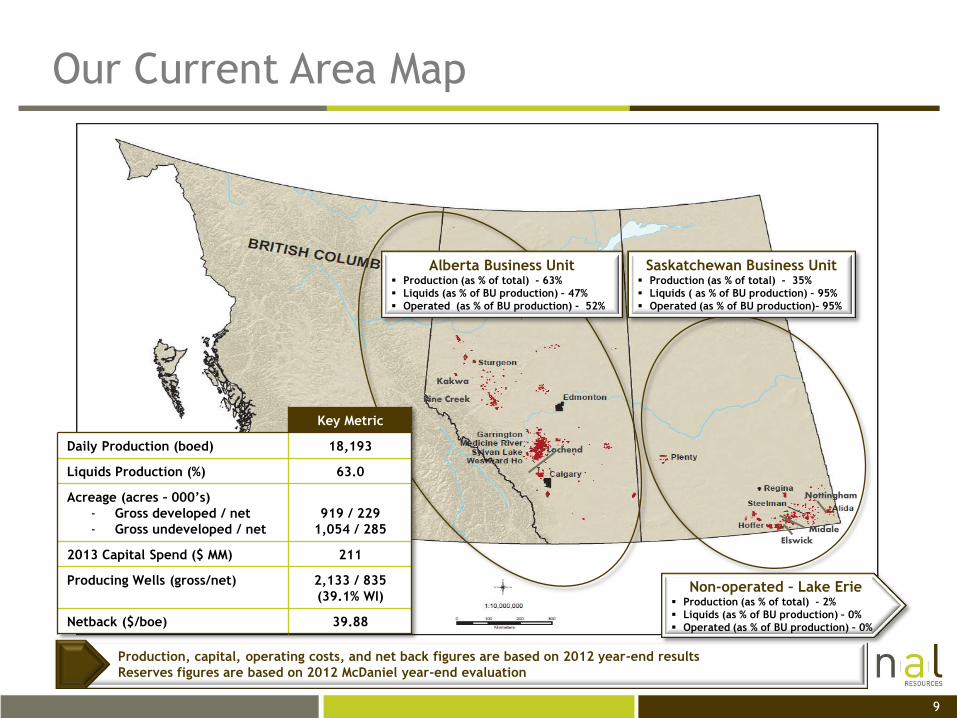
Our Current Area Map
Alberta Business Unit Production (as % of total) - 63%
Liquids (as % of BU production) – 47%
Operated (as % of BU production) - 52%
Saskatchewan Business Unit Production (as % of total) - 35%
Liquids ( as % of BU production) – 95%
Operated (as % of BU production)– 95%
Production, capital, operating costs, and net back figures are based on 2012 year-end results
Reserves figures are based on 2012 McDaniel year-end evaluation
Non-operated – Lake Erie Production (as % of total) - 2%
Liquids (as % of BU production) – 0%
Operated (as % of BU production) – 0%
Pine Creek
Lochend
Elswick Midale
Nottingham
9
Kakwa
Key Metric
Daily Production (boed) 18,193
Liquids Production (%) 63.0
Acreage (acres – 000’s)
- Gross developed / net
- Gross undeveloped / net
919 / 229
1,054 / 285
2013 Capital Spend ($ MM) 211
Producing Wells (gross/net) 2,133 / 835
(39.1% WI)
Netback ($/boe) 39.88
10
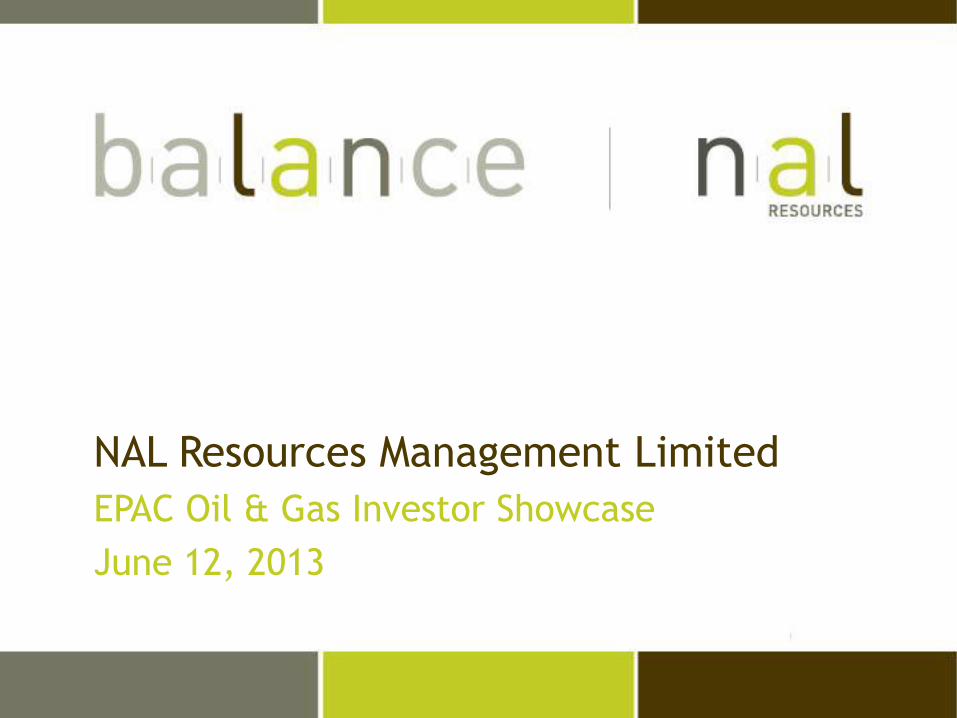
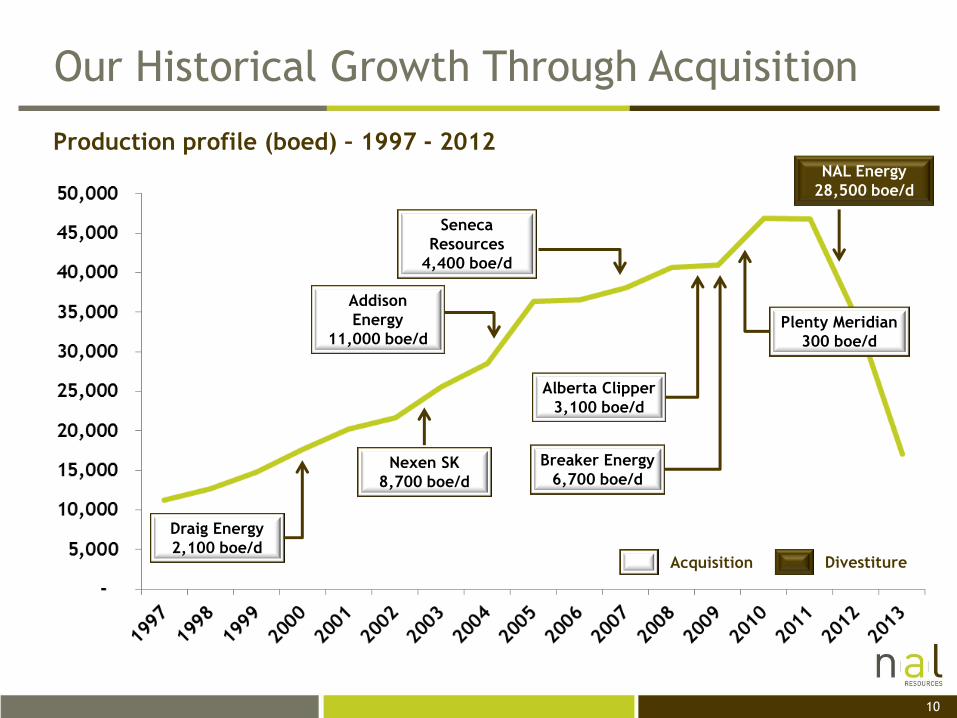
Our Historical Growth Through Acquisition
Production profile (boed) – 1997 - 2012
Plenty Meridian
300 boe/d
Breaker Energy
6,700 boe/d
Alberta Clipper
3,100 boe/d
Seneca
Resources
4,400 boe/d
Addison
Energy
11,000 boe/d
Nexen SK
8,700 boe/d
Draig Energy
2,100 boe/d
NAL Energy
28,500 boe/d
Acquisition Divestiture
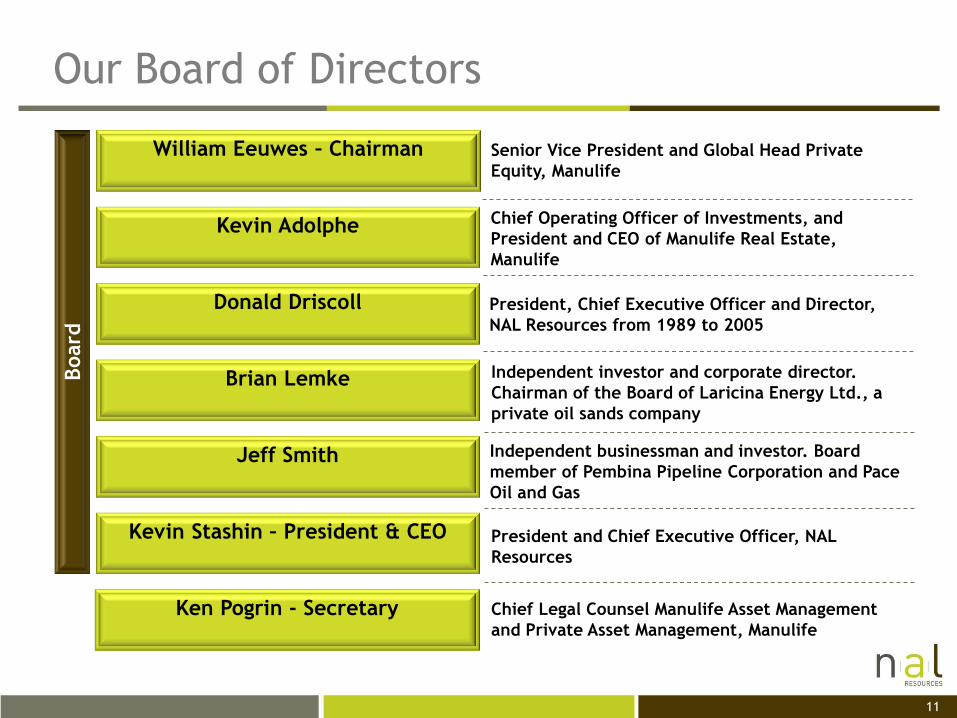
Chief Operating Officer of Investments, and
President and CEO of Manulife Real Estate,
Manulife
11
Our Board of Directors Board
William Eeuwes – Chairman
Donald Driscoll
Brian Lemke
Kevin Adolphe
Senior Vice President and Global Head Private
Equity, Manulife
Jeff Smith
Ken Pogrin - Secretary
President, Chief Executive Officer and Director,
NAL Resources from 1989 to 2005
Independent businessman and investor. Board
member of Pembina Pipeline Corporation and Pace
Oil and Gas
Independent investor and corporate director.
Chairman of the Board of Laricina Energy Ltd., a
private oil sands company
Chief Legal Counsel Manulife Asset Management
and Private Asset Management, Manulife
Kevin Stashin – President & CEO
President and Chief Executive Officer, NAL
Resources

30 years
32 years
12
Our Senior Management Team Senio
r M
anagem
ent
Team
Kevin Stashin
President and CEO
Darcy Redding
Vice President, Operations
Keith Steeves
CFO
Paul Kunkel
Vice President, Finance
Cory Bergh
Vice President, Operations Accounting & IT
John Kanik
Director, Marketing
Angele Mullins
Director, Human Resources
20 years
19 years
Kevin Christie
Vice President, Exploration
20 years
25 years
36 years
19 years
Experience
13
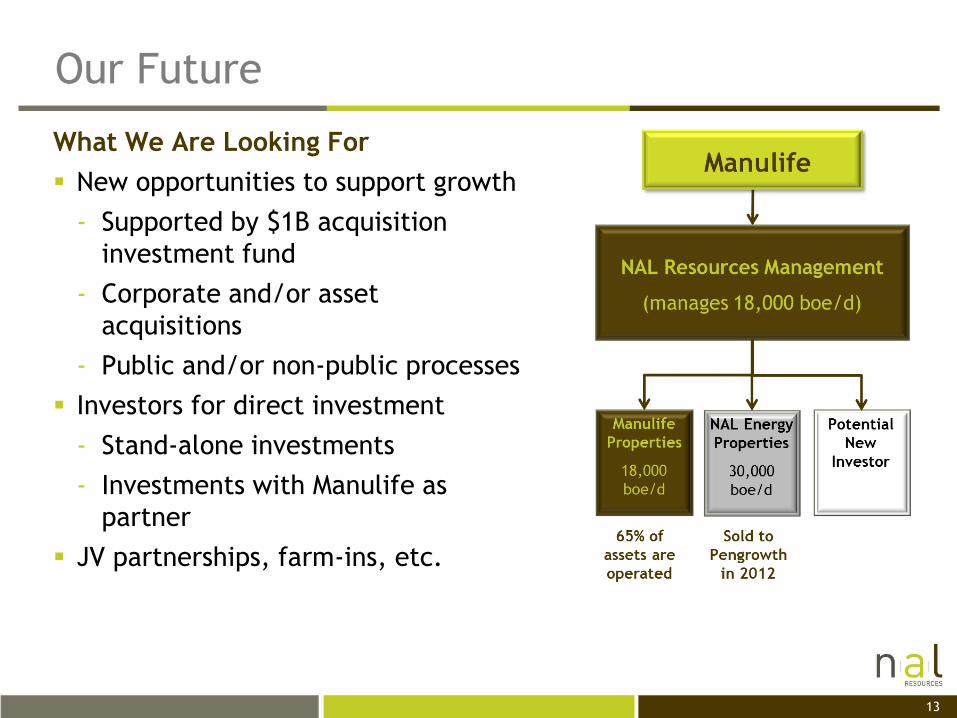
Our Future
What We Are Looking For
New opportunities to support growth
- Supported by $1B acquisition
investment fund
- Corporate and/or asset
acquisitions
- Public and/or non-public processes
Investors for direct investment
- Stand-alone investments
- Investments with Manulife as
partner
JV partnerships, farm-ins, etc.
Appendix
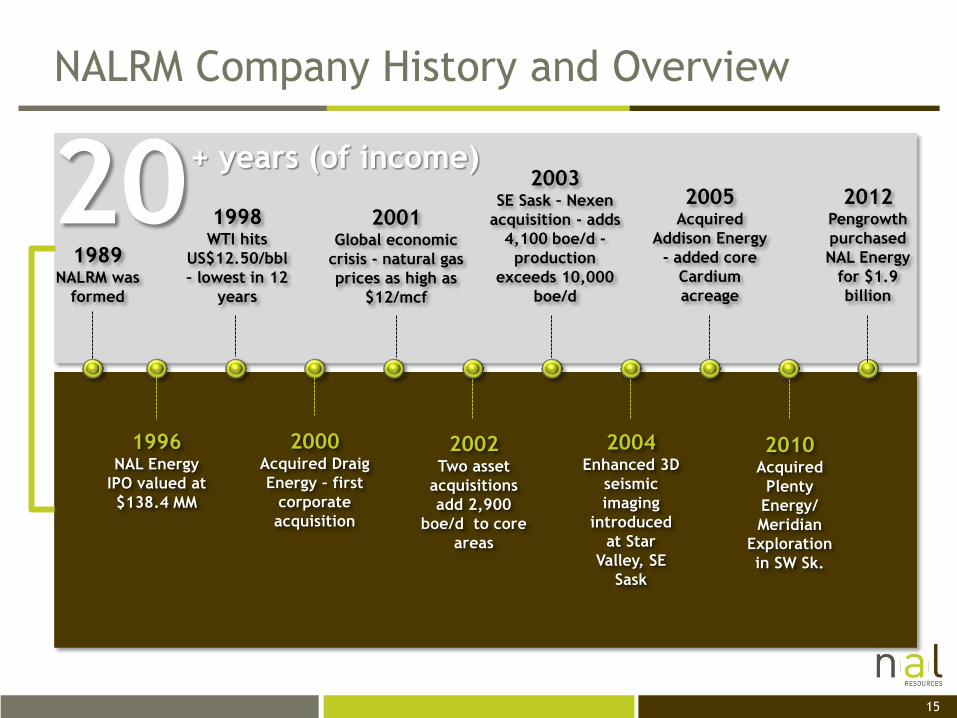
NALRM Company History and Overview
15
20 + years (of income)
1989 NALRM was
formed
1996 NAL Energy
IPO valued at
$138.4 MM
1998 WTI hits
US$12.50/bbl
– lowest in 12
years
2000 Acquired Draig
Energy – first
corporate
acquisition
2001 Global economic
crisis - natural gas
prices as high as
$12/mcf
2002 Two asset
acquisitions
add 2,900
boe/d to core
areas
2003 SE Sask – Nexen
acquisition - adds
4,100 boe/d -
production
exceeds 10,000
boe/d
2004 Enhanced 3D
seismic
imaging
introduced
at Star
Valley, SE
Sask
2005 Acquired
Addison Energy
- added core
Cardium
acreage
2010 Acquired
Plenty
Energy/
Meridian
Exploration
in SW Sk.
2012 Pengrowth
purchased
NAL Energy
for $1.9
billion
16
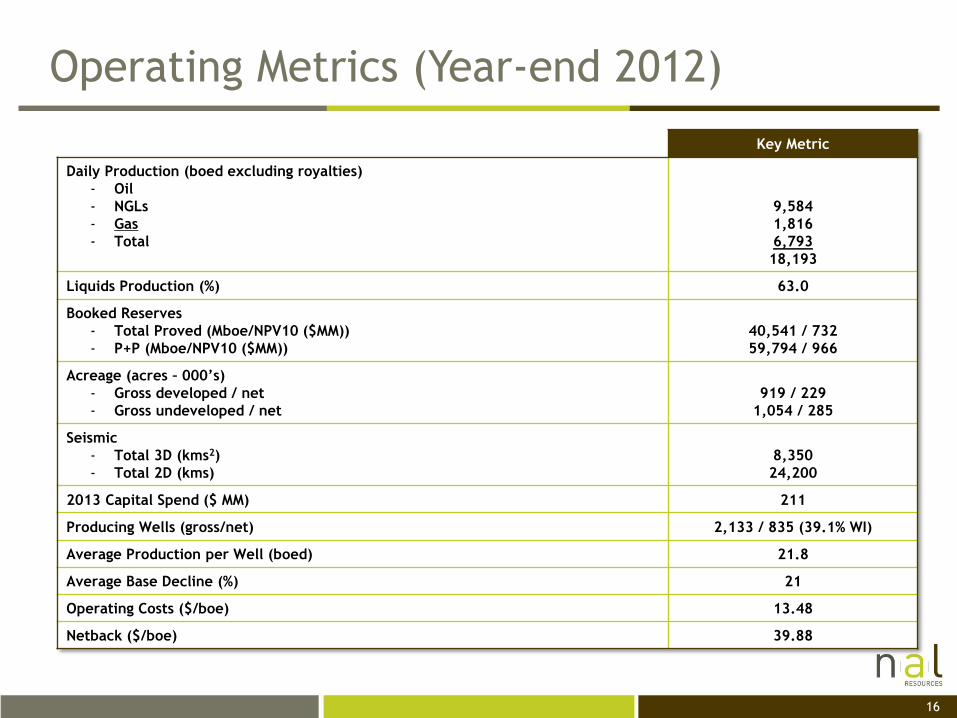
Operating Metrics (Year-end 2012)
Key Metric
Daily Production (boed excluding royalties)
- Oil
- NGLs
- Gas
- Total
9,584
1,816
6,793
18,193
Liquids Production (%) 63.0
Booked Reserves
- Total Proved (Mboe/NPV10 ($MM))
- P+P (Mboe/NPV10 ($MM))
40,541 / 732
59,794 / 966
Acreage (acres – 000’s)
- Gross developed / net
- Gross undeveloped / net
919 / 229
1,054 / 285
Seismic
- Total 3D (kms2)
- Total 2D (kms)
8,350
24,200
2013 Capital Spend ($ MM) 211
Producing Wells (gross/net) 2,133 / 835 (39.1% WI)
Average Production per Well (boed) 21.8
Average Base Decline (%) 21
Operating Costs ($/boe) 13.48
Netback ($/boe) 39.88