Embed Size (px)
Citation preview
Tekno log iavde l ingenRAPPORT Tekno log iavde l ingen
VegteknologiseksjonenDato: 2009-12-18
Nr. 2578RAPPORT
Environmentally Friendly Pavements Final report
Postadr.:
Telefon:
Tittel
Saksbehandler Prosjektnr:Dato:
Antall sider og vedlegg:
Utarbeidet av
Kontrollert av
Emneord:
Sammendrag
Summary
TEKNOLOGIRAPPORT nr.
VegdirektoratetTeknologiavdelingen
Postboks 8142 Dep0033 Oslo
(+47 915) 02030
www.vegvesen.no
2578
Environmentally Friendly Pavements Final report
Jostein Aksnes 6007402009-12-18
76
Road, pavement, environment, asphalt, noise reduction, low noise, dust, particulate matter, studded tires
This final report presents the main results, advice and recommendations from the research and development program Environmentally Friendly Pavements run by the Norwegian Public Roads Administration (NPRA) in the period 2004-2009. The main focus of the project has been to optimise the environmental properties of road surfaces with respect to low road tyre noise and road dust emissions. The project has shown that:The tested environmentally friendly pavements give an initial noise reduction of 3-9 dB(A) compared to the reference level (SMA11 older than one year).The noise reducing effect decreases relatively rapidly for all types of pavements that have been investigated. Annual increase in noise levels measured on Norwegian pavements is considerably higher than what is reported from a number of other countries. The increase is particularly large during the first winter. It is natural to explain this phenomenon by the wear from studded tires and its influence on the pavement surface texture.The friction properties of tested environmentally friendly pavements are in the same range as traditional Norwegian pave-ments, and they require no special winter maintenance. Porous pavements seem to have slightly better friction than dense pavements with similar maximum aggregate size.It is difficult to develop pavements with considerably higher wear resistance than those we have today, without compro-mising other important properties as stability and friction. However, through adjusted requirements for material quality and mix design, it is possible to maintain the durability of low noise pavement alternatives.
Environmentally Friendly Pavements Final report
ViaNova Plan og Trafikk AS October 2009
Environmentally Friendly Pavements
Final report
Client Norwegian Public Roads Administration Client’s reference Jostein Aksnes
[email protected] Norwegian Public Roads Administration Road Directorate P.O. box 8142 Dep. 0033 Oslo Phone: 02030
Project no. VN PT – 15205 Date of report 2009-10-01 Type of report Final report of the project Environmentally Friendly Pavements
ViaNova Plan og Trafikk AS Leif Tronstads Plass 4
P. O. box 434, 1302 SANDVIKA E-mail: [email protected]
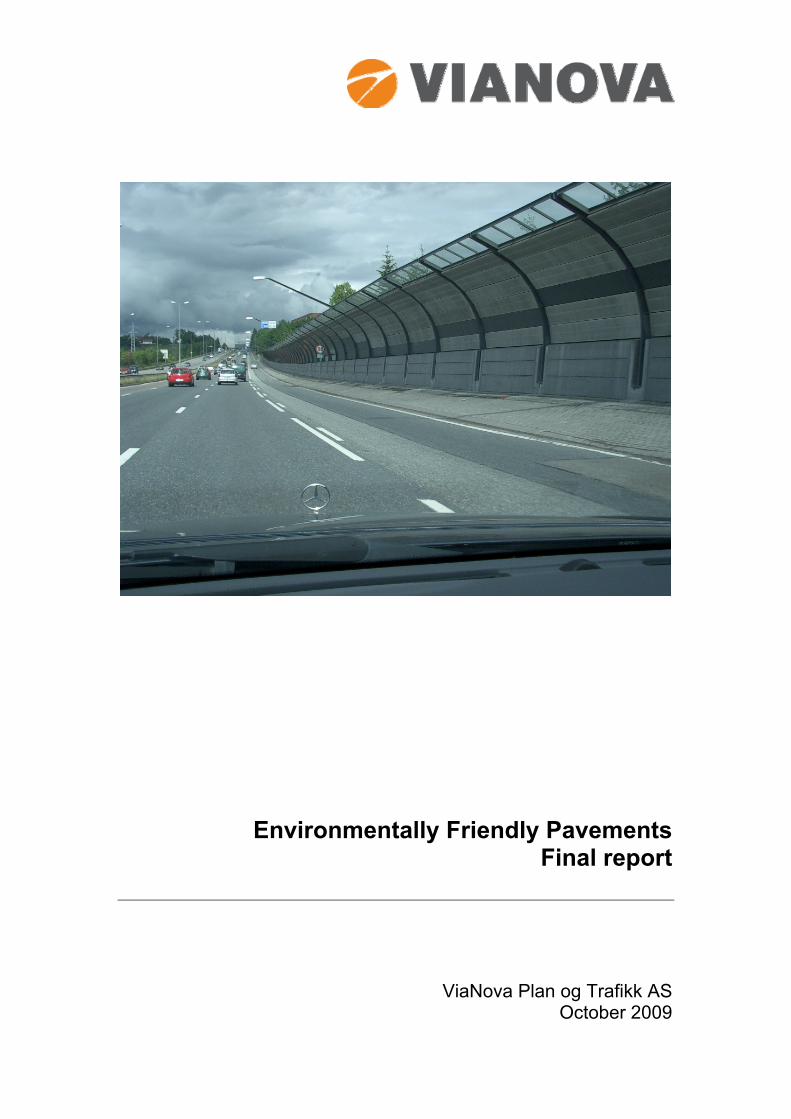
Tlf: +47 67 81 70 00 Fax: +47 67 81 70 01 First page photo: Noise barrier E 6 Furuset, Oslo
3
Preface Environmentally Friendly Pavements has been one of the research and development programs run by the Norwegian Public Roads Administration (NPRA) in the period 2004-2009. The project has been conducted by the Technology Department, Road technology section in Trondheim in close cooperation with other parts of the NPRA and external partners. The main focus of the project has been to optimise the environmental properties of road surfaces with respect to low road tyre noise and road dust emissions. The goals have been:
Reduce the traffic noise annoyance from roads and streets Improve the air quality in densely populated areas
The project steering group has consisted of:
Helen Aagot Riddervold (Chair), Technology Department Torbjørn Naimak, Northern Region Sidsel Kålås, Road Development Department Tor-Sverre Thomassen, Roads and Traffic Department
The project group was composed of the project manager, work package leaders and a dr.ing-student associated with the project. The following is a list of the members of the project group.
Jostein Aksnes Leif Jørgen Bakløkk Nils Sigurd Uthus Ingunn Milford Kjell Bjørn Vinje Inger Lise Sagmo Øystein Larsen Camilla Nørbech Rabbira Garba Saba Brynhild Snilsberg
In this final report the main results, conclusions and recommendations from the project are presented. The report also comes with some proposals for implementation of the results and for follow-up work, which contributes to further development of environmentally friendly pavements. The report was written by Ragnar Evensen, ViaNova Plan og Trafikk AS on commission from NPRA. Behind the results and the new knowledge gained from the Environmentally Friendly Pavements project lies an extensive work and effort from a range of project participants. I would like to express a well-deserved gratitude and appreciation to all contributors, both colleagues in the NPRA and external partners. Trondheim, June 2009 Jostein Aksnes (project manager)
4
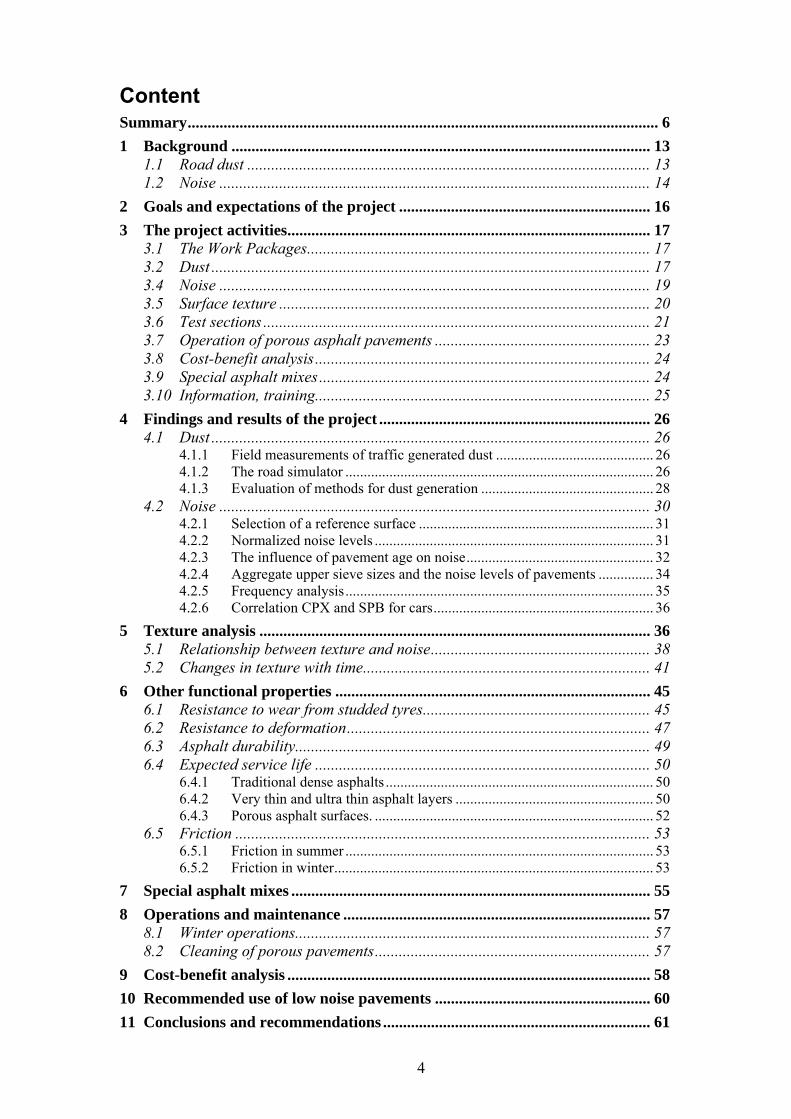
Content Summary...................................................................................................................... 6
1 Background ......................................................................................................... 13 1.1 Road dust ..................................................................................................... 13 1.2 Noise ............................................................................................................ 14
2 Goals and expectations of the project ............................................................... 16
3 The project activities........................................................................................... 17 3.1 The Work Packages...................................................................................... 17 3.2 Dust .............................................................................................................. 17 3.4 Noise ............................................................................................................ 19 3.5 Surface texture ............................................................................................. 20 3.6 Test sections ................................................................................................. 21 3.7 Operation of porous asphalt pavements ...................................................... 23 3.8 Cost-benefit analysis.................................................................................... 24 3.9 Special asphalt mixes................................................................................... 24 3.10 Information, training.................................................................................... 25
4 Findings and results of the project .................................................................... 26 4.1 Dust .............................................................................................................. 26
4.1.1 Field measurements of traffic generated dust ........................................... 26 4.1.2 The road simulator .................................................................................... 26 4.1.3 Evaluation of methods for dust generation ............................................... 28
4.2 Noise ............................................................................................................ 30 4.2.1 Selection of a reference surface ................................................................ 31 4.2.2 Normalized noise levels ............................................................................ 31 4.2.3 The influence of pavement age on noise................................................... 32 4.2.4 Aggregate upper sieve sizes and the noise levels of pavements ............... 34 4.2.5 Frequency analysis.................................................................................... 35 4.2.6 Correlation CPX and SPB for cars............................................................ 36
5 Texture analysis .................................................................................................. 36 5.1 Relationship between texture and noise....................................................... 38 5.2 Changes in texture with time........................................................................ 41
6 Other functional properties ............................................................................... 45 6.1 Resistance to wear from studded tyres......................................................... 45 6.2 Resistance to deformation............................................................................ 47 6.3 Asphalt durability......................................................................................... 49 6.4 Expected service life .................................................................................... 50
6.4.1 Traditional dense asphalts ......................................................................... 50 6.4.2 Very thin and ultra thin asphalt layers ...................................................... 50 6.4.3 Porous asphalt surfaces. ............................................................................ 52
6.5 Friction ........................................................................................................ 53 6.5.1 Friction in summer .................................................................................... 53 6.5.2 Friction in winter....................................................................................... 53
7 Special asphalt mixes .......................................................................................... 55
8 Operations and maintenance ............................................................................. 57 8.1 Winter operations......................................................................................... 57 8.2 Cleaning of porous pavements..................................................................... 57
9 Cost-benefit analysis ........................................................................................... 58
10 Recommended use of low noise pavements ...................................................... 60
11 Conclusions and recommendations ................................................................... 61

5
11.1 Ongoing activities and projects ................................................................... 62 11.2 Recommendations for future activities......................................................... 63 11.3 Implementation of the results from the project ............................................ 65
Literature................................................................................................................... 66
Appendix 1 Low Noise Pavements, test sections................................................. 69

6
Summary A research and development project named ’Environmentally Friendly Pavements’ has been conducted by the Norwegian Public Roads Administration in close cooperation with research institutions and the road industry. The project was launched in 2004 and was completed in 2009. The main focus of the project has been to optimise the environmental properties of road surfaces with respect to low road tyre noise emission and road dust, in particular dust generated by the wear of pavements by studded tires. The goals of the project were to:
Reduce the traffic noise annoyance of roads and streets Improve the air quality in dense populated areas
Building better competence in these two areas, as a basis for the development and implementation of solutions that can aid to reach these goals, is necessary. Better competence is also necessary to benefit from research and development activities in other countries and find practical solutions which can be implemented on roads and streets in Norway. Based on the goals and expectations presented above, the project is carried out through 10 work packages. These work packages are: Work Package 1: Project administration Work Package 2: Development of a strategy Work Package 3: Particulate matter Work Package 4: Noise Work Package 5: Information, training Work Package 6: Maintenance and operations Work Package 7: Field testing Work Package 8: Functional requirements Work Package 9: Cost-benefit analysis Work Package 10: Special asphalt mixes During the project period Work Package 2 and 8 were merged and the description was changed to “Application, classification and requirements”. Each of the work packages had its own budget and budget limits. The budget of the project, including indirect costs, has been 15,5 mill NOK. The costs of asphalt for the field sections are not included in the budget. These costs are included in the regular pavement maintenance budgets. Dust The activities of the work package were split into three subtasks: field investigations, analysis of dust generated in a road simulator and evaluation of methods for dust generation The main part of the field investigations has been sampling of dust at various heights above the street level at E 6 in Trondheim (Elgesetergate, urban street, speed limit 50 km/h). The objective was to determine the dust downfall per 30 days as a function of time of the year and the height from the street level.
7
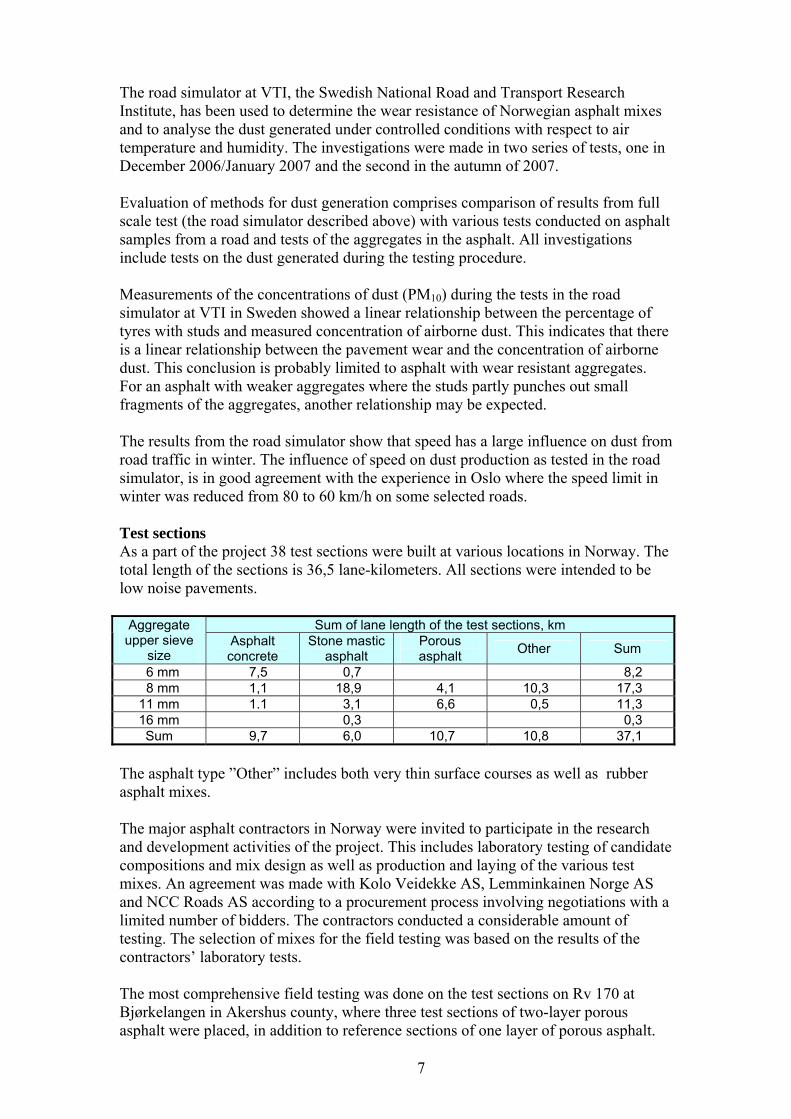
The road simulator at VTI, the Swedish National Road and Transport Research Institute, has been used to determine the wear resistance of Norwegian asphalt mixes and to analyse the dust generated under controlled conditions with respect to air temperature and humidity. The investigations were made in two series of tests, one in December 2006/January 2007 and the second in the autumn of 2007. Evaluation of methods for dust generation comprises comparison of results from full scale test (the road simulator described above) with various tests conducted on asphalt samples from a road and tests of the aggregates in the asphalt. All investigations include tests on the dust generated during the testing procedure. Measurements of the concentrations of dust (PM10) during the tests in the road simulator at VTI in Sweden showed a linear relationship between the percentage of tyres with studs and measured concentration of airborne dust. This indicates that there is a linear relationship between the pavement wear and the concentration of airborne dust. This conclusion is probably limited to asphalt with wear resistant aggregates. For an asphalt with weaker aggregates where the studs partly punches out small fragments of the aggregates, another relationship may be expected. The results from the road simulator show that speed has a large influence on dust from road traffic in winter. The influence of speed on dust production as tested in the road simulator, is in good agreement with the experience in Oslo where the speed limit in winter was reduced from 80 to 60 km/h on some selected roads. Test sections As a part of the project 38 test sections were built at various locations in Norway. The total length of the sections is 36,5 lane-kilometers. All sections were intended to be low noise pavements.
Sum of lane length of the test sections, km Aggregate upper sieve
size Asphalt concrete
Stone mastic asphalt
Porous asphalt
Other Sum
6 mm 7,5 0,7 8,2 8 mm 1,1 18,9 4,1 10,3 17,3
11 mm 1.1 3,1 6,6 0,5 11,3 16 mm 0,3 0,3 Sum 9,7 6,0 10,7 10,8 37,1
The asphalt type ”Other” includes both very thin surface courses as well as rubber asphalt mixes. The major asphalt contractors in Norway were invited to participate in the research and development activities of the project. This includes laboratory testing of candidate compositions and mix design as well as production and laying of the various test mixes. An agreement was made with Kolo Veidekke AS, Lemminkainen Norge AS and NCC Roads AS according to a procurement process involving negotiations with a limited number of bidders. The contractors conducted a considerable amount of testing. The selection of mixes for the field testing was based on the results of the contractors’ laboratory tests. The most comprehensive field testing was done on the test sections on Rv 170 at Bjørkelangen in Akershus county, where three test sections of two-layer porous asphalt were placed, in addition to reference sections of one layer of porous asphalt.
8
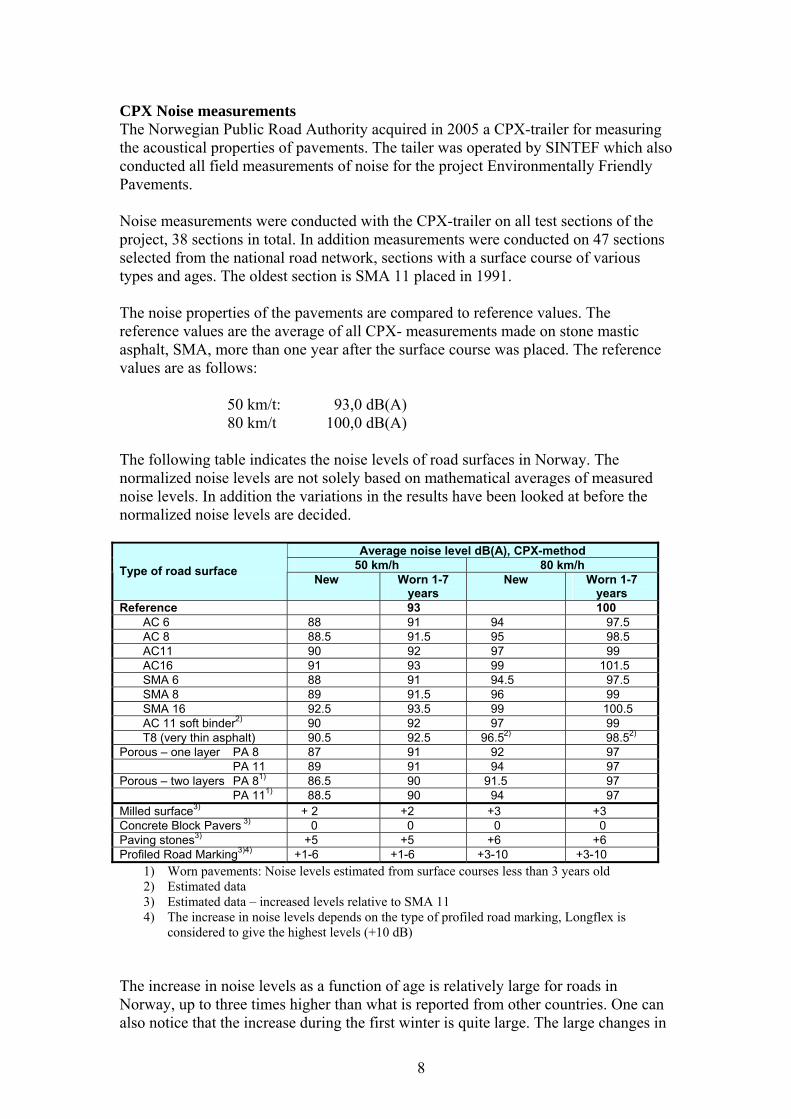
CPX Noise measurements The Norwegian Public Road Authority acquired in 2005 a CPX-trailer for measuring the acoustical properties of pavements. The tailer was operated by SINTEF which also conducted all field measurements of noise for the project Environmentally Friendly Pavements. Noise measurements were conducted with the CPX-trailer on all test sections of the project, 38 sections in total. In addition measurements were conducted on 47 sections selected from the national road network, sections with a surface course of various types and ages. The oldest section is SMA 11 placed in 1991. The noise properties of the pavements are compared to reference values. The reference values are the average of all CPX- measurements made on stone mastic asphalt, SMA, more than one year after the surface course was placed. The reference values are as follows: 50 km/t: 93,0 dB(A) 80 km/t 100,0 dB(A) The following table indicates the noise levels of road surfaces in Norway. The normalized noise levels are not solely based on mathematical averages of measured noise levels. In addition the variations in the results have been looked at before the normalized noise levels are decided.
Average noise level dB(A), CPX-method 50 km/h 80 km/h Type of road surface
New Worn 1-7 years
New Worn 1-7 years
Reference 93 100 AC 6 88 91 94 97.5 AC 8 88.5 91.5 95 98.5 AC11 90 92 97 99 AC16 91 93 99 101.5 SMA 6 88 91 94.5 97.5 SMA 8 89 91.5 96 99 SMA 16 92.5 93.5 99 100.5 AC 11 soft binder2) 90 92 97 99 T8 (very thin asphalt) 90.5 92.5 96.52) 98.52) Porous – one layer PA 8 87 91 92 97 PA 11 89 91 94 97 Porous – two layers PA 81) 86.5 90 91.5 97 PA 111) 88.5 90 94 97 Milled surface3) + 2 +2 +3 +3 Concrete Block Pavers 3) 0 0 0 0 Paving stones3) +5 +5 +6 +6 Profiled Road Marking3)4) +1-6 +1-6 +3-10 +3-10
1) Worn pavements: Noise levels estimated from surface courses less than 3 years old 2) Estimated data 3) Estimated data – increased levels relative to SMA 11 4) The increase in noise levels depends on the type of profiled road marking, Longflex is
considered to give the highest levels (+10 dB) The increase in noise levels as a function of age is relatively large for roads in Norway, up to three times higher than what is reported from other countries. One can also notice that the increase during the first winter is quite large. The large changes in
9
the noise levels are assumed to be a result of changes in the surface texture which are caused by the wear due to studded tyres. Surface texture In addition to the development of rational and effective methods for administration of data, computations and quality assurance of the data from the measuring vehicle, the analysis of texture has been focused on:
the analysis of the relationship between texture parameters and noise.
the analysis of possible relationships between texture and influencing factors, such as the traffic volume, pavement age and various data for the asphalt.
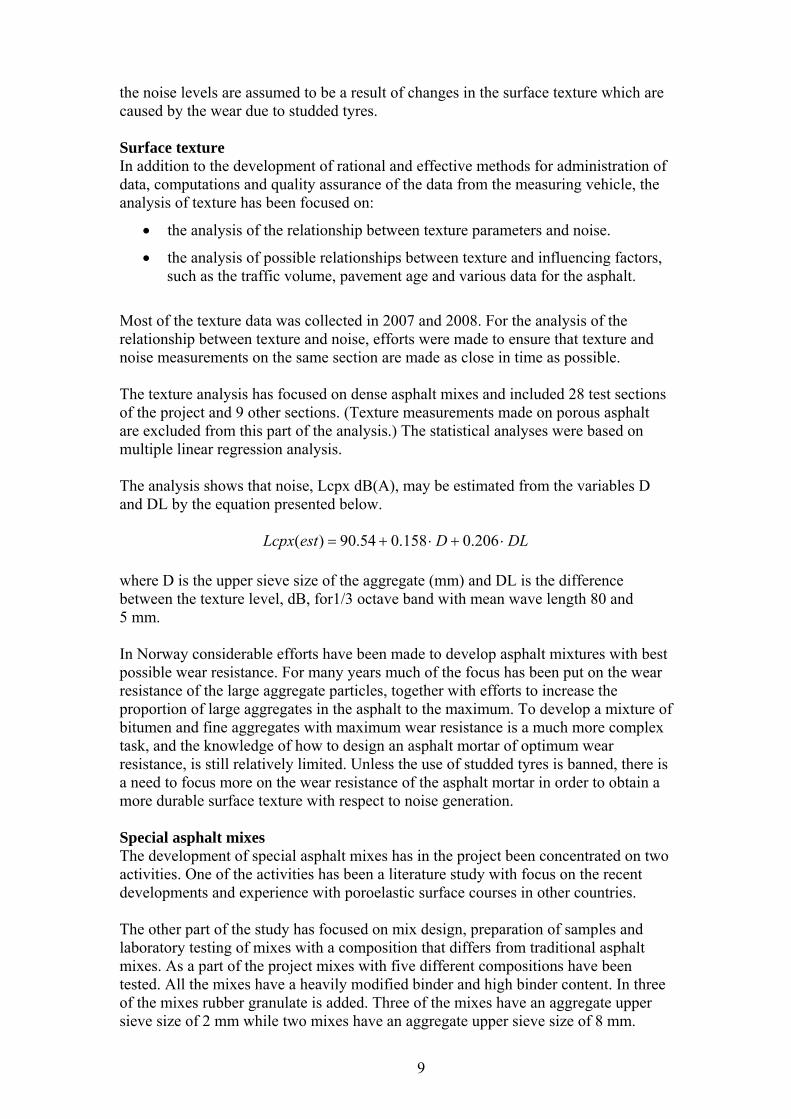
Most of the texture data was collected in 2007 and 2008. For the analysis of the relationship between texture and noise, efforts were made to ensure that texture and noise measurements on the same section are made as close in time as possible. The texture analysis has focused on dense asphalt mixes and included 28 test sections of the project and 9 other sections. (Texture measurements made on porous asphalt are excluded from this part of the analysis.) The statistical analyses were based on multiple linear regression analysis. The analysis shows that noise, Lcpx dB(A), may be estimated from the variables D and DL by the equation presented below.
DLDestLcpx 206.0158.054.90)( where D is the upper sieve size of the aggregate (mm) and DL is the difference between the texture level, dB, for1/3 octave band with mean wave length 80 and 5 mm. In Norway considerable efforts have been made to develop asphalt mixtures with best possible wear resistance. For many years much of the focus has been put on the wear resistance of the large aggregate particles, together with efforts to increase the proportion of large aggregates in the asphalt to the maximum. To develop a mixture of bitumen and fine aggregates with maximum wear resistance is a much more complex task, and the knowledge of how to design an asphalt mortar of optimum wear resistance, is still relatively limited. Unless the use of studded tyres is banned, there is a need to focus more on the wear resistance of the asphalt mortar in order to obtain a more durable surface texture with respect to noise generation. Special asphalt mixes The development of special asphalt mixes has in the project been concentrated on two activities. One of the activities has been a literature study with focus on the recent developments and experience with poroelastic surface courses in other countries. The other part of the study has focused on mix design, preparation of samples and laboratory testing of mixes with a composition that differs from traditional asphalt mixes. As a part of the project mixes with five different compositions have been tested. All the mixes have a heavily modified binder and high binder content. In three of the mixes rubber granulate is added. Three of the mixes have an aggregate upper sieve size of 2 mm while two mixes have an aggregate upper sieve size of 8 mm.
10
Friction The pavement condition with respect to friction was measured on the test sections at regular intervals. The friction measurements are done with the ROAR Mark III with fixed slip at a speed between 50 and 60 km/h depending on the speed limit. All results are adjusted to a speed of 60 km/h. The friction level of most of the sections is well above the lower allowable limit of 0,5 and must be considered fully acceptable. There is one exception from this conclusion. A section of AC 6 on E 6 in Hedmark county had acceptable friction properties when new, but the friction level was later reduced to 0,5 – 0,6 which is close to the allowable limit. Winter operations The observations on the winter operations have primarily been friction measurements at regular intervals during the winters 2006/2007 and 2007/2008, measurements of the amount of water and salt on the road surface as a function of time from the spreading of salt, and discussions with those who were involved in the winter operations of the roads. The friction in winter is measured at regular intervals on the test sections of Rv 170 at Bjørkelangen in Akershus county. The friction measured during the winter 2006/07 and 2007/08 indicated acceptable friction levels on all the test sections. There have been no special operations at the sections to ensure good friction of the porous surfaces during winter, neither with respect the quantity of salt which has been used nor the number of salting actions. On Rv 170 at Bjørkelangen the effect of cleaning of porous asphalt was evaluated with equipment rented from the Oslo Airport Authority, Gardermoen in the spring of 2007. In order to evaluate the effect of the cleaning process the cleaning was done on half of each of the sections. The effect of the cleaning was considered poor relative to the costs of cleaning. Cost benefit analysis TheInstitute of Transport Economics (TOI) has, as a part of a NFR-project “TORNADO/PROFO” and the EU-project SILVIA, developed a model for estimating the cost efficiency and cost-benefit analysis of low noise asphalt pavements. A new element has later been included in the cost-benefit analysis with respect to the asphalt properties, in particular their resistance to wear from studded tyres and dust production. Other elements of the models have been updated based on the results from noise measurements. For roads with AADT = 7 500 (two lanes) and 100 households per km the sensitivity analysis indicates that only the T 8x (asphalt thin layer, “best potential”) shows a net benefit > 0 for more than 50% of the probability mass.
11
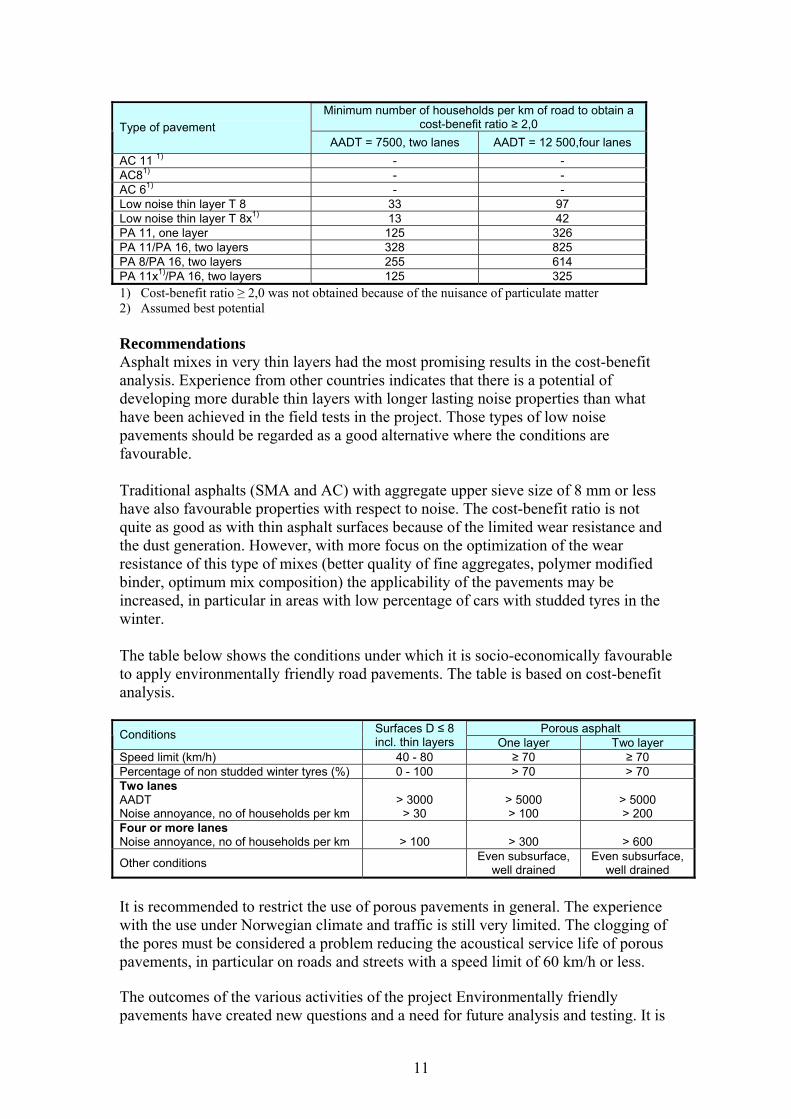
Minimum number of households per km of road to obtain a
cost-benefit ratio ≥ 2,0 Type of pavement AADT = 7500, two lanes AADT = 12 500,four lanes
AC 11 1) - - AC81) - - AC 61) - - Low noise thin layer T 8 33 97 Low noise thin layer T 8x1) 13 42 PA 11, one layer 125 326 PA 11/PA 16, two layers 328 825 PA 8/PA 16, two layers 255 614 PA 11x1)/PA 16, two layers 125 325
1) Cost-benefit ratio ≥ 2,0 was not obtained because of the nuisance of particulate matter 2) Assumed best potential Recommendations Asphalt mixes in very thin layers had the most promising results in the cost-benefit analysis. Experience from other countries indicates that there is a potential of developing more durable thin layers with longer lasting noise properties than what have been achieved in the field tests in the project. Those types of low noise pavements should be regarded as a good alternative where the conditions are favourable. Traditional asphalts (SMA and AC) with aggregate upper sieve size of 8 mm or less have also favourable properties with respect to noise. The cost-benefit ratio is not quite as good as with thin asphalt surfaces because of the limited wear resistance and the dust generation. However, with more focus on the optimization of the wear resistance of this type of mixes (better quality of fine aggregates, polymer modified binder, optimum mix composition) the applicability of the pavements may be increased, in particular in areas with low percentage of cars with studded tyres in the winter. The table below shows the conditions under which it is socio-economically favourable to apply environmentally friendly road pavements. The table is based on cost-benefit analysis.
Porous asphalt Conditions Surfaces D ≤ 8 incl. thin layers One layer Two layer
Speed limit (km/h) 40 - 80 ≥ 70 ≥ 70 Percentage of non studded winter tyres (%) 0 - 100 > 70 > 70 Two lanes AADT Noise annoyance, no of households per km
> 3000 > 30
> 5000 > 100
> 5000 > 200
Four or more lanes Noise annoyance, no of households per km
> 100
> 300
> 600
Other conditions Even subsurface,
well drained Even subsurface,
well drained
It is recommended to restrict the use of porous pavements in general. The experience with the use under Norwegian climate and traffic is still very limited. The clogging of the pores must be considered a problem reducing the acoustical service life of porous pavements, in particular on roads and streets with a speed limit of 60 km/h or less. The outcomes of the various activities of the project Environmentally friendly pavements have created new questions and a need for future analysis and testing. It is

12
considered important to maintain and develop the knowledge gained during the project. It is recommended that some of the activities of the project are pursued. A continuation of the monitoring of present field test sectios is recommended. This is also considered important for international projects which have recently been initiated. There are reasons to believe that there is potential for further improvements for both thin asphalt layers and traditional pavements with D ≤ 8 mm. This can probably be achieved through more focus on a the mortar phase, proper selection of wear resistant fine aggregates, selection of binder and an optimization of the mix composition. A revision of Håndbok 018 should include recommendations for the selection of asphalt mixes with enhanced envorimnmental properties. The Nord 2000 models for noise estimation should be updated with noise data generated in the project. To produce overall plans for noise reduction measures based on the noise maps which include an evaluation of all alternative measures for noise reduction (low noise pavemens, noise barrier, façade insulation, traffic speed reduction and other traffic measures).
13
1 Background A research and development project named ’Environmentally Friendly Pavements’ has been conducted by the Norwegian Public Roads Administration in close cooperation with research institutions and the road industry. The project was launched in 2004 and was completed in 2009. The main focus of the project has been to optimise the environmental properties of road surfaces with respect to low road tyre noise emission and road dust, in particular dust generated by the wear of pavements by studded tires. The goals of the project were to:
Reduce the traffic noise annoyance from roads and streets Improve the air quality in densely populated areas
Building better competence in these two areas, as a basis for the development and implementation of solutions that can aid to reach these goals, is necessary. Better competence is also necessary to benefit from research and development activities in other countries and find practical solutions which can be implemented on roads and streets in Norway. 1.1 Road dust Report no 25 (2002-2003) to the Storting on The Government’s Environmental Policy and the State of the Environment in Norway has sat four national targets for local air quality, one of which states that “The 24-hour mean concentration of particulate matter (PM10) shall not exceed 50 μg/m3 on more than 25 days per year by 2005 and 7 days per year by 2010”. This target is stricter than the requirements in the Regulations relating to pollution control (Pollution Regulations) of 2004-06-01 which says 50 μg/m3 of particulate matter (PM10) on maximum 25 days per year by 2005-01-01. The national targets of Report no 25 (2002-2003) to the Storting are reiterated in Report no 26 (2006-2007) to the Storting on The Government’s Environmental Policy and the State of the Environment in Norway. This white paper emphasised that: “The national targets are applicable to all roads in Norway. In 2005 the air quality in Oslo and Trondheim has been computed, and the results showed that the national targets for particulate matter (PM10) and benzene are exceeded. Measurements made in other towns and cities in Norway also show that the national targets for PM10 are exceeded. It is indicated that it may be difficult to comply with the national targets and that additional measures to those applied untill now are required. The Report to the Storting stated that the computations for Oslo indicated that more than 230 000 dwellers (approximately 46% of inhabitants) live in areas which are exposed to particulate matter concentrations higher than the national targets for 2010. The main sources are firewood used for heating homes and road traffic. In areas close to major roads the contribution of road traffic, firewood, and other sources to dust pollution is approximately 73%, 15% and 12% respectively. Since 2003 the contribution from road traffic has increased by 3% while the contribution from the other sources has decreased by 3%. For Trondheim the computations for 2005 show that there are more than 20 000 dwellers in areas exposed to particulate matter concentrations higher than the national targets for 2010. In spite of a trend indicating a reduction of the
14
concentration of particulate matter with time, it will be rather difficult to comply with the national targets without additional measures. The majority of the dwellers exposed to concentrations higher than the national targets for 2010, live in areas close to the city centres or near heavily trafficked roads and streets. Increase the portion of nonstudded tyres in winter Increasing the portion of non studded tyres in winter is a very effective measure to reduce the wear of asphalt pavements, which will also have a favourable effect on the traffic generated noise. Levying of a fee for using studded tyres is one of the measures that municipalities can use to reduce particulate matter concentrations. Payment of fee for the use of studded tyres has been effective and lead to reduction in air pollution in Oslo, Trondheim and Bergen. In 2006 the percentage of cars with nonstudded tyres was as high as 81 and 65 in Oslo and Trondheim respectively. Computations show that the number of persons exposed to dust concentrations higher than the national targets may be reduced by 72% and 59% in Oslo and Trondheim if the portion of nonstudded tyres is increased to 85 and 75% respectively. The city council of Oslo has a goal of 90% nonstudded tyres. The Norwegian Pollution Control Authority has estimated that the national targets for PM10 in 2010 can be achieved if the use of studded tyres is reduced to a minimum in combinations with other measures. However, a closer study of the effect of reducing the the proportion of studed tyres to below 10% on dust concentrations and traffic safety is required before further reduction and any other measures are taken. The Report to the Storting includes discussions of various measures to achieve a reduction in local air pollution from road traffic. The project Environmentally friendly Pavements has focused on several of the measures which are discussed in the Report to the Storting. 1.2 Noise Report no 25 (2002-2003) to the Storting on The Government’s Environmental Policy and the State of the Environment in Norway has set a national target to reduce the noise annoyance by 25% from the 1999 level by 2010. The national target for noise annoyance is in Report no 26 (2006 – 2007) to the Storting adjusted to a 10% reduction by 2020 from the 1999 level. By 2020 the number of people exposed to indoor noise levels exceeding 38 dB will be reduced by 30% compared with the 2005 level. The adjustment of the national targets for noise is a result of the evaluation which was discussed in the Report no 8 (1999 – 2000) to the Storting. It is clear that the adjustment is a result of a recognition that the implementation of measures for noise reduction takes more time than originally assumed. The new national targets are also quite ambitious and require a considerable amount of effort nationally and a satisfactory evolvement internationally. In the Report to the Storting it is stated that the ambitious goals require measures which focus on noise reduction at the source. Measures taken at the source promise to be very effective and have a positive influence on reduction on the noise annoyance of more people at lower costs than noise barriers and sound insulation façade.
15
Low noise pavements The potential effect of noise reduction at the source by use of low noise pavements is very high. There is, however, a limited experience in Norway with respect to the service lives of low noise pavements, both with respect to functional and acoustical properties of the pavements with time. In Norway, there are also challenges related to frost and the drainage of porous pavements as well as clogging of the pores caused by accumulation of particles generated from the studded tyre wear of the pavements. The Government will therefore prolong and strengthen the project “Environmentally friendly pavements.” The Government will also participate in international cooperations on research and development of very thin asphalt layers and other types of low noise pavements. The Government also intends to place low noise pavements on a selection of roads where the annoyance is substantial. This requires, however, that the development of low noise pavements creates acceptable results with respect to the functional properties and the pavements have a positive net benefit for the community. Speed A reduction of the speed by 5 – 10 km/h will reduce the noise level by 1 – 2 dB, depending on the percentage of heavy traffic. This measure has a low cost and has also a positive influence on the air pollution, better accessibility for pedestrians and bicycles, as well as fewer and less severe accidents. The Government will therefore consider reduction of speed limits to 30 and 40 km/h for a selection of roads in urban and densely populated areas, as well as a speed limit of 60 km/h for some of the access roads in the major cities. The government will promote the development and use of measures which lead to better enforcement of the speed limits. Reduction in the use of studded tyres Reduction in the use of studded tyres will lead to reduction in traffic noise in winter. It will also contribute to reduction in the wear of the pavements as well as less clogging of porous pavements, which creates a better environment for the use of low noise pavements. The Government will therefore consider measures which promotes an increase in the use of nonstudded tyres in the cities through discussion with the municipalities on measures necessary to promote the use of nonstudded tyres. This includes fee for the use of studded tyres. Pollution control directive According to section 5 of the pollution control directive (FOR- 2004-06-01-931), noise reduction measures are required if the average indoor noise level exceed Leq,24h 42 dB(A). According to the directive the owner of a building shall map noise levels down to 35 dB Leq,24h in areas subjected to major road, rail and air traffic and to assess measures to reduce the noise levels. Roads with AADT 16 400 or more are included in the first phase of mapping (2007/2008), in the second phase (2011/2012) this applies to roads with AADT of 8 200 or more. In Appendix 3 of the directive examples of measures that can be used to reduce noise levels are presented. Low noise road pavements are considered as “technical measures at noise source”.

16
2 Goals and expectations of the project A strategy for the implementation of environmentally friendly pavements must ensure that the environmental aspects, traffic safety as well as the functional properties of the road pavements are included. Measures to enhance the environmental properties should be at acceptable costs and must not create unacceptable properties in other areas. The goals of the project for five areas are presented below: A. Noise measurements Obtain an oversight of the acoustical properties of pavements in regular use in Norway and develop realistic potential for noise reductions by an increased use of low noise pavements. B. Functional properties Develop requirements for the functional properties of low noise dense and porous pavements to be used in built up areas. In this context functional properties include noise reduction and the durability of the noise reduction as well as dust production and traditional properties such as wear and functional service lives of the asphalt. The requirements may vary depending on the traffic volume, the use of studded tyres, traffic speed and climate. C. Cost-benefit analysis Carry out cost-benefit analysis to estimate the effect of including the use of low noise pavements in the pavement maintenance strategy in Norway. The cost-benefit analysis must as a minimum include:
Costs Traffic safety Environmental aspects Health aspects
D. Strategy Develop a strategy for the use of environmentally friendly pavements in Norway. The strategy must as a minimum include:
Where should the pavements be used? Criteria of success for the implementation of environmentally friendly
pavements. What is required of information and training of those involved in pavement
maintenance in order to ensure that environmentally friendly pavements are considered a viable alternative?
How to measure the environmental effects of the use of environmentally friendly pavements after implementation?
E. Information and training Conduct one or two seminars during the project period and a seminar at the completion of the project. The subject of seminars shall include the major findings and conclusions of the various activities in the project. A web site shall be used to present the activities and the reports from the project. The results shal also be presented in the news paper “Vegen og vi” and the magazine “Våre veger” as well as other magazines during the project period.

17
3 The project activities 3.1 The Work Packages Based on the goals and expectations presented above, the project is carried out through 10 work packages. These work packages are: Work Package 1: Project administration Work Package 2: Development of a strategy Work Package 3: Particulate matter Work Package 4: Noise Work Package 5: Information, training Work Package 6: Maintenance and operations Work Package 7: Field testing Work Package 8: Functional requirements Work Package 9: Cost-benefit analysis Work Package 10: Special asphalt mixes During the project period Work Package 2 and 8 are merged and the description is changed to “Application, classification and requirements”. Each of the work packages had its own budget and budget limits. The budget of the project, including indirect costs, has been 15,5 mill NOK. The costs of asphalt for the field sections are not included in the budget. These costs are included in the regular pavement maintenance budgets. 3.2 Dust The goals of the Work Package ”Particulate matter” are described as follows:
Conduct a survey of the competence in the field in the Nordic countries and clarify the main challenges related to traffic generated airborne dust.
Analyse the various sources and mechanism of dust production and airborne dust.
Through field tests and laboratory analyses determine which factors play a central role in the process of dust production.
Give advice with respect to asphalt mix design to minimize the traffic generated dust from pavements.
The doctoral theses of Brynhild Snilsberg ”Pavement wear and airborne dust pollution in Norway - Characterization of the physical and chemical properties of dust particles”, (Ref. 11) is included as an integral and substantial part of the work package. The activities of the work package are split into three subtasks: field investigations, analysis of dust generated in a road simulator and evaluation of methods for dust generation (ref. 12). The main part of the field investigations has been sampling of dust at various heights above the street level at E 6 in Trondheim (Elgesetergate, urban street, speed limit 50 km/h). The objective was to determine the dust downfall per 30 days as a function of time of the year and the height from the street level. The investigation also included characterization of the dust composition, in particular the amount of organic and
18
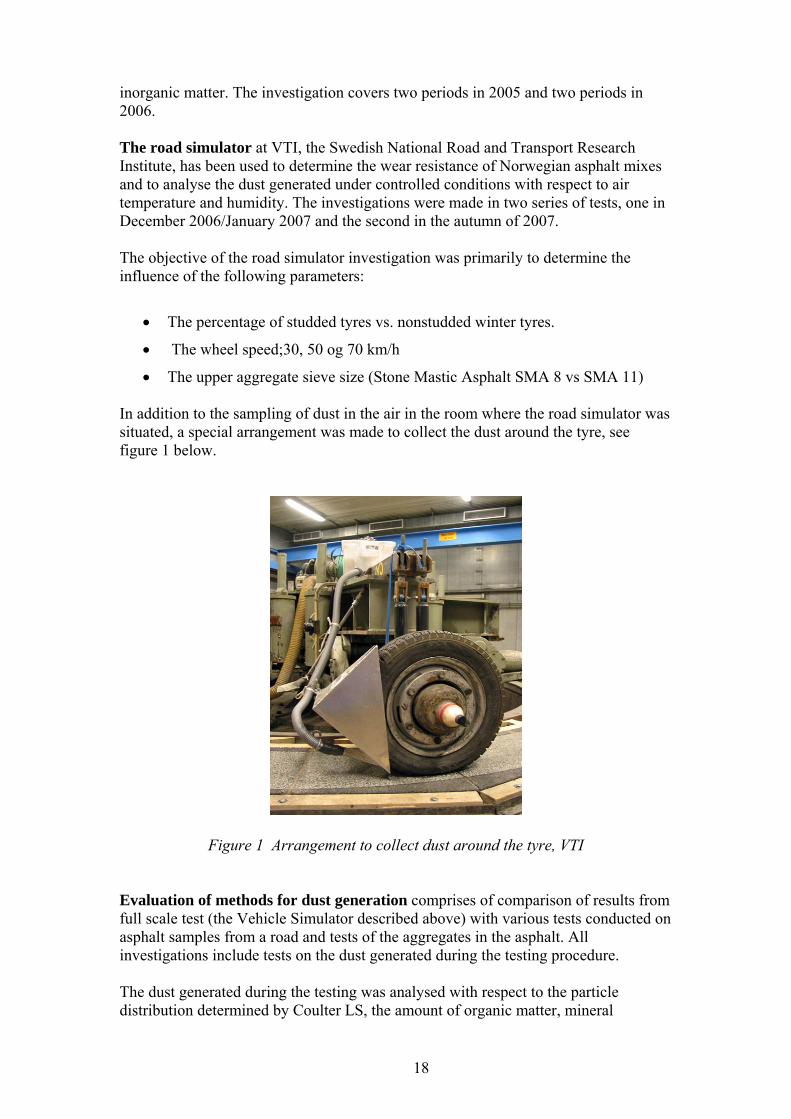
inorganic matter. The investigation covers two periods in 2005 and two periods in 2006. The road simulator at VTI, the Swedish National Road and Transport Research Institute, has been used to determine the wear resistance of Norwegian asphalt mixes and to analyse the dust generated under controlled conditions with respect to air temperature and humidity. The investigations were made in two series of tests, one in December 2006/January 2007 and the second in the autumn of 2007. The objective of the road simulator investigation was primarily to determine the influence of the following parameters:
The percentage of studded tyres vs. nonstudded winter tyres.
The wheel speed;30, 50 og 70 km/h
The upper aggregate sieve size (Stone Mastic Asphalt SMA 8 vs SMA 11) In addition to the sampling of dust in the air in the room where the road simulator was situated, a special arrangement was made to collect the dust around the tyre, see figure 1 below.
Figure 1 Arrangement to collect dust around the tyre, VTI Evaluation of methods for dust generation comprises of comparison of results from full scale test (the Vehicle Simulator described above) with various tests conducted on asphalt samples from a road and tests of the aggregates in the asphalt. All investigations include tests on the dust generated during the testing procedure. The dust generated during the testing was analysed with respect to the particle distribution determined by Coulter LS, the amount of organic matter, mineral
19
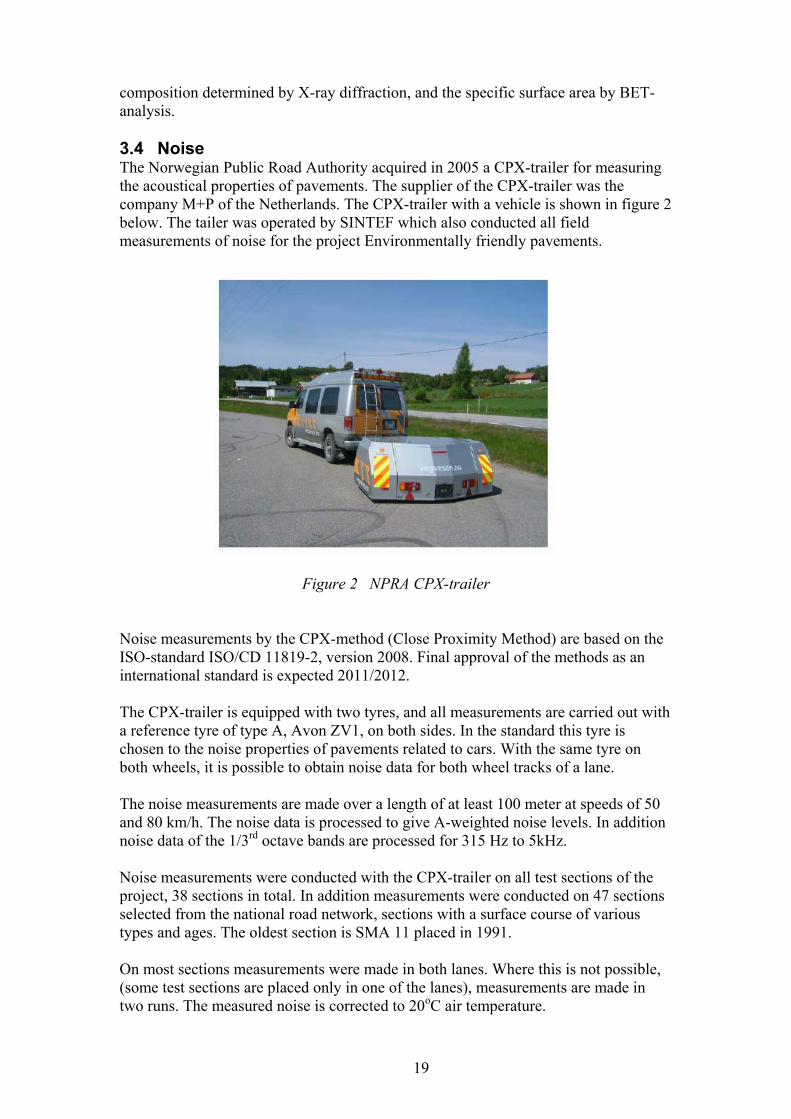
composition determined by X-ray diffraction, and the specific surface area by BET-analysis. 3.4 Noise The Norwegian Public Road Authority acquired in 2005 a CPX-trailer for measuring the acoustical properties of pavements. The supplier of the CPX-trailer was the company M+P of the Netherlands. The CPX-trailer with a vehicle is shown in figure 2 below. The tailer was operated by SINTEF which also conducted all field measurements of noise for the project Environmentally friendly pavements.
Figure 2 NPRA CPX-trailer
Noise measurements by the CPX-method (Close Proximity Method) are based on the ISO-standard ISO/CD 11819-2, version 2008. Final approval of the methods as an international standard is expected 2011/2012. The CPX-trailer is equipped with two tyres, and all measurements are carried out with a reference tyre of type A, Avon ZV1, on both sides. In the standard this tyre is chosen to the noise properties of pavements related to cars. With the same tyre on both wheels, it is possible to obtain noise data for both wheel tracks of a lane. The noise measurements are made over a length of at least 100 meter at speeds of 50 and 80 km/h. The noise data is processed to give A-weighted noise levels. In addition noise data of the 1/3rd octave bands are processed for 315 Hz to 5kHz. Noise measurements were conducted with the CPX-trailer on all test sections of the project, 38 sections in total. In addition measurements were conducted on 47 sections selected from the national road network, sections with a surface course of various types and ages. The oldest section is SMA 11 placed in 1991. On most sections measurements were made in both lanes. Where this is not possible, (some test sections are placed only in one of the lanes), measurements are made in two runs. The measured noise is corrected to 20oC air temperature.

20
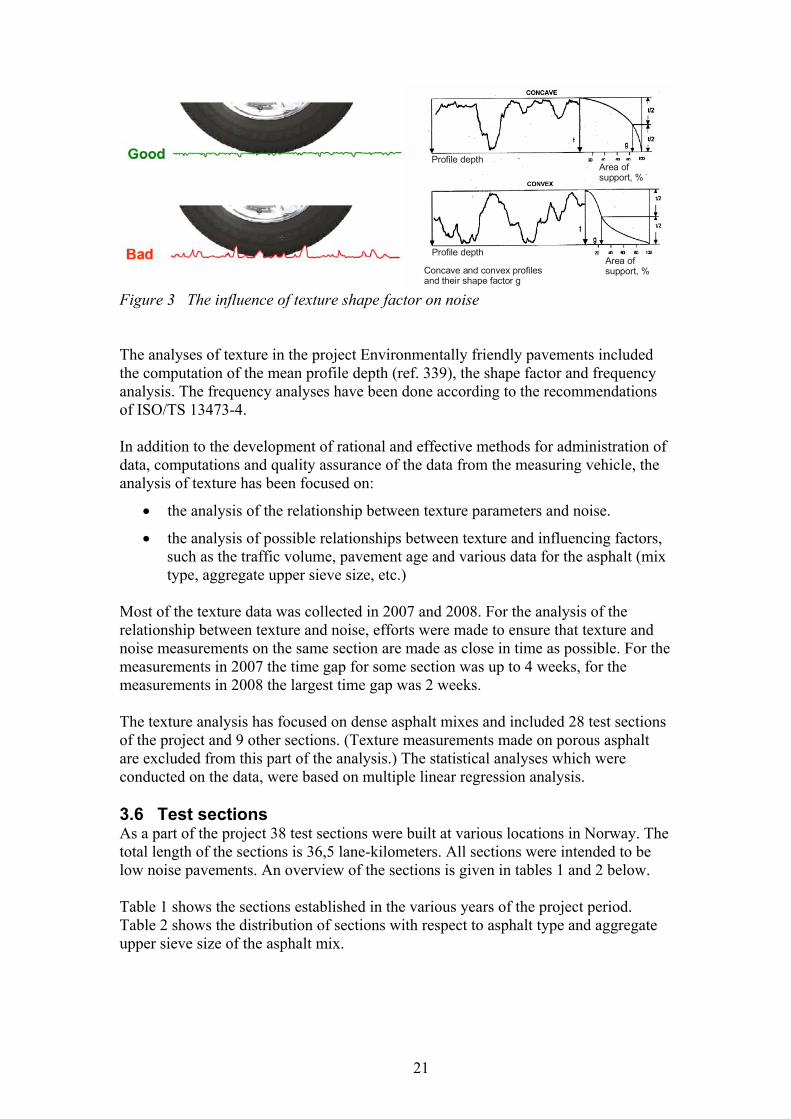
The noise properties of the pavements are compared to reference values. The reference values are the average of all CPX- measurements made on stone mastic asphalt, SMA, more than one year after the surface course was placed. The reference values are as follows: 50 km/t: 93,0 dB(A) 80 km/t 100,0 dB(A) In addition to statistical analysis of the results with respect to average, standard deviations and 90%-percentiles, the noise levels were analysed with respect to pavement age. 3.5 Surface texture Analysis of the surface texture of road pavements plays a central role in the understanding of noise related properties of pavements, in particular with respect to the changes that take place with time as a result of wear due to studded tires. Surface texture is usually divided into micro texture, macro texture and mega texture. Micro texture has a wavelength less than 0.5 mm. Micro texture is primarily caused by the surface properties of the individual particles. Micro texture has normally not a very large influence on the noise properties of the asphalt pavement, but may be related to the generation of dust from the wear from studded tyres. Macro texture has a wavelength from 0,5 mm to 50 mm. Macro texture has a large influence on the noise properties of the pavement surface. All analyses in the project Environmentally friendly road pavements have focused on macro texture. Mega texture has a wavelength from 50 to 500 mm. Mega texture contributes to the generation of noise, primarily through vibrations in the vehicles. Since 1988 results from annual measurements of rut depth and roughness (IRI) have played a central role in the pavement maintenance system for the national road network and for most of the county roads. The latest the measuring vehicles are also capable of analysing the texture of the road surface. The system has primarily been used for computation of the mean profile depth as a relatively simple expression of the surface texture. The system may, however, be used for more detailed analysis of texture. In this project the shape factor (Gestaltfaktor) and frequency analysis were included. The influence of the shape factor on noise is illustrated in figure 3 below. In the upper part of the figure texture with a shape factor (G-faktor) in the order of 0,85 is shown. This surface is characterized by a flat surface with pores. This texture is typical for most newly laid asphalt surfaces. The lower part of the figure shows a surface with protruding stones . The shape factor is 0,25 which is quite negative for the noise generation. This texture is typical for a surface after some years of wear from studded tyres.
21
Profile depth
Profile depth
Concave and convex profiles and their shape factor g
Area ofsupport, %
Area ofsupport, %
Figure 3 The influence of texture shape factor on noise The analyses of texture in the project Environmentally friendly pavements included the computation of the mean profile depth (ref. 339), the shape factor and frequency analysis. The frequency analyses have been done according to the recommendations of ISO/TS 13473-4. In addition to the development of rational and effective methods for administration of data, computations and quality assurance of the data from the measuring vehicle, the analysis of texture has been focused on:
the analysis of the relationship between texture parameters and noise.
the analysis of possible relationships between texture and influencing factors, such as the traffic volume, pavement age and various data for the asphalt (mix type, aggregate upper sieve size, etc.)
Most of the texture data was collected in 2007 and 2008. For the analysis of the relationship between texture and noise, efforts were made to ensure that texture and noise measurements on the same section are made as close in time as possible. For the measurements in 2007 the time gap for some section was up to 4 weeks, for the measurements in 2008 the largest time gap was 2 weeks. The texture analysis has focused on dense asphalt mixes and included 28 test sections of the project and 9 other sections. (Texture measurements made on porous asphalt are excluded from this part of the analysis.) The statistical analyses which were conducted on the data, were based on multiple linear regression analysis. 3.6 Test sections As a part of the project 38 test sections were built at various locations in Norway. The total length of the sections is 36,5 lane-kilometers. All sections were intended to be low noise pavements. An overview of the sections is given in tables 1 and 2 below. Table 1 shows the sections established in the various years of the project period. Table 2 shows the distribution of sections with respect to asphalt type and aggregate upper sieve size of the asphalt mix.

22
Year No of sections Sum of lane length, km
2005 19 8,943 2006 8 7,120 2007 9 17,030 2008 2 4,050 Sum 38 37,143
Table 1 Test sections established 2005 – 2008
Sum of lane length of the test sections, km Aggregate upper sieve
size Asphalt concrete
Stone mastic asphalt
Porous asphalt
Other Sum
6 mm 7,5 0,7 8,2 8 mm 1,1 18,9 4,1 10,3 17,3
11 mm 1.1 3,1 6,6 0,5 11,3 16 mm 0,3 0,3 Sum 9,7 6,0 10,7 10,8 37,1
Table 2 Length of the test sections, distribution with respect to asphalt type and the
upper sieve size The asphalt type ”Other” includes both very thin surface courses as well as rubber asphalt mixes. Reference sections with standard asphalt mixes are included in Table 1 and 2. A more detailed list of the test sections is given in Appendix 1, which also includes map information on the geographical situation of the test sections. The major asphalt contractors in Norway were invited to participate in the research and development activities of the project. This includes laboratory testing of candidate compositions and mix design as well as production and laying of the various test mixes. An agreement was made with Kolo Veidekke AS, Lemminkainen Norge AS and NCC Roads AS according to a procurement process involving negotiations with a limited number of bidders. The contractors conducted a considerable amount of testing. The selection of mixes for the field testing was based on the results of the contractors’ laboratory tests. The most comprehensive field testing was done on the test sections on Rv 170 at Bjørkelangen in Akershus county, where three test sections of two-layer porous asphalt were placed, in addition to reference sections of one layer of porous asphalt. Noise and texture were measured on a yearly basis on all sections. The experience of those involved in the winter operation of the road was recorded, and friction was measured at regular interval during the winters. On the half of each sections the effect of cleaning with equipment rented from the Oslo Airport Authority, was analysed. In addition to the work done by the asphalt contractors and the tests referred to above, SINTEF has done field measurements and a large number of laboratory tests on cores taken from the pavement, se Ref 18 and 19. The pavement condition with respect to rut depths and roughness (IRI) are measured annually. From this data the pavement service life is estimated. On most of the field
23
sections (27 sections in total) the friction is measured annually using ROaR, a friction measurement device. The testing on cores taken from the pavements included:
Resistance to studded tyre wear, the Trøger method
Resistance to studded tyre wear, the Prall method
Resistance to permanent deformation, Wheel Track
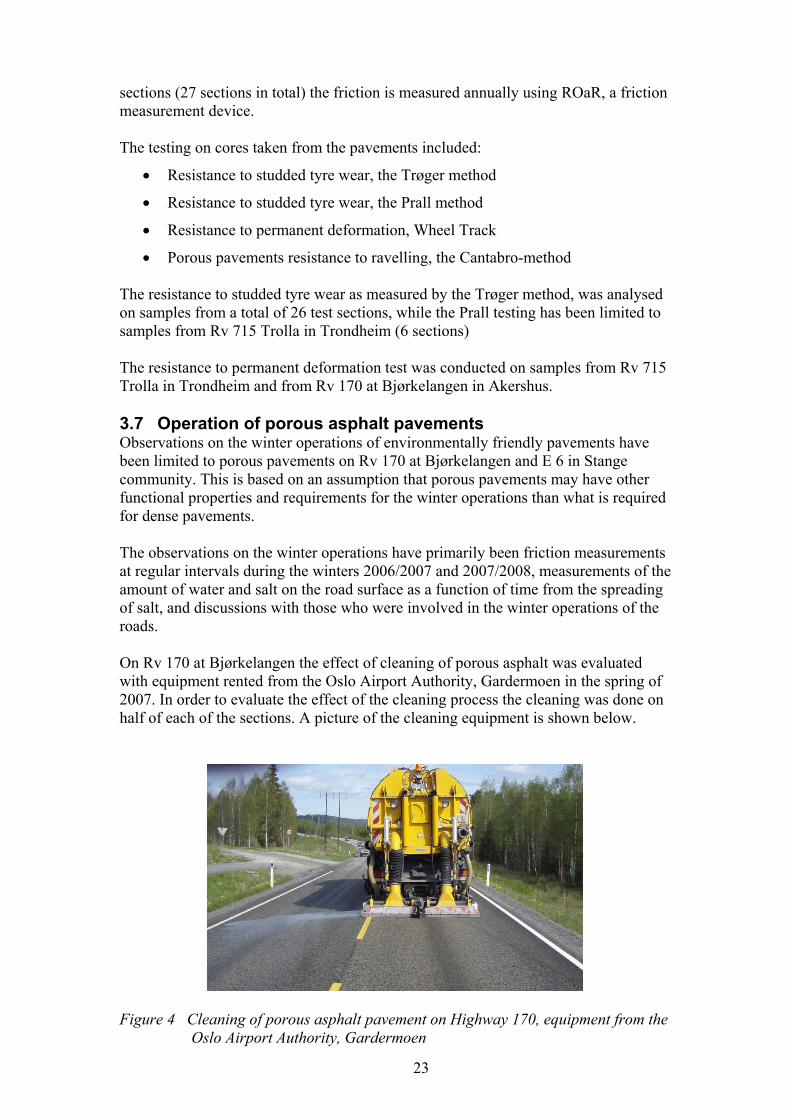
Porous pavements resistance to ravelling, the Cantabro-method The resistance to studded tyre wear as measured by the Trøger method, was analysed on samples from a total of 26 test sections, while the Prall testing has been limited to samples from Rv 715 Trolla in Trondheim (6 sections) The resistance to permanent deformation test was conducted on samples from Rv 715 Trolla in Trondheim and from Rv 170 at Bjørkelangen in Akershus. 3.7 Operation of porous asphalt pavements Observations on the winter operations of environmentally friendly pavements have been limited to porous pavements on Rv 170 at Bjørkelangen and E 6 in Stange community. This is based on an assumption that porous pavements may have other functional properties and requirements for the winter operations than what is required for dense pavements. The observations on the winter operations have primarily been friction measurements at regular intervals during the winters 2006/2007 and 2007/2008, measurements of the amount of water and salt on the road surface as a function of time from the spreading of salt, and discussions with those who were involved in the winter operations of the roads. On Rv 170 at Bjørkelangen the effect of cleaning of porous asphalt was evaluated with equipment rented from the Oslo Airport Authority, Gardermoen in the spring of 2007. In order to evaluate the effect of the cleaning process the cleaning was done on half of each of the sections. A picture of the cleaning equipment is shown below.
Figure 4 Cleaning of porous asphalt pavement on Highway 170, equipment from the
Oslo Airport Authority, Gardermoen
24
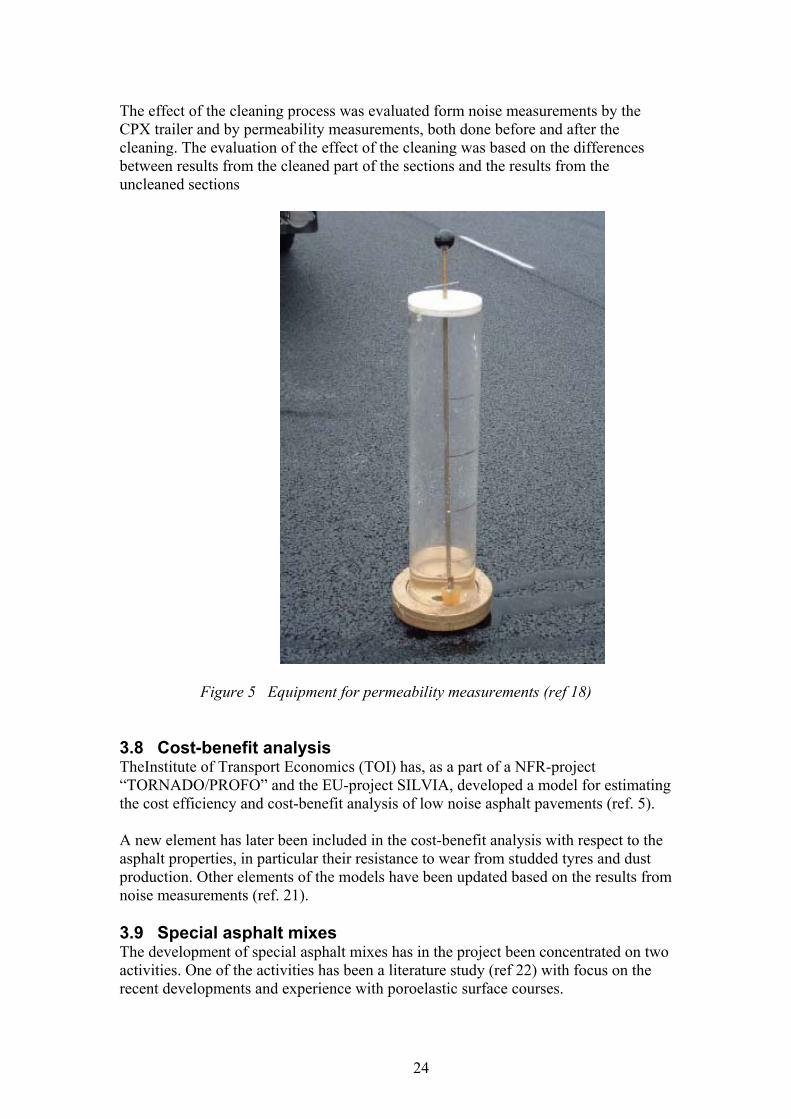
The effect of the cleaning process was evaluated form noise measurements by the CPX trailer and by permeability measurements, both done before and after the cleaning. The evaluation of the effect of the cleaning was based on the differences between results from the cleaned part of the sections and the results from the uncleaned sections
Figure 5 Equipment for permeability measurements (ref 18)
3.8 Cost-benefit analysis TheInstitute of Transport Economics (TOI) has, as a part of a NFR-project “TORNADO/PROFO” and the EU-project SILVIA, developed a model for estimating the cost efficiency and cost-benefit analysis of low noise asphalt pavements (ref. 5). A new element has later been included in the cost-benefit analysis with respect to the asphalt properties, in particular their resistance to wear from studded tyres and dust production. Other elements of the models have been updated based on the results from noise measurements (ref. 21). 3.9 Special asphalt mixes The development of special asphalt mixes has in the project been concentrated on two activities. One of the activities has been a literature study (ref 22) with focus on the recent developments and experience with poroelastic surface courses.
25
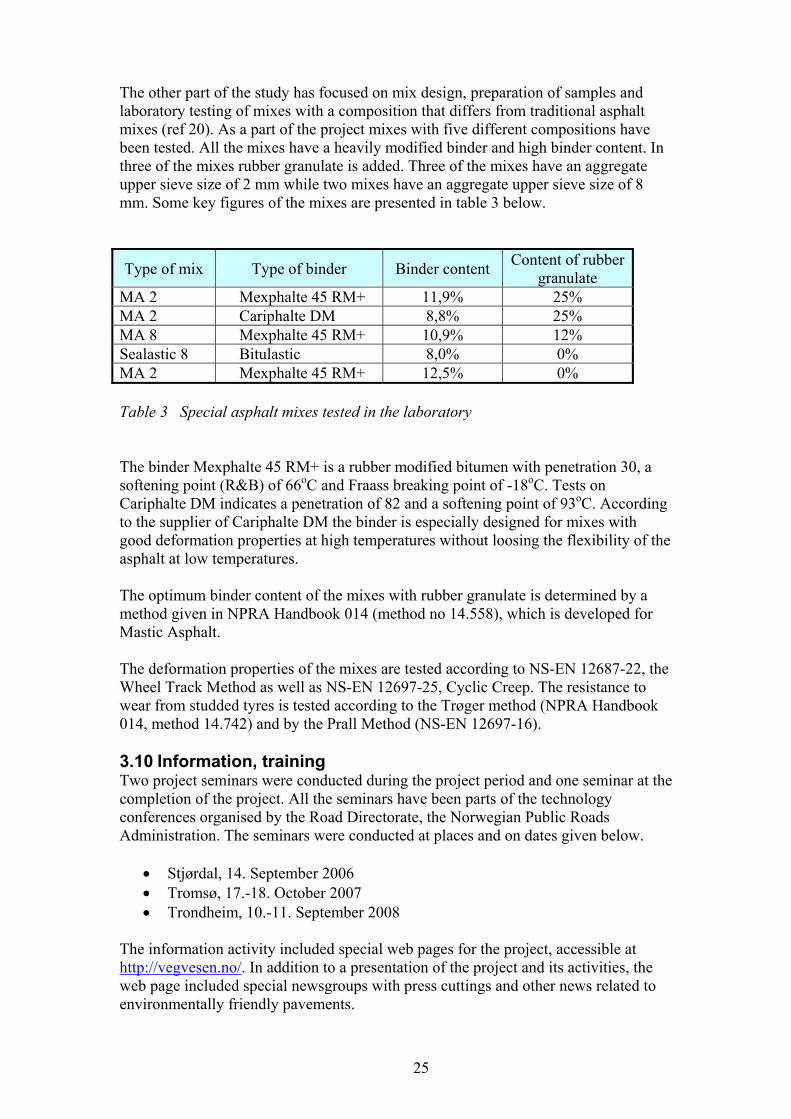
The other part of the study has focused on mix design, preparation of samples and laboratory testing of mixes with a composition that differs from traditional asphalt mixes (ref 20). As a part of the project mixes with five different compositions have been tested. All the mixes have a heavily modified binder and high binder content. In three of the mixes rubber granulate is added. Three of the mixes have an aggregate upper sieve size of 2 mm while two mixes have an aggregate upper sieve size of 8 mm. Some key figures of the mixes are presented in table 3 below.
Type of mix Type of binder Binder content Content of rubber
granulate MA 2 Mexphalte 45 RM+ 11,9% 25% MA 2 Cariphalte DM 8,8% 25% MA 8 Mexphalte 45 RM+ 10,9% 12% Sealastic 8 Bitulastic 8,0% 0% MA 2 Mexphalte 45 RM+ 12,5% 0% Table 3 Special asphalt mixes tested in the laboratory The binder Mexphalte 45 RM+ is a rubber modified bitumen with penetration 30, a softening point (R&B) of 66oC and Fraass breaking point of -18oC. Tests on Cariphalte DM indicates a penetration of 82 and a softening point of 93oC. According to the supplier of Cariphalte DM the binder is especially designed for mixes with good deformation properties at high temperatures without loosing the flexibility of the asphalt at low temperatures. The optimum binder content of the mixes with rubber granulate is determined by a method given in NPRA Handbook 014 (method no 14.558), which is developed for Mastic Asphalt. The deformation properties of the mixes are tested according to NS-EN 12687-22, the Wheel Track Method as well as NS-EN 12697-25, Cyclic Creep. The resistance to wear from studded tyres is tested according to the Trøger method (NPRA Handbook 014, method 14.742) and by the Prall Method (NS-EN 12697-16). 3.10 Information, training Two project seminars were conducted during the project period and one seminar at the completion of the project. All the seminars have been parts of the technology conferences organised by the Road Directorate, the Norwegian Public Roads Administration. The seminars were conducted at places and on dates given below.
Stjørdal, 14. September 2006 Tromsø, 17.-18. October 2007 Trondheim, 10.-11. September 2008
The information activity included special web pages for the project, accessible at http://vegvesen.no/. In addition to a presentation of the project and its activities, the web page included special newsgroups with press cuttings and other news related to environmentally friendly pavements.
26
4 Findings and results of the project In the sections below the main results of the work packages of the project are presented and discussed. 4.1 Dust
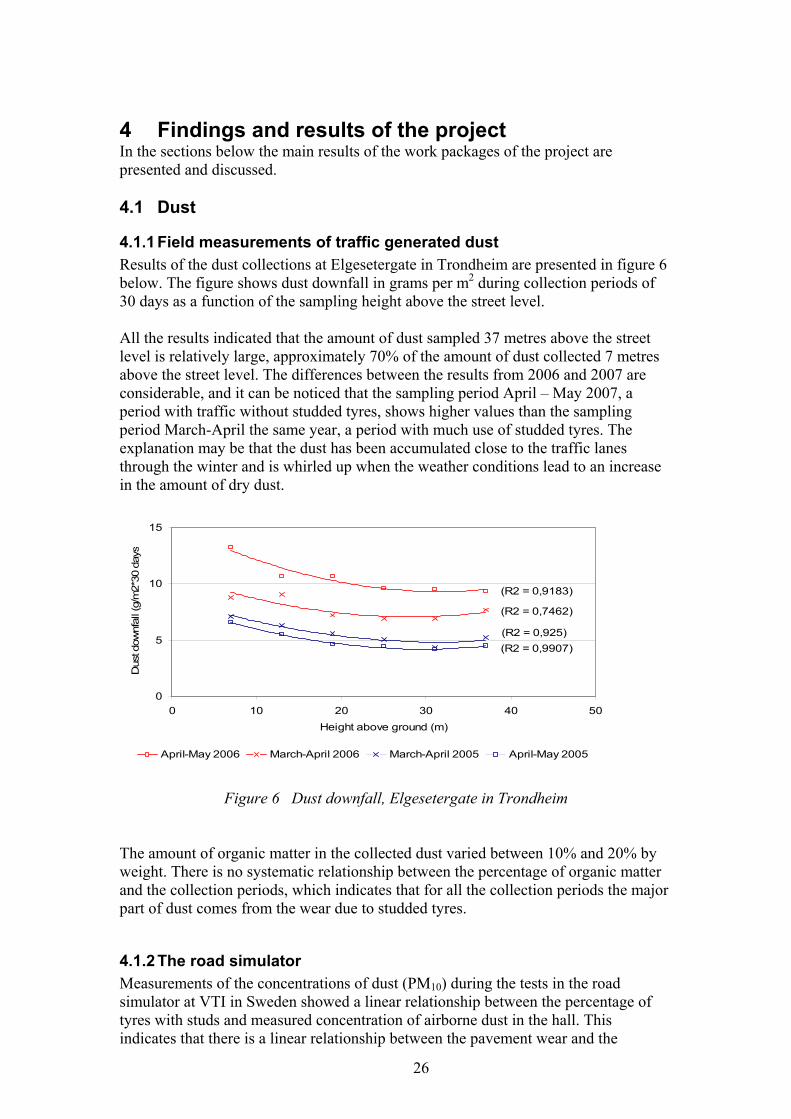
4.1.1 Field measurements of traffic generated dust Results of the dust collections at Elgesetergate in Trondheim are presented in figure 6 below. The figure shows dust downfall in grams per m2 during collection periods of 30 days as a function of the sampling height above the street level. All the results indicated that the amount of dust sampled 37 metres above the street level is relatively large, approximately 70% of the amount of dust collected 7 metres above the street level. The differences between the results from 2006 and 2007 are considerable, and it can be noticed that the sampling period April – May 2007, a period with traffic without studded tyres, shows higher values than the sampling period March-April the same year, a period with much use of studded tyres. The explanation may be that the dust has been accumulated close to the traffic lanes through the winter and is whirled up when the weather conditions lead to an increase in the amount of dry dust.
(R2 = 0,9183)
(R2 = 0,7462)
(R2 = 0,925)
(R2 = 0,9907)
0
5
10
15
0 10 20 30 40 50
Height above ground (m)
Dust
dow
nfa
ll (g
/m2*3
0 d
ays
April-May 2006 March-April 2006 March-April 2005 April-May 2005
Figure 6 Dust downfall, Elgesetergate in Trondheim
The amount of organic matter in the collected dust varied between 10% and 20% by weight. There is no systematic relationship between the percentage of organic matter and the collection periods, which indicates that for all the collection periods the major part of dust comes from the wear due to studded tyres.
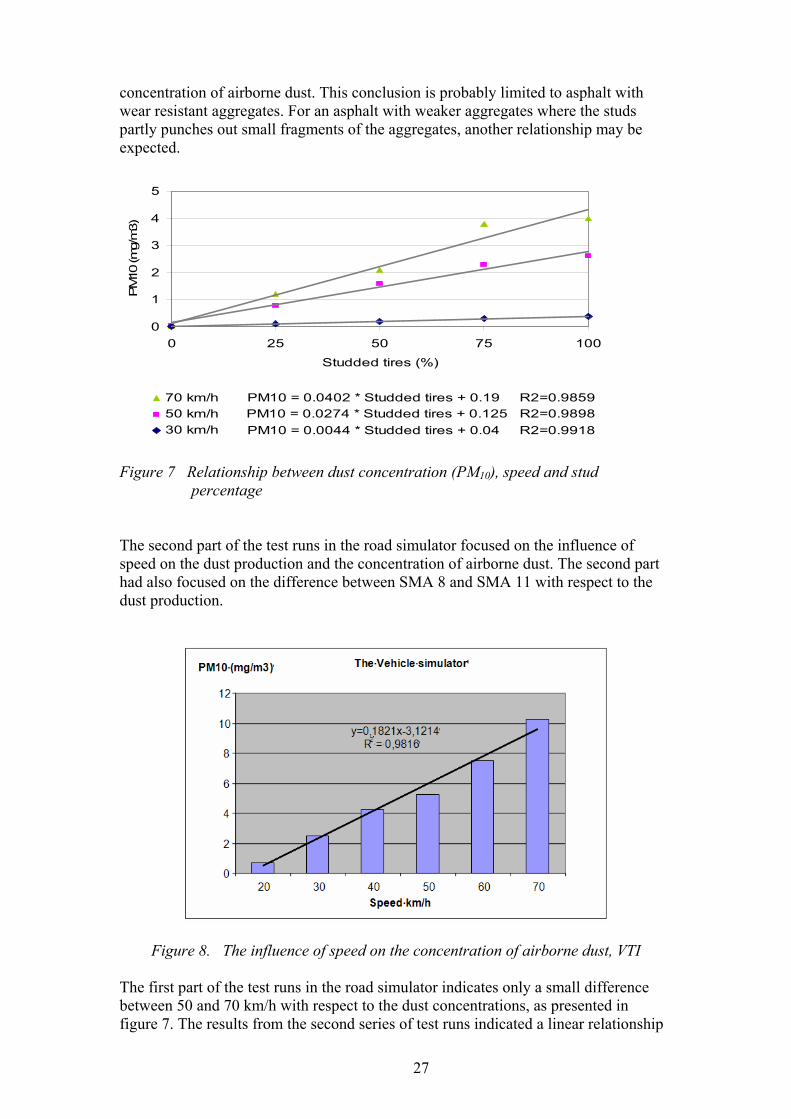
4.1.2 The road simulator Measurements of the concentrations of dust (PM10) during the tests in the road simulator at VTI in Sweden showed a linear relationship between the percentage of tyres with studs and measured concentration of airborne dust in the hall. This indicates that there is a linear relationship between the pavement wear and the
27
concentration of airborne dust. This conclusion is probably limited to asphalt with wear resistant aggregates. For an asphalt with weaker aggregates where the studs partly punches out small fragments of the aggregates, another relationship may be expected.
Figure 7 Relationship between dust concentration (PM10), speed and stud
percentage
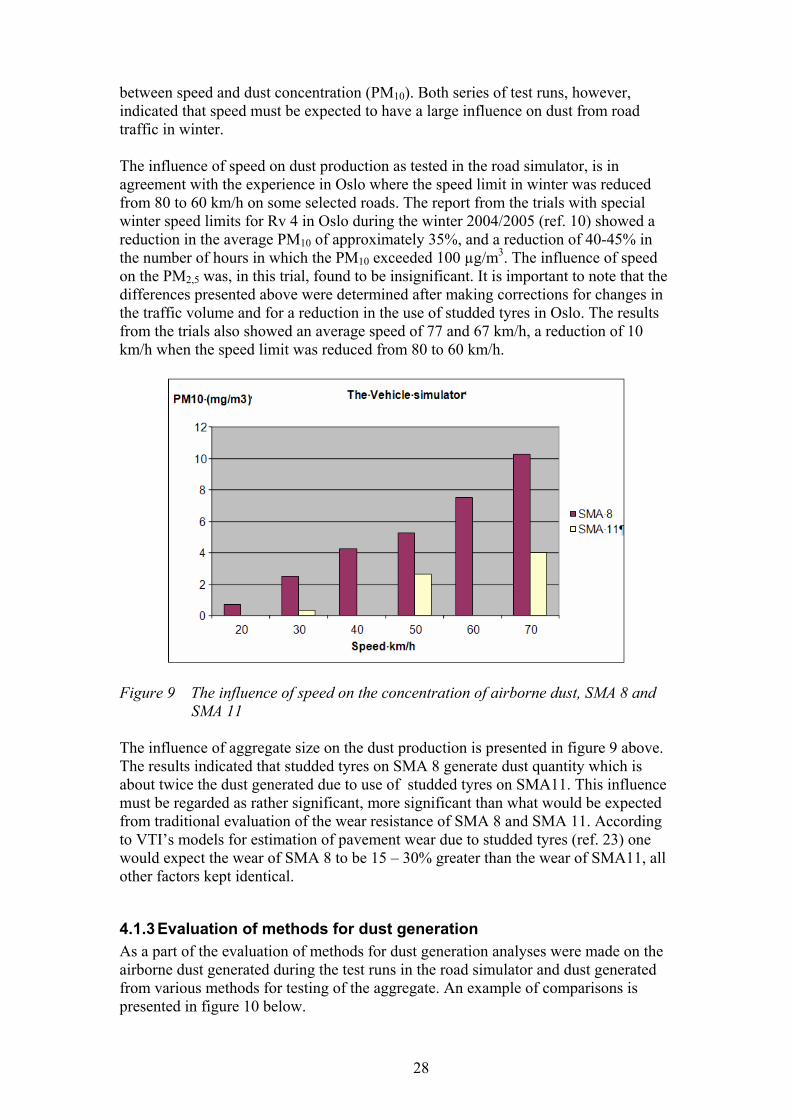
The second part of the test runs in the road simulator focused on the influence of speed on the dust production and the concentration of airborne dust. The second part had also focused on the difference between SMA 8 and SMA 11 with respect to the dust production.
Figure 8. The influence of speed on the concentration of airborne dust, VTI The first part of the test runs in the road simulator indicates only a small difference between 50 and 70 km/h with respect to the dust concentrations, as presented in figure 7. The results from the second series of test runs indicated a linear relationship
PM10 = 0.0044 * Studded tires + 0.04 R2=0.9918
PM10 = 0.0274 * Studded tires + 0.125 R2=0.9898
PM10 = 0.0402 * Studded tires + 0.19 R2=0.9859
0
1
2
3
4
5
0 25 50 75 100
Studded tires (%)
PM
10 (m
g/m
3)
70 km/h
50 km/h
30 km/h
28
between speed and dust concentration (PM10). Both series of test runs, however, indicated that speed must be expected to have a large influence on dust from road traffic in winter. The influence of speed on dust production as tested in the road simulator, is in agreement with the experience in Oslo where the speed limit in winter was reduced from 80 to 60 km/h on some selected roads. The report from the trials with special winter speed limits for Rv 4 in Oslo during the winter 2004/2005 (ref. 10) showed a reduction in the average PM10 of approximately 35%, and a reduction of 40-45% in the number of hours in which the PM10 exceeded 100 µg/m3. The influence of speed on the PM2,5 was, in this trial, found to be insignificant. It is important to note that the differences presented above were determined after making corrections for changes in the traffic volume and for a reduction in the use of studded tyres in Oslo. The results from the trials also showed an average speed of 77 and 67 km/h, a reduction of 10 km/h when the speed limit was reduced from 80 to 60 km/h.
Figure 9 The influence of speed on the concentration of airborne dust, SMA 8 and
SMA 11 The influence of aggregate size on the dust production is presented in figure 9 above. The results indicated that studded tyres on SMA 8 generate dust quantity which is about twice the dust generated due to use of studded tyres on SMA11. This influence must be regarded as rather significant, more significant than what would be expected from traditional evaluation of the wear resistance of SMA 8 and SMA 11. According to VTI’s models for estimation of pavement wear due to studded tyres (ref. 23) one would expect the wear of SMA 8 to be 15 – 30% greater than the wear of SMA11, all other factors kept identical.
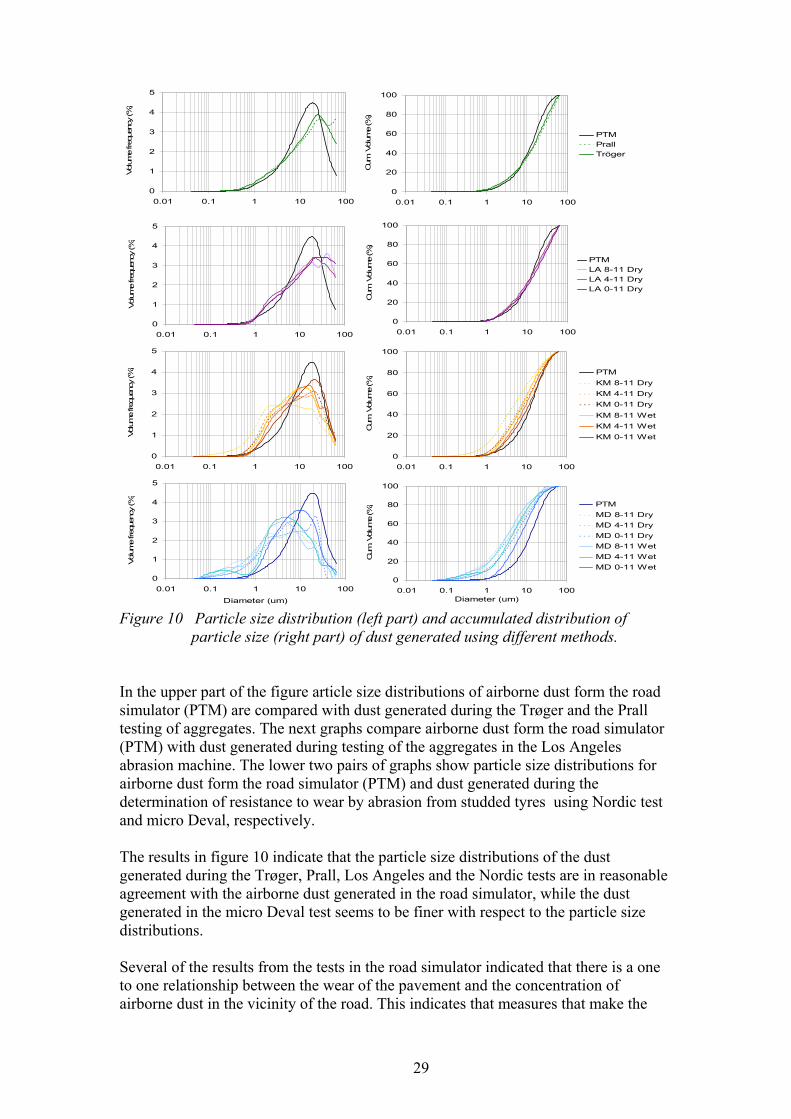
4.1.3 Evaluation of methods for dust generation As a part of the evaluation of methods for dust generation analyses were made on the airborne dust generated during the test runs in the road simulator and dust generated from various methods for testing of the aggregate. An example of comparisons is presented in figure 10 below.
29
0
1
2
3
4
5
0.01 0.1 1 10 100
Volum
e freq
uenc
y (%
)
0
1
2
3
4
5
0.01 0.1 1 10 100
Volum
e freq
uen
cy (%
)
0
1
2
3
4
5
0.01 0.1 1 10 100
Diameter (um)
Volum
e freq
uenc
y (%
)
0
20
40
60
80
100
0.01 0.1 1 10 100
Cum
. Volum
e (%
)
PTM
LA 8-11 Dry
LA 4-11 Dry
LA 0-11 Dry
0
20
40
60
80
100
0.01 0.1 1 10 100
Cum
. Volum
e (%
) PTM
KM 8-11 Dry
KM 4-11 Dry
KM 0-11 Dry
KM 8-11 Wet
KM 4-11 Wet
KM 0-11 Wet
0
20
40
60
80
100
0.01 0.1 1 10 100Diameter (um)
Cum
. Volum
e (%
) PTM
MD 8-11 Dry
MD 4-11 Dry
MD 0-11 Dry
MD 8-11 Wet
MD 4-11 Wet
MD 0-11 Wet
0
1
2
3
4
5
0.01 0.1 1 10 100
Volum
e freq
uenc
y (%
)
0
20
40
60
80
100
0.01 0.1 1 10 100
Cum
. Volum
e (%
)
PTM
Prall
Tröger
Figure 10 Particle size distribution (left part) and accumulated distribution of
particle size (right part) of dust generated using different methods. In the upper part of the figure article size distributions of airborne dust form the road simulator (PTM) are compared with dust generated during the Trøger and the Prall testing of aggregates. The next graphs compare airborne dust form the road simulator (PTM) with dust generated during testing of the aggregates in the Los Angeles abrasion machine. The lower two pairs of graphs show particle size distributions for airborne dust form the road simulator (PTM) and dust generated during the determination of resistance to wear by abrasion from studded tyres using Nordic test and micro Deval, respectively. The results in figure 10 indicate that the particle size distributions of the dust generated during the Trøger, Prall, Los Angeles and the Nordic tests are in reasonable agreement with the airborne dust generated in the road simulator, while the dust generated in the micro Deval test seems to be finer with respect to the particle size distributions. Several of the results from the tests in the road simulator indicated that there is a one to one relationship between the wear of the pavement and the concentration of airborne dust in the vicinity of the road. This indicates that measures that make the
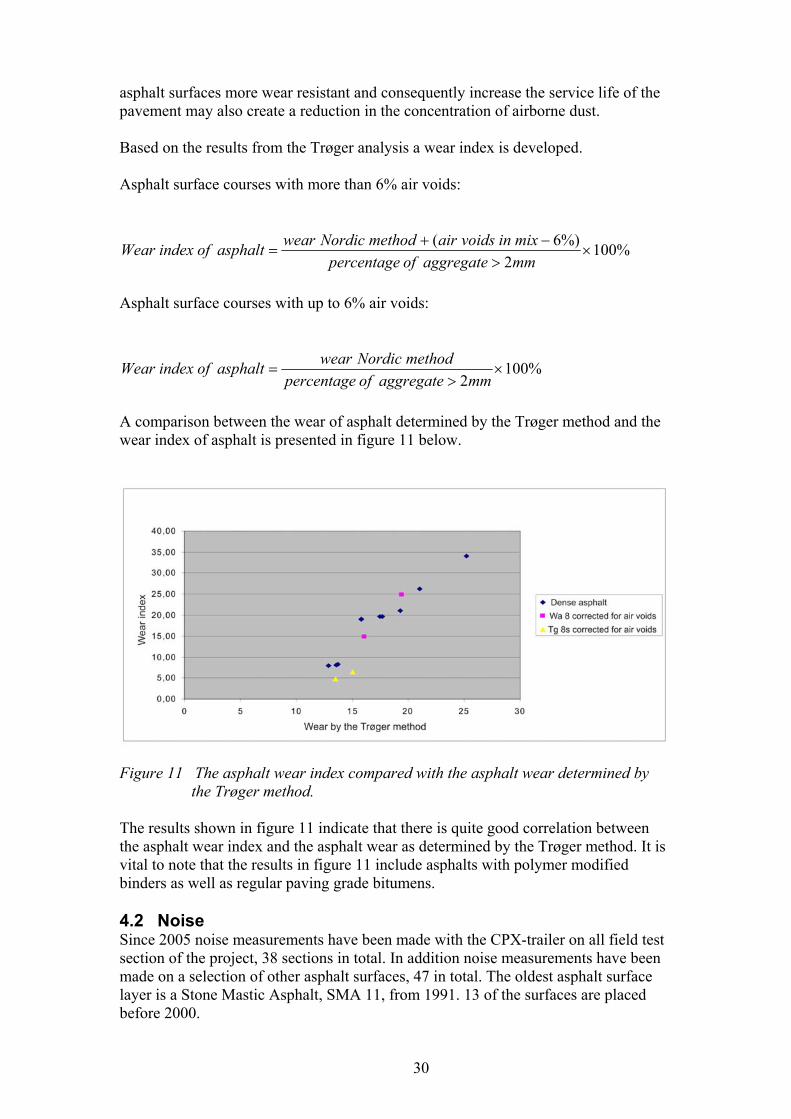
30
asphalt surfaces more wear resistant and consequently increase the service life of the pavement may also create a reduction in the concentration of airborne dust. Based on the results from the Trøger analysis a wear index is developed. Asphalt surface courses with more than 6% air voids:
%1002
%)6(
mmaggregateofpercentage
mixinvoidsairmethodNordicwearasphaltofindexWear
Asphalt surface courses with up to 6% air voids:
%1002
mmaggregateofpercentage
methodNordicwearasphaltofindexWear
A comparison between the wear of asphalt determined by the Trøger method and the wear index of asphalt is presented in figure 11 below.
Figure 11 The asphalt wear index compared with the asphalt wear determined by
the Trøger method. The results shown in figure 11 indicate that there is quite good correlation between the asphalt wear index and the asphalt wear as determined by the Trøger method. It is vital to note that the results in figure 11 include asphalts with polymer modified binders as well as regular paving grade bitumens. 4.2 Noise Since 2005 noise measurements have been made with the CPX-trailer on all field test section of the project, 38 sections in total. In addition noise measurements have been made on a selection of other asphalt surfaces, 47 in total. The oldest asphalt surface layer is a Stone Mastic Asphalt, SMA 11, from 1991. 13 of the surfaces are placed before 2000.
31
4.2.1 Selection of a reference surface Stone Mastic Asphalt, SMA 11, older than one year was selected as a reference surface for the noise measurements. SMA 11 is the most common wearing course on roads with heavy traffic where noise nuisance is a problem. It is important that the age is at least one year to ensure that the surface has been subjected to at least one winter of studded tyre wear. Based on the average of the results from measurements on SMA 11, the following reference levels were chosen to be representative CPX-levels: 50 km/h: 93,0 dB(A) 80 km/h: 100,0 dB(A) All results from the noise measurements are corrected to an air temperature of 20oC. For the corrections the following correction coefficients were used. Dense asphalt surfaces: -0,06 dB/oC Porous asphalt surfaces: -0,03 dB/oC In the recent years there has been a trend in pavement maintenance in Norway to increase the use of SMA 11 and to reduce the use of SMA 16. Except in the three most northern counties, SMA 16 is at present (2008) very little used for regular pavement maintenance. For asphalt concrete there has been an increase in the use of AC 11 and a corresponding reduction in the use of AC 16. At the time when Report no 25 to the Storting was written, SMA 16 was the most widely used surface course on roads with large traffic volumes. The change from SMA 16 to SMA 11 has created a reduction in the noise levels in the order of magnitude of 0,5-1,9 dB(A) near heavily trafficked roads and streets.
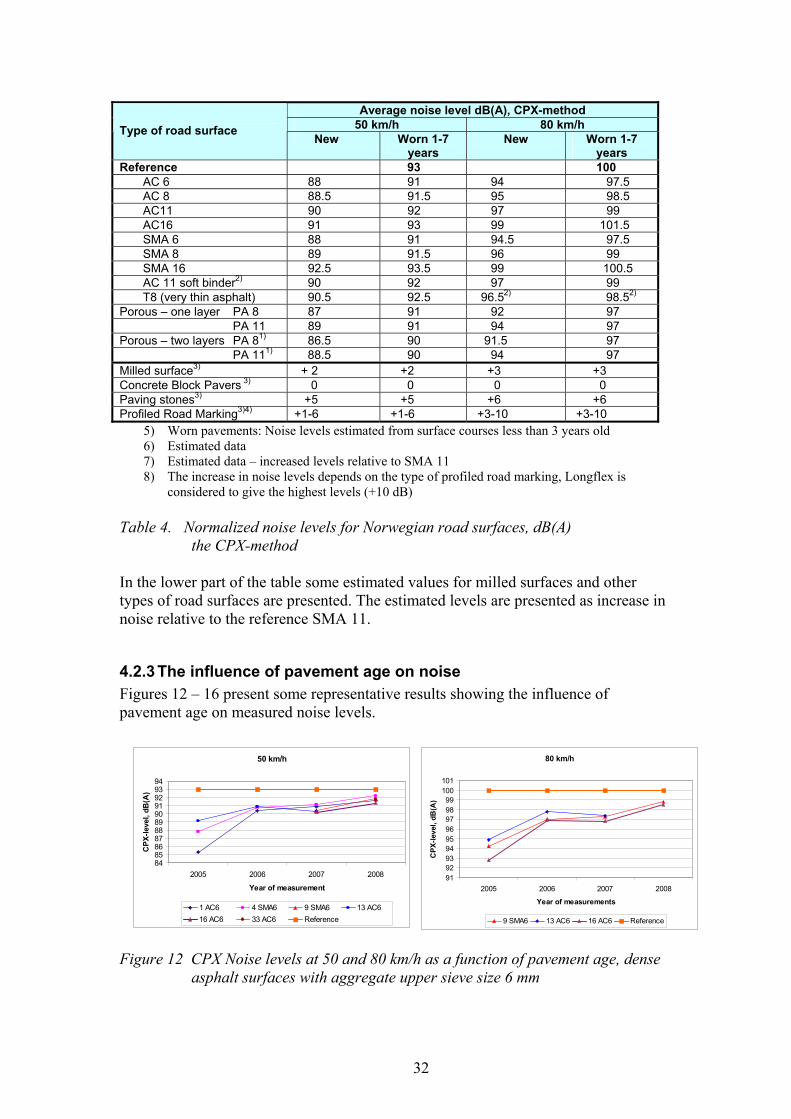
4.2.2 Normalized noise levels Table 4 gives an overview of the average noise levels measured by the CPX-method on roads in Norway. The results are rounded to the nearest 0,5 dB(A). The normalized noise levels are not solely based on mathematical averages of measured noise levels. In addition the variations in the results have been looked at before the normalized noise levels are decided.
32
Average noise level dB(A), CPX-method
50 km/h 80 km/h Type of road surface New Worn 1-7
years New Worn 1-7
years Reference 93 100 AC 6 88 91 94 97.5 AC 8 88.5 91.5 95 98.5 AC11 90 92 97 99 AC16 91 93 99 101.5 SMA 6 88 91 94.5 97.5 SMA 8 89 91.5 96 99 SMA 16 92.5 93.5 99 100.5 AC 11 soft binder2) 90 92 97 99 T8 (very thin asphalt) 90.5 92.5 96.52) 98.52) Porous – one layer PA 8 87 91 92 97 PA 11 89 91 94 97 Porous – two layers PA 81) 86.5 90 91.5 97 PA 111) 88.5 90 94 97 Milled surface3) + 2 +2 +3 +3 Concrete Block Pavers 3) 0 0 0 0 Paving stones3) +5 +5 +6 +6 Profiled Road Marking3)4) +1-6 +1-6 +3-10 +3-10
5) Worn pavements: Noise levels estimated from surface courses less than 3 years old 6) Estimated data 7) Estimated data – increased levels relative to SMA 11 8) The increase in noise levels depends on the type of profiled road marking, Longflex is
considered to give the highest levels (+10 dB) Table 4. Normalized noise levels for Norwegian road surfaces, dB(A)
the CPX-method In the lower part of the table some estimated values for milled surfaces and other types of road surfaces are presented. The estimated levels are presented as increase in noise relative to the reference SMA 11.
4.2.3 The influence of pavement age on noise Figures 12 – 16 present some representative results showing the influence of pavement age on measured noise levels.
Figure 12 CPX Noise levels at 50 and 80 km/h as a function of pavement age, dense
asphalt surfaces with aggregate upper sieve size 6 mm
50 km/h
8485868788899091929394
2005 2006 2007 2008
Year of measurement
CP
X-l
evel
, dB
(A)
1 AC6 4 SMA6 9 SMA6 13 AC6
16 AC6 33 AC6 Reference
80 km/h
919293949596979899
100101
2005 2006 2007 2008
Year of measurements
CP
X-l
evel
, dB
(A)
9 SMA6 13 AC6 16 AC6 Reference
33
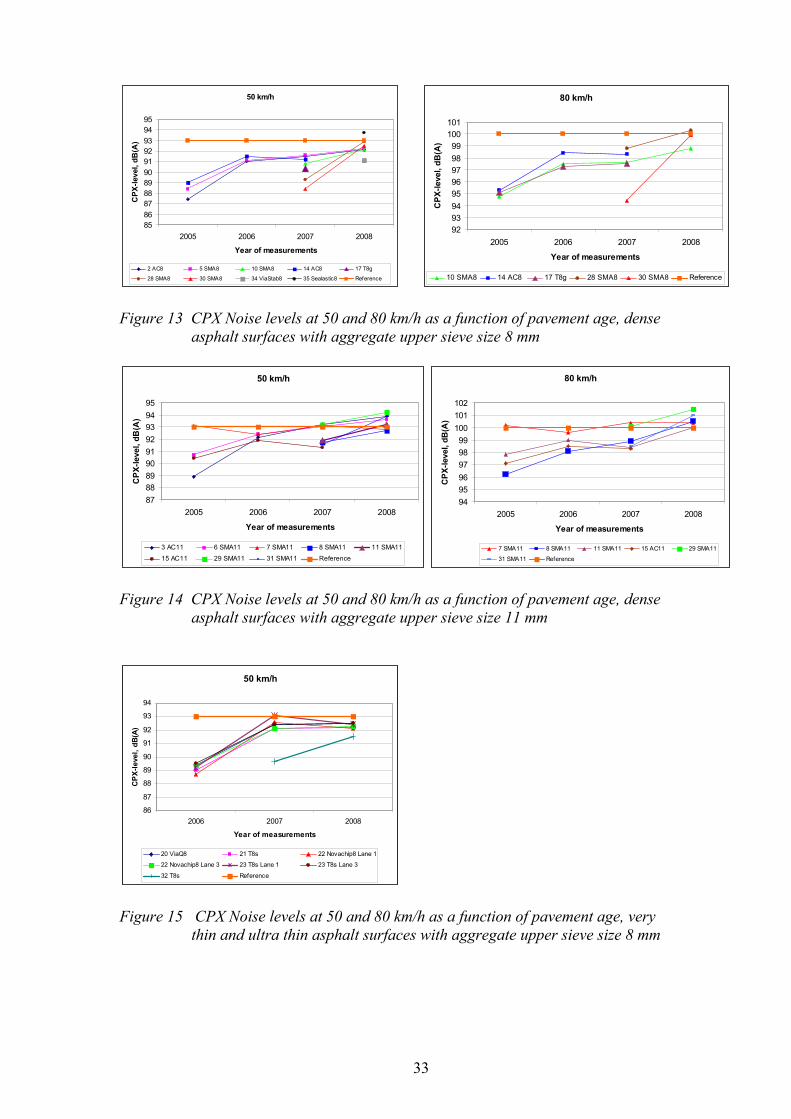
Figure 13 CPX Noise levels at 50 and 80 km/h as a function of pavement age, dense
asphalt surfaces with aggregate upper sieve size 8 mm
Figure 14 CPX Noise levels at 50 and 80 km/h as a function of pavement age, dense
asphalt surfaces with aggregate upper sieve size 11 mm
50 km/h
86
87
88
89
90
91
92
93
94
2006 2007 2008
Year of measurements
CP
X-l
evel
, d
B(A
)
20 ViaQ8 21 T8s 22 Novachip8 Lane 1
22 Novachip8 Lane 3 23 T8s Lane 1 23 T8s Lane 3
32 T8s Reference
Figure 15 CPX Noise levels at 50 and 80 km/h as a function of pavement age, very
thin and ultra thin asphalt surfaces with aggregate upper sieve size 8 mm
50 km/h
8586
87888990
919293
9495
2005 2006 2007 2008
Year of measurements
CP
X-l
evel
, dB
(A)
2 AC8 5 SMA8 10 SMA8 14 AC8 17 T8g
28 SMA8 30 SMA8 34 ViaStab8 35 Sealastic8 Reference
80 km/h
9293
94
95
96
9798
99
100
101
2005 2006 2007 2008
Year of measurements
CP
X-l
evel
, dB
(A)
10 SMA8 14 AC8 17 T8g 28 SMA8 30 SMA8 Reference
50 km/h
87
88
89
90
91
92
93
94
95
2005 2006 2007 2008
Year of measurements
CP
X-l
evel
, dB
(A)
3 AC11 6 SMA11 7 SMA11 8 SMA11 11 SMA11
15 AC11 29 SMA11 31 SMA11 Reference
80 km/h
94
95
96
97
98
99
100
101
102
2005 2006 2007 2008
Year of measurements
CP
X-l
evel
, dB
(A)
7 SMA11 8 SMA11 11 SMA11 15 AC11 29 SMA11
31 SMA11 Reference
34
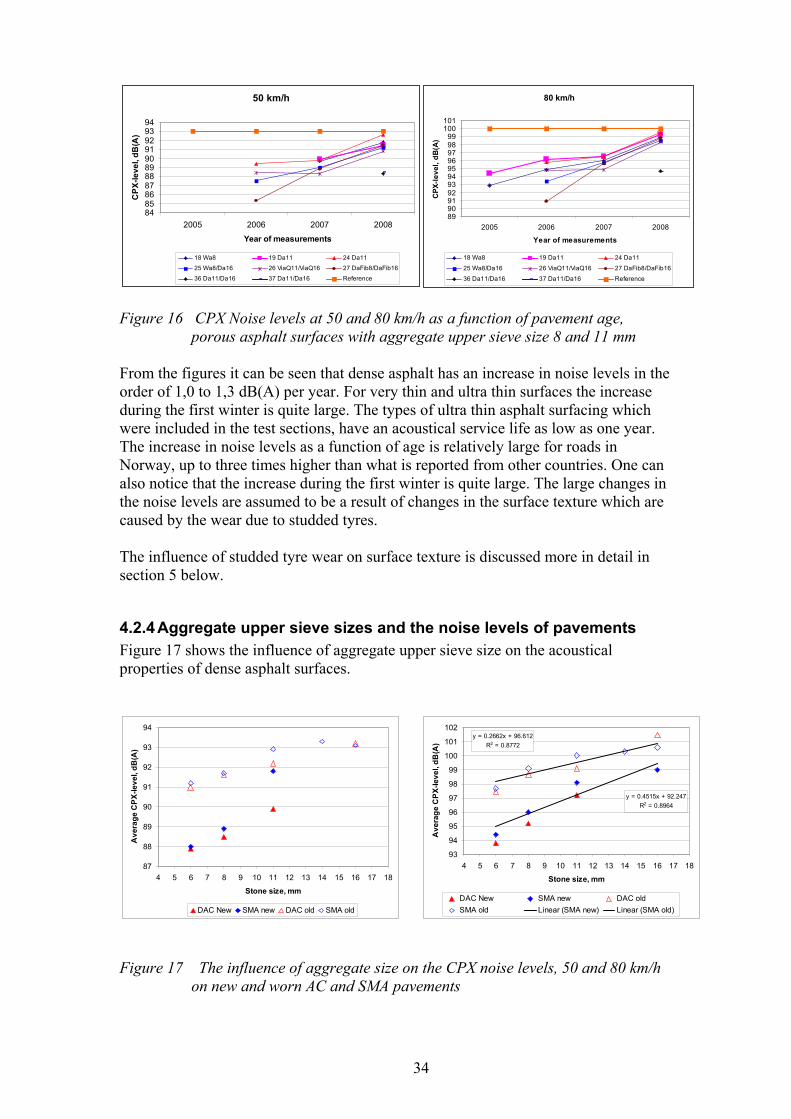
Figure 16 CPX Noise levels at 50 and 80 km/h as a function of pavement age,
porous asphalt surfaces with aggregate upper sieve size 8 and 11 mm From the figures it can be seen that dense asphalt has an increase in noise levels in the order of 1,0 to 1,3 dB(A) per year. For very thin and ultra thin surfaces the increase during the first winter is quite large. The types of ultra thin asphalt surfacing which were included in the test sections, have an acoustical service life as low as one year. The increase in noise levels as a function of age is relatively large for roads in Norway, up to three times higher than what is reported from other countries. One can also notice that the increase during the first winter is quite large. The large changes in the noise levels are assumed to be a result of changes in the surface texture which are caused by the wear due to studded tyres. The influence of studded tyre wear on surface texture is discussed more in detail in section 5 below.
4.2.4 Aggregate upper sieve sizes and the noise levels of pavements Figure 17 shows the influence of aggregate upper sieve size on the acoustical properties of dense asphalt surfaces.
Figure 17 The influence of aggregate size on the CPX noise levels, 50 and 80 km/h
on new and worn AC and SMA pavements
50 km/h
8485868788899091929394
2005 2006 2007 2008
Year of measurements
CP
X-le
vel,
dB
(A)
18 Wa8 19 Da11 24 Da11
25 Wa8/Da16 26 ViaQ11/ViaQ16 27 DaFib8/DaFib16
36 Da11/Da16 37 Da11/Da16 Reference
80 km/h
8990919293949596979899
100101
2005 2006 2007 2008
Year of measurements
CP
X-l
ev
el,
dB
(A)
18 Wa8 19 Da11 24 Da11
25 Wa8/Da16 26 ViaQ11/ViaQ16 27 DaFib8/DaFib16
36 Da11/Da16 37 Da11/Da16 Reference
87
88
89
90
91
92
93
94
4 5 6 7 8 9 10 11 12 13 14 15 16 17 18
Stone size, mm
Av
erag
e C
PX
-lev
el, d
B(A
)
DAC New SMA new DAC old SMA old
y = 0.4515x + 92.247
R2 = 0.8964
y = 0.2662x + 96.612
R2 = 0.8772
93
94
95
96
97
98
99
100
101
102
4 5 6 7 8 9 10 11 12 13 14 15 16 17 18
Stone size, mm
Av
erag
e C
PX
-lev
el,
dB
(A)
DAC New SMA new DAC old
SMA old Linear (SMA new) Linear (SMA old)
35
Somewhat simplified it can be concluded that the difference between 6 and 11 mm in aggregate upper sieve size gives a difference in the noise levels in the order of 2 dB(A) for new surfaces and 1,2 dB(A) for worn surfaces.
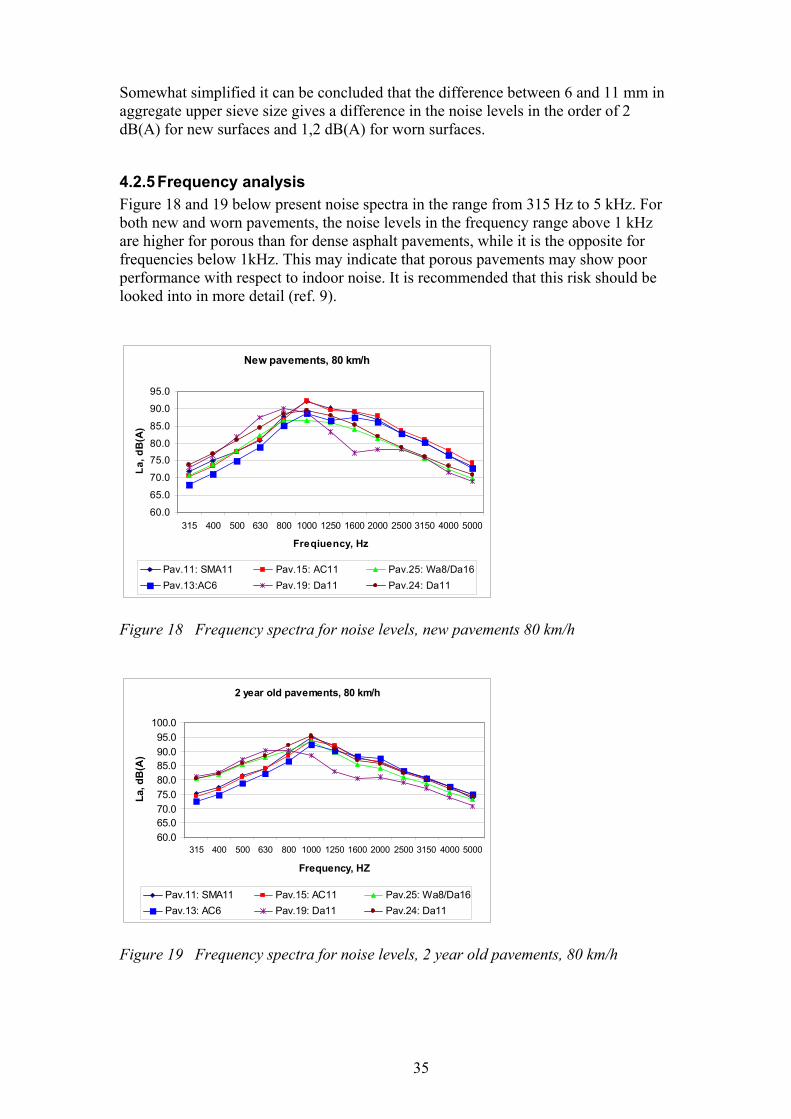
4.2.5 Frequency analysis Figure 18 and 19 below present noise spectra in the range from 315 Hz to 5 kHz. For both new and worn pavements, the noise levels in the frequency range above 1 kHz are higher for porous than for dense asphalt pavements, while it is the opposite for frequencies below 1kHz. This may indicate that porous pavements may show poor performance with respect to indoor noise. It is recommended that this risk should be looked into in more detail (ref. 9).
New pavements, 80 km/h
60.0
65.0
70.0
75.0
80.0
85.0
90.0
95.0
315 400 500 630 800 1000 1250 1600 2000 2500 3150 4000 5000
Freqiuency, Hz
La
, d
B(A
)
Pav.11: SMA11 Pav.15: AC11 Pav.25: Wa8/Da16
Pav.13:AC6 Pav.19: Da11 Pav.24: Da11
Figure 18 Frequency spectra for noise levels, new pavements 80 km/h
2 year old pavements, 80 km/h
60.0
65.070.0
75.0
80.0
85.090.0
95.0
100.0
315 400 500 630 800 1000 1250 1600 2000 2500 3150 4000 5000
Frequency, HZ
La,
dB
(A)
Pav.11: SMA11 Pav.15: AC11 Pav.25: Wa8/Da16
Pav.13: AC6 Pav.19: Da11 Pav.24: Da11
Figure 19 Frequency spectra for noise levels, 2 year old pavements, 80 km/h
36
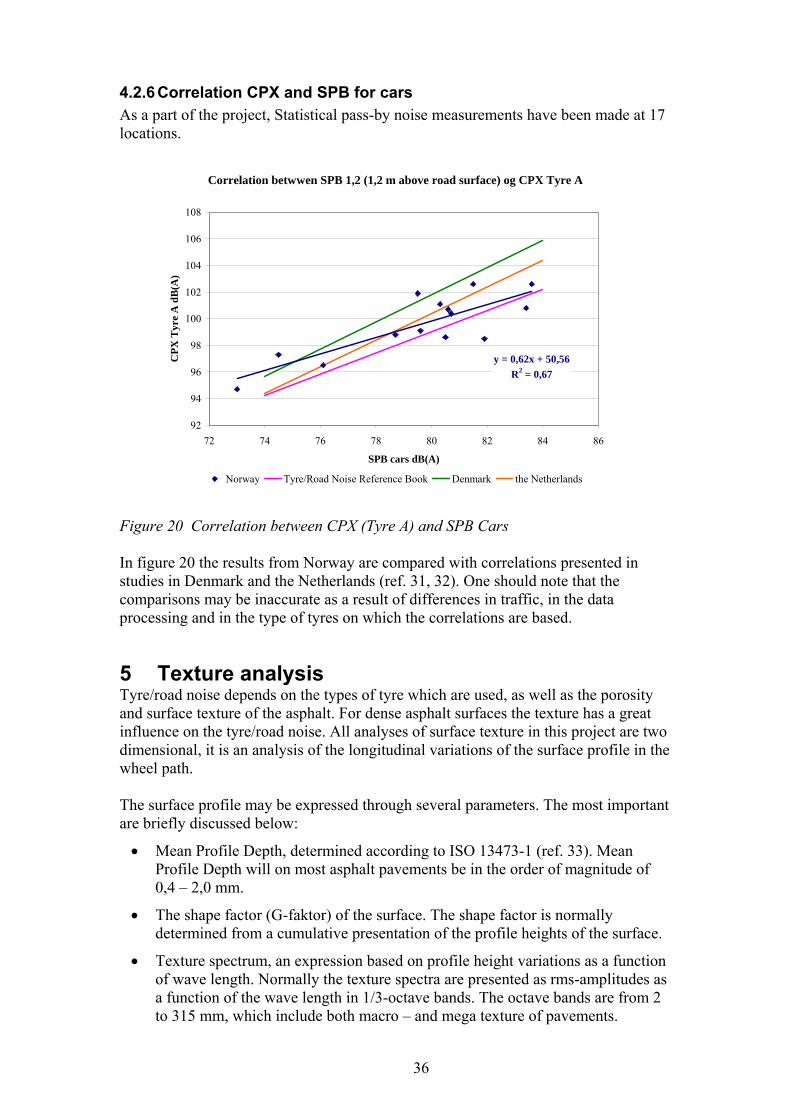
4.2.6 Correlation CPX and SPB for cars As a part of the project, Statistical pass-by noise measurements have been made at 17 locations.
Correlation betwwen SPB 1,2 (1,2 m above road surface) og CPX Tyre A
y = 0,62x + 50,56
R2 = 0,67
92
94
96
98
100
102
104
106
108
72 74 76 78 80 82 84 86
SPB cars dB(A)
CP
X T
yre
A d
B(A
)
Norway Tyre/Road Noise Reference Book Denmark the Netherlands
Figure 20 Correlation between CPX (Tyre A) and SPB Cars In figure 20 the results from Norway are compared with correlations presented in studies in Denmark and the Netherlands (ref. 31, 32). One should note that the comparisons may be inaccurate as a result of differences in traffic, in the data processing and in the type of tyres on which the correlations are based.
5 Texture analysis Tyre/road noise depends on the types of tyre which are used, as well as the porosity and surface texture of the asphalt. For dense asphalt surfaces the texture has a great influence on the tyre/road noise. All analyses of surface texture in this project are two dimensional, it is an analysis of the longitudinal variations of the surface profile in the wheel path. The surface profile may be expressed through several parameters. The most important are briefly discussed below:
Mean Profile Depth, determined according to ISO 13473-1 (ref. 33). Mean Profile Depth will on most asphalt pavements be in the order of magnitude of 0,4 – 2,0 mm.
The shape factor (G-faktor) of the surface. The shape factor is normally determined from a cumulative presentation of the profile heights of the surface.
Texture spectrum, an expression based on profile height variations as a function of wave length. Normally the texture spectra are presented as rms-amplitudes as a function of the wave length in 1/3-octave bands. The octave bands are from 2 to 315 mm, which include both macro – and mega texture of pavements.
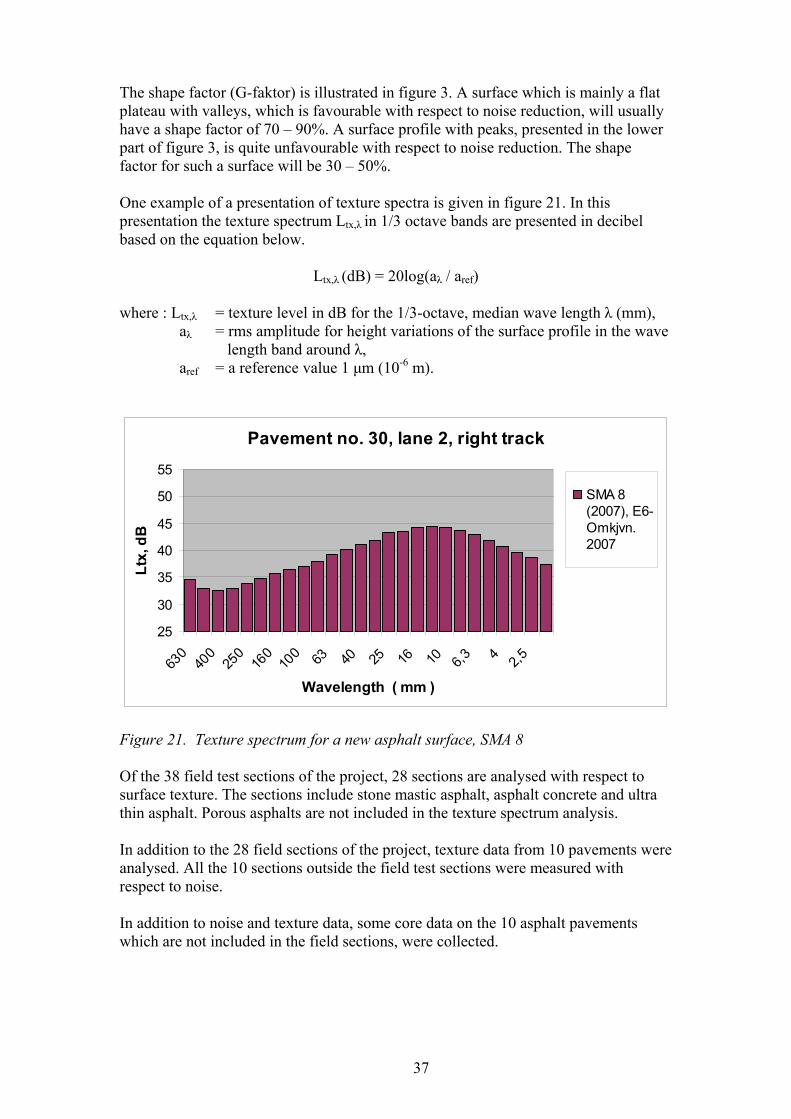
37
The shape factor (G-faktor) is illustrated in figure 3. A surface which is mainly a flat plateau with valleys, which is favourable with respect to noise reduction, will usually have a shape factor of 70 – 90%. A surface profile with peaks, presented in the lower part of figure 3, is quite unfavourable with respect to noise reduction. The shape factor for such a surface will be 30 – 50%. One example of a presentation of texture spectra is given in figure 21. In this presentation the texture spectrum Ltx,λ in 1/3 octave bands are presented in decibel based on the equation below.
Ltx,λ (dB) = 20log(aλ / aref) where : Ltx,λ = texture level in dB for the 1/3-octave, median wave length λ (mm), aλ = rms amplitude for height variations of the surface profile in the wave
length band around λ, aref = a reference value 1 μm (10-6 m).
Pavement no. 30, lane 2, right track
25
30
35
40
45
50
55
630
400
250
160
100 63 40 25 16 10 6,
3 42,
5
Wavelength ( mm )
Ltx
, dB
SMA 8(2007), E6-Omkjvn.2007
Figure 21. Texture spectrum for a new asphalt surface, SMA 8 Of the 38 field test sections of the project, 28 sections are analysed with respect to surface texture. The sections include stone mastic asphalt, asphalt concrete and ultra thin asphalt. Porous asphalts are not included in the texture spectrum analysis. In addition to the 28 field sections of the project, texture data from 10 pavements were analysed. All the 10 sections outside the field test sections were measured with respect to noise. In addition to noise and texture data, some core data on the 10 asphalt pavements which are not included in the field sections, were collected.
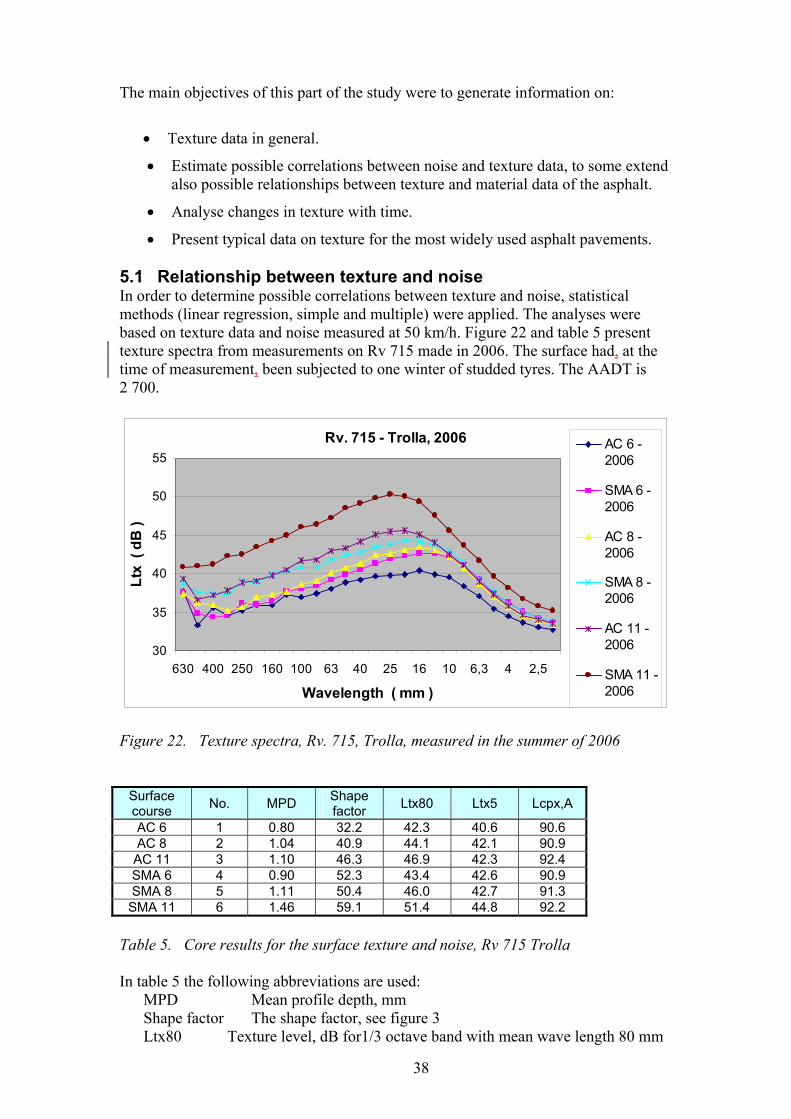
38
The main objectives of this part of the study were to generate information on:
Texture data in general.
Estimate possible correlations between noise and texture data, to some extend also possible relationships between texture and material data of the asphalt.
Analyse changes in texture with time.
Present typical data on texture for the most widely used asphalt pavements. 5.1 Relationship between texture and noise In order to determine possible correlations between texture and noise, statistical methods (linear regression, simple and multiple) were applied. The analyses were based on texture data and noise measured at 50 km/h. Figure 22 and table 5 present texture spectra from measurements on Rv 715 made in 2006. The surface had, at the time of measurement, been subjected to one winter of studded tyres. The AADT is 2 700.
Rv. 715 - Trolla, 2006
30
35
40
45
50
55
630 400 250 160 100 63 40 25 16 10 6,3 4 2,5
Wavelength ( mm )
Ltx
( d
B )
AC 6 -2006
SMA 6 -2006
AC 8 -2006
SMA 8 -2006
AC 11 -2006
SMA 11 -2006
Figure 22. Texture spectra, Rv. 715, Trolla, measured in the summer of 2006
Surface course
No. MPD Shape factor
Ltx80 Ltx5 Lcpx,A
AC 6 1 0.80 32.2 42.3 40.6 90.6 AC 8 2 1.04 40.9 44.1 42.1 90.9 AC 11 3 1.10 46.3 46.9 42.3 92.4 SMA 6 4 0.90 52.3 43.4 42.6 90.9 SMA 8 5 1.11 50.4 46.0 42.7 91.3
SMA 11 6 1.46 59.1 51.4 44.8 92.2
Table 5. Core results for the surface texture and noise, Rv 715 Trolla In table 5 the following abbreviations are used: MPD Mean profile depth, mm Shape factor The shape factor, see figure 3 Ltx80 Texture level, dB for1/3 octave band with mean wave length 80 mm
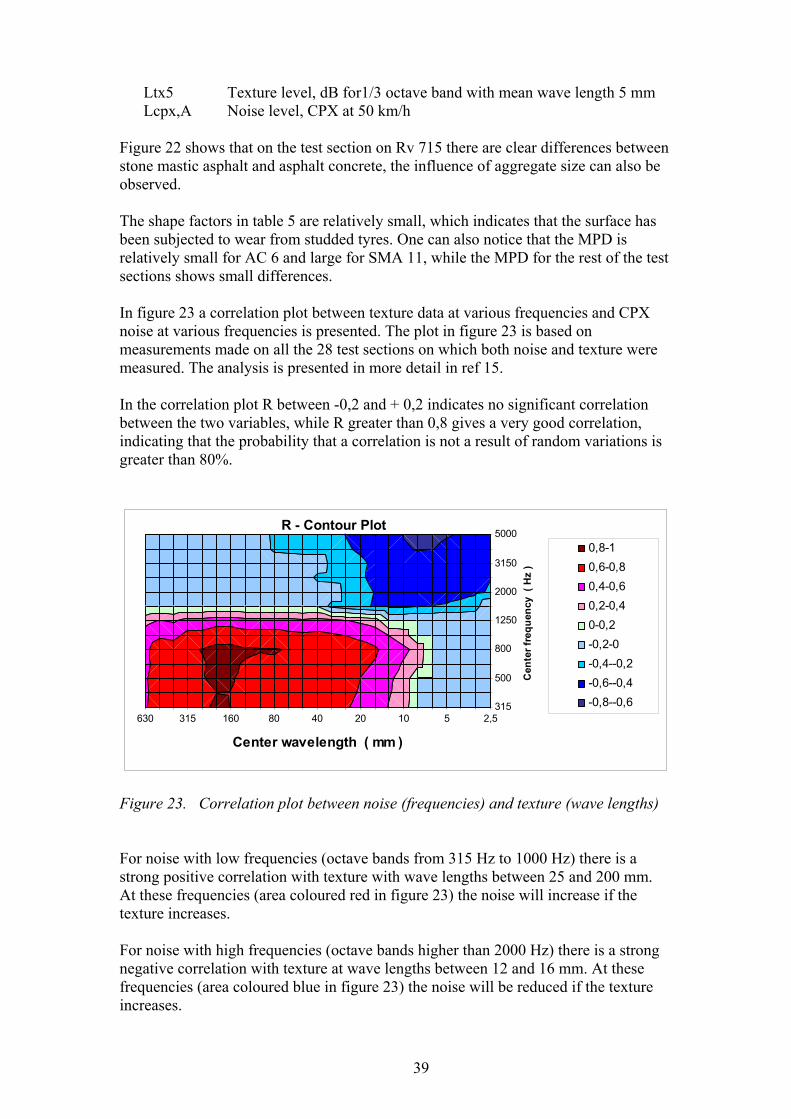
39
Ltx5 Texture level, dB for1/3 octave band with mean wave length 5 mm Lcpx,A Noise level, CPX at 50 km/h Figure 22 shows that on the test section on Rv 715 there are clear differences between stone mastic asphalt and asphalt concrete, the influence of aggregate size can also be observed. The shape factors in table 5 are relatively small, which indicates that the surface has been subjected to wear from studded tyres. One can also notice that the MPD is relatively small for AC 6 and large for SMA 11, while the MPD for the rest of the test sections shows small differences. In figure 23 a correlation plot between texture data at various frequencies and CPX noise at various frequencies is presented. The plot in figure 23 is based on measurements made on all the 28 test sections on which both noise and texture were measured. The analysis is presented in more detail in ref 15. In the correlation plot R between -0,2 and + 0,2 indicates no significant correlation between the two variables, while R greater than 0,8 gives a very good correlation, indicating that the probability that a correlation is not a result of random variations is greater than 80%.
630 315 160 80 40 20 10 5 2,5315
500
800
1250
2000
3150
5000
Center wavelength ( mm )
Cen
ter
freq
uen
cy (
Hz
)R - Contour Plot
0,8-1
0,6-0,8
0,4-0,6
0,2-0,4
0-0,2
-0,2-0
-0,4--0,2
-0,6--0,4
-0,8--0,6
Figure 23. Correlation plot between noise (frequencies) and texture (wave lengths) For noise with low frequencies (octave bands from 315 Hz to 1000 Hz) there is a strong positive correlation with texture with wave lengths between 25 and 200 mm. At these frequencies (area coloured red in figure 23) the noise will increase if the texture increases. For noise with high frequencies (octave bands higher than 2000 Hz) there is a strong negative correlation with texture at wave lengths between 12 and 16 mm. At these frequencies (area coloured blue in figure 23) the noise will be reduced if the texture increases.
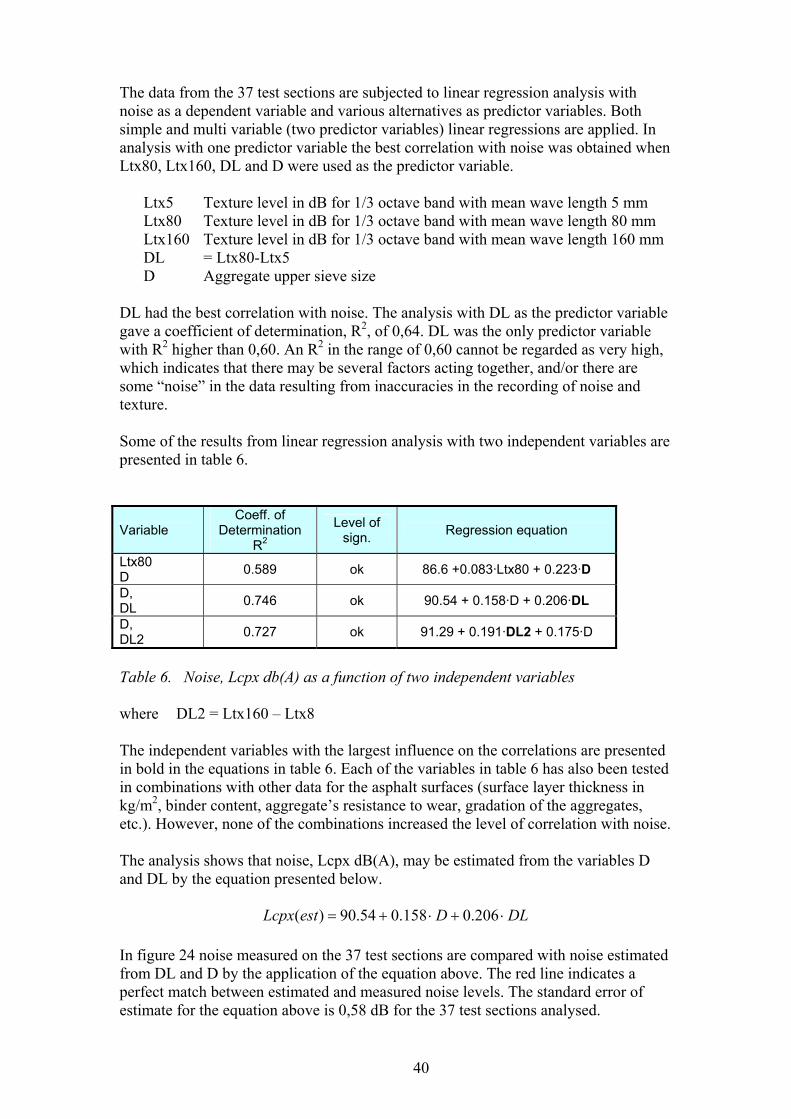
40
The data from the 37 test sections are subjected to linear regression analysis with noise as a dependent variable and various alternatives as predictor variables. Both simple and multi variable (two predictor variables) linear regressions are applied. In analysis with one predictor variable the best correlation with noise was obtained when Ltx80, Ltx160, DL and D were used as the predictor variable. Ltx5 Texture level in dB for 1/3 octave band with mean wave length 5 mm Ltx80 Texture level in dB for 1/3 octave band with mean wave length 80 mm Ltx160 Texture level in dB for 1/3 octave band with mean wave length 160 mm DL = Ltx80-Ltx5 D Aggregate upper sieve size DL had the best correlation with noise. The analysis with DL as the predictor variable gave a coefficient of determination, R2, of 0,64. DL was the only predictor variable with R2 higher than 0,60. An R2 in the range of 0,60 cannot be regarded as very high, which indicates that there may be several factors acting together, and/or there are some “noise” in the data resulting from inaccuracies in the recording of noise and texture. Some of the results from linear regression analysis with two independent variables are presented in table 6.
Variable Coeff. of
Determination R2
Level of sign.
Regression equation
Ltx80 D
0.589 ok 86.6 +0.083·Ltx80 + 0.223·D
D, DL
0.746 ok 90.54 + 0.158·D + 0.206·DL
D, DL2
0.727 ok 91.29 + 0.191·DL2 + 0.175·D
Table 6. Noise, Lcpx db(A) as a function of two independent variables where DL2 = Ltx160 – Ltx8 The independent variables with the largest influence on the correlations are presented in bold in the equations in table 6. Each of the variables in table 6 has also been tested in combinations with other data for the asphalt surfaces (surface layer thickness in kg/m2, binder content, aggregate’s resistance to wear, gradation of the aggregates, etc.). However, none of the combinations increased the level of correlation with noise. The analysis shows that noise, Lcpx dB(A), may be estimated from the variables D and DL by the equation presented below.
DLDestLcpx 206.0158.054.90)( In figure 24 noise measured on the 37 test sections are compared with noise estimated from DL and D by the application of the equation above. The red line indicates a perfect match between estimated and measured noise levels. The standard error of estimate for the equation above is 0,58 dB for the 37 test sections analysed.

41
89
90
91
92
93
94
95
90 91 92 93 94 95
Lcpx (Statistical model), dB(A)
Lcp
x,d
B(A
)
Data:measured y,model x
LinearRegression
Lcp
x (m
eas
ure
d),
dB
Lcpx (est), dB
Figure 24. Measured and estimated noise levels, Lcpx.
The analysis shows that texture data may be used for estimating noise levels, Lcpx. The model is applicable to surfaces not very different from the 37 sections on which the model was based, which include surfaces subjected to at least one winter of studded tyre wear and noise from tyre type “A”. DL is based on texture analysis and is the difference between Ltx80 and Ltx5. Of the variables which have been included in the analysis, DL is the variable with the largest influence on Lcpx. The variable DL may to some degree be related to D and other parameters. Regression analysis of DL with other variables shows that DL can be estimated from the parameters Mpd, D and the Shape factor as presented in the equation below.
DGMpdestDL 417.0073.0196.493.1)( where DL(est) = DL estimated from other surface variables Mpd = Mean profile depth G = the Shape factor D = aggregate upper sieve size The coefficient of determination, R2, was found to be 0,58, the standard error of estimate was 2 dB. The shape factor is an expression of the shape of the surface, as presented in figure 3, and is by this related to DL. An increase in the shape factor results in a reduction of DL and consequently in a reduction in the noise level. 5.2 Changes in texture with time Figures 25 and 26 show two examples of how the texture spectra will change with time. The largest changes take place during the first year. For short wave lengths (wave lengths 10 – 16 mm), the reduction the first year is substantial. For larger wave lengths (wave lengths 16 - 20 mm) the texture level increases. Figures 25 and 26 indicate that after one year of service of the pavement there is almost no reduction of

42
the texture level at short wave lengths, while the changes in texture levels at large wave lengths continue also during the following years.
SMA 8 - Newly laid, 1 and 3 years
30
35
40
45
50
630
400
250
160
100 63 40 25 16 10 6,
3 42,
5
Wavelength ( mm )
Ltx
, d
B
No. 28, Newlylaid
No. 30, Newlylaid
No. 28, 1 year
No. 30, 1 year
No. 5, 3 years
Figure 25. Changes in texture spectra during the first years of pavement service life,
SMA8.
SMA 11 - Newly laid, 1 and 2 years
30
35
40
45
50
630
400
250
160
100 63 40 25 16 10 6,
3 42,
5
Wavelength ( mm )
Ltx
, dB
No. 29, NewlylaidNo. 31, NewlylaidNo. 71, NewlylaidNo. 72, NewlylaidNo. 29, 1 year
No. 31, 1 year
No. 71, 1 year
No. 71, 2 years
Figure 26. Changes in texture spectra during the first years of pavement service life,
SMA 11. The changes in texture with time can be presented as a rotation of the texture levels in combination with an increase in texture at large wave lengths. This has quite unfavourable influence on the tyre/road noise. The changes in texture level with wave lengths 20 to 200 mm may be associated with tyre/road noise of low frequencies, while the changes in texture of short wave lengths may be associated with the air displacement mechanism creating an increase of the noise level with higher frequencies.
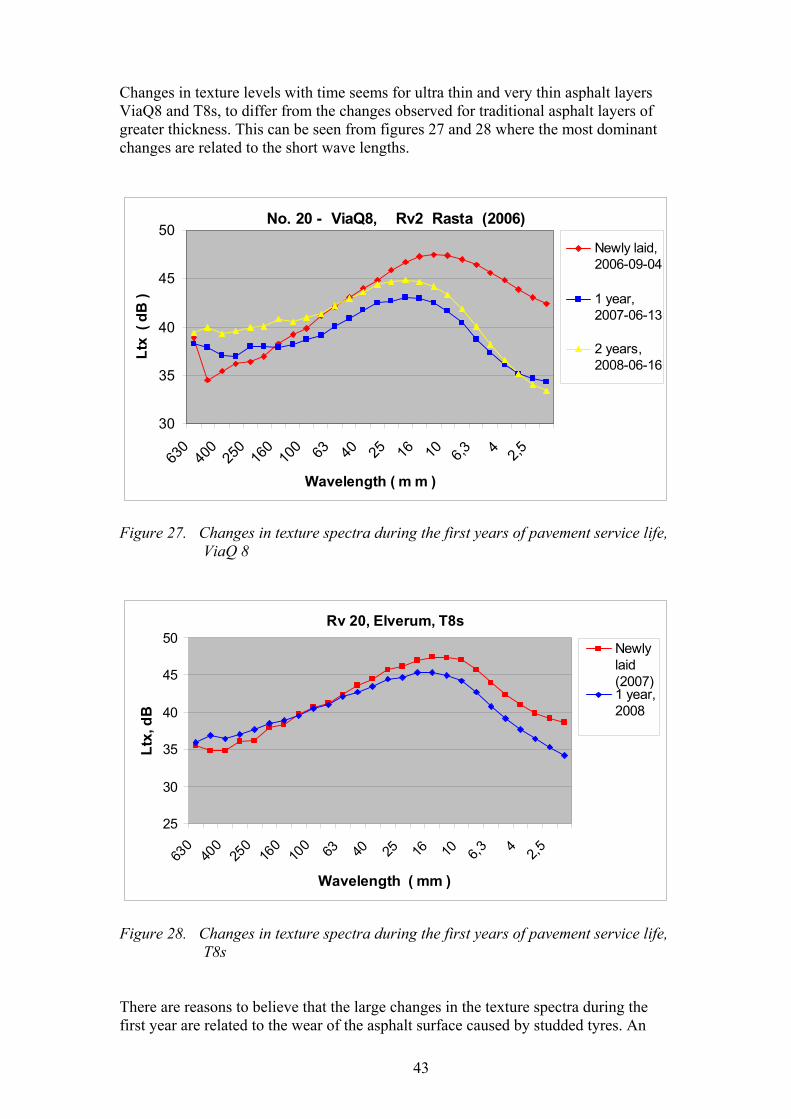
43
Changes in texture levels with time seems for ultra thin and very thin asphalt layers ViaQ8 and T8s, to differ from the changes observed for traditional asphalt layers of greater thickness. This can be seen from figures 27 and 28 where the most dominant changes are related to the short wave lengths.
No. 20 - ViaQ8, Rv2 Rasta (2006)
30
35
40
45
50
630
400
250
160
100 63 40 25 16 10 6,
3 42,
5
Wavelength ( m m )
Ltx
( d
B )
Newly laid, 2006-09-04
1 year, 2007-06-13
2 years, 2008-06-16
Figure 27. Changes in texture spectra during the first years of pavement service life,
ViaQ 8
Rv 20, Elverum, T8s
25
30
35
40
45
50
630
400
250
160
100 63 40 25 16 10 6,
3 42,
5
Wavelength ( mm )
Ltx
, dB
Newlylaid(2007)1 year,2008
Figure 28. Changes in texture spectra during the first years of pavement service life,
T8s There are reasons to believe that the large changes in the texture spectra during the first year are related to the wear of the asphalt surface caused by studded tyres. An
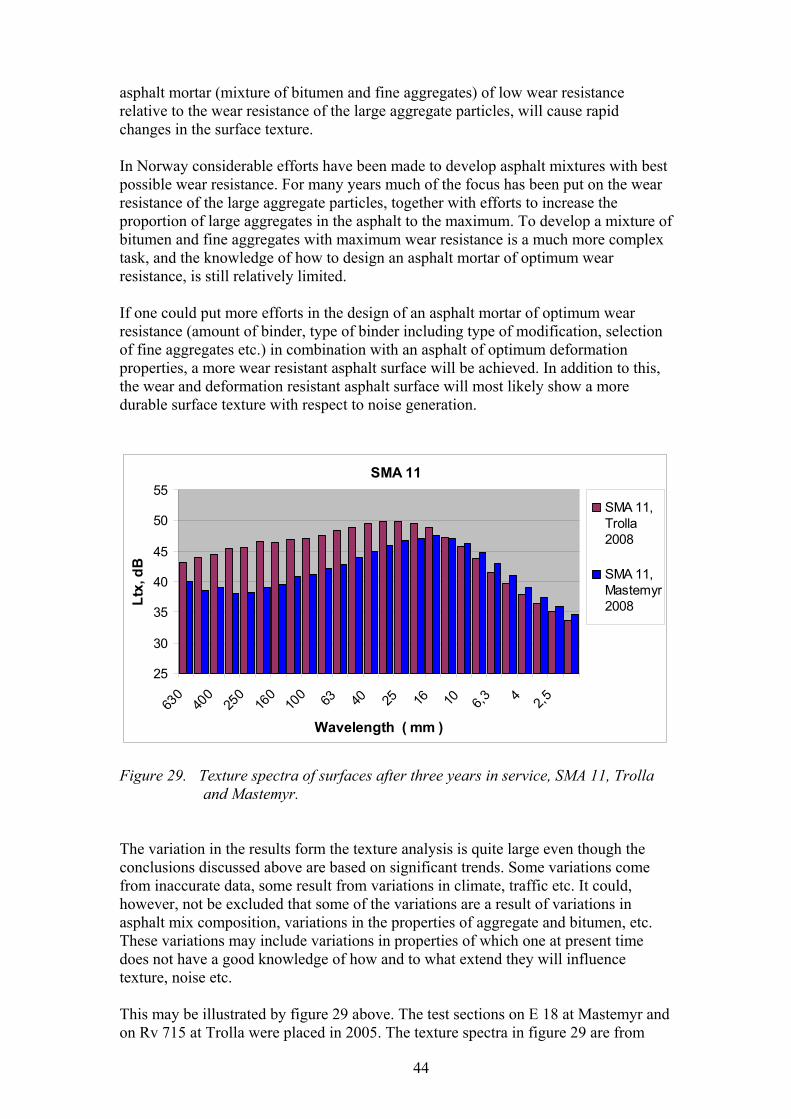
44
asphalt mortar (mixture of bitumen and fine aggregates) of low wear resistance relative to the wear resistance of the large aggregate particles, will cause rapid changes in the surface texture. In Norway considerable efforts have been made to develop asphalt mixtures with best possible wear resistance. For many years much of the focus has been put on the wear resistance of the large aggregate particles, together with efforts to increase the proportion of large aggregates in the asphalt to the maximum. To develop a mixture of bitumen and fine aggregates with maximum wear resistance is a much more complex task, and the knowledge of how to design an asphalt mortar of optimum wear resistance, is still relatively limited. If one could put more efforts in the design of an asphalt mortar of optimum wear resistance (amount of binder, type of binder including type of modification, selection of fine aggregates etc.) in combination with an asphalt of optimum deformation properties, a more wear resistant asphalt surface will be achieved. In addition to this, the wear and deformation resistant asphalt surface will most likely show a more durable surface texture with respect to noise generation.
SMA 11
25
30
35
40
45
50
55
630
400
250
160
100 63 40 25 16 10 6,
3 42,
5
Wavelength ( mm )
Ltx
, dB
SMA 11,Trolla2008
SMA 11,Mastemyr2008
Figure 29. Texture spectra of surfaces after three years in service, SMA 11, Trolla
and Mastemyr. The variation in the results form the texture analysis is quite large even though the conclusions discussed above are based on significant trends. Some variations come from inaccurate data, some result from variations in climate, traffic etc. It could, however, not be excluded that some of the variations are a result of variations in asphalt mix composition, variations in the properties of aggregate and bitumen, etc. These variations may include variations in properties of which one at present time does not have a good knowledge of how and to what extend they will influence texture, noise etc. This may be illustrated by figure 29 above. The test sections on E 18 at Mastemyr and on Rv 715 at Trolla were placed in 2005. The texture spectra in figure 29 are from
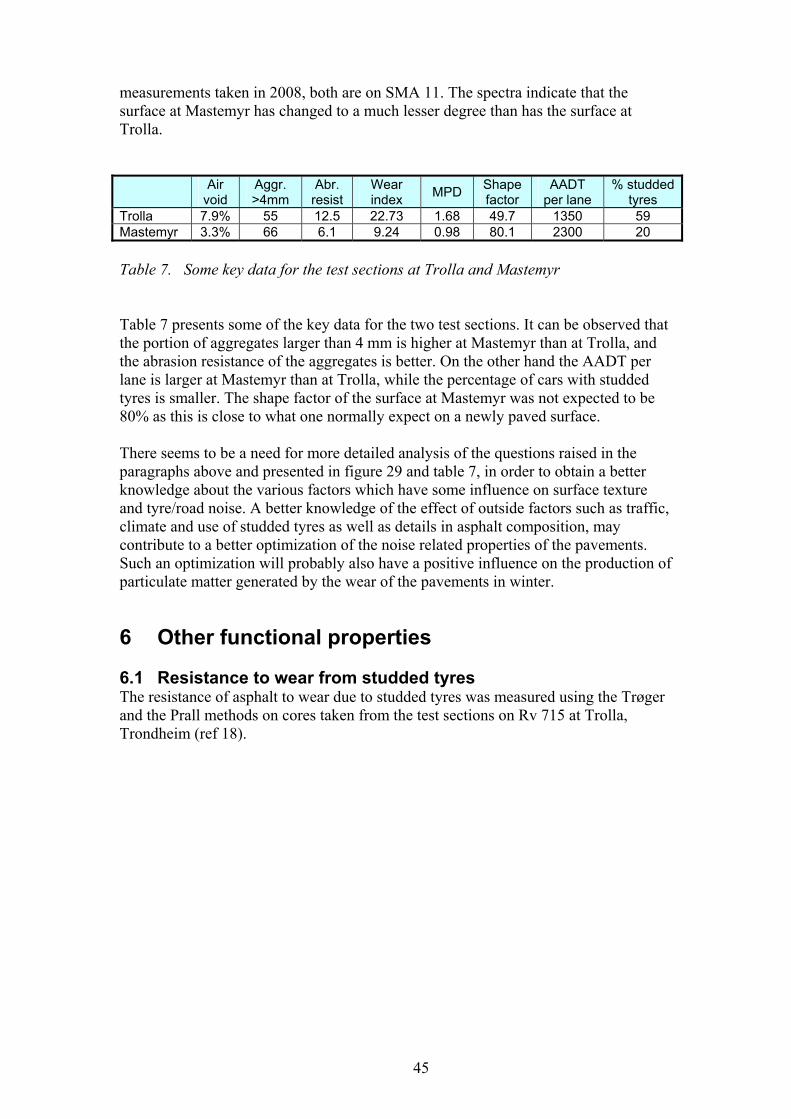
45
measurements taken in 2008, both are on SMA 11. The spectra indicate that the surface at Mastemyr has changed to a much lesser degree than has the surface at Trolla. Air
void Aggr. >4mm
Abr. resist
Wear index
MPD Shape factor
AADT per lane
% studded tyres
Trolla 7.9% 55 12.5 22.73 1.68 49.7 1350 59 Mastemyr 3.3% 66 6.1 9.24 0.98 80.1 2300 20
Table 7. Some key data for the test sections at Trolla and Mastemyr Table 7 presents some of the key data for the two test sections. It can be observed that the portion of aggregates larger than 4 mm is higher at Mastemyr than at Trolla, and the abrasion resistance of the aggregates is better. On the other hand the AADT per lane is larger at Mastemyr than at Trolla, while the percentage of cars with studded tyres is smaller. The shape factor of the surface at Mastemyr was not expected to be 80% as this is close to what one normally expect on a newly paved surface. There seems to be a need for more detailed analysis of the questions raised in the paragraphs above and presented in figure 29 and table 7, in order to obtain a better knowledge about the various factors which have some influence on surface texture and tyre/road noise. A better knowledge of the effect of outside factors such as traffic, climate and use of studded tyres as well as details in asphalt composition, may contribute to a better optimization of the noise related properties of the pavements. Such an optimization will probably also have a positive influence on the production of particulate matter generated by the wear of the pavements in winter.
6 Other functional properties 6.1 Resistance to wear from studded tyres The resistance of asphalt to wear due to studded tyres was measured using the Trøger and the Prall methods on cores taken from the test sections on Rv 715 at Trolla, Trondheim (ref 18).
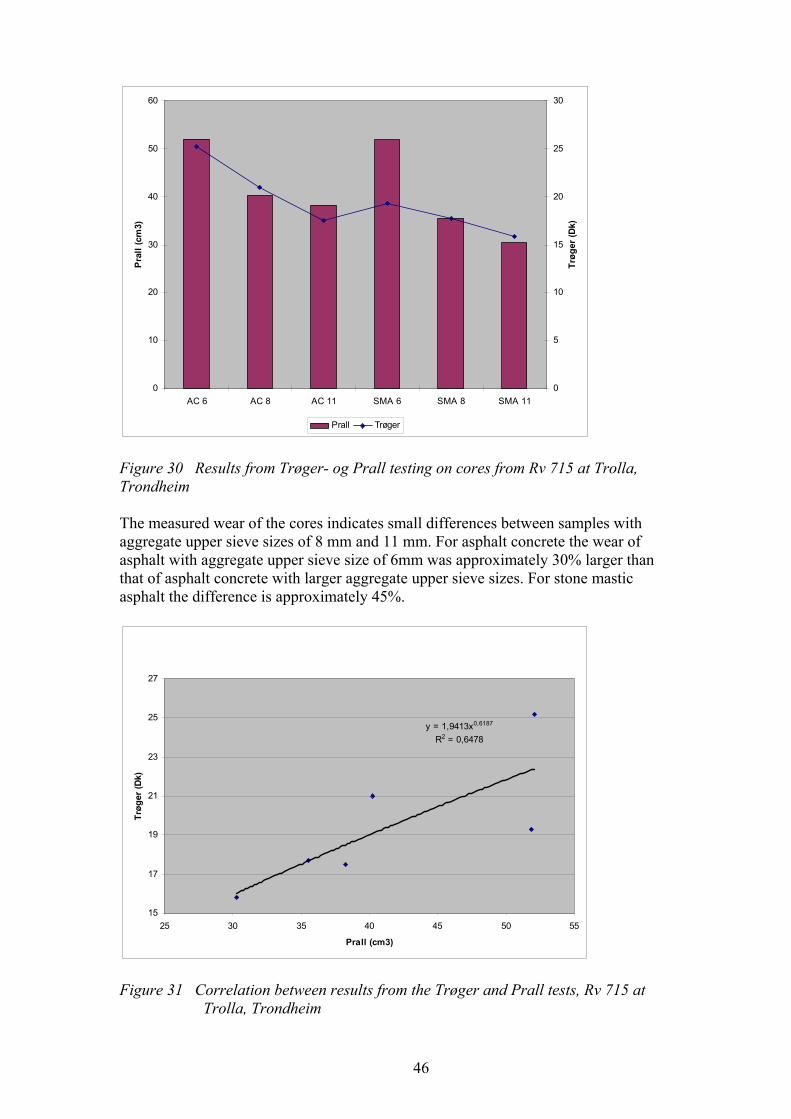
46
0
10
20
30
40
50
60
AC 6 AC 8 AC 11 SMA 6 SMA 8 SMA 11
Pra
ll (
cm3)
0
5
10
15
20
25
30
Trø
ger
(D
k)
Prall Trøger
Figure 30 Results from Trøger- og Prall testing on cores from Rv 715 at Trolla, Trondheim The measured wear of the cores indicates small differences between samples with aggregate upper sieve sizes of 8 mm and 11 mm. For asphalt concrete the wear of asphalt with aggregate upper sieve size of 6mm was approximately 30% larger than that of asphalt concrete with larger aggregate upper sieve sizes. For stone mastic asphalt the difference is approximately 45%.
y = 1,9413x0,6187
R2 = 0,6478
15
17
19
21
23
25
27
25 30 35 40 45 50 55
Prall (cm3)
Trø
ger
(D
k)
Figure 31 Correlation between results from the Trøger and Prall tests, Rv 715 at
Trolla, Trondheim
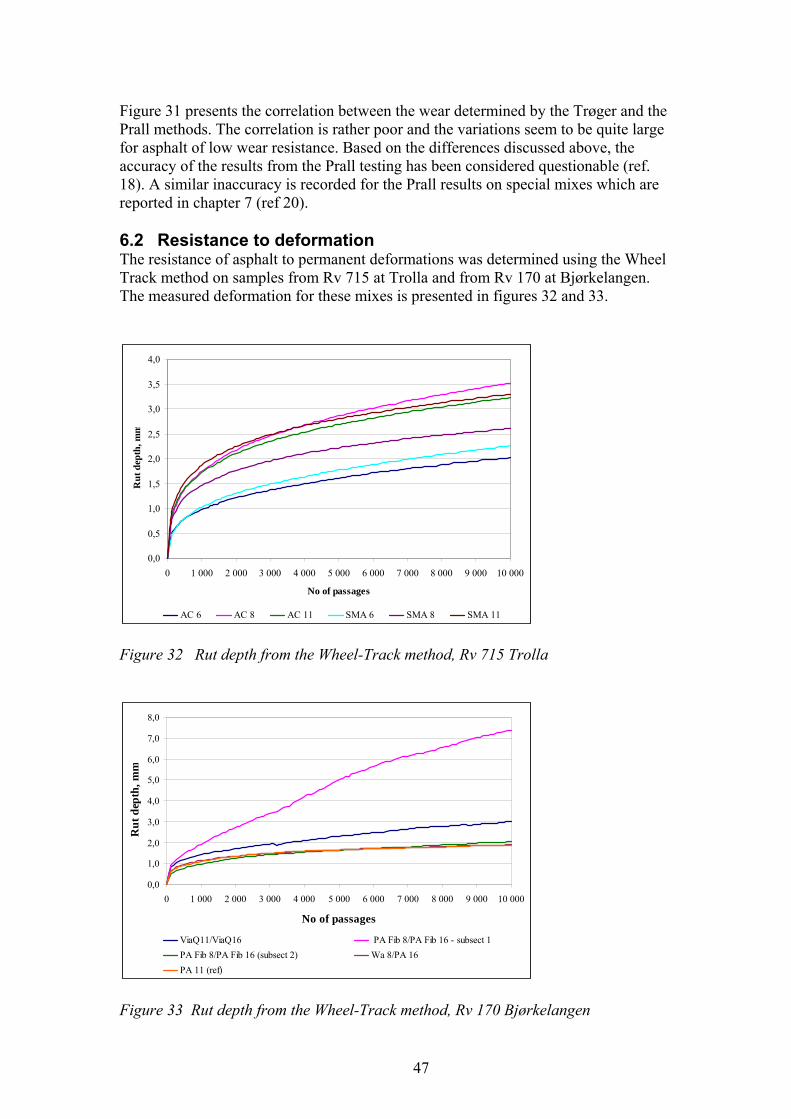
47
Figure 31 presents the correlation between the wear determined by the Trøger and the Prall methods. The correlation is rather poor and the variations seem to be quite large for asphalt of low wear resistance. Based on the differences discussed above, the accuracy of the results from the Prall testing has been considered questionable (ref. 18). A similar inaccuracy is recorded for the Prall results on special mixes which are reported in chapter 7 (ref 20). 6.2 Resistance to deformation The resistance of asphalt to permanent deformations was determined using the Wheel Track method on samples from Rv 715 at Trolla and from Rv 170 at Bjørkelangen. The measured deformation for these mixes is presented in figures 32 and 33.
0,0
0,5
1,0
1,5
2,0
2,5
3,0
3,5
4,0
0 1 000 2 000 3 000 4 000 5 000 6 000 7 000 8 000 9 000 10 000
No of passages
Ru
t d
epth
, mm
AC 6 AC 8 AC 11 SMA 6 SMA 8 SMA 11 Figure 32 Rut depth from the Wheel-Track method, Rv 715 Trolla
0,0
1,0
2,0
3,0
4,0
5,0
6,0
7,0
8,0
0 1 000 2 000 3 000 4 000 5 000 6 000 7 000 8 000 9 000 10 000
No of passages
Ru
t d
epth
, mm
ViaQ11/ViaQ16 PA Fib 8/PA Fib 16 - subsect 1
PA Fib 8/PA Fib 16 (subsect 2) Wa 8/PA 16
PA 11 (ref)
Figure 33 Rut depth from the Wheel-Track method, Rv 170 Bjørkelangen

48
The 2008 version of Håndbok 018 Vegbygging , the Norwegian Public Roads Administration’s pavement desgn and construction manual (ref 24), has in its specifications for asphalts given an option to specify maximum allowable rut depth at 10 000 load repetions. It is stated that the present requirements are not very strict and may be changed when more experience is obtained. The requirements are given as maximum allowable rut depth at 10 000 passages in percentage of the sample thickness. The results for laboratory samples of mixes used in test sections on Rv 715 and Rv 170 are presented in figures 34 and 35.
Relative rut depth, PRDair (%)
0
2
4
6
8
10
12
14
16
AC 6 AC 8 AC 11 SMA 6 SMA 8 SMA 11
Rel
ativ
e ru
t d
epth
(%
)
Figure 34 Relative rut depth at 10 000 cycles, in percent of sample thickness, the
Wheel-Track method, Rv 715 Trolla
Relative rut depth, PRDair (%)
0
2
4
6
8
10
12
14
16
ViaQ11/ViaQ16 PA Fib 8/PA Fib 16- (Subsect 1)
PA Fib 8/PA Fib 16(Subsect 2)
Wa 8/PA 16 PA 11 (ref)
Rel
ativ
e ru
t d
epth
(%
)
Figure 35 Relative rut depth at 10 000 cycles, in percent of sample thickness, the
Wheel-Track method, Rv 170 Bjørkelangen in Akershus
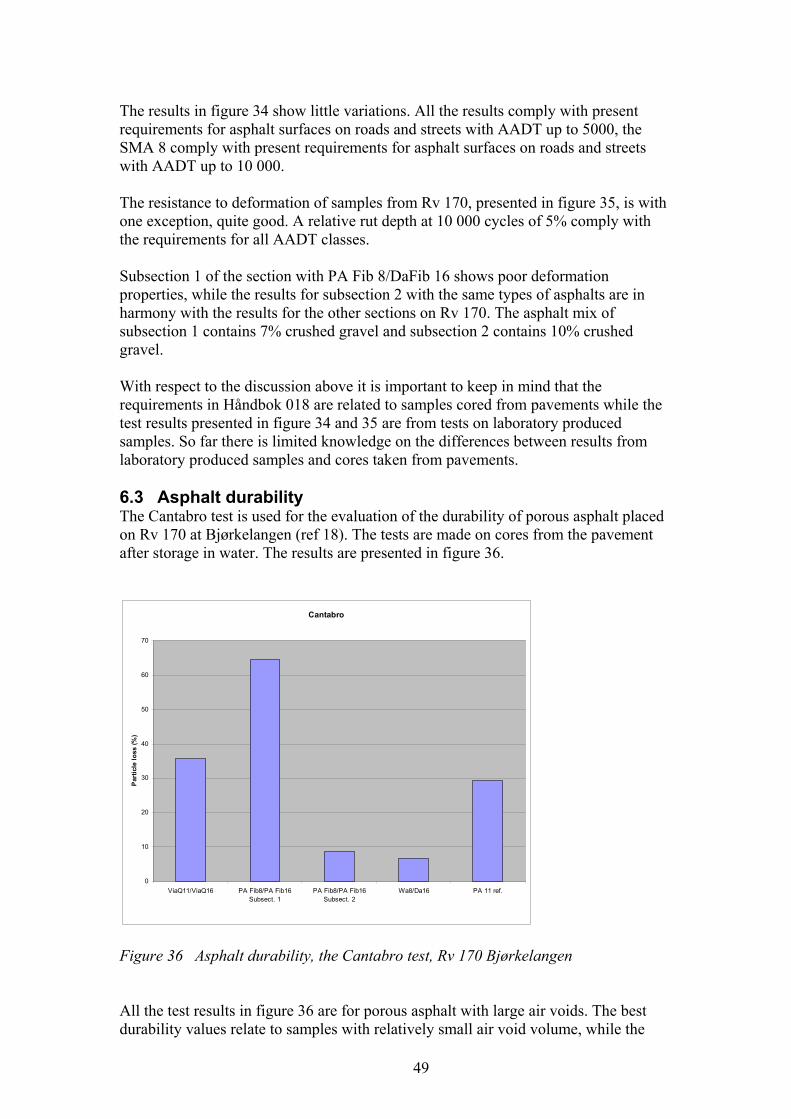
49
The results in figure 34 show little variations. All the results comply with present requirements for asphalt surfaces on roads and streets with AADT up to 5000, the SMA 8 comply with present requirements for asphalt surfaces on roads and streets with AADT up to 10 000. The resistance to deformation of samples from Rv 170, presented in figure 35, is with one exception, quite good. A relative rut depth at 10 000 cycles of 5% comply with the requirements for all AADT classes. Subsection 1 of the section with PA Fib 8/DaFib 16 shows poor deformation properties, while the results for subsection 2 with the same types of asphalts are in harmony with the results for the other sections on Rv 170. The asphalt mix of subsection 1 contains 7% crushed gravel and subsection 2 contains 10% crushed gravel. With respect to the discussion above it is important to keep in mind that the requirements in Håndbok 018 are related to samples cored from pavements while the test results presented in figure 34 and 35 are from tests on laboratory produced samples. So far there is limited knowledge on the differences between results from laboratory produced samples and cores taken from pavements. 6.3 Asphalt durability The Cantabro test is used for the evaluation of the durability of porous asphalt placed on Rv 170 at Bjørkelangen (ref 18). The tests are made on cores from the pavement after storage in water. The results are presented in figure 36.
Cantabro
0
10
20
30
40
50
60
70
ViaQ11/ViaQ16 PA Fib8/PA Fib16Subsect. 1
PA Fib8/PA Fib16Subsect. 2
Wa8/Da16 PA 11 ref.
Par
ticl
e lo
ss (
%)
Figure 36 Asphalt durability, the Cantabro test, Rv 170 Bjørkelangen All the test results in figure 36 are for porous asphalt with large air voids. The best durability values relate to samples with relatively small air void volume, while the

50
poor durability values are from samples with large air void volume. There are no indications of other factors with systematic influence on the asphalt durability. 6.4 Expected service life
6.4.1 Traditional dense asphalts The annual increase in rut depths of traditional dense asphalt wearing courses at the field test sections are presented in figure 37 below. The presentation includes asphalt concrete and stone mastic asphalt, with paving grade bitumen and with polymer modified bitumen. For almost all sections the increase in rut depth is considerably larger in the first year than in the following years.
Målt årlig endring i gjennomsnittlig spordybde, Ska og Ab med og uten PMB
0
1
2
3
4
5
6
7
Ab 06PM
BStan
ge11
800
Ab 06PM
BEids
våg 36
00
Ska 08
PMB
Trond
heim
2250
0
Ska 11
PMB
Stjørd
al17
000
Ska 11
PMB
Trond
heim
2250
0
Ab 06Tro
lla, T
rond
heim
2700
Ab 06Høn
efoss
4200
Ab 08Tro
lla, T
rond
heim
2700
Ab 08Høn
efoss
4200
Ab 11Tro
lla, T
rond
heim
2700
Ab 11Høn
efoss
4200
Ska06
Trolla
, Tro
ndhe
im27
00
Ska 06
Mas
temyr
, Oslo
2440
0
Ska08
Trolla
, Tro
ndhe
im27
00
Ska 08
Mas
temyr
, Oslo
2440
0
Ska11
Trolla
, Tro
ndhe
im27
00
Ska11
Mas
temyr
, Oslo
2440
0
Ska 16
Mas
temyr
, Oslo
2440
0
Dekketype
Årl
igsp
orøk
ning
,mm
Fra år 1 til år 2 Fra år 2 til år 3 Fra år 3 til år 4From year 3 to year 4From year 2 to year 3From year 1 to year 2
Incr
ease
in r
ut d
epth
mm
/yea
r
AC
ACAC
ACAC
AC
AC
AC
SMA
SMA
SMA
SMA
SMA
SMA
SMA
SMASM
A
SMA
Figure 37 Average annual increase in measured rut depth, traditional dense asphalt
mixes. The maintenance standard for asphalt road surfaces in Norway specifies a maximum of 25 mm rut depth at 90 percentile for homogeneous road sections. If one assumes a factor of 1,35 for the relationship between the 90 percentile rut depth and the average rut depth, a resurfacing is required when the average rut depth is 18,5 mm. From figure 37 the increase in rut depth in the first year is estimated to 4 mm in average and 2 mm per year the following years. Based on an assumption of an initial rut depth of 4 mm the average service life of the asphalt wearing course is 6,3 years.
6.4.2 Very thin and ultra thin asphalt layers The field test sections included asphalt with very thin (thickness 20 - 30 mm) and ultra thin (thickness 12 – 16 mm) layers. The annual increase in rut depth is presented in figure 38 below. For these thin layers there are no indications that the increase the first year is greater than in the next year.
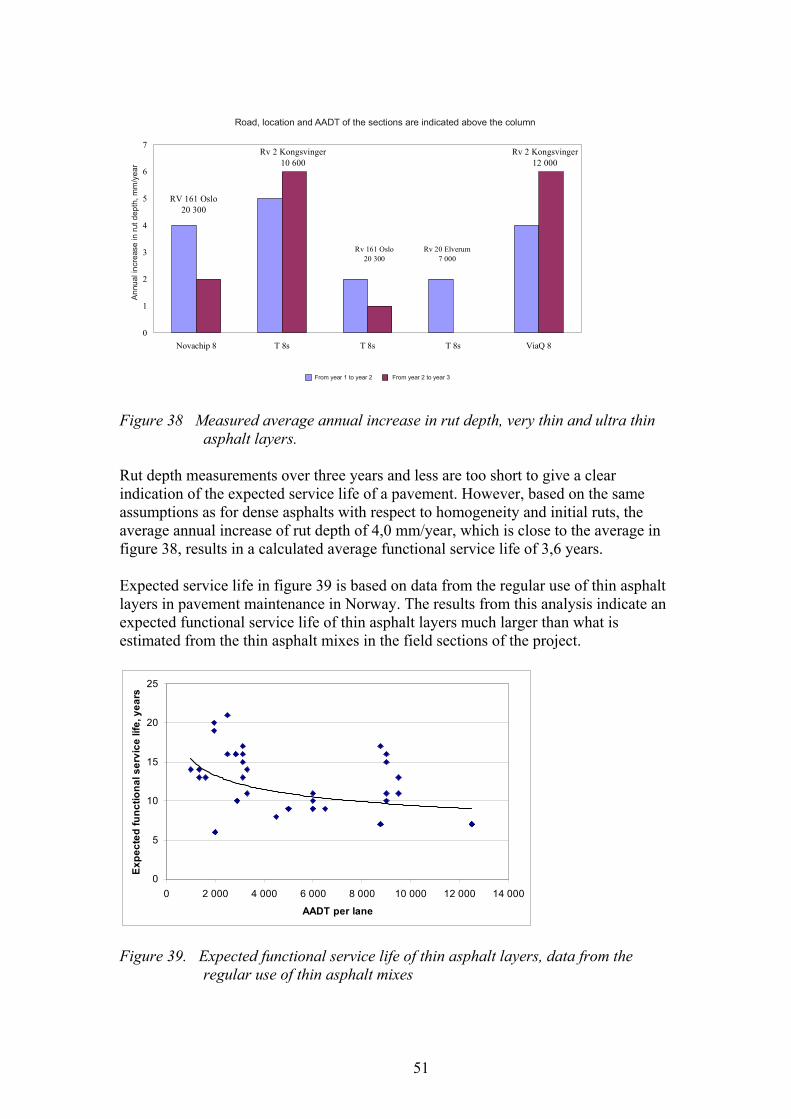
51
Målt årlig endring i gjennomsnittlig spordybde, tynndekker
0
1
2
3
4
5
6
7
Novachip 8 T 8s T 8s T 8s ViaQ 8
Dekketype
En
dri
ng
ispo
rdyb
de
Fra år 1 til år 2 Fra år 2 til år 3
Rv 2 Kongsvinger12 000
Rv 20 Elverum7 000
Rv 161 Oslo20 300
Rv 2 Kongsvinger10 600
RV 161 Oslo20 300
Veg, stedsnavn og ÅDT er angitt over søylene
From year 1 to year 2 From year 2 to year 3
An
nual
incr
ease
in r
ut d
epth
, m
m/y
ear
Road, location and AADT of the sections are indicated above the column
Figure 38 Measured average annual increase in rut depth, very thin and ultra thin
asphalt layers. Rut depth measurements over three years and less are too short to give a clear indication of the expected service life of a pavement. However, based on the same assumptions as for dense asphalts with respect to homogeneity and initial ruts, the average annual increase of rut depth of 4,0 mm/year, which is close to the average in figure 38, results in a calculated average functional service life of 3,6 years. Expected service life in figure 39 is based on data from the regular use of thin asphalt layers in pavement maintenance in Norway. The results from this analysis indicate an expected functional service life of thin asphalt layers much larger than what is estimated from the thin asphalt mixes in the field sections of the project.
0
5
10
15
20
25
0 2 000 4 000 6 000 8 000 10 000 12 000 14 000
AADT per lane
Ex
pe
cte
d f
un
cti
on
al s
erv
ice
life
, ye
ars
Figure 39. Expected functional service life of thin asphalt layers, data from the
regular use of thin asphalt mixes
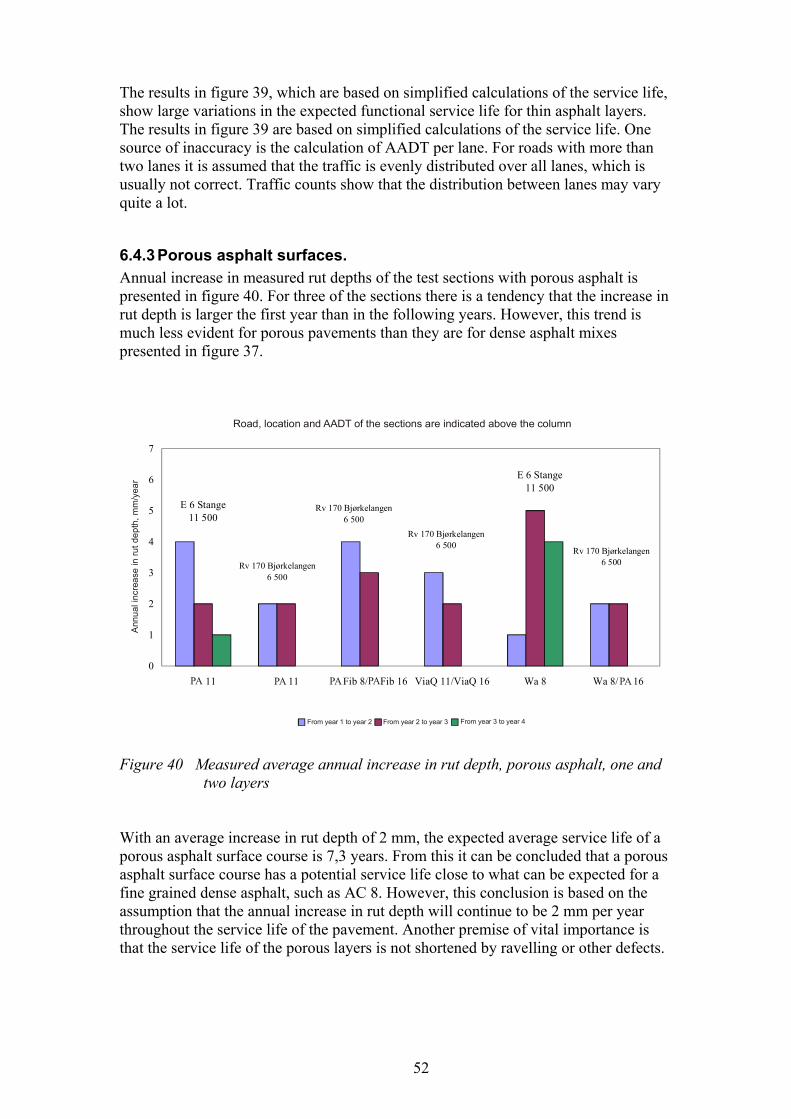
52
The results in figure 39, which are based on simplified calculations of the service life, show large variations in the expected functional service life for thin asphalt layers. The results in figure 39 are based on simplified calculations of the service life. One source of inaccuracy is the calculation of AADT per lane. For roads with more than two lanes it is assumed that the traffic is evenly distributed over all lanes, which is usually not correct. Traffic counts show that the distribution between lanes may vary quite a lot.
6.4.3 Porous asphalt surfaces. Annual increase in measured rut depths of the test sections with porous asphalt is presented in figure 40. For three of the sections there is a tendency that the increase in rut depth is larger the first year than in the following years. However, this trend is much less evident for porous pavements than they are for dense asphalt mixes presented in figure 37.
Målt årlig endring i gjennomsnittlig spordybde, porøse dekker
0
1
2
3
4
5
6
7
Da 11 Da 11 DaFib 8/DaFib 16 ViaQ 11/ViaQ 16 Wa 8 Wa 8/Da 16
Dekketype
Mål
tår
lig
spor
økn
ing
Fra år 1 til år 2 Fra år 2 til år 3 Fra år 3 til år 4
E 6 Stange11 500
E 6 Stange11 500
Rv 170 Bjørkelangen6 500
Rv 170 Bjørkelangen6 500
Rv 170 Bjørkelangen6 500
Rv 170 Bjørkelangen6 500
Veg, stedsnavn og ÅDT er angitt over søylene
From year 1 to year 2 From year 2 to year 3 From year 3 to year 4
Road, location and AADT of the sections are indicated above the column
Ann
ual
incr
ease
in r
ut d
ept
h, m
m/y
ear
PAPAPAPAPA
Figure 40 Measured average annual increase in rut depth, porous asphalt, one and
two layers With an average increase in rut depth of 2 mm, the expected average service life of a porous asphalt surface course is 7,3 years. From this it can be concluded that a porous asphalt surface course has a potential service life close to what can be expected for a fine grained dense asphalt, such as AC 8. However, this conclusion is based on the assumption that the annual increase in rut depth will continue to be 2 mm per year throughout the service life of the pavement. Another premise of vital importance is that the service life of the porous layers is not shortened by ravelling or other defects.
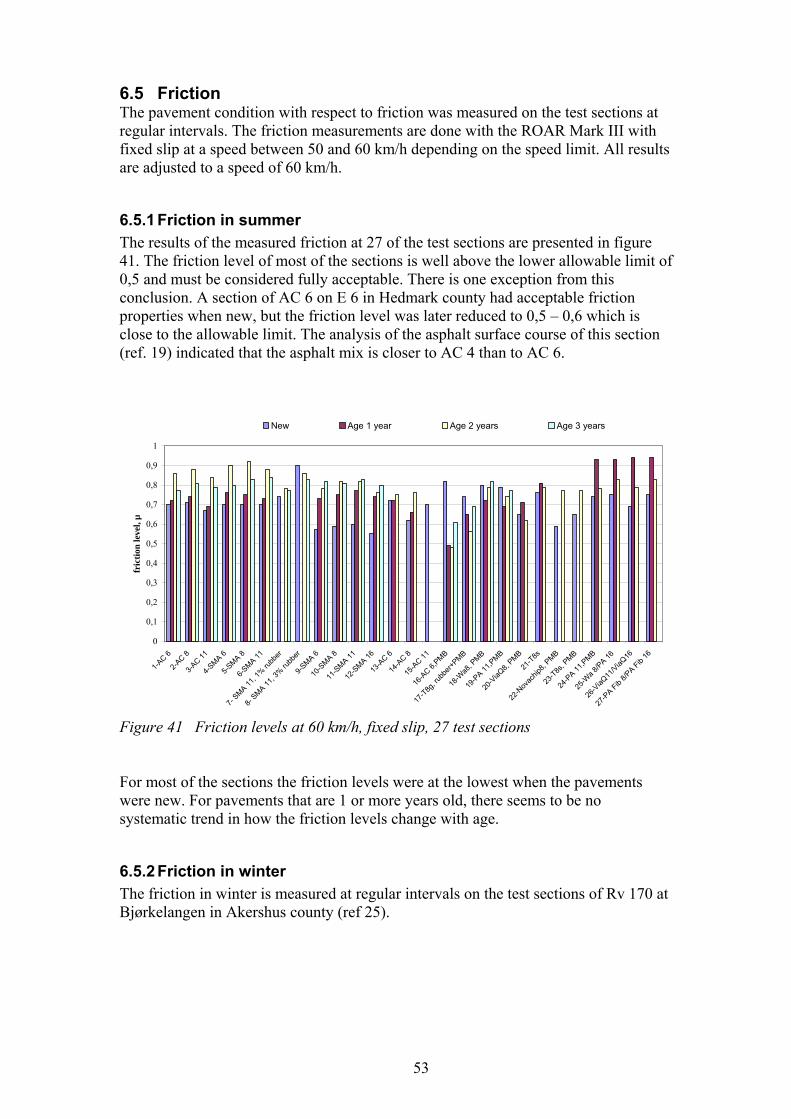
53
6.5 Friction The pavement condition with respect to friction was measured on the test sections at regular intervals. The friction measurements are done with the ROAR Mark III with fixed slip at a speed between 50 and 60 km/h depending on the speed limit. All results are adjusted to a speed of 60 km/h.
6.5.1 Friction in summer The results of the measured friction at 27 of the test sections are presented in figure 41. The friction level of most of the sections is well above the lower allowable limit of 0,5 and must be considered fully acceptable. There is one exception from this conclusion. A section of AC 6 on E 6 in Hedmark county had acceptable friction properties when new, but the friction level was later reduced to 0,5 – 0,6 which is close to the allowable limit. The analysis of the asphalt surface course of this section (ref. 19) indicated that the asphalt mix is closer to AC 4 than to AC 6.
0
0,1
0,2
0,3
0,4
0,5
0,6
0,7
0,8
0,9
1
1-AC 6
2-AC 8
3-AC 1
1
4-SM
A 6
5-SM
A 8
6-SM
A 11
7- S
MA 1
1, 1
% ru
bber
8- S
MA 1
1, 3
% ru
bber
9-SM
A 6
10-S
MA 8
11-S
MA 1
1
12-S
MA 1
6
13-A
C 6
14-A
C 8
15-A
C 11
16-A
C 6,P
MB
17-T
8g, r
ubbe
r+PM
B
18-W
a8, P
MB
19-P
A 11,
PMB
20-V
iaQ8,
PM
B
21-T
8s
22-N
ovac
hip8,
PM
B
23-T
8s, P
MB
24-P
A 11,
PMB
25-W
a 8/
PA 16
26-V
iaQ11
/ViaQ
16
27-P
A Fib
8/PA F
ib 1
6
fric
tion
leve
l, µ
New Age 1 year Age 2 years Age 3 years
Figure 41 Friction levels at 60 km/h, fixed slip, 27 test sections For most of the sections the friction levels were at the lowest when the pavements were new. For pavements that are 1 or more years old, there seems to be no systematic trend in how the friction levels change with age.
6.5.2 Friction in winter The friction in winter is measured at regular intervals on the test sections of Rv 170 at Bjørkelangen in Akershus county (ref 25).
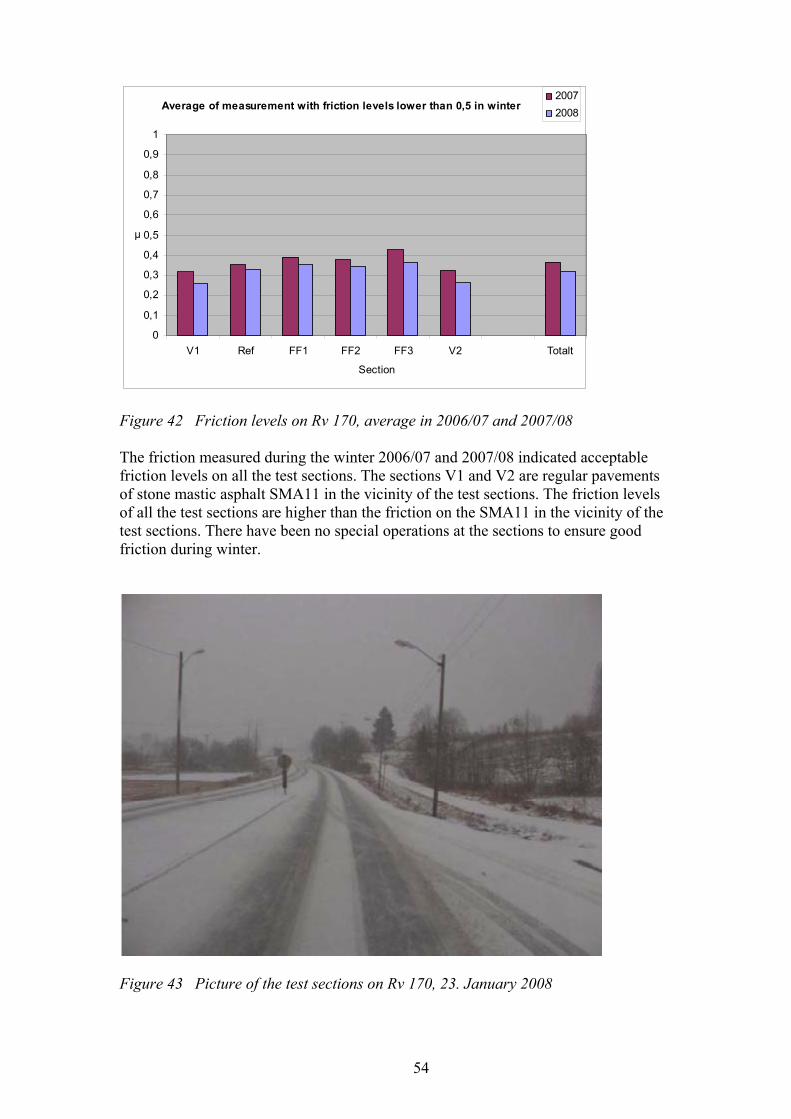
54
Average of measurement with friction levels lower than 0,5 in winter
0
0,1
0,2
0,3
0,4
0,5
0,6
0,7
0,8
0,9
1
V1 Ref FF1 FF2 FF3 V2 Totalt
Section
µ
2007
2008
Figure 42 Friction levels on Rv 170, average in 2006/07 and 2007/08 The friction measured during the winter 2006/07 and 2007/08 indicated acceptable friction levels on all the test sections. The sections V1 and V2 are regular pavements of stone mastic asphalt SMA11 in the vicinity of the test sections. The friction levels of all the test sections are higher than the friction on the SMA11 in the vicinity of the test sections. There have been no special operations at the sections to ensure good friction during winter.
Figure 43 Picture of the test sections on Rv 170, 23. January 2008
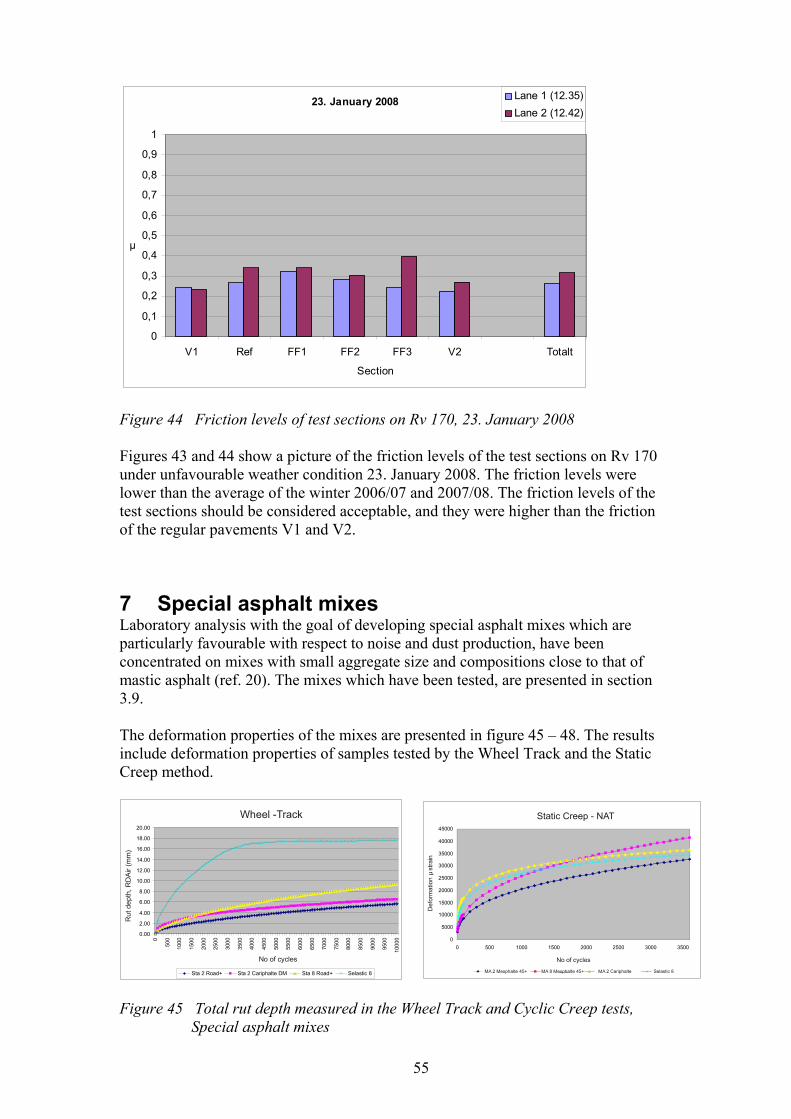
55
23. January 2008
0
0,1
0,2
0,3
0,4
0,5
0,6
0,7
0,8
0,9
1
V1 Ref FF1 FF2 FF3 V2 Totalt
Section
µ
Lane 1 (12.35)
Lane 2 (12.42)
Figure 44 Friction levels of test sections on Rv 170, 23. January 2008 Figures 43 and 44 show a picture of the friction levels of the test sections on Rv 170 under unfavourable weather condition 23. January 2008. The friction levels were lower than the average of the winter 2006/07 and 2007/08. The friction levels of the test sections should be considered acceptable, and they were higher than the friction of the regular pavements V1 and V2.
7 Special asphalt mixes Laboratory analysis with the goal of developing special asphalt mixes which are particularly favourable with respect to noise and dust production, have been concentrated on mixes with small aggregate size and compositions close to that of mastic asphalt (ref. 20). The mixes which have been tested, are presented in section 3.9. The deformation properties of the mixes are presented in figure 45 – 48. The results include deformation properties of samples tested by the Wheel Track and the Static Creep method.
Figure 45 Total rut depth measured in the Wheel Track and Cyclic Creep tests,
Special asphalt mixes
Sammenstilling - total sporutvikling
0.00
2.00
4.00
6.00
8.00
10.00
12.00
14.00
16.00
18.00
20.00
0
500
100
0
150
0
200
0
250
0
300
0
350
0
400
0
450
0
500
0
550
0
600
0
650
0
700
0
750
0
800
0
850
0
900
0
950
0
100
00
Antall lastsykler
Sp
ord
yb
de
, RD
AIR
(m
m)
Sta 2 Road+ Sta 2 Cariphalte DM Sta 8 Road+ Selastic 8
No of cycles
Rut
dep
th, R
DA
ir (m
m)
Wheel -Track Middelverdier - NAT
0
5000
10000
15000
20000
25000
30000
35000
40000
45000
0 500 1000 1500 2000 2500 3000 3500
Antall lastsykler
De
form
asjo
n,
µst
rain
Sta 2 Road+ Sta 8 Road+ Sta2 Cariphalte Selastic 8
No of cycles
Static Creep - NAT
Def
orm
atio
n
stra
inµ
MA 2 Mexphalte 45+ MA 8 Mexphalte 45+ MA 2 Cariphalte Selastic 8
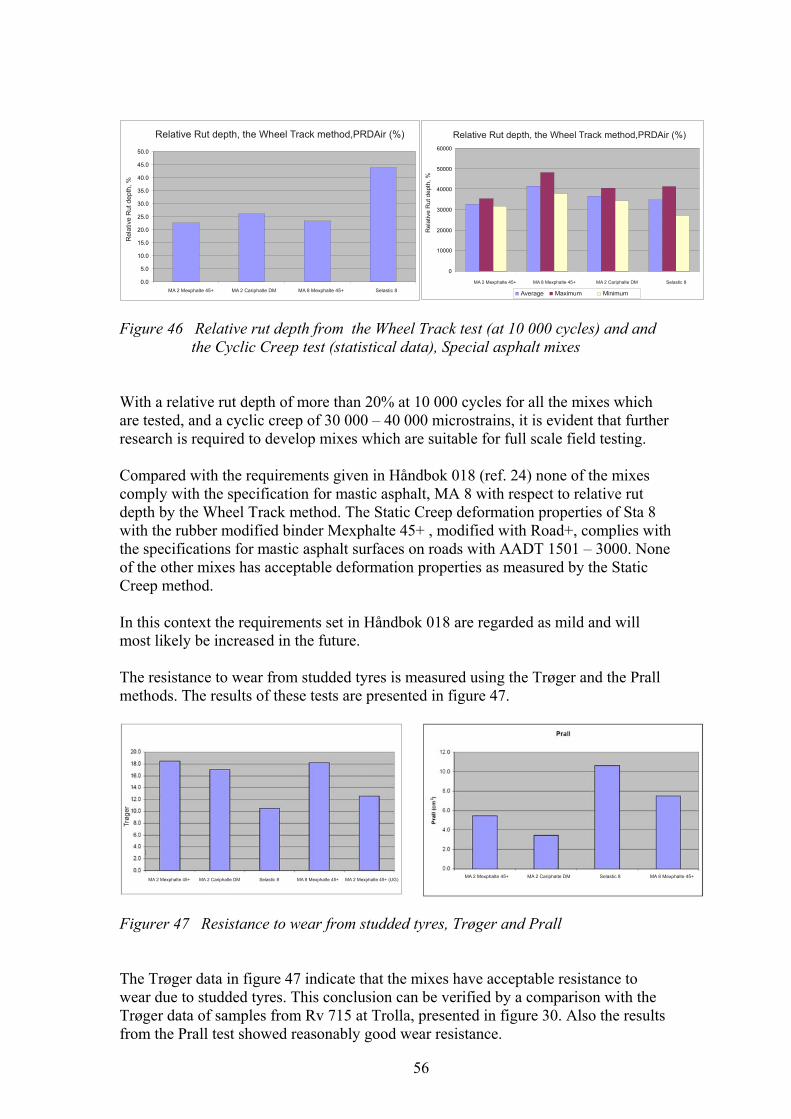
56
Figure 46 Relative rut depth from the Wheel Track test (at 10 000 cycles) and and
the Cyclic Creep test (statistical data), Special asphalt mixes With a relative rut depth of more than 20% at 10 000 cycles for all the mixes which are tested, and a cyclic creep of 30 000 – 40 000 microstrains, it is evident that further research is required to develop mixes which are suitable for full scale field testing. Compared with the requirements given in Håndbok 018 (ref. 24) none of the mixes comply with the specification for mastic asphalt, MA 8 with respect to relative rut depth by the Wheel Track method. The Static Creep deformation properties of Sta 8 with the rubber modified binder Mexphalte 45+ , modified with Road+, complies with the specifications for mastic asphalt surfaces on roads with AADT 1501 – 3000. None of the other mixes has acceptable deformation properties as measured by the Static Creep method. In this context the requirements set in Håndbok 018 are regarded as mild and will most likely be increased in the future. The resistance to wear from studded tyres is measured using the Trøger and the Prall methods. The results of these tests are presented in figure 47.
Figurer 47 Resistance to wear from studded tyres, Trøger and Prall The Trøger data in figure 47 indicate that the mixes have acceptable resistance to wear due to studded tyres. This conclusion can be verified by a comparison with the Trøger data of samples from Rv 715 at Trolla, presented in figure 30. Also the results from the Prall test showed reasonably good wear resistance.
Statistiske data
0
10000
20000
30000
40000
50000
60000
Sta 2 Road+ Sta 8 Road+ Sta 2 Cariphalte DM Selastic 8
De
form
asjo
n, µ
stra
in
Middelverdi Maksimumsverdi MinimumsverdiAverage Maximum Minimum
Rel
ativ
e R
ut d
epth
, %
Relative Rut depth, the Wheel Track method,PRDAir (%)
MA 2 Mexphalte 45+ MA 8 Mexphalte 45+ MA 2 Cariphalte DM Selastic 8
Relativ spordybde, PRDAIR (%)
0.0
5.0
10.0
15.0
20.0
25.0
30.0
35.0
40.0
45.0
50.0
Sta 2 Road+ Sta 2 Cariphalte DM Sta 8 Road+ Selastic 8
Rel
ativ
sp
ord
ybd
e, P
RD
AIR
(%
)Relative Rut depth, the Wheel Track method,PRDAir (%)
Rel
ativ
e R
ut d
ept
h, %
MA 2 Mexphalte 45+ MA 2 Cariphalte DM MA 8 Mexphalte 45+ Selastic 8
MA 2 Mexphalte 45+ MA 2 Cariphalte DM Selastic 8 MA 8 Mexphalte 45+
Trø
ger
MA 2 Mexphalte 45+ MA 2 Cariphalte DM Selastic 8 MA 8 Mexphalte 45+ MA 2 Mexphalte 45+ (UG)
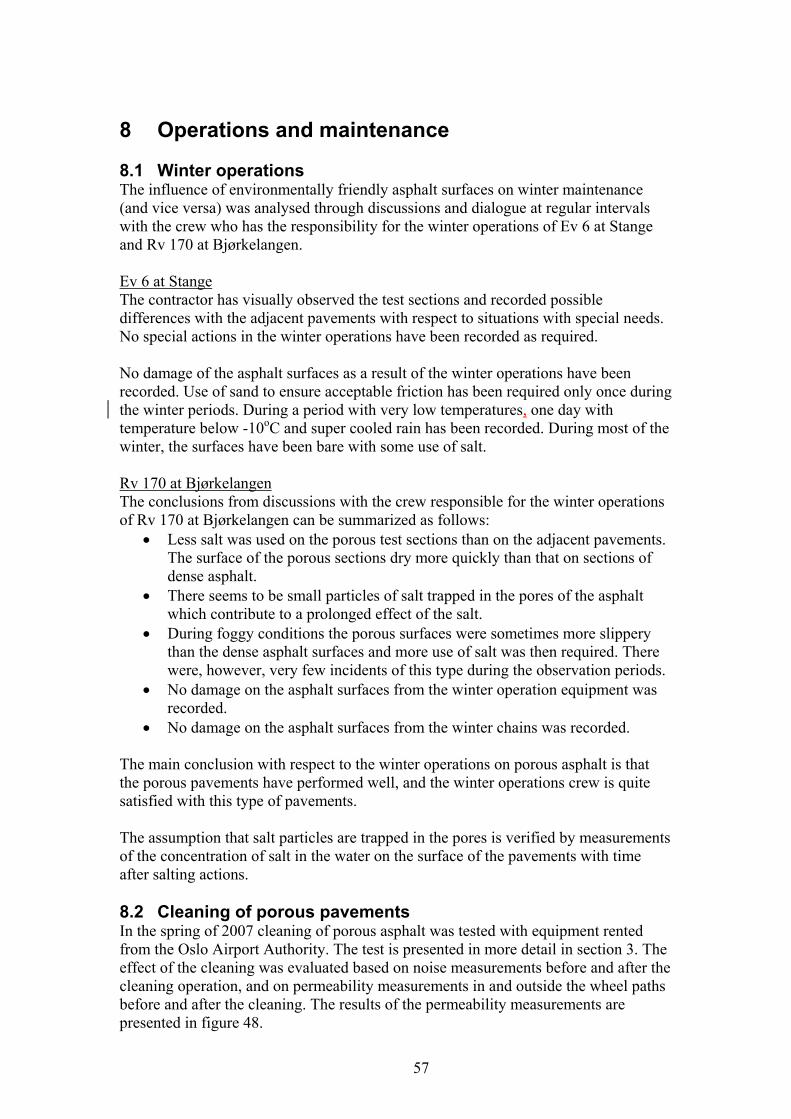
57
8 Operations and maintenance 8.1 Winter operations The influence of environmentally friendly asphalt surfaces on winter maintenance (and vice versa) was analysed through discussions and dialogue at regular intervals with the crew who has the responsibility for the winter operations of Ev 6 at Stange and Rv 170 at Bjørkelangen. Ev 6 at Stange The contractor has visually observed the test sections and recorded possible differences with the adjacent pavements with respect to situations with special needs. No special actions in the winter operations have been recorded as required. No damage of the asphalt surfaces as a result of the winter operations have been recorded. Use of sand to ensure acceptable friction has been required only once during the winter periods. During a period with very low temperatures, one day with temperature below -10oC and super cooled rain has been recorded. During most of the winter, the surfaces have been bare with some use of salt. Rv 170 at Bjørkelangen The conclusions from discussions with the crew responsible for the winter operations of Rv 170 at Bjørkelangen can be summarized as follows:
Less salt was used on the porous test sections than on the adjacent pavements. The surface of the porous sections dry more quickly than that on sections of dense asphalt.
There seems to be small particles of salt trapped in the pores of the asphalt which contribute to a prolonged effect of the salt.
During foggy conditions the porous surfaces were sometimes more slippery than the dense asphalt surfaces and more use of salt was then required. There were, however, very few incidents of this type during the observation periods.
No damage on the asphalt surfaces from the winter operation equipment was recorded.
No damage on the asphalt surfaces from the winter chains was recorded. The main conclusion with respect to the winter operations on porous asphalt is that the porous pavements have performed well, and the winter operations crew is quite satisfied with this type of pavements. The assumption that salt particles are trapped in the pores is verified by measurements of the concentration of salt in the water on the surface of the pavements with time after salting actions. 8.2 Cleaning of porous pavements In the spring of 2007 cleaning of porous asphalt was tested with equipment rented from the Oslo Airport Authority. The test is presented in more detail in section 3. The effect of the cleaning was evaluated based on noise measurements before and after the cleaning operation, and on permeability measurements in and outside the wheel paths before and after the cleaning. The results of the permeability measurements are presented in figure 48.
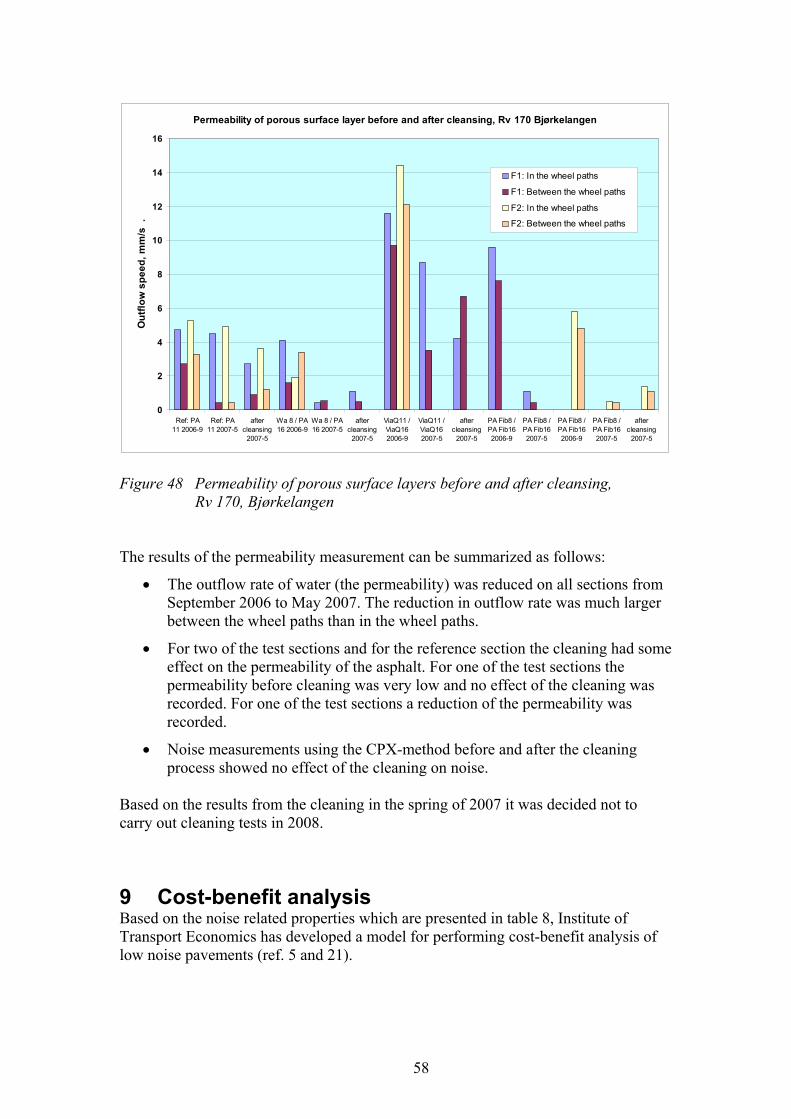
58
Permeability of porous surface layer before and after cleansing, Rv 170 Bjørkelangen
0
2
4
6
8
10
12
14
16
Ref: PA11 2006-9
Ref: PA11 2007-5
aftercleansing
2007-5
Wa 8 / PA16 2006-9
Wa 8 / PA16 2007-5
aftercleansing
2007-5
ViaQ11 /ViaQ162006-9
ViaQ11 /ViaQ162007-5
aftercleansing
2007-5
PA Fib8 /PA Fib162006-9
PA Fib8 /PA Fib162007-5
PA Fib8 /PA Fib162006-9
PA Fib8 /PA Fib162007-5
aftercleansing
2007-5
Ou
tflo
w s
pe
ed
, m
m/s
.
F1: In the wheel paths
F1: Between the wheel paths
F2: In the wheel paths
F2: Between the wheel paths
Figure 48 Permeability of porous surface layers before and after cleansing, Rv 170, Bjørkelangen The results of the permeability measurement can be summarized as follows:
The outflow rate of water (the permeability) was reduced on all sections from September 2006 to May 2007. The reduction in outflow rate was much larger between the wheel paths than in the wheel paths.
For two of the test sections and for the reference section the cleaning had some effect on the permeability of the asphalt. For one of the test sections the permeability before cleaning was very low and no effect of the cleaning was recorded. For one of the test sections a reduction of the permeability was recorded.
Noise measurements using the CPX-method before and after the cleaning process showed no effect of the cleaning on noise.
Based on the results from the cleaning in the spring of 2007 it was decided not to carry out cleaning tests in 2008.
9 Cost-benefit analysis Based on the noise related properties which are presented in table 8, Institute of Transport Economics has developed a model for performing cost-benefit analysis of low noise pavements (ref. 5 and 21).
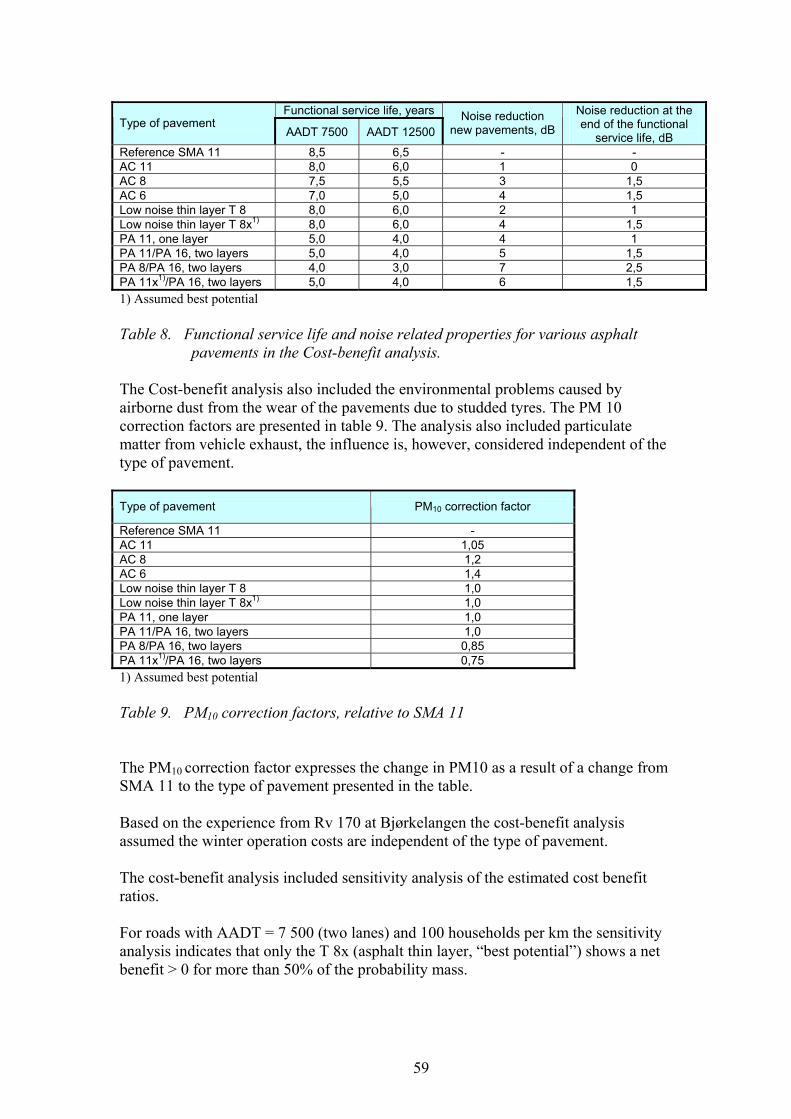
59
Functional service life, years
Type of pavement AADT 7500 AADT 12500
Noise reduction new pavements, dB
Noise reduction at the end of the functional
service life, dB Reference SMA 11 8,5 6,5 - - AC 11 8,0 6,0 1 0 AC 8 7,5 5,5 3 1,5 AC 6 7,0 5,0 4 1,5 Low noise thin layer T 8 8,0 6,0 2 1 Low noise thin layer T 8x1) 8,0 6,0 4 1,5 PA 11, one layer 5,0 4,0 4 1 PA 11/PA 16, two layers 5,0 4,0 5 1,5 PA 8/PA 16, two layers 4,0 3,0 7 2,5 PA 11x1)/PA 16, two layers 5,0 4,0 6 1,5
1) Assumed best potential Table 8. Functional service life and noise related properties for various asphalt
pavements in the Cost-benefit analysis. The Cost-benefit analysis also included the environmental problems caused by airborne dust from the wear of the pavements due to studded tyres. The PM 10 correction factors are presented in table 9. The analysis also included particulate matter from vehicle exhaust, the influence is, however, considered independent of the type of pavement.
Type of pavement PM10 correction factor
Reference SMA 11 - AC 11 1,05 AC 8 1,2 AC 6 1,4 Low noise thin layer T 8 1,0 Low noise thin layer T 8x1) 1,0 PA 11, one layer 1,0 PA 11/PA 16, two layers 1,0 PA 8/PA 16, two layers 0,85 PA 11x1)/PA 16, two layers 0,75
1) Assumed best potential Table 9. PM10 correction factors, relative to SMA 11 The PM10 correction factor expresses the change in PM10 as a result of a change from SMA 11 to the type of pavement presented in the table. Based on the experience from Rv 170 at Bjørkelangen the cost-benefit analysis assumed the winter operation costs are independent of the type of pavement. The cost-benefit analysis included sensitivity analysis of the estimated cost benefit ratios. For roads with AADT = 7 500 (two lanes) and 100 households per km the sensitivity analysis indicates that only the T 8x (asphalt thin layer, “best potential”) shows a net benefit > 0 for more than 50% of the probability mass.

60
Minimum number of households per km of road to obtain a
cost-benefit ratio ≥ 2,0 Type of pavement AADT = 7500, two lanes AADT = 12 500,four lanes
AC 11 1) - - AC81) - - AC 61) - - Low noise thin layer T 8 33 97 Low noise thin layer T 8x1) 13 42 PA 11, one layer 125 326 PA 11/PA 16, two layers 328 825 PA 8/PA 16, two layers 255 614 PA 11x1)/PA 16, two layers 125 325
1) Cost-benefit ratio ≥ 2,0 was not obtained because of the nuisance of particulate matter 2) Assumed best potential Table 10. Minimum number of households per km of road to obtain a cost-benefit
ratio≥ 2,0, 70 km/h Table 10 presents the minimum number of households subjected to road noise per km of road with a cost-benefit ratio > 2,0 if the type of pavement is changed from SMA 11 to the types presented in the table. A cost-benefit ratio of 2,0 is chosen to have a robust analysis, an analysis with a positive net benefit even if the basis of the calculations deviate somewhat from the real situation. Based on data presented in table 10, it can be concluded that a cost-benefit ratio ≥ 2,0 can be obtained for asphalt courses in very thin layers at the smallest number of households per km.
10 Recommended use of low noise pavements Table 11 (ref. 26) shows the conditions under which it is socio-economically favourable to apply environmentally friendly road pavements. The table is based on cost-benefit analysis. At present time, we do not have sufficient basis to require that environmentally friendly pavements be used on all roads where the criteria in table 11 are fulfilled and other conditions are favourable. The situation must be assessed for each site and the choice of pavement type must be based on a total judgement of the various alternatives. In many cases the best low noise alternative is most likely very thin or ultra thin asphalt layers, or traditional asphalt mixes of small aggregate size, such as AC 8 and SMA 8. It is recommended that the use of porous asphalt is limited to special cases where the noise annoyance is substantial and other alternatives are inadequate or very costly. When porous asphalt is used special care must be taken to ensure good drainage of water.

61
Porous asphalt Conditions Surfaces D ≤ 8
incl. thin layers One layer Two layer Speed limit (km/h) 40 - 80 ≥ 70 ≥ 70 Percentage of non studded winter tyres (%) 0 - 100 > 70 > 70 Two lanes AADT Noise annoyance, no of households per km
> 3000 > 30
> 5000 > 100
> 5000 > 200
Four or more lanes Noise annoyance, no of households per km
> 100
> 300
> 600
Other conditions Even subsurface,
well drained Even subsurface,
well drained
Table 11. Criteria for selection of low noise surface courses The recommendations in table 11 are based on the following conditions: The aggregates in the asphalt mix must be of high quality, particularly with
respect to wear resistance. The binder should be polymer modified. Where airborne dust is a problem in addition to noise, other measures should be
considered. The need for low noise pavements should be evaluated from noise maps and the
selection of pavement type must be based on a total judgement of all factors of interest.
The use of very thin asphalt layers will require a higher pavement maintenance standard than what is normally achieved. An asphalt in very thin layers will most often be completely worn out before the maximum allowable rut depth of 25 mm is reached. The use of very thin asphalt layers must therefore be accompanied by a policy of more frequent resurfacing. A policy of more frequent resurfacing will in itself often lead to a reduction of the noise level as a result of more even surfaces.
11 Conclusions and recommendations The goal of the project has been to gain new knowledge on what is achievable and what benefits can be obtained by an optimization of the pavements environmental properties. This must be considered as one of several actions to be taken to meet the national targets with respect to local air quality and noise. One example of other measures can be a reduction of the traffic speed, which has a positive influence on noise as well as local air quality. This wasconfirmed through several of the analyses conducted in this project. With respect to the potential of reducing noise and airborne dust in the environment of the roads, it is documented that: The noise level of new low noise asphalt pavements is 3-9 dB(A) lower than the
reference (SMA 11, 1 year of age or more). The noise reducing effect decreases quite rapidly with time for all the pavement
types which have been evaluated. The decrease in noise reducing effect is considerably larger than what is reported from other countries. Most likely the differences can be explained by the changes in pavement surface texture, created by studded tyres.
The friction levels of environmentally friendly pavements do not differ from traditional asphalt types and do not require special attention with respect to winter
62
operations. Most likely porous asphalt pavements have better friction properties than traditional asphalts.
It is a challenging task to develop asphalts which are much more wear resistant and creates less dust without a negative effect on other functional properties such as permanent deformation properties. Through a careful selection of aggregates and an optimum mix composition it is possible to reduce aggregate upper sieve size and consequently reduce the noise level with a minimum of loss in wear resistance.
Asphalt mixes in very thin layers had the most promising results in the cost-benefit analysis. Experience from other countries indicates that there is a potential of developing more durable thin layers with longer lasting noise properties than what have been achieved in the field tests in the project. Those types of low noise pavements should be regarded as a good alternative where the conditions are favourable. Traditional asphalts (SMA and AC) with aggregate upper sieve size of 8 mm or less have also favourable properties with respect to noise. The cost-benefit ratio is not quite as good as with thin asphalt surfaces because of the limited wear resistance and the dust generation. However, with more focus on the optimization of the wear resistance of this type of mixes (better quality of fine aggregates, polymer modified binder, optimum mix composition) the applicability of the pavements may be increased, in particular in areas with low percentage of cars with studded tyres in the winter. It is recommended to restrict the use of porous pavements in general. The experience with the use under Norwegian climate and traffic is still very limited. The clogging of the pores must be considered a problem. The cleaning of porous surfaces with present available equipment is not very efficient. Another negative factor for the porous pavements is the limitations in the pavements applicability. Most likely the volume of porous pavements will for many years be quite small, creating difficulties for the contractors to develop the special workmanship which is required for a porous asphalt of good quality. The contractors have so far had little possibility of acquiring complete knowledge on the acoustical properties of the various asphalt pavements. Their possibility to predict future acoustical performance is therefore very limited. It is therefore not advisable at this stage to put forward functional requirements with respect to acoustical properties. It is recommended that future work with low noise pavements include development of performance based specifications for acoustical properties. 11.1 Ongoing activities and projects Texture The surface texture is vital for tyre/road noise as well as the frictional properties of pavements. During recent years equipment for measuring texture at normal traffic speed has come into regular use. An analysis of the change of texture with time has a good potential in explaining the changes in the acoustic properties of the pavements. There is a considerable need for better knowledge in this field, and ongoing activities in this field include a NordFoU project as well as a Ph-D study.
63
The NordFoU project is a joint research activity of the public roads administrations in Denmark, Sweden and Norway. The project was started in 2009 and will go on for three years. The project is named Road surface texture for low noise and low rolling resistance. Norwegian experts at the Norwegian Public Roads Administration and SINTEF are strongly involved in the NordFoU project. The doctoral study of Doreen Fritzsche at NTNU was initiated in 2008 and carries the title “The texture of road surfaces and its importance for environmental performance indicators as noise and friction”. Thin asphalt layers Thin asphalt layers have become good alternatives as cost efficient low noise pavements with good properties with respect to friction as well as good durability. Through the ERA-NET programme a joint research project named “Optimization of thin asphalt layers” is initiated. The goal of the project is to produce a state-of-the-art report based on experiences with in the various countries with use of hot asphalt mixes as surface courses in thin layers, 10 – 30 mm. The project is chaired by Sweden. Norway participates in the steering committee together with Austria, Switzerland, England and Denmark. European standardization Through the European research programmes SILVIA, SILENCE and INQUEST a great need for both standardization of measuring methods and classification of the noise properties of pavements has been observed. Standard measuring methods are important to compare noise measurement results from the various countries, and to compare the noise properties of road surfaces. In addition a standardization will make it easier to have a common understanding of what should be regarded as a low noise pavement and what could be obtained from the various measures to reduce noise. With this as a background a Noise Classification Advisory Group (NCAG) has been established. This is a group with strong professional participation from the majority of the European countries. However, the group has no formal status or foundation. Work has been done with the purpose of making noise classification an activity of CEN. The goal is to prepare a basis for the development of specifications and practice with respect to functional properties and requirements related to noise. So far the Norwegian specialists have not participated in work groups which are involved in the development of the standards, but attended several of the NCAG meetings. Development of poroelastic pavements Internationally, there are several ongoing activities on the development of super slient poroelastic pavements. Japan and the Netherlands play a central role in this field. Since the field tests in the 90ies there has been only some limited activity on poroelastic pavements in Norway, but it is considered important to follow the development in this field closely. 11.2 Recommendations for future activities The outcomes of the various activities of the project Environmentally friendly pavements, like in most other R&D projects, have created new questions and a need for future analysis and testing. In the field of environmentally friendly pavements it is
64
considered important to maintain and develop the knowledge gained during the project. On this background the project proposes the following for future activities. To continue the monitoring of the present field test sections So far one has only up to three years of observations of the field test secions of low noise pavements. In many cases this is not enough for a good evaluation of the long term properties with respect to noise, texture, service life and other functional properties of the pavements. A continuation of the monitoring of present field test sectios is therefore recommended. This is also considered important for the international projects which have recently been initiated. Activities on thin asphalt layers and traditional pavements with D ≤ 8 mm Thin asphalt layers are the type of surface with the best cost benefit ratio based on present knowledge on durability, costs and noise. There are reasons to believe that there is potential for further improvements for both thin asphalt layers and traditional pavements with D ≤ 8 mm. This can probably be achieved through more focus on a the mortar phase, proper selection of wear resistant fine aggregates, selection of binder and an optimization of the mix composition. The acoustical properties of pavements, the resitance to wear (reduction in airborne dust), and the functional service life will benefit from a better knowledge in this field. It is considered important that the activities in this field go beyond the goals of the ERA-NET Road Project. Special asphalt mixes The laboratory tests which have been conducted on special asphalt mixes indicate that it is possible to develop a new type of asphalt pavement with enhanced properties with respect to noise, dust, friction and durability by a proper selection of aggregates, a good mix design and an optimum of modification of the binder. The preliminary results are encouraging and it is recommended that these investigations are pursued. It is necessary to go further with the optimization of the mix composition in the laboratory before field testing in full scale is initiated. The activities on special asphalt mixes may well be combined with activities discussed under the paragraph on traditional pavements with D ≤ 8 mm as well as future analysis of texture. Field testing of surface courses with fine asphalt mixes (mixes with aggregate upper sieve size ≤4 mm should probably include comprehensive analysis of frictional properties. In connection with this, it would be interesting to to test the frictional properties at higher speeds, 80km/h or over. The properties of fine mixes may well be acceptable at 60 km/t, but there is a risk that the speed dependency is unacceptable. In a OECD project ”Long Life Surfaces for Busy Roads” laboratory analyses have been conducted on a special asphalt mix (epoxy asphalt) The project has invited others to participate in the field testing of the mix. It is recommended that Norwegian authorities consider participation in the field testing, preferably in combination with testing of “typical Norwegian mixes”. The importance of aggregate quality on dust generation Based on the work conducted under the work package on dust, there is a need for further investigation of the effect of aggregate quantity and quality on the generation of airborne dust in winter. Through supplementary investigations of the factors of
65
importance for the dust generation, one will probably have a better basis for specifying asphalt mixex with minimum potential for dust generation. 11.3 Implementation of the results from the project It is recommended to take the following steps to implement the results of the project.
1. Revision of Håndbok 018 to include recommendations for the selection of asphalt mixes with enhanced envorimnmental properties. Some of the recommendations are included in the 2009 version of Håndbok 018.
2. Updating of the Nord 2000 models for noise estimation with noise data generated in the project.
3. Conduct analysis of the Norwegian road network to find out places where the use of low noise pavements might be beneficial. This includes estimates of the effect of combining low noise pavements with other measures and production of noise maps to serve as a basis for the selection of the best measures.
4. To produce overall plans for noise reduction measures based on the noise maps which include an evaluation of all alternative measures for noise reduction (low noise pavemens, noise barrier, façade insulation, traffic speed reduction and other traffic measures). The Regulations relating to pollution control (Pollution Regulations) of 2004-06-01 require the road owner to produce action plans to reduce traffic noise (applicable to streets and roads with AADT > 16 400 and from 2011 to Streets and roads with AADT > 8 200).
In the future there will most likely be a need for the Norwegian Pavement Management System to include the need for noise reduction measures and the effect of selecting low noise pavements on the noise levels.
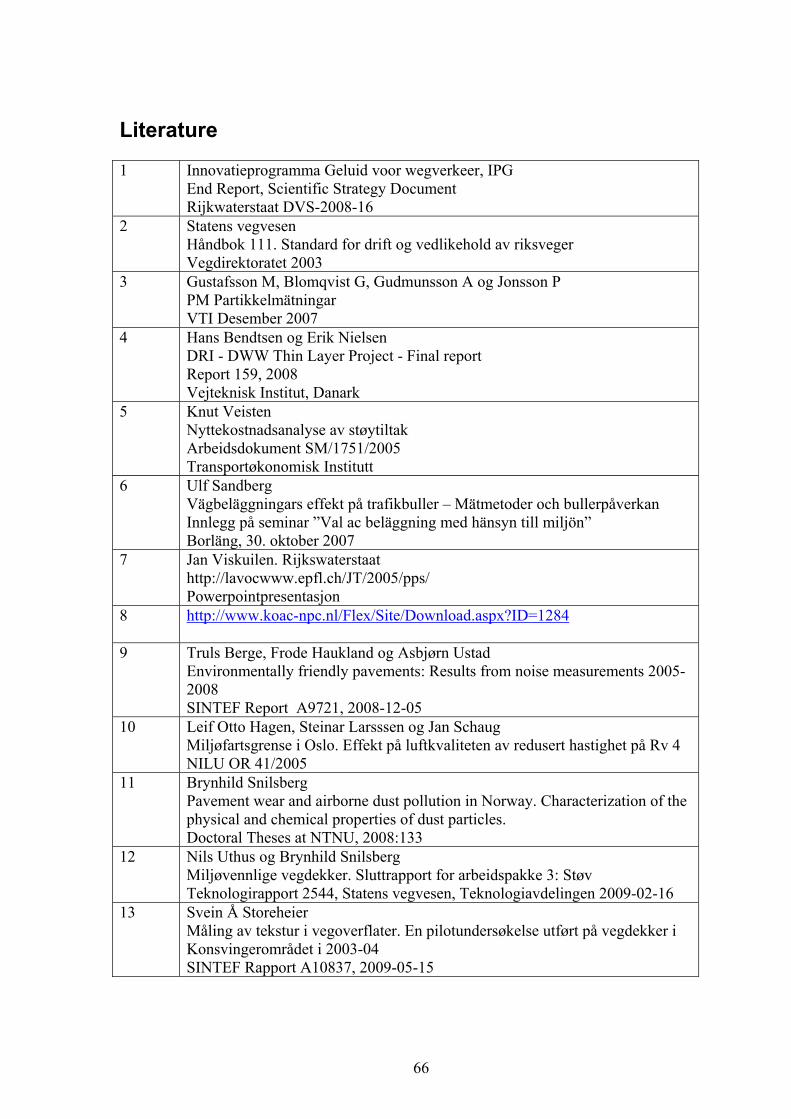
66
Literature 1 Innovatieprogramma Geluid voor wegverkeer, IPG
End Report, Scientific Strategy Document Rijkwaterstaat DVS-2008-16
2 Statens vegvesen Håndbok 111. Standard for drift og vedlikehold av riksveger Vegdirektoratet 2003
3 Gustafsson M, Blomqvist G, Gudmunsson A og Jonsson P PM Partikkelmätningar VTI Desember 2007
4 Hans Bendtsen og Erik Nielsen DRI - DWW Thin Layer Project - Final report Report 159, 2008 Vejteknisk Institut, Danark
5 Knut Veisten Nyttekostnadsanalyse av støytiltak Arbeidsdokument SM/1751/2005 Transportøkonomisk Institutt
6 Ulf Sandberg Vägbeläggningars effekt på trafikbuller – Mätmetoder och bullerpåverkan Innlegg på seminar ”Val ac beläggning med hänsyn till miljön” Borläng, 30. oktober 2007
7 Jan Viskuilen. Rijkswaterstaat http://lavocwww.epfl.ch/JT/2005/pps/ Powerpointpresentasjon
8 http://www.koac-npc.nl/Flex/Site/Download.aspx?ID=1284
9 Truls Berge, Frode Haukland og Asbjørn Ustad Environmentally friendly pavements: Results from noise measurements 2005-2008 SINTEF Report A9721, 2008-12-05
10 Leif Otto Hagen, Steinar Larsssen og Jan Schaug Miljøfartsgrense i Oslo. Effekt på luftkvaliteten av redusert hastighet på Rv 4 NILU OR 41/2005
11 Brynhild Snilsberg Pavement wear and airborne dust pollution in Norway. Characterization of the physical and chemical properties of dust particles. Doctoral Theses at NTNU, 2008:133
12 Nils Uthus og Brynhild Snilsberg Miljøvennlige vegdekker. Sluttrapport for arbeidspakke 3: Støv Teknologirapport 2544, Statens vegvesen, Teknologiavdelingen 2009-02-16
13 Svein Å Storeheier Måling av tekstur i vegoverflater. En pilotundersøkelse utført på vegdekker i Konsvingerområdet i 2003-04 SINTEF Rapport A10837, 2009-05-15
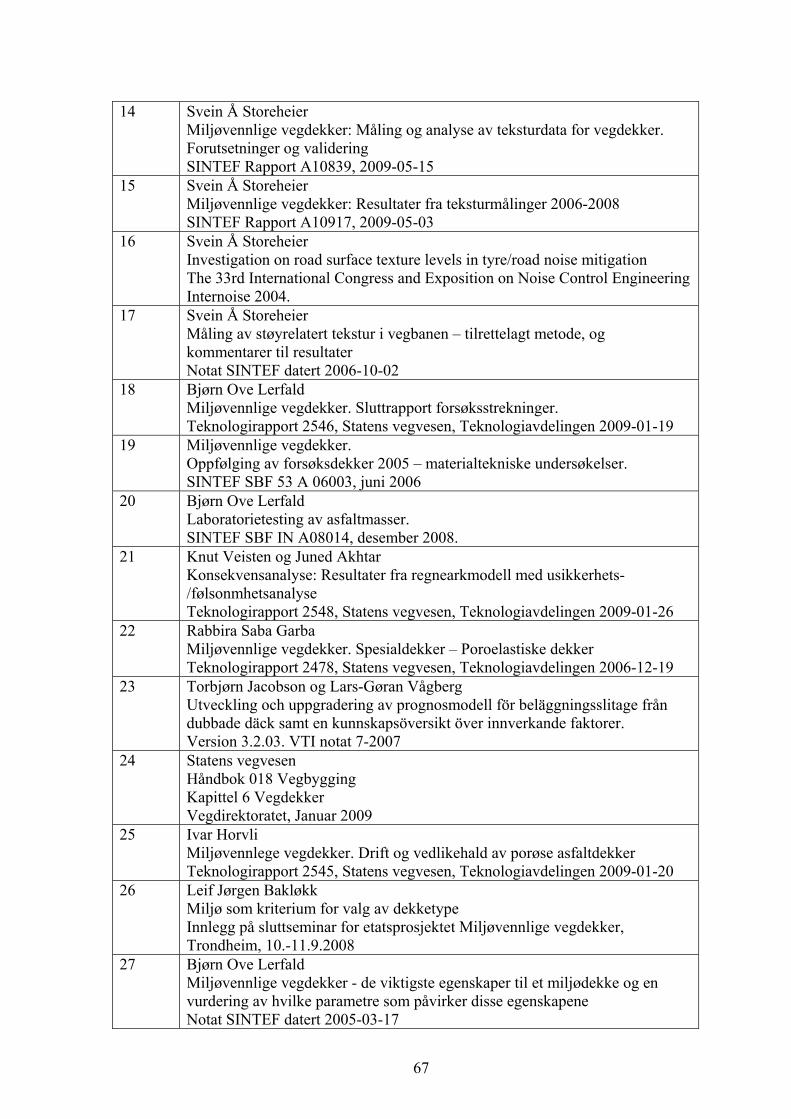
67
14 Svein Å Storeheier
Miljøvennlige vegdekker: Måling og analyse av teksturdata for vegdekker. Forutsetninger og validering SINTEF Rapport A10839, 2009-05-15
15 Svein Å Storeheier Miljøvennlige vegdekker: Resultater fra teksturmålinger 2006-2008 SINTEF Rapport A10917, 2009-05-03
16 Svein Å Storeheier Investigation on road surface texture levels in tyre/road noise mitigation The 33rd International Congress and Exposition on Noise Control Engineering Internoise 2004.
17 Svein Å Storeheier Måling av støyrelatert tekstur i vegbanen – tilrettelagt metode, og kommentarer til resultater Notat SINTEF datert 2006-10-02
18 Bjørn Ove Lerfald Miljøvennlige vegdekker. Sluttrapport forsøksstrekninger. Teknologirapport 2546, Statens vegvesen, Teknologiavdelingen 2009-01-19
19 Miljøvennlige vegdekker. Oppfølging av forsøksdekker 2005 – materialtekniske undersøkelser. SINTEF SBF 53 A 06003, juni 2006
20 Bjørn Ove Lerfald Laboratorietesting av asfaltmasser. SINTEF SBF IN A08014, desember 2008.
21 Knut Veisten og Juned Akhtar Konsekvensanalyse: Resultater fra regnearkmodell med usikkerhets-/følsonmhetsanalyse Teknologirapport 2548, Statens vegvesen, Teknologiavdelingen 2009-01-26
22 Rabbira Saba Garba Miljøvennlige vegdekker. Spesialdekker – Poroelastiske dekker Teknologirapport 2478, Statens vegvesen, Teknologiavdelingen 2006-12-19
23 Torbjørn Jacobson og Lars-Gøran Vågberg Utveckling och uppgradering av prognosmodell för beläggningsslitage från dubbade däck samt en kunnskapsöversikt över innverkande faktorer. Version 3.2.03. VTI notat 7-2007
24 Statens vegvesen Håndbok 018 Vegbygging Kapittel 6 Vegdekker Vegdirektoratet, Januar 2009
25 Ivar Horvli Miljøvennlege vegdekker. Drift og vedlikehald av porøse asfaltdekker Teknologirapport 2545, Statens vegvesen, Teknologiavdelingen 2009-01-20
26 Leif Jørgen Bakløkk Miljø som kriterium for valg av dekketype Innlegg på sluttseminar for etatsprosjektet Miljøvennlige vegdekker, Trondheim, 10.-11.9.2008
27 Bjørn Ove Lerfald Miljøvennlige vegdekker - de viktigste egenskaper til et miljødekke og en vurdering av hvilke parametre som påvirker disse egenskapene Notat SINTEF datert 2005-03-17
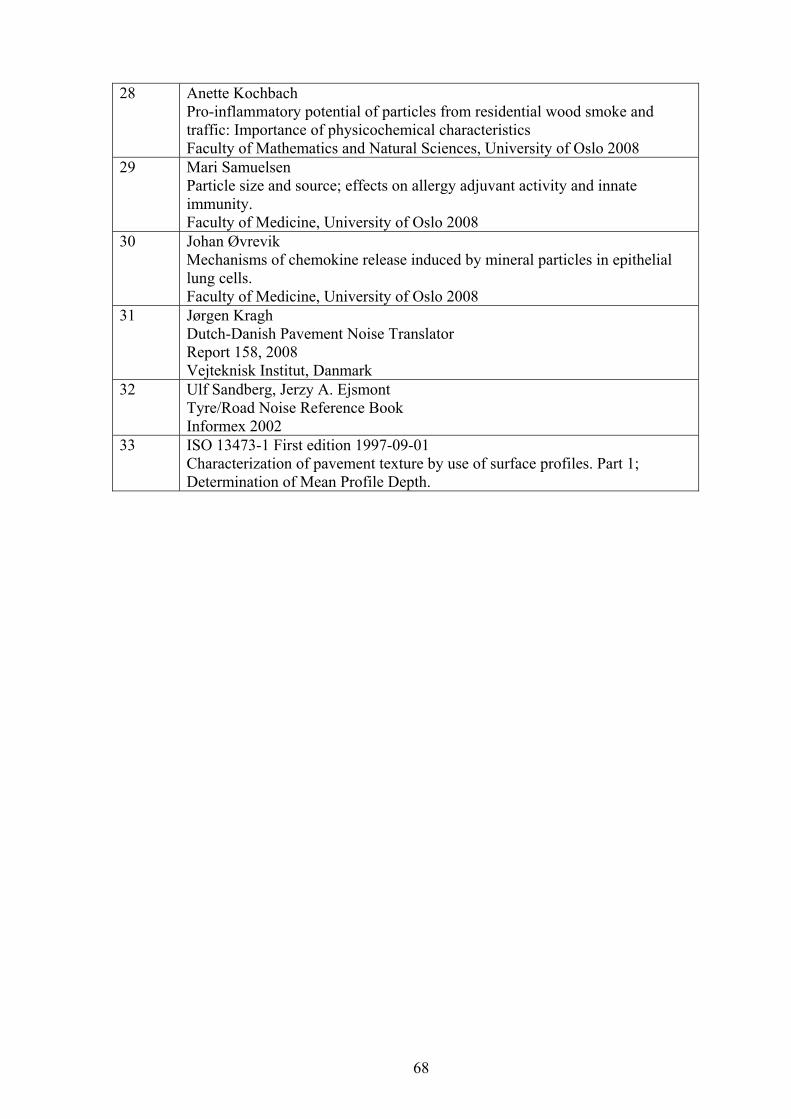
68
28 Anette Kochbach Pro-inflammatory potential of particles from residential wood smoke and traffic: Importance of physicochemical characteristics Faculty of Mathematics and Natural Sciences, University of Oslo 2008
29 Mari Samuelsen Particle size and source; effects on allergy adjuvant activity and innate immunity. Faculty of Medicine, University of Oslo 2008
30 Johan Øvrevik Mechanisms of chemokine release induced by mineral particles in epithelial lung cells. Faculty of Medicine, University of Oslo 2008
31 Jørgen Kragh Dutch-Danish Pavement Noise Translator Report 158, 2008 Vejteknisk Institut, Danmark
32 Ulf Sandberg, Jerzy A. Ejsmont Tyre/Road Noise Reference Book Informex 2002
33 ISO 13473-1 First edition 1997-09-01 Characterization of pavement texture by use of surface profiles. Part 1; Determination of Mean Profile Depth.
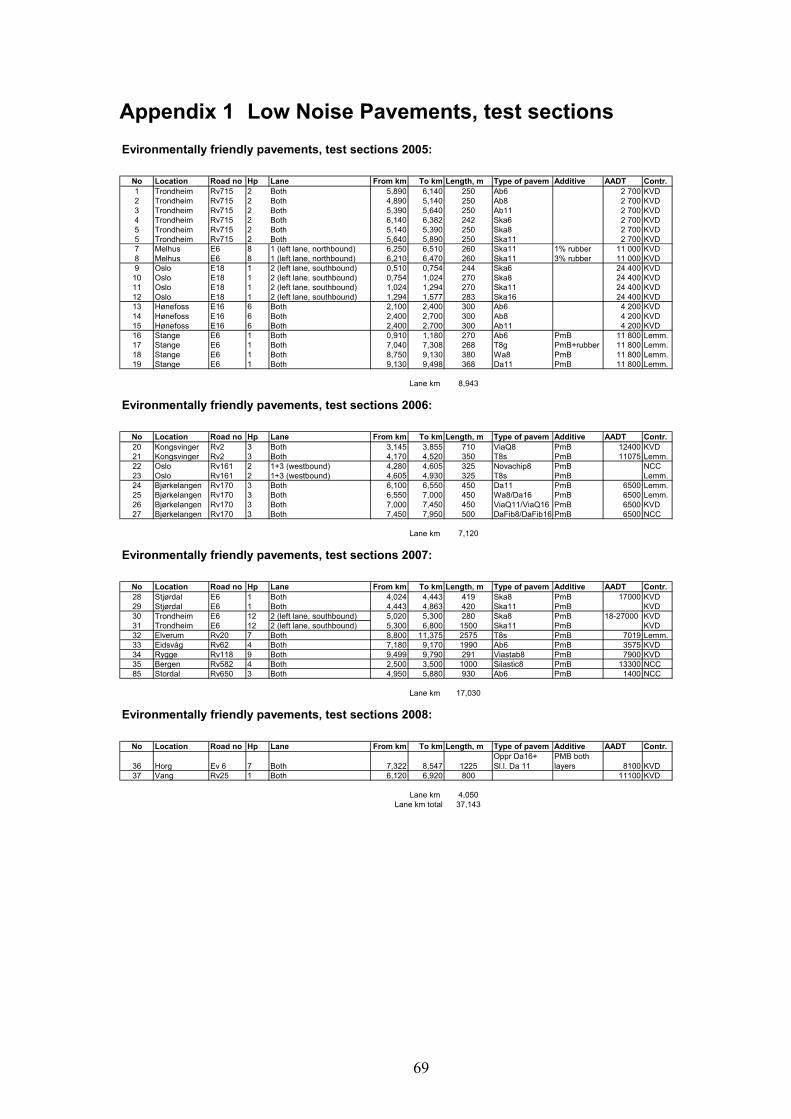
69
Appendix 1 Low Noise Pavements, test sections Evironmentally friendly pavements, test sections 2005:
No Location Road no Hp Lane From km To km Length, m Type of pavem Additive AADT Contr.1 Trondheim Rv715 2 Both 5,890 6,140 250 Ab6 2 700 KVD2 Trondheim Rv715 2 Both 4,890 5,140 250 Ab8 2 700 KVD3 Trondheim Rv715 2 Both 5,390 5,640 250 Ab11 2 700 KVD4 Trondheim Rv715 2 Both 6,140 6,382 242 Ska6 2 700 KVD5 Trondheim Rv715 2 Both 5,140 5,390 250 Ska8 2 700 KVD5 Trondheim Rv715 2 Both 5,640 5,890 250 Ska11 2 700 KVD7 Melhus E6 8 1 (left lane, northbound) 6,250 6,510 260 Ska11 1% rubber 11 000 KVD8 Melhus E6 8 1 (left lane, northbound) 6,210 6,470 260 Ska11 3% rubber 11 000 KVD9 Oslo E18 1 2 (left lane, southbound) 0,510 0,754 244 Ska6 24 400 KVD10 Oslo E18 1 2 (left lane, southbound) 0,754 1,024 270 Ska8 24 400 KVD11 Oslo E18 1 2 (left lane, southbound) 1,024 1,294 270 Ska11 24 400 KVD12 Oslo E18 1 2 (left lane, southbound) 1,294 1,577 283 Ska16 24 400 KVD13 Hønefoss E16 6 Both 2,100 2,400 300 Ab6 4 200 KVD14 Hønefoss E16 6 Both 2,400 2,700 300 Ab8 4 200 KVD15 Hønefoss E16 6 Both 2,400 2,700 300 Ab11 4 200 KVD16 Stange E6 1 Both 0,910 1,180 270 Ab6 PmB 11 800 Lemm.17 Stange E6 1 Both 7,040 7,308 268 T8g PmB+rubber 11 800 Lemm.18 Stange E6 1 Both 8,750 9,130 380 Wa8 PmB 11 800 Lemm.19 Stange E6 1 Both 9,130 9,498 368 Da11 PmB 11 800 Lemm.
Lane km 8,943
Evironmentally friendly pavements, test sections 2006:
No Location Road no Hp Lane From km To km Length, m Type of pavem Additive AADT Contr.20 Kongsvinger Rv2 3 Both 3,145 3,855 710 ViaQ8 PmB 12400 KVD21 Kongsvinger Rv2 3 Both 4,170 4,520 350 T8s PmB 11075 Lemm.22 Oslo Rv161 2 1+3 (westbound) 4,280 4,605 325 Novachip8 PmB NCC23 Oslo Rv161 2 1+3 (westbound) 4,605 4,930 325 T8s PmB Lemm.24 Bjørkelangen Rv170 3 Both 6,100 6,550 450 Da11 PmB 6500 Lemm.25 Bjørkelangen Rv170 3 Both 6,550 7,000 450 Wa8/Da16 PmB 6500 Lemm.26 Bjørkelangen Rv170 3 Both 7,000 7,450 450 ViaQ11/ViaQ16 PmB 6500 KVD27 Bjørkelangen Rv170 3 Both 7,450 7,950 500 DaFib8/DaFib16 PmB 6500 NCC
Lane km 7,120
Evironmentally friendly pavements, test sections 2007:
No Location Road no Hp Lane From km To km Length, m Type of pavem Additive AADT Contr.28 Stjørdal E6 1 Both 4,024 4,443 419 Ska8 PmB 17000 KVD29 Stjørdal E6 1 Both 4,443 4,863 420 Ska11 PmB KVD30 Trondheim E6 12 2 (left lane, southbound) 5,020 5,300 280 Ska8 PmB 18-27000 KVD31 Trondheim E6 12 2 (left lane, southbound) 5,300 6,800 1500 Ska11 PmB KVD32 Elverum Rv20 7 Both 8,800 11,375 2575 T8s PmB 7019 Lemm.33 Eidsvåg Rv62 4 Both 7,180 9,170 1990 Ab6 PmB 3575 KVD34 Rygge Rv118 9 Both 9,499 9,790 291 Viastab8 PmB 7900 KVD35 Bergen Rv582 4 Both 2,500 3,500 1000 Silastic8 PmB 13300 NCC85 Stordal Rv650 3 Both 4,950 5,880 930 Ab6 PmB 1400 NCC
Lane km 17,030
Evironmentally friendly pavements, test sections 2008:
No Location Road no Hp Lane From km To km Length, m Type of pavem Additive AADT Contr.
36 Horg Ev 6 7 Both 7,322 8,547 1225Oppr Da16+ Sl.l. Da 11
PMB both layers 8100 KVD
37 Vang Rv25 1 Both 6,120 6,920 800 11100 KVD
Lane km 4,050Lane km total 37,143
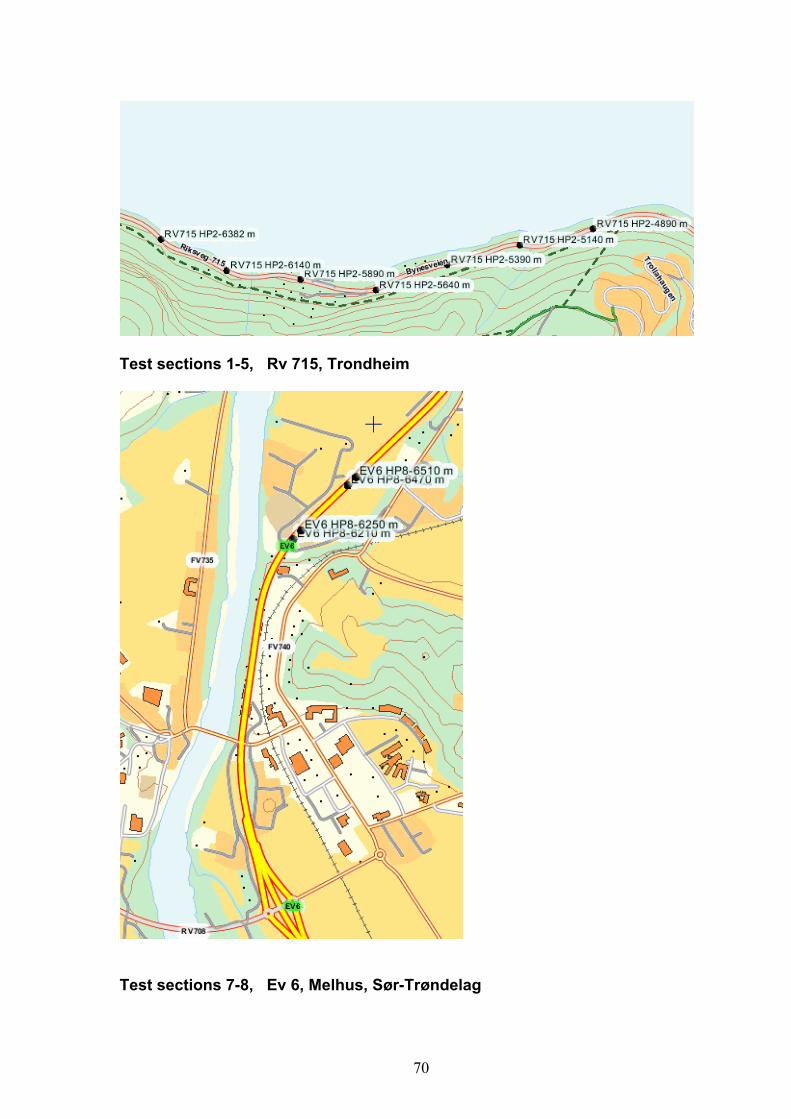
70
Test sections 1-5, Rv 715, Trondheim
Test sections 7-8, Ev 6, Melhus, Sør-Trøndelag

71
Test sections 9-12, Ev 18, Mastemyr, Oslo
Test sections 13-15, Ev 16, Hensmoen, Hønefoss
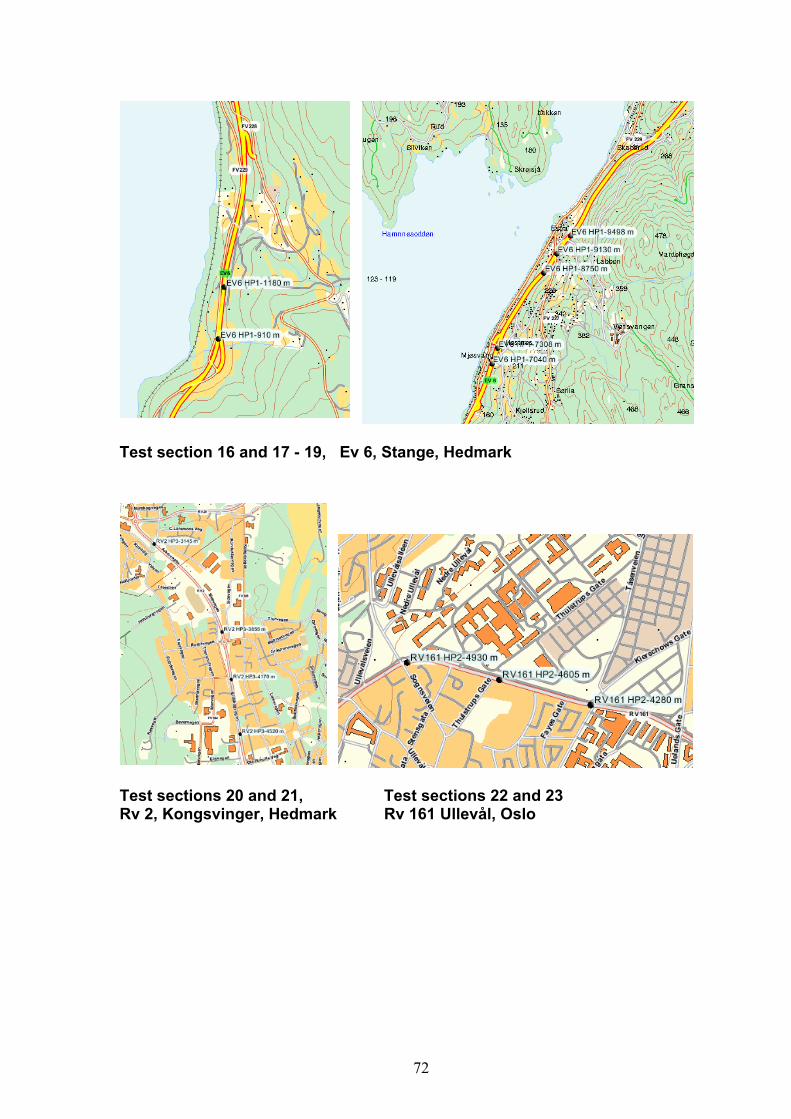
72
Test section 16 and 17 - 19, Ev 6, Stange, Hedmark
Test sections 20 and 21, Test sections 22 and 23 Rv 2, Kongsvinger, Hedmark Rv 161 Ullevål, Oslo
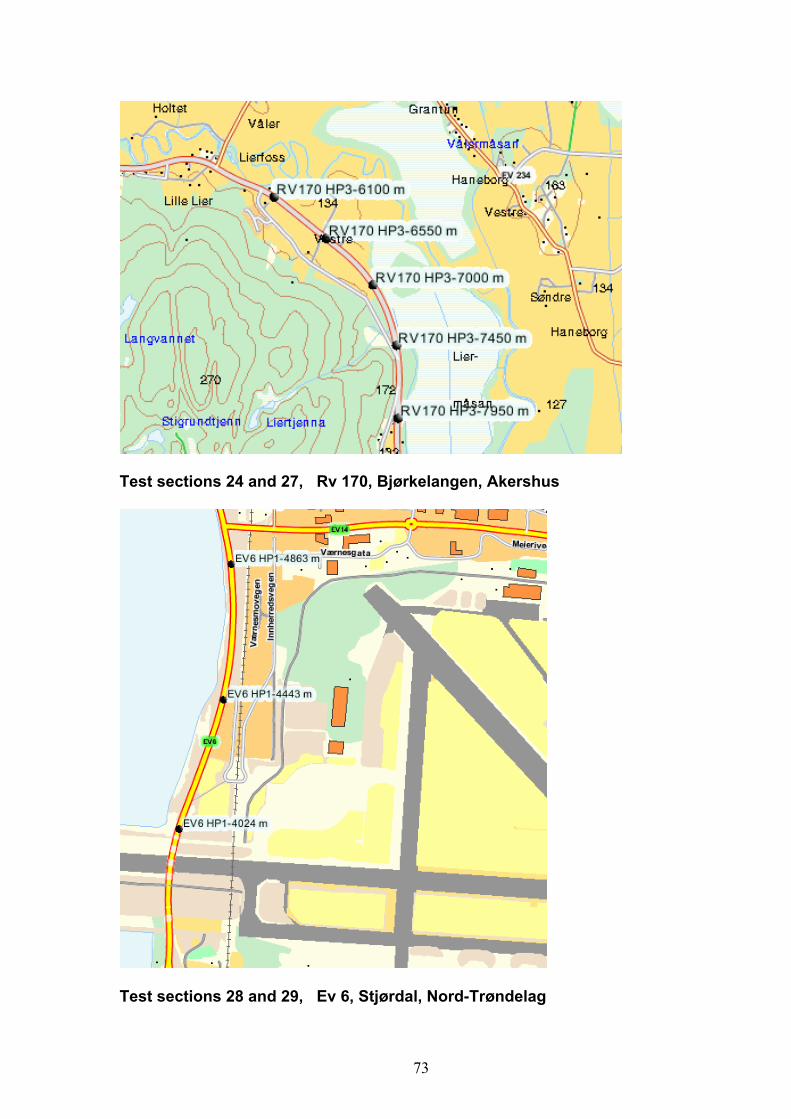
73
Test sections 24 and 27, Rv 170, Bjørkelangen, Akershus
Test sections 28 and 29, Ev 6, Stjørdal, Nord-Trøndelag
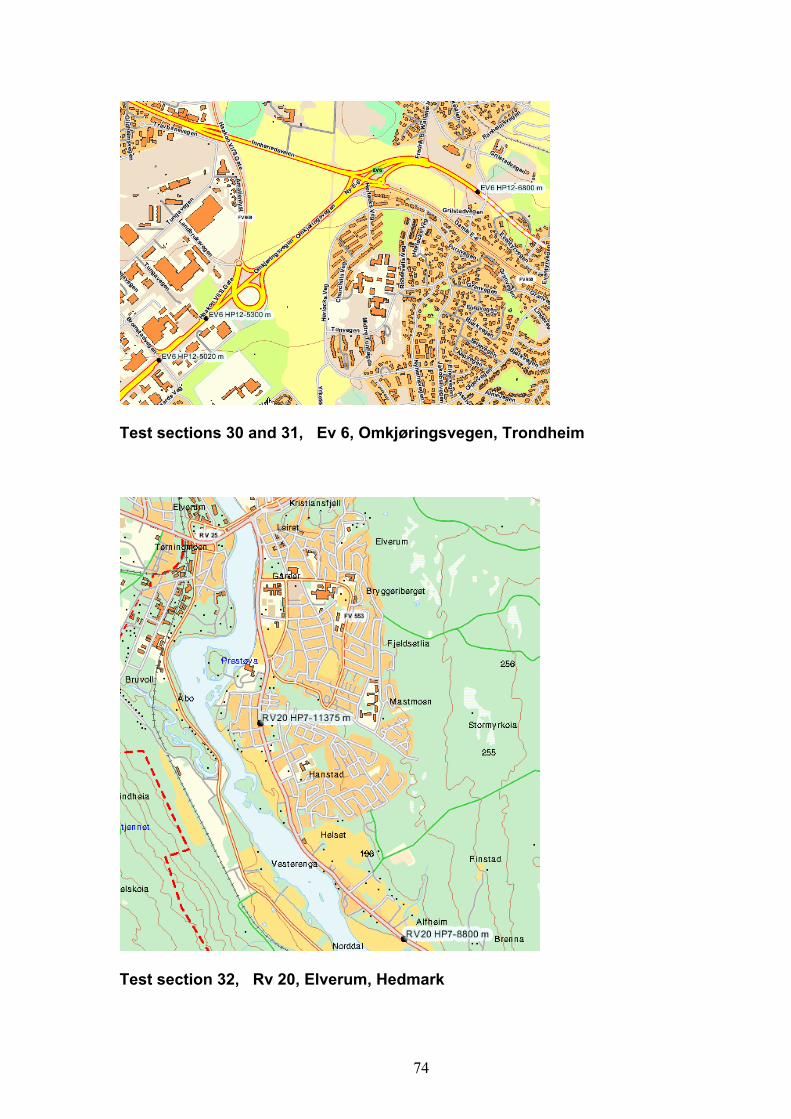
74
Test sections 30 and 31, Ev 6, Omkjøringsvegen, Trondheim
Test section 32, Rv 20, Elverum, Hedmark
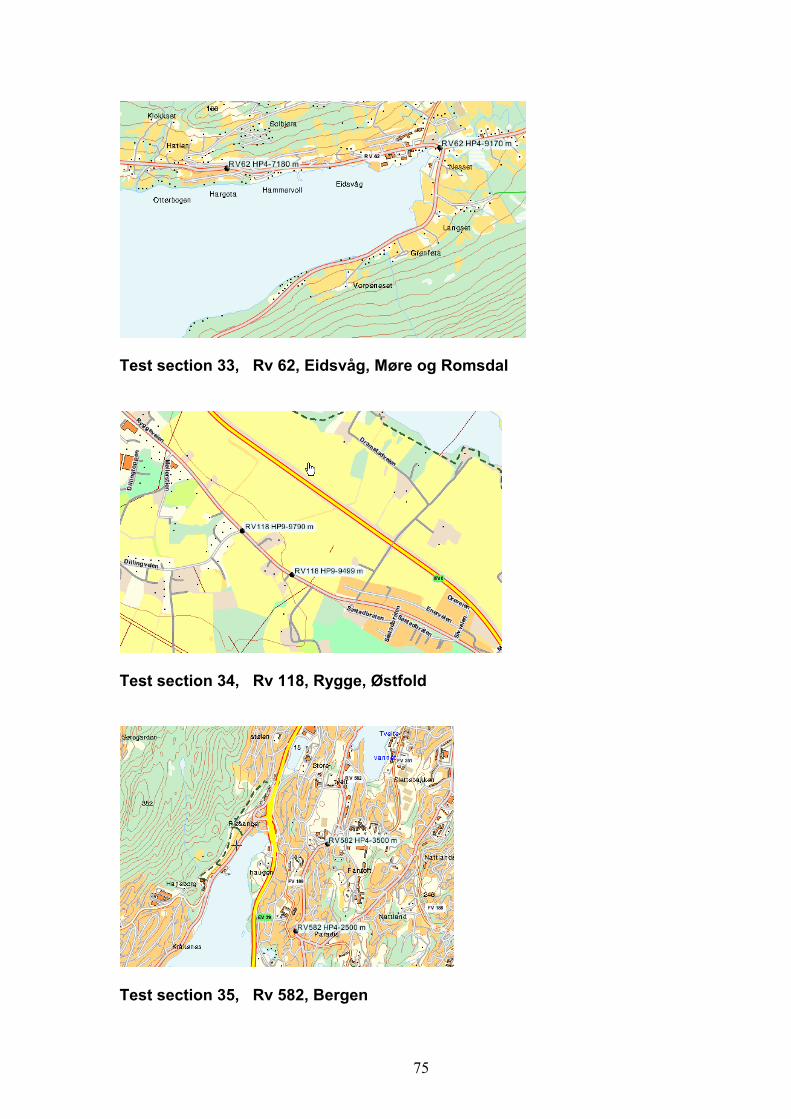
75
Test section 33, Rv 62, Eidsvåg, Møre og Romsdal
Test section 34, Rv 118, Rygge, Østfold
Test section 35, Rv 582, Bergen
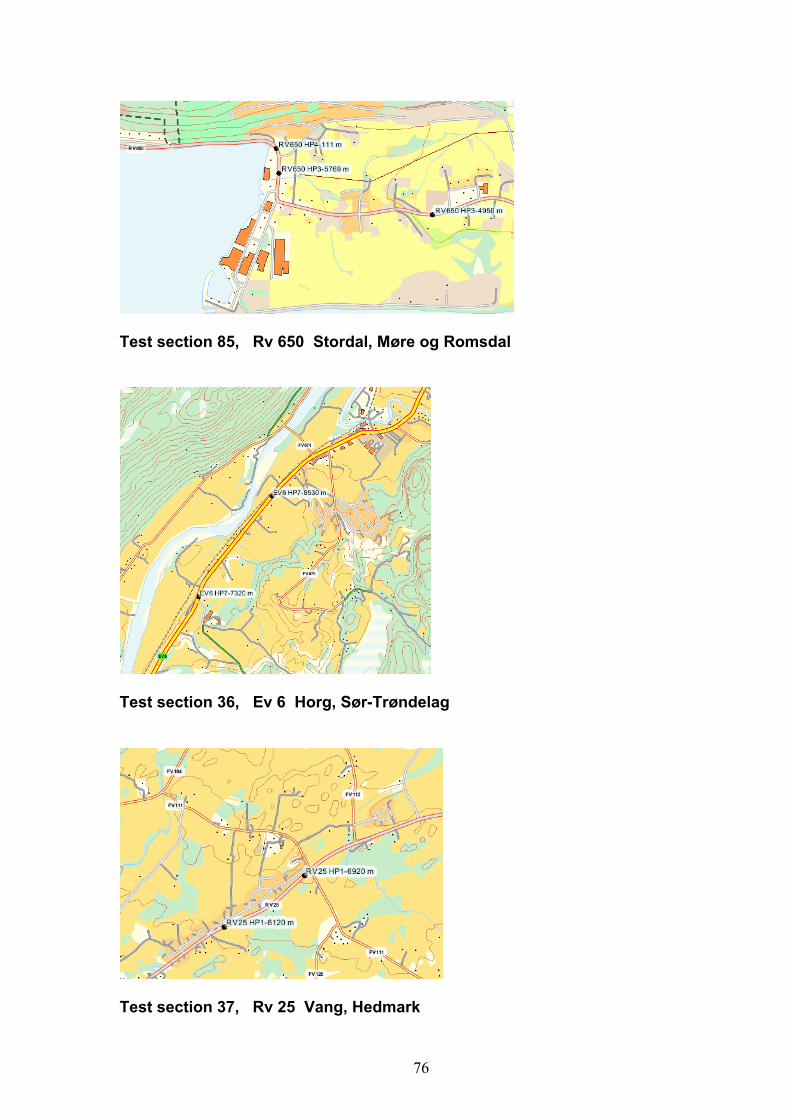
76
Test section 85, Rv 650 Stordal, Møre og Romsdal
Test section 36, Ev 6 Horg, Sør-Trøndelag
Test section 37, Rv 25 Vang, Hedmark
Statens vegvesen VegdirektoratetPostboks 8142 Dep
N - 0033 Oslo
Tlf. (+47 915) 02030E-post: [email protected]
ISSN 1504-5005


![POROUS ASPHALT PAVEMENTS1].pdf · Porous asphalt is an environmentally . friendly tool for stormwater management. POROUS. ASPHALT PAVEMENTS. In the natural environment, rainfall sinks](https://img.pdfslide.us/doc/110x75/5e0b552e1e73a745da693b59/porous-asphalt-pavements-1pdf-porous-asphalt-is-an-environmentally-friendly.jpg)
![POROUS ASPHALT PAVEMENTS1].pdf · Porous asphalt is an environmentally friendly tool for stormwater management. POROUS ASPHALT PAVEMENTS In the natural environment, rainfall sinks](https://img.pdfslide.us/doc/110x75/5afff62e7f8b9a54578be0b6/porous-asphalt-1pdfporous-asphalt-is-an-environmentally-friendly-tool-for-stormwater.jpg)