Embed Size (px)
Citation preview
Final Report
Pervious Pavements - Installation, Operations and Strength
Part 1: Pervious Concrete Systems
Work Performed for the Florida Department of Transportation
Submitted by
Manoj Chopra, Ph.D., P.E. Erik Stuart, E.I.
Mike Hardin, MSEnv.E., E.I. Ikenna Uju, E.I.
Marty Wanielista, Ph.D., P.E.
Stormwater Management Academy University of Central Florida
Orlando, FL 32816
FDOT Project Number: BDK78; Work Order #971-01 UCF Office of Research Account Number: 16-60-7024
April 15, 2011

2
Disclaimer
This report presents the findings of the Stormwater Management Academy and does not necessarily reflect the views or policies of any state agency or water management district, nor does mention of trade names or commercial products constitute endorsement or recommendation for use.

3
Technical Report Documentation Page
1. Report No. 2. Government Accession No. 3. Recipient's Catalog No.
4. Title and Subtitle Pervious Pavements – Installation, Operations and Strength Part 1: Pervious Concrete
5. Report Date August 2011
6. Performing Organization Code Stormwater Management Academy
7. Author(s) Manoj Chopra, Marty Wanielista, Erik Stuart, Mike Hardin, and Ikenna Uju
8. Performing Organization Report No.
9. Performing Organization Name and Address Stormwater Management Academy University of Central Florida Orlando, FL 32816
10. Work Unit No. (TRAIS)
11. Contract or Grant No. BDK78 #971-‐01
12. Sponsoring Agency Name and Address Florida Department of Transportation 605 Suwannee Street, MS 30 Tallahassee, FL 32399
13. Type of Report and Period Covered Final Report; May 2008 – Aug 2011
14. Sponsoring Agency Code
15. Supplementary Notes
16. Abstract Pervious pavement systems are now being recognized as a best management practice by the Environmental Protection Agency and the state of Florida. The pervious concrete system is designed to have enhanced pore sizes in the surface layer compared to conventional pavement types, encouraging flow of water through the material. This research project investigated the infiltration rates, rejuvenation techniques, sustainable storage of the components and complete systems, water quality, and the strength properties of pervious concrete pavements. The work was conducted at the field labs of the Stormwater Management Academy at UCF. Pervious concrete pavement systems are able to perform well considering the high level of imposed sediment accumulation throughout the 22 month study period. Out of 119 tests conducted on these sections, only thirteen tests recorded rates below 2.0 in/hr. The pervious concrete pavement systems can be expected to perform above 2.0 in/hr under normal “light to medium” sediment accumulation conditions without any maintenance and the infiltration rate can fall below 2.0 in/hr if under intense “heavy” sediment loading. These systems, however, can be rejuvenated by a standard vacuum sweeper truck to rates above 2.0 in/hr. The compressive strength values for pervious concrete samples cored from the installation at the field laboratory ranged from 988 – 2429 psi while the compressive strength range of the 8 x 4 cast in place samples was in the range 364 – 1100 psi. The total porosity measured was around 32% while the effective sustainable porosity was found to be around 27%. Water quality results indicate increase in nitrogen, ammonia, total and ortho-‐phosphate but this could be attributed to the use of local soils for the sub-‐base which likely leached nutrients. 17. Key Word Stormwater, Pervious Concrete, Strength, Falling Weight Deflectometer, Best Management Practices (BMPs), vacuuming sweeping, water quality
18. Distribution Statement No Restrictions
19. Security Classification (of this report) Unclassified
20. Security Classification (of this page) Unclassified
21. No. of Pages 200
22. Price
Form DOT F 1700.7 (8-‐72) Reproduction of completed page authorized
4
Table of Contents
LIST OF FIGURES ........................................................................................................................................... 6
LIST OF TABLES ............................................................................................................................................. 8
INTRODUCTION ............................................................................................................................................ 9
Background ............................................................................................................................................ 13
Literature Review ................................................................................................................................... 17
Infiltration Rate .................................................................................................................................. 18
Laboratory Infiltration Methods ........................................................................................................ 19
Field Infiltration Methods .................................................................................................................. 20
Double-‐Ring Infiltrometer .................................................................................................................. 21
Single Ring Infiltration Test ................................................................................................................ 22
Destructive Test Methods .................................................................................................................. 23
Laboratory Permeability Methods ..................................................................................................... 23
Field Permeability Methods ............................................................................................................... 24
Embedded Ring Infiltrometer Kit ....................................................................................................... 25
Strength of Pervious Concrete Pavements ........................................................................................ 29
PAVEMENT INSTALLATION AND SETUP ..................................................................................................... 31
Layout ................................................................................................................................................ 31
Curb Installation ................................................................................................................................. 32
Sub-‐base installation .......................................................................................................................... 35
PC Delivery/Discharge ........................................................................................................................ 36
PC Surface Layer ................................................................................................................................ 38
Controlled Expansion Joints ............................................................................................................... 40
Curing ................................................................................................................................................. 41
Setup for Infiltration and Rejuvenation ................................................................................................. 43
Sustainable Storage Evaluation Setup ................................................................................................... 53
Sustainable Void Space ...................................................................................................................... 53
Water Quality Setup .............................................................................................................................. 64
Preparation ........................................................................................................................................ 65

5
Strength Testing ..................................................................................................................................... 67
Laboratory Testing ............................................................................................................................. 67
Porosity and void ratio ........................................................................................................................... 69
Compressive strength testing ................................................................................................................ 69
Flexural strength testing ........................................................................................................................ 70
Field Testing ....................................................................................................................................... 70
RESULTS AND DISCUSSION ........................................................................................................................ 74
Infiltration and Rejuvenation Results .................................................................................................... 74
Sustainable Storage Evaluation Results ................................................................................................. 88
Water Quality Results ............................................................................................................................ 92
Strength Results ..................................................................................................................................... 98
Porosity and Unit weight ....................................................................................................................... 98
Flexural Strength .................................................................................................................................. 101
CONCLUSIONS AND OBSERVATIONS ....................................................................................................... 106
General Observations .......................................................................................................................... 106 Sustainable Storage ............................................................................................................................. 107
Water Quality ....................................................................................................................................... 108
Sample Calculations for Quantifying Water Quality Improvement ................................................. 108
Strength Evaluation ............................................................................................................................. 110
REFERENCES ............................................................................................................................................. 112

6
LIST OF FIGURES
Figure 1: Double Ring Infiltrometer used for measuring infiltration into soils ......................................... 21 Figure 2: ERIK monitoring tube ................................................................................................................. 26 Figure 3: ERIK embedded ring installed .................................................................................................... 28 Figure 4: ERIK monitoring cylinder reservoir ............................................................................................ 29 Figure 5: Curbing formwork and concrete pour ....................................................................................... 32 Figure 6: Rebar placement to reinforce curbing ....................................................................................... 33 Figure 7: Importance of reinforced curbing .............................................................................................. 33 Figure 8: Screed and Roller compactor riding along curbing .................................................................... 34 Figure 9: Filter Fabric Installation ............................................................................................................. 35 Figure 10: Sub-‐base installation ................................................................................................................ 36 Figure 11: Compacting Bold&GoldTM sub-‐base with vibratory plate compactor ...................................... 36 Figure 12: Pervious concrete must be manually scraped out of chute ..................................................... 37 Figure 13: Tire rutting ............................................................................................................................... 38 Figure 14: Screeding of pervious concrete ................................................................................................ 39 Figure 15: Rolling compactor over surface for finishing ........................................................................... 40 Figure 16: “Pizza cutter” tool to place expansion joints ........................................................................... 41 Figure 17: Plastic curing sheet installation ............................................................................................... 42 Figure 18: Final layout of pervious concrete sections ............................................................................... 42 Figure 19: Sediment loading ..................................................................................................................... 43 Figure 20: Compacting sediments into surface pores ............................................................................... 44 Figure 21: Washing in sediments with garden hose ................................................................................. 44 Figure 22: Limerocks loaded over entire surface ...................................................................................... 45 Figure 23: Limerock fines left behind from crushing the #57 stones ........................................................ 45 Figure 24: Limerock fines ready to be vacuumed ..................................................................................... 46 Figure 25: Post sediment loading ERIK testing .......................................................................................... 46 Figure 26: Dry vacuuming ......................................................................................................................... 47 Figure 27: Dry vacuuming over the ERIK device ....................................................................................... 48 Figure 28: Saturating the surface for wet vacuuming ............................................................................... 48 Figure 29: Wet vacuuming over ERIK device ............................................................................................. 49 Figure 30: Pavement surface after wet vacuuming .................................................................................. 49 Figure 31: Wet vacuuming of limerock fines ............................................................................................ 50 Figure 32: Surface after wet Vacuuming of limerock fines ....................................................................... 50 Figure 33: Limerock fines removed from surface ..................................................................................... 51 Figure 34: Post vacuum ERIK testing ......................................................................................................... 52 Figure 35: Post vacuum ERIK testing close up ........................................................................................... 52 Figure 36: Half gallon container ................................................................................................................ 53 Figure 37: Half Gallon container for component testing (pervious concrete) .......................................... 55 Figure 38: Half Gallon container for component testing (Bold&GoldTM) .................................................. 55 Figure 39: Sediment being loaded in ½ gallon containers ........................................................................ 56
7
Figure 40: Half Gallon containers draining by gravity ............................................................................... 57 Figure 41: 55 Gallon Barrel for System testing ......................................................................................... 60 Figure 42: Sediments being loaded on the surface and compacted into pores ........................................ 61 Figure 43: Sediments being washed into the surface pores ..................................................................... 61 Figure 44: Sediments loaded onto the surface of the pervious concrete ................................................. 62 Figure 45: Surface after vacuuming .......................................................................................................... 62 Figure 46: FWD equipment on pervious concrete section ........................................................................ 71 Figure 47: FWD equipment ....................................................................................................................... 71 Figure 48: Pervious Concrete Rejuvenation Cross Section ....................................................................... 75 Figure 49: Infiltration results for Rejuvenation North infiltrometer ......................................................... 76 Figure 50: Infiltration results for New Rejuvenation North infiltrometer ................................................. 77 Figure 51: Infiltration results for Rejuvenation South infiltrometer ......................................................... 78 Figure 52: Infiltration results for New Rejuvenation South infiltrometer ................................................. 79 Figure 53: Pervious Concrete Rejuvenation Cross Section ....................................................................... 80 Figure 54: Infiltration results for Rejuvenation East infiltrometer ............................................................ 81 Figure 55: Infiltration results for Rejuvenation West infiltrometer .......................................................... 82 Figure 56: Infiltration results for New Rejuvenation West infiltrometer .................................................. 83 Figure 57: Infiltration results for Bold&GoldTM West infiltrometer .......................................................... 84 Figure 58: Infiltration results for Bold&GoldTM East infiltrometer ............................................................ 85 Figure 59: Infiltration results for Fill West infiltrometer ........................................................................... 86 Figure 60: Infiltration results for Fill East infiltrometer ............................................................................ 87 Figure 61: System porosity results using 55 gallon barrels ....................................................................... 90 Figure 62: Total nitrogen results ............................................................................................................... 94 Figure 63: Ammonia results ...................................................................................................................... 95 Figure 64: Nitrate results .......................................................................................................................... 96 Figure 65: Total phosphate results ........................................................................................................... 97 Figure 66: Orthophosphate results ........................................................................................................... 97 Figure 67: FWD deflection basins for pervious concrete ....................................................................... 104 Figure 68: FWD deflection basin of conventional concrete ................................................................... 105

8
LIST OF TABLES
Table 1: Pervious concrete mix design ...................................................................................................... 68 Table 2: Individual component porosity test results ................................................................................ 90 Table 3: Typical Nutrient Concentrations for Surface Water and Stormwater for the Orlando Area ....... 93 Table 4: Compressive strength and porosity of cored pervious concrete cylinders. .............................. 100 Table 5: Compressive strength and porosity of 28-‐day pervious concrete cylinders ............................. 100 Table 6: Statistical data for compressive strength .................................................................................. 101 Table 7: Statistical data for porosity ....................................................................................................... 101 Table 8: Modulus of rupture from flexural strength test of cast in-‐situ pervious concrete ................... 102 Table 9: Statistical data for modulus of rupture ..................................................................................... 102 Table 10: Comparison between the strength laboratory test and literature ......................................... 103 Table 11: Comparison between the pervious concrete and conventional concrete ............................. 104 Table 12: Comparison of back-‐calculated in-‐situ elastic moduli ........................................................... 106
9
INTRODUCTION
Pervious pavement systems are now being recognized as a best management practice by
the Environmental Protection Agency (USEPA, 1999) and the new Draft Statewide Stormwater
Rule for the state of Florida. This type of pavement system allows for the rapid passage of water
through either its joints or porous structure and infiltration into the underlying soils. A number
of these systems were evaluated at the Stormwater Management Academy field laboratory on the
campus of the University of Central Florida.
The natural processes of the water cycle have been fundamentally altered by human
development and construction practices. In the natural state, stormwater falls to the earth and
gets absorbed into the soil and vegetation where it is filtered, stored, evaporated, and re-
dispersed into the ever flowing cycle. The current state of this cycle has reduced this process due
to the vast impervious pavements which have sealed the earth’s natural filter (Cahill, et al.,
2003). In 2005, it was recorded that 43,000 square miles of land in the United States have been
paved (Frazer, 2005). Impervious pavements related to automobiles account for two thirds of
these surfaces (Lake Superior, 2010).
Permeable pavements provide an alternative to the traditional impervious pavements and
due to their porous nature; these ecological consequences can be minimized or even prevented.
The advantages include reducing the volume of surface runoff, reduced need for stormwater
infrastructure, less land acquisition for stormwater ponds, improved road safety by reduced
surface ponding and glare, and a reduced urban heat island effect. Additionally permeable
pavements, by using regional or recycled materials such as local recycled automobile tire chips
(used in construction of the surface layer), tire crumbs (used in blending of the pollution control
10
media), and crushed concrete aggregates, can contribute to earning LEEDTM points. Pervious
pavements allow stormwater to flow into the soil as opposed to flowing over impervious surfaces
picking up accumulated contaminants and carrying them offsite. Once an impervious pavement
is replaced with a pervious pavement, stormwater is allowed to reach the soil surface where
natural processes are able to break down the pollutants (Cahill, et al., 2003). According to
Brattebo and Booth (2003), infiltrated water from pervious pavement had significantly lower
levels of zinc, copper, motor oil, lead, and diesel fuel when compared to runoff from an
impervious asphaltic pavement.
Notwithstanding the past developments and experiences, there still exists some
uncertainty with regard to the infiltration rates with time, the quality of the water that infiltrates,
and its strength that has raised some questions about their use as a stormwater management
alternative for conventional pavements. An essential aspect of this research involved
investigating the infiltration rates, rejuvenation techniques, sustainable storage of the
components and complete systems, water quality, and the strength properties of these pavements.
Infiltration rate measurements are conducted using an Embedded Ring Infiltrometer Kit (ERIK),
a device developed at the Stormwater Management Academy (Chopra et al, 2010). Storage of
water in each material as well as the entire systems is measured in the laboratory and is based on
Archimedes’s principles of water displacement. Water quality analysis was completed using
laboratory scale systems built in 55 gallon drums that simulated the full scale systems in the
field. Strength analysis includes field investigations which include pavement evaluation by
means of the FDOT Falling Weight Deflectometer (FWD) equipment.
The primary goals for this research are as follows:

11
1. Evaluate long term infiltration rates and the reduction in these rates due to sediment
clogging and effectiveness of rejuvenation using vacuum sweeping.
2. Determine sustainable storage values of the aggregates and surface layer components
of the system as well as the entire system storage values.
3. Evaluate the quality of water infiltrating through the system, specifically nutrients.
4. Determine parameters that represent strength performance of the rigid pavement
systems.
The following sections describe the installation of the three full scale pavement sections,
laboratory experiments, and a discussion of the results obtained from the study.
Pervious pavement systems offer designers and planners an effective tool for managing
stormwater. These systems manage stormwater by increasing the rate and volume of stormwater
infiltration and thus reduce the volume of runoff. By reducing runoff from pavement surfaces, a
reduction in the mass of pollutants carried downstream by runoff water can be achieved thus
minimizing non-point source pollution.
The pervious concrete system is designed to have enhanced pore sizes in the surface layer
compared to conventional pavement types, encouraging flow of water through the material.
Porous materials exhibit a filter function that is inversely related to the permeability function
regarding sediment capture and water flow rate through the material. Once sediments are present
on the surface they will tend to either become trapped near the surface or flow freely through the
entire system. The advantage to sediments being trapped near the surface is the ease of
removing these sediments with a vacuum force and also the protection of the sub-base layers
suffering from a reduction of storage when the pores become filled with sediments. The

12
disadvantage is that clogging (or reduced infiltration rate) right at the surface may prevent
stormwater from entering the system before it becomes runoff and the storage below is un-used.
The performance of pervious pavement systems is dependent on the degree of clogging of the
opening and pore spaces by fugitive sediments and debris that get deposited onto the surface by
both natural and human erosion. These sediments then get compacted into the pore throats near
the surface by vehicles further reducing the rate of infiltration. The rate at which a pervious
pavement system will infiltrate stormwater throughout its service life will change based on
periodic sediment accumulation on the surface and maintenance performed.
This report investigates the changes in infiltration rates due to high levels of sediment
accumulation throughout the entire cross section and the rejuvenation of the pavement system
using a standard vacuum sweeper truck. The infiltration testing in this study is conducted by the
use of an Embedded Ring Infiltrometer Kit (ERIK) to measure the vertical in-situ infiltration
rates of different cross sections of pervious concrete pavement systems. The new draft statewide
stormwater rule in Florida suggests that the minimum vertical infiltration rate of the pervious
pavement system (pavement and sub-base layers) shall not be less than 2.0 inches per hour
indicated by an ERIK test, based on the 85% removal pervious pavement design criteria.
The ERIK infiltrometer is embedded into the entire pavement system section that is the
pavement layer, pollution control sub-base layer, and finally the parent earth below the system to
measure the vertical infiltration rate. For the purpose of the study, the pavement surfaces are
intentionally loaded with large amounts of soil types (A-3, A-2-4, and limerock fines) to simulate
a worst case scenario of long term clogging. This is done to test the effectiveness of vacuum
cleaning as a rejuvenation method for pervious pavement systems to restore its original state of
permeability or an improvement from its clogged condition. The results of this study will

13
provide designers, regulators, and contractors with an understanding of how well these pervious
pavement systems perform, as per infiltration of water, and the effectiveness of the proposed
maintenance method of vacuum truck for the restoration of the clogged pavement system in a
fully operational system.
Background
Impervious surfaces are responsible for a significant portion of the nation’s leading threat
to surface water quality, nonpoint source pollution (US EPA 1994), by producing and
transporting un-natural quantities, dynamics, and quality of stormwater runoff into receiving
water bodies. Unlike pollution generated from a single, identifiable source like a factory, the
pollutants in stormwater runoff may discharge from many points with uncontrolled amounts of
pollutants. Since the exact quantities of stormwater and pollutants in the stormwater cannot be
predicted for all discharge points from every impervious surface, it becomes difficult to treat the
runoff effectively and economically.
In the past, the principal concern about runoff from pavements has been drainage and
safety, focusing primarily on draining the water off the pavement surface as quickly and
efficiently as possible (Chester & James, 1996). Historically, many have considered that once
the stormwater was off the pavement surface and into the drainage structure the problem was
solved and the “out of sight, out of mind” mentality was implored. Unfortunately, this water
once drained from the pavements surface has to end up somewhere downstream and typically
causes negative impacts to ecosystems resulting in habitat loss. Traditional impervious
pavement is designed with sufficient cross slope and longitudinal slopes to increase the velocity
of the runoff water conveying it away from the pavement before ponding can occur. The result
14
of this increased velocity is the capacity of the stormwater to cause erosion, channel widening,
sedimentation, flooding, and spreading of pollutants downstream. Furthermore, impervious
pavements are designed with costly measures taken to prevent water from accumulating directly
under the pavements and subsequently damaging the structure. Although many pavement
designers hope that wearing courses can be kept virtually watertight with good surface seals and
high-tech joint fillers, the inevitable stresses and pressures of traffic, temperature fluctuations,
oxidation and weathering, and freeze thaw cycles are constantly working to open cracks that
allow water to enter. Once the water is in the pavement system it becomes trapped and unable to
be expelled quickly developing pore water pressures that result in piping and pumping effects
that erode away sub-soils causing serious problems to the structure. The only sure way to keep
water from accumulating in the structural section of the pavement is to drain it using a key
feature, a layer of very high permeability (33 in/hr to 333 in/hr or even greater) material under
the full width of traffic lanes which is suitable for good internal drainage of the systems to
prevent this deterioration (Cedergren, 1994). U.S. pavements or “the world’s largest bath tubs”
incurred economic losses of an estimated $15 billion/yr due to poor drainage practices, which
can reduce the service life down to 1/3 of a typical well drained pavement (Cedergren, 1994).
The larger volumes of runoff produced by impervious surfaces and the increased
efficiency of water conveyance through pipes, gutters, and other artificially straightened
channels, results in increased severity of flooding in areas adjacent and downstream of
pavements. It was reported by Chester (1996) that this shift away from infiltration reduces
groundwater recharge, causes fluctuations in the natural GWT levels that could threaten water
supplies and reduces the groundwater contribution to stream flow which can result in intermittent
or dry stream beds during low flow periods. When runoff bypasses the natural filtering process

15
provided by soils, access to critical ecosystem service is lost and additionally valuable land is not
sacrificed to a single-use.
Pervious pavement systems can also function as parking areas in addition to on-site
stormwater control (Dreelin, Fowler, & Roland, 2003). Smith (2005) compares permeable
interlocking concrete pavements to infiltration trenches, which have been in use for decades as a
means to reduce stormwater runoff volume and pollution, recharge groundwater, and at the same
time be used to support pedestrian and vehicular traffic. Research conducted on permeable
pavement systems by Scholz and Grobowiecki (2006) shows that the structure itself can be used
as an “effective in-situ aerobic bioreactor,” and function as “pollution sinks” because of their
inherent particle retention capacity during filtration due to its high porosity. Most all of the
pervious pavement systems share similar applications and all have several advantages over
traditional impervious pavement systems. To mention a few, pervious/permeable pavement
systems reduce overall runoff, level of pollution contained in runoff, ponding/hydroplaning, tire
spray, glare at night, tire noise, skidding from loss of traction, velocity and temperature of runoff,
erosion, and sedimentation (Tennis et. al, 2004). The enhanced interconnected porosity allows
for good infiltration and geothermal properties that help in attenuation of pollutants.
Additionally due to the porous nature of the pervious pavement systems trees are allowed the
necessary air and water exchange allowing roots to grow naturally instead of uprooting in search
of air and water, causing damage to nearby pavements. More trees in parking lots can benefit
owners by providing aesthetics to their property while effectively reducing the heat island effect
associated with impervious pavements. Trees and plants serve as our natural solar pumps and
cooling systems by using the sun’s energy to pump water back to the atmosphere resulting in
evaporative cooling. The pervious pavement systems allow water to evaporate naturally from

16
the systems similar to natural soils also providing a cooling effect which can even prevent tire
blowouts caused by high temperatures.
The stone reservoir/sub-base of the pervious pavement system is designed to store
rainwater and allow it to percolate into sub-soils restoring the natural ground water table levels.
It is important to allow the natural hydrological cycle to remain in balance to efficiently move
water from surface water, groundwater, and vegetation to the atmosphere and back to the earth in
the form of precipitation. Alteration of this cycle, such as a decrease in infiltration, can cause
unwanted impacts resulting in quantity and quality of water that may not be sufficient to provide
for all intended economical uses. Structures should be able to be designed to control water
related events at a risk that is acceptable to the people of an area and within budget expenditures
(Wanielista et al 1997).
Even though pervious pavement systems have been around for many years there is still a
lack of needed experimental data associated with the in-situ performance over time. Barriers to
the uptake of pervious pavement systems include technical uncertainty in the long term
performance and lack of data, social perception, adoption, and maintenance (Abbot and Comino-
Mateos, 2003).
The strength of a pervious pavement system depends on compressive and flexural
properties of the material along with the strength of the supporting underlying subgrade. As a
result of its porous nature (no fines) to achieve high permeability, the compressive strength and
flexural strength are both lower when compared to conventional concrete and asphalt pavements
and these pavements are designed to carry lighter vehicular loads. This report also studies the
strength parameters for pervious concrete as a pavement material and establishes the allowable
17
traffic load and volume to provide some degree of confidence related to the strength and
durability of pervious pavements.
Literature Review
This research is intended to meet the need by practitioners and researchers to quantify the
performance of pervious/permeable pavement systems under field conditions. That is the ability
of the complete system (surface and sub-base layers) to store and infiltrate stormwater before it
becomes available for runoff. The lack of field data has been an impediment to the use of
pervious pavements as a stormwater control tool to help reduce the amount of runoff from a
pavements surface. Most of the research that has been previously completed on
pervious/permeable pavement systems has been surface infiltration monitoring which does not
give information on clogging effects that may happen below the surface layer of the pavement.
Field and laboratory studies have already been conducted on surface infiltration rates of
permeable pavements including 14 PICP (permeable interlocking concrete pavement) sites where
Bean in 2004 reported median infiltration rates of 31.5 in/hr and 787.4 in/hr when the sites were
in close proximity to disturbed soil areas and sites free from loose fines respectively (Bean et al,
2007). Another study by Illgen et al. (2007) reported infiltration rates of a PICP car park site in
Lingen, Germany at 8.0, 11.0, and 18.3 in/hr initially and final rates ranging between 5.4 and
11.2 in/hr. It was noted by Illgen et al. (2007) that clogging effects due to fine material
accumulating in the slots or voids greatly influence the infiltration capacity and can cause a
point-wise decrease of the infiltration rate by a factor of 10 or even 100 compared to newly
constructed pavements. An embedded ring device developed to monitor influences of sub-layer
clogging does reveal sub-layer clogging. Pavement system clogging potential can be tested

18
before and after multiple vacuum sweep attempts. This provides insight into the restoration of
these systems over time and at a particular site given its parent soil conditions.
The infiltration rates are measured using the constant head permeability methodology by
adding water to the surface of the pavement inside the extended embedded ring and keeping
track of how much water is added over a period of time while maintaining a constant head level.
This method is similar to a laboratory constant head permeability test except for the volume of
water is measured upstream of the sample instead of downstream because the nature of the field
test which allows water to percolate into the ground where it cannot be collected for
measurement. By embedding the ring into the pavement system at a certain depth, the ring
prevents water from flowing laterally in a highly permeable layer and instead directs the water
vertically downward through any layer of interest. This vertical flow path is more similar to how
water will behave in a real rain event in which water is prevented from flowing laterally by other
rainwater flowing adjacent to any one spot in the pavement system.
Infiltration Rate
The infiltration rate is the velocity of water entering a soil column, usually measured by
the depth of water layer that enters the soil over a time period. Infiltration is a function of the
soil texture (particle size distribution) and structure (particle arrangement). The infiltration rate
is not directly related to the hydraulic conductivity of a media unless the hydraulic boundary
conditions are known, such as hydraulic gradient and the extent of lateral flow (Brouwer, et al.,
1988). The infiltration rate is influenced by the soil layers, surface conditions, degree of
saturation, chemical and physical nature of soil and liquid, and pressure head and temperature of
the liquid (ASTM D3385, 2009). It should be noted that filters or porous materials through
which a liquid or gas is passed to separate fluid from particulates have both a particle retention
19
and a permeability function (Reddi, 2003). The infiltration rate is relevant to the studies on
leaching and drainage efficiencies, irrigation requirements, water seepage and recharge, and
several other applications.
Laboratory Infiltration Methods
Laboratory infiltration testing has been done using rainfall simulators for water supply,
computerized falling/constant head permeameters (some with high precision pressure transducers
and data acquisition systems), and flume or hopper systems with sprinkling units and tipping
gauges for measurement of infiltration of pervious/permeable pavements (Anderson, 1999; Illgen
et al., 2007; Montes, 2006; Valavala, et al., 2006). Many of the laboratory tests are classified as
destructive tests since either slabs or cores were cut and extracted from existing field pavement
sites. The process of cutting pavements may introduce fines into the samples and washing
samples may do the opposite and remove some of the existing clogging sediments found on the
pavements in an in-situ condition. It was reported that even though all the samples coming from
a particular placement were taken from the same slab, different porosities and hydraulic
conductivities within a slab were important and suggested that one sample will not suffice to
identify parameters (Montes, 2006). Two core samples taken from another site apparently had
no connecting pore channels through the 4 inch diameter core sample, which resulted in no flow
through. Other samples taken from the same slab had measured values of 19.8 – 35.4 in/hr. The
highest hydraulic conductivity values obtained from the tests were reported outside the range of
common expected values for pervious concrete, but were in the vicinity of the highest laboratory
measurements reported by Tennis et al. (2004). The higher values reported for the pervious
concrete samples were around 1,866 in/hr (Montes, 2006).
20
Field Infiltration Methods
Exfiltration field studies have been completed on infiltration monitoring of
pervious/permeable pavement systems by measuring the exfiltration of the systems. Previous
studies investigated pervious/permeable pavements under natural rainfall conditions and
measured exfiltration, runoff, water depths in pavements systems, and/or precipitation in order to
determine infiltration rates through the systems (Abbot and Comino-Mateos, 2003; Brattebo,
2003; Dreelin et. al, 2003; Schlüter, 2002; Tyner et. al, 2009). Methods used to measure these
parameters consisted of using perforated pipes located in the sub-base draining water into tipping
bucket gauges for monitoring of ex-filtrated water. In one of the studies, infiltration tests were
carried out using a falling head method from an initial head of about 33 inches to a final height
of about 8 inches above the pavements surface (Abbot and Comino-Mateos, 2003). It was noted
in the report that the measured rates (some as high as 15,287 in/hr) do not represent actual rates
which were achieved during actual rainfall events with a column of water applied at such a
significant head.
Other researchers used several methods for determining infiltration such as the bore-hole
percolation test method, a strategy of completely filling plots with water from an irrigation hose
and measuring the water depths in monitor wells, and finally the use of a double ring infiltration
test mentioned below (Tyner et al, 2009). In this study, different exfiltration methods underneath
the pavement systems were investigated to encourage higher exfiltration rates on a compacted
clayey soil in eastern Tennessee. They found the performance of trenches filled with stone
exfiltrating at 0.43 in/hr to be the highest, followed by ripping with a subsoiler exfiltrating at
about 0.14 in/hr, then boreholes filled with sand at about 0.075 in/hr.
21
Double-‐Ring Infiltrometer
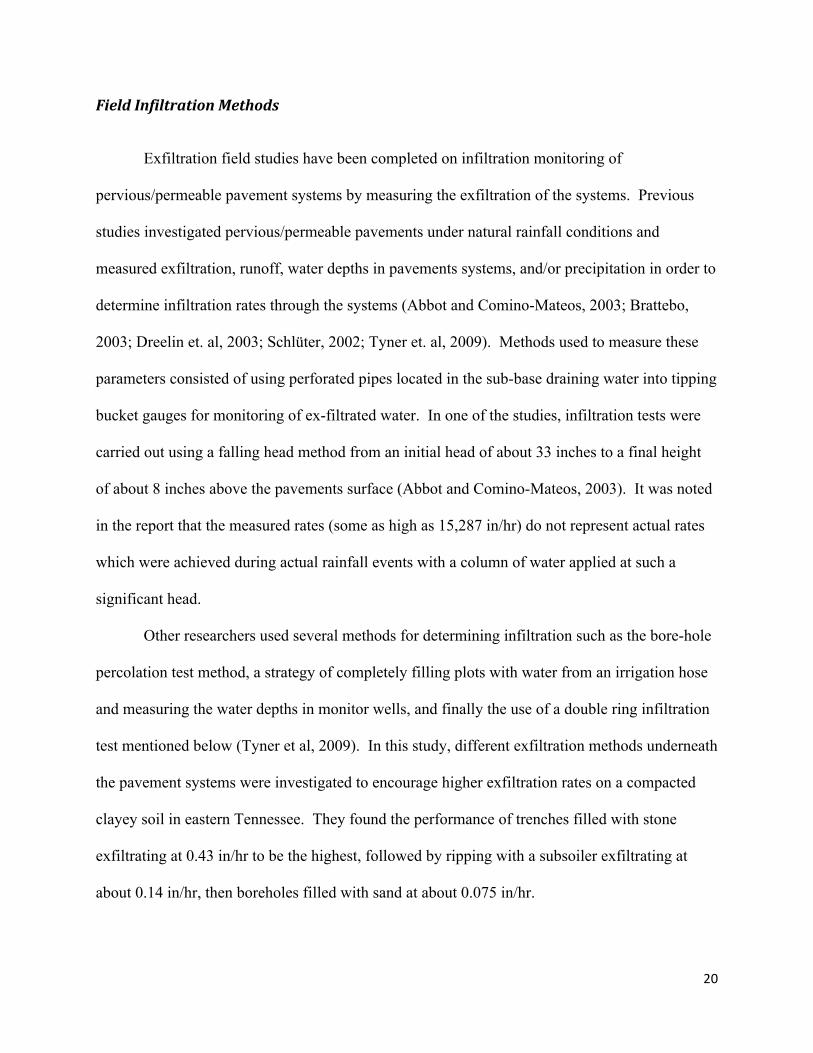
The double-ring infiltrometer test (DRIT) measures the infiltration rate of soils, in which
the outer ring promotes one-dimensional, vertical flow beneath the inner ring. Results from the
DRIT are influenced by the diameter and depth of the ring embedment and the pavement
properties as tests at the same site are not likely to give identical results. The results are
recommended primarily for comparative use (ASTM D3385, 2009). The testing procedure is as
described by the ASTM standard test method for infiltration rate of soils in the field using a
double-ring infiltrometer. A typical double-ring infiltrometer set-up for field testing is shown in
Figure 1 (Brouwer et. al. 1988).
(Courtesy: Brouwer, et al. 1988)
Figure 1: Double Ring Infiltrometer used for measuring infiltration into soils
The limitation of using the DRIT on pervious systems is that the rings cannot be driven
into the pavement surfaces unlike a soil or vegetative surface. In addition, typically soils or
vegetative surfaces that would be tested using the DRIT would exhibit a more homogeneous and
isotropic strata than a pervious pavement system with layers of significantly different sized
22
aggregates. Therefore, due to lateral migration of water in the more permeable layers, the test
cannot measure the true vertical (one dimensional) infiltration rate of the entire pervious
pavement system that is made up of several sub-base layers with varying permeability. This is
why the second outer ring is needed when conducting a DRIT, to provide an outer ring of water
that creates a curtain of water around the inner “measured” ring and preventing the inner ring
water from migrating laterally during the test. It is incorporated to mimic an actual rain event in
which there would be the same curtain of water surrounding any one spot on the pavement. In
some of the past experiments using DRIT, Bean et. al. (2007) reported instances of water back
up and upward flow, out of the surface near the outside of the outer ring, due to lower
permeability of the underlying layer.
More limitations encountered when using the surface infiltration rate tests on highly
permeable surfaces is the difficulty in maintaining a constant head or steady state flow through
the system during the test, the large amount of water required to run a test, and the need to
transport this water to remote locations. According to Bean et. al. (2007) many of the permeable
pavement sites had surface infiltration rates that were greater than the filling rate for the DRIT.
Single Ring Infiltration Test
A modified version of the double-ring infiltrometer is the Single Ring Infiltration Test
(SRIT) which uses only a single ring to perform a surface inundation test. It was mentioned that
there was difficulty in not only transporting the required amount of water to remote sites to run
the DRIT or SRIT, but difficulty was also encountered when filling the inner ring with water at a
faster rate to maintain a constant head above the surface (Bean et. al. 2007).
The Surface Inundation Test procedure involved recording the time that water started
pouring into the single ring from a five gallon bucket until the water in the ring was emptied.
23
The force of five gallons of water immediately poured on the surface of a clogged pavement may
also cause some un-natural dislodging or unclogging of the sediments that are trapped in the
surface pores. Plumbers putty was applied to the bottom of the ring and in any joints between
pavers to prevent leakage. It was noticed that during tests on Permeable Interlocking Concrete
Pavers (PICP) and pervious concrete (PC) that the water actually flowed horizontally under the
ring bottom and then percolated vertically upward through the pavement surface outside of the
single ring, which in turn over predicted the actual surface rates. However, DRIT or SRIT
provides a method for quantifying the surface infiltration rates of pervious pavements and may
serve as a surrogate for the pavement’s surface hydraulic conductivity (Bean et. al. 2007).
Destructive Test Methods
Other test methods include extracting cores of the pavement layers and analyzing the
samples in a laboratory. This is a destructive method that may change the pore structures of the
flexible pavements and clog pores with dust generated during the coring process. This test
method is limited by the inability to repeat at the exact same location on the pavement and
compare to tests conducted at different times of sediment clogging that is encountered in the
field.
Laboratory Permeability Methods
Most laboratory methods use constant or falling head permeameters that may be equipped
with rigid walls (metal, glass, acrylic, PVC, etc.) for coarse grained soils/aggregates and flexible
walls (rubber) to prevent sidewall leakage for fine grained samples. Associated sidewall leakage
from rigid walled permeameters is usually negligible for sandy and silty soils with permeability
rates above 5 x 10⁻² cm/s or 70.9 in/hr (Reddi, 2003). These existing permeameters can be
24
computerized and equipped with high precision pressure transducers and data acquisition
systems. The three types of permeability tests include: constant (gradient controlled), variable
(gradient controlled), and constant flow rate (flow controlled pump at a constant rate) which uses
a programmable pump with differential pressure transducers
Field Permeability Methods
Investigations on field measurements of infiltration rates of pervious/permeable
pavement systems include test methods requiring sealing of the sub-base and installing
perforated pipes that drain infiltrate to a collection point or other ex-filtration collection methods.
Research has been conducted using a setup containing a sealed sub-base with eight 6-inch
perforated pipes used to drain the area from 16 flow events recorded with a v-notch weir and
Montec flow logger (Schlüter, 2002). Others have monitored field scale infiltration rates by
measuring runoff, precipitation, and infiltration using a tipping bucket gauge. Similar methods
for determining field permeability rates of in-situ soils include:
1. Pump test (by pumping water out of a well and measuring GWT drawdown after
pumping),
2. Borehole test (using GWT measurements and variable head tests using piezometers or
observation wells).
For cases where soil types vary in the domain, the permeability value obtained using the
Pump test equations only reflect an effective and averaged value. Both natural and engineered
soils are known to exhibit spatial variability in permeability. In natural soils, variability comes
from the fact that soil strata/layers were subjected to the different compression forces during
formation. In engineered soils and pervious/permeable pavement systems layered placement and
25
compaction are subjected to these compression forces resulting in generally horizontal
permeability being greater because of larger vertical compression forces (Reddi 2003).
Embedded Ring Infiltrometer Kit
In order to effectively measure the in-situ performance of the pervious system infiltration
capacity over time, an in-place monitoring device named Embedded Ring Infiltrometer Kit
(ERIK) was developed at University of Central Florida (UCF), Orlando. It is similar to the
existing (ASTM D3385, 2009) test for infiltration measurement of soil/vegetated surfaces using
a Double Ring Infiltrometer Test (DRIT). The ERIK device was designed to overcome any
difficulties in obtaining infiltration measurements of the pervious system using an efficient,
accurate, repeatable, nondestructive, and economical approach. The relatively cheap, simple to
install and easy to use device, has no computer, electrical, or moving parts that may malfunction
during a test. The kit includes two essential components: one “embedded ring” that is installed
into the pavement system during time of construction and the other a monitoring cylinder
reservoir for flow rate measurement purposes used during testing.
The embedded ring is entrenched at predetermined depths into the pavement system to
enable measurement of infiltration rates of different layers of the system. There are two types of
the ERIK device embedded ring namely, short-ring and long-ring ERIK. The short-ring ERIK is
extended to the bottom of the pavement layer to measure the infiltration rate of the pavement
only. On the other hand, the long-ring extends down to the bottom of the sub-base layer or even
deeper into the parent earth underneath the system to monitor the entire pervious system giving
the parent earth soil conditions. The embedded ring is a pipe made of a hard-wearing synthetic
resin made by polymerizing vinyl chloride (PVC) which extends through the pavement layer
under consideration. This prevents the lateral migration of water which causes false
26
measurements. The true vertical (one dimensional) steady state infiltration rate can be measured
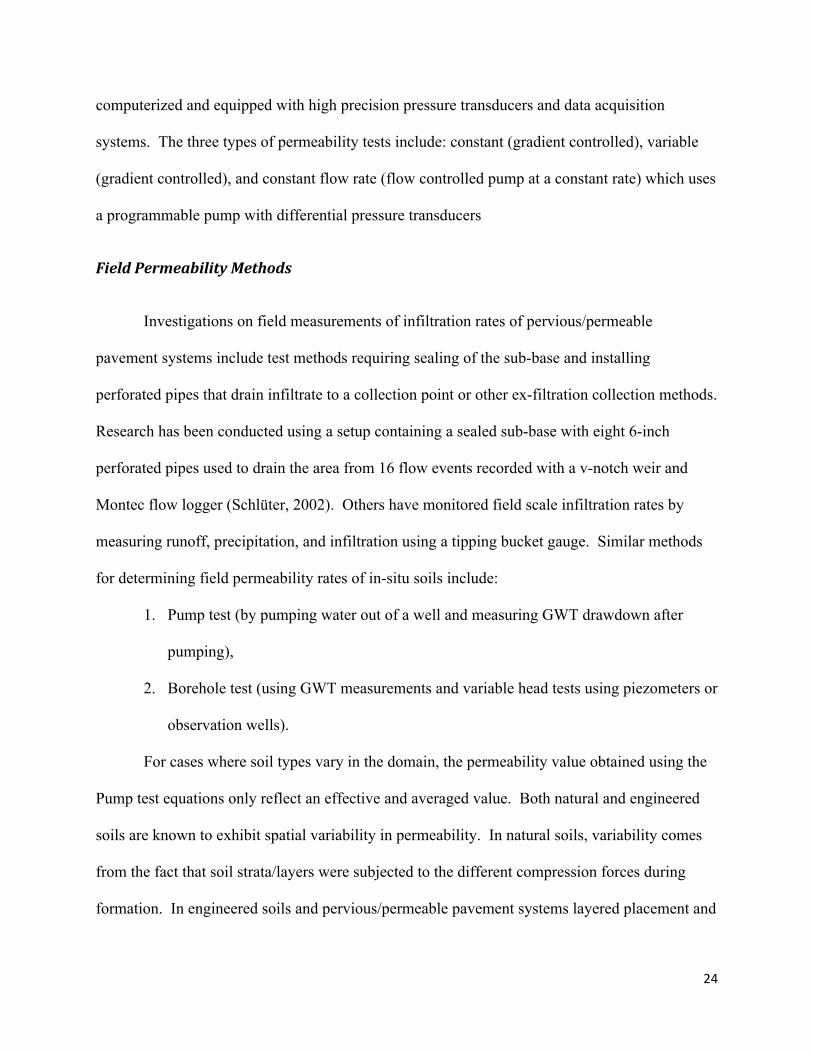
using the ERIK. Figure 2 below, presents the plan and section views of the ERIK embedded ring
as installed in a permeable pavement system while not conducting a test.
Figure 2: ERIK monitoring tube
The top of the embedded ring is installed flush with the pavement’s surface for ease of
pavement construction and to prevent any tripping hazard during the use of the pavement. In
large surface areas of pavement, the embedded ring may function as a grade stake set at an
elevation consistent with the final elevation of the pavement surface. The embedded ring allows
for screeds, floats, trowels, or any other placing and finishing tools to perform normally and
PARENT EARTH SOIL
SU B-BASE LAYER(S)
PAVEMEN T LAYER(S)
1.5 "1.5 "3.0 "
2 " - 12 "
0 " - 24 "
4.0 "
ELEVATION VIEW
PLAN VIEW
6" ID PVC COUPLING FITTING(SCHED 80)
INSTALLATION INSERT COLLAR
PAVEMENT SURFACE LAYER
INSTALLATIO N INSERT CO LLAR
PERM ANENT INSERT COLLAR6 " PVC COUPLING FITTING (SCHED 80)
6 " ID PVC P IPE (SCHED 80)
F ILTER F ABRIC(NON-WOVEN)
0.3 "
6.0 "6.85"7.53"
STORMWATER MANAGEMENT ACADEMY
UNIVERSITY OF CENTRAL FLORIDA
DESIG NED BY:
DRAWN BY:
CHECKED BY:
PAGE
3 OF 4
DATE:
ERIK STUART, E.I.
DR. MARTY WANIELISTA, P.E.
ERIK STUART, E.I.
01-26-10NOTESDRAWINGS NOT TO SCALE.
DR. MANOJ CHOPRA, P.E.

27
again may even improve their workability. In addition, the ring does not extend above the
pavement surface; neither does it interfere with the natural conditions that impact pavement
surfaces such as: sediments from wind and water erosions that may accumulate on or penetrate
into the system, and sediments from automobile tracks driven into the surface pores of the
pavement inside the ring.
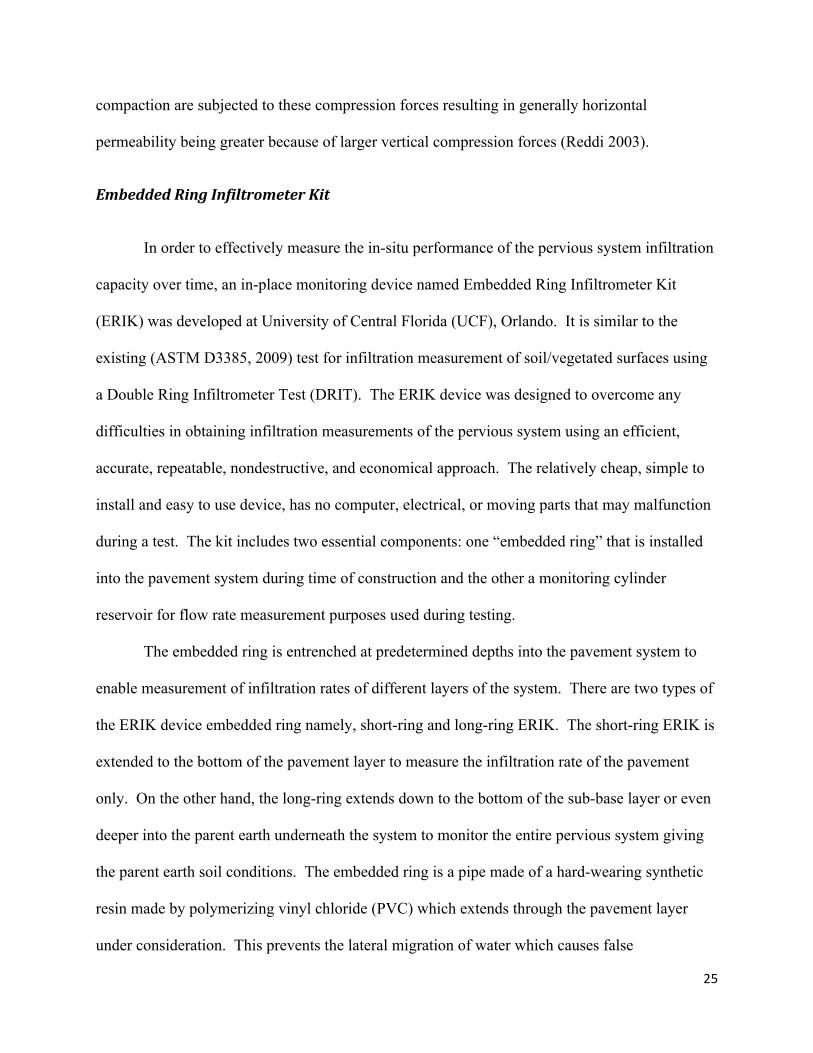
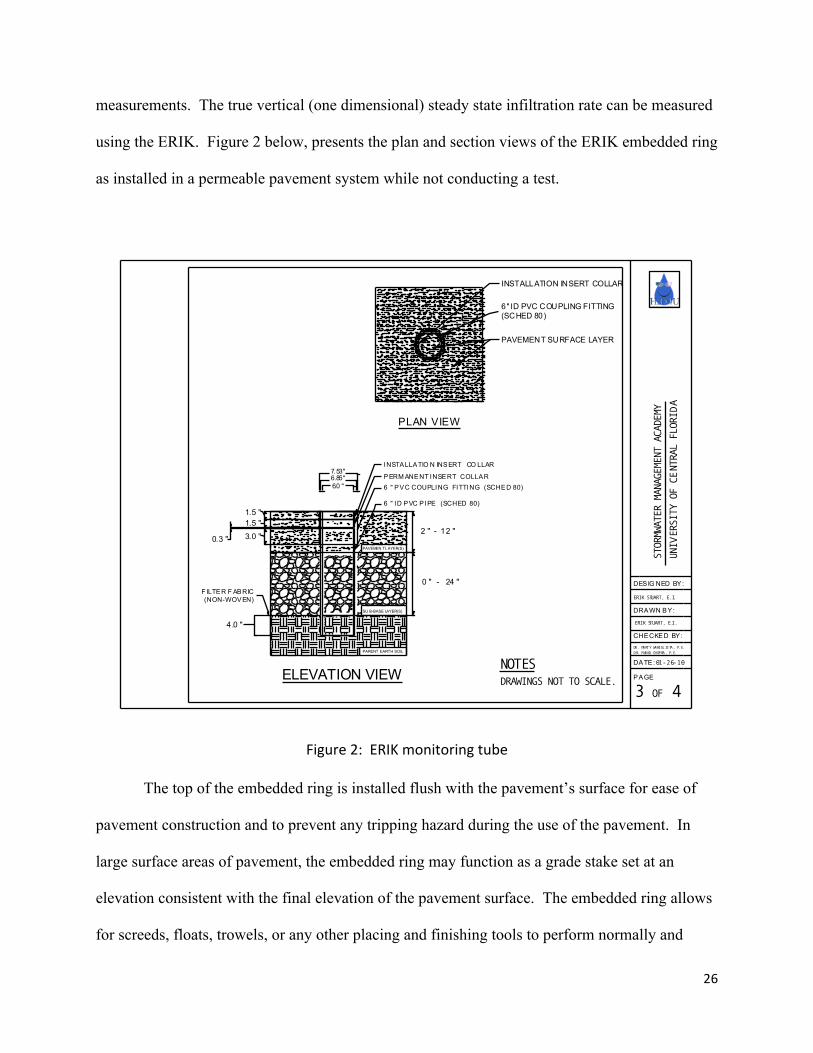
However, when conducting an infiltration test with the ERIK, a temporary “constant head
test collar” is inserted into the top of the embedded ring, extending above the surface to a desired
constant head height and is removed whenever a test is completed, illustrated in Figure 3 below.
This height is determined based on the height of curbing around the pavement that is capable to
provide a certain head of water above the pavement surface during a flood event or minimal head
of one or two inches, for a worst case scenario. This study tested with one or two inches of head
to be conservative and since the curbing used was flush with the pavement surface.
28
Figure 3: ERIK embedded ring installed
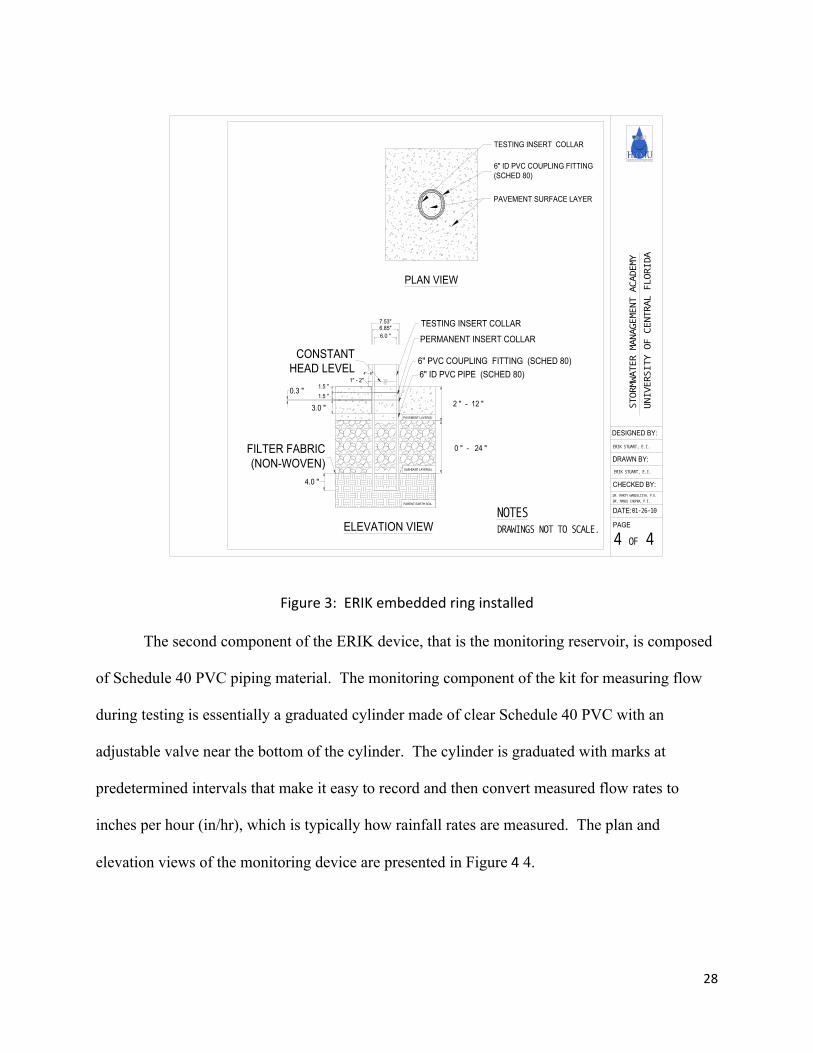
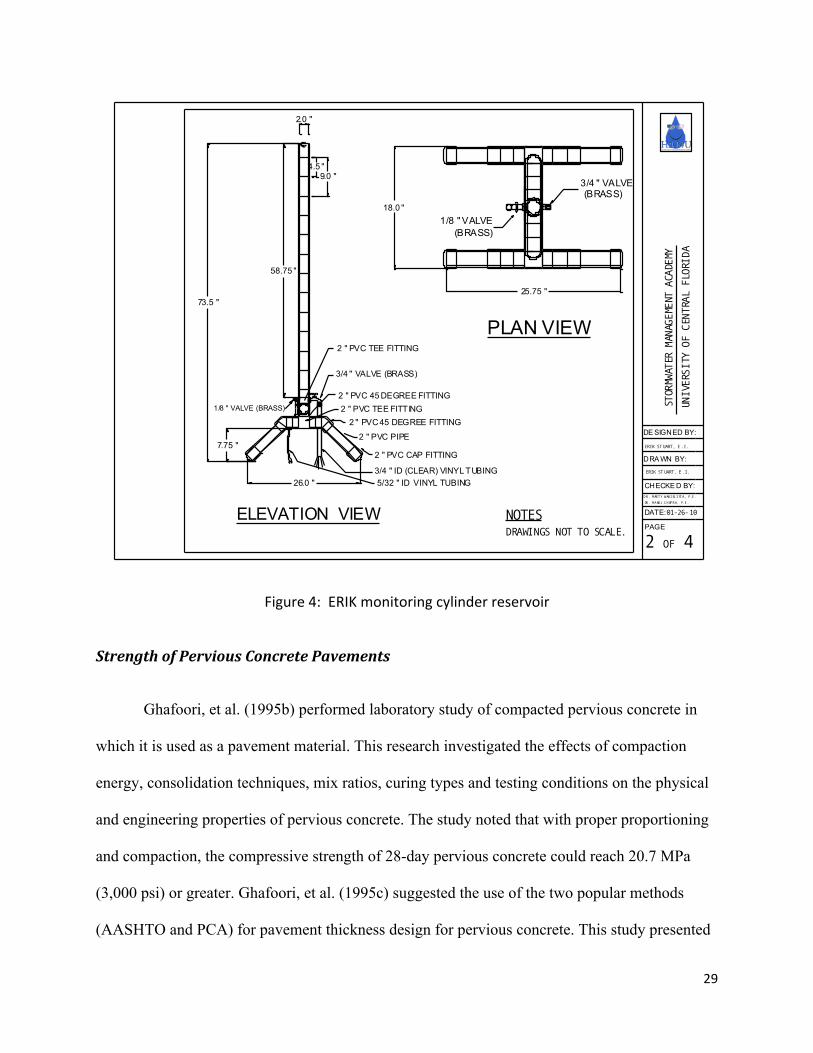
The second component of the ERIK device, that is the monitoring reservoir, is composed
of Schedule 40 PVC piping material. The monitoring component of the kit for measuring flow
during testing is essentially a graduated cylinder made of clear Schedule 40 PVC with an
adjustable valve near the bottom of the cylinder. The cylinder is graduated with marks at
predetermined intervals that make it easy to record and then convert measured flow rates to
inches per hour (in/hr), which is typically how rainfall rates are measured. The plan and
elevation views of the monitoring device are presented in Figure 4 4.
PARENT EARTH SOIL
SUB-BASE LAYER(S)
PAVEMENT LAYER(S)
4" - 6"
1" - 2"
6.0 "6.85"7.53"
ELEVATION VIEW
TESTING INSERT COLLAR
PERMANENT INSERT COLLAR
6" PVC COUPLING FITTING (SCHED 80)6" ID PVC PIPE (SCHED 80)
FILTER FABRIC (NON-WOVEN)
CONSTANTHEAD LEVEL
2 " - 12 "
0 " - 24 "
1.5 "1.5 "
3.0 "
4.0 "
0.3 "
STORMWATER MANAGEMENT ACADEMY
UNIVERSITY OF CENTRAL FLORIDA
DESIGNED BY:
DRAWN BY:
CHECKED BY:
PAGE
4 OF 4
DATE:
ERIK STUART, E.I.
DR. MARTY WANIELISTA, P.E.
ERIK STUART, E.I.
01-26-10NOTESDRAWINGS NOT TO SCALE.
DR. MANOJ CHOPRA, P.E.
PLAN VIEW
6" ID PVC COUPLING FITTING(SCHED 80)
TESTING INSERT COLLAR
PAVEMENT SURFACE LAYER
29
Figure 4: ERIK monitoring cylinder reservoir
Strength of Pervious Concrete Pavements
Ghafoori, et al. (1995b) performed laboratory study of compacted pervious concrete in
which it is used as a pavement material. This research investigated the effects of compaction
energy, consolidation techniques, mix ratios, curing types and testing conditions on the physical
and engineering properties of pervious concrete. The study noted that with proper proportioning
and compaction, the compressive strength of 28-day pervious concrete could reach 20.7 MPa
(3,000 psi) or greater. Ghafoori, et al. (1995c) suggested the use of the two popular methods
(AASHTO and PCA) for pavement thickness design for pervious concrete. This study presented
26.0 "
7.75 "
73.5 "
58.75 "
2.0 "
4.5 "9.0 "
18.0 "
25.75 "
PLAN VIEW
ELEVATION VIEW
3/4 " VALVE (BRASS)
1/8 " VALVE (BRASS)
5/32 " ID VINYL TUBING3/4 " ID (CLEAR) VINYL TUBING
3/4 " VALVE (BRASS)
1/8 " VALVE(BRASS)
2 " PVC TEE FITTING
2 " PVC 45 DEGREE FITTING2 " PVC TEE FITTING
2 " PVC 45 DEGREE FITTING
2 " PVC PIPE
2 " PVC CAP FITTING
STORMWATER MANAGEMENT ACADEMY
UNIVERSITY OF CENTRAL FLORIDA
DE SIGNED BY:
DRA WN BY:
CHECKE D BY:
PAGE
2 OF 4
DATE:
ERIK STUART, E.I.
DR. MARTY WANIELISTA, P.E.
ERIK STUART, E.I.
01-26-10NOTESDRAWINGS NOT TO SCALE.
DR. MANOJ CHOPRA, P.E.
30
the thickness requirements of pervious concrete pavements based on the engineering properties
produced in the laboratory and also different traffic conditions and subgrade characteristics.
Huang et al (2006) researched the effects of aggregate gradations on the permeability and
mechanical properties of pervious concrete. This study concluded that aggregate gradation
significantly affects the strength and permeability of pervious concrete mixtures. Rohne &
Izevbekhai (2009) performed field testing on a pervious concrete test cell at Minnesota road
testing facility. The results from this study showed that the deflection values for pervious
concrete was higher than that of conventional concrete.
Chopra, et al. (2007a) presented results of compressive strength testing of pervious
concrete cylinders. Different Aggregate – Cement (A/C) ratio and Water – Cement (W/C) ratios
were studied. Pervious concrete with different mix proportions was tested and the average
strength was found to be 1700 psi (11.7 MPa). It was noted that higher A/C ratios decreased
strength while high W/C ratios decrease porosity. Lastly, Chopra et al. (2007b) presented the
field performance assessment of a pervious concrete pavement used as a shoulder for an
Interstate rest area parking lot that was monitored over a one year period for wear and water
quality. It showed was no significant wear even when 500 axles per week loads were
experienced. In addition, the water quality through the PC system was found to be equivalent to
rainwater.
Pervious concrete pavements have some significant advantages. However, these systems
also have some limitations. The compressive strength of pervious concrete is lower as compared
to conventional concrete because of the lack of fines, pore spaces and weaker bond strength
between the aggregates. (Yang, et al., 2003). The mode of failure of these pavements is by
cracking or excessive raveling, thereby creating surface rutting and loose particles.
31
PAVEMENT INSTALLATION AND SETUP
Pervious concrete is installed covering a total area of 1500 square foot (ft2) divided into
three different sections: Rejuvenation (PCR), Bold & GoldTM (PCBG), and Fill (PCF). One
section (PCR), is designated to receive intentional sediment loading, and the other two for sub-
base material comparison under a more natural sediment loading condition. It should be noted
that PCR has the same cross section as PCBG with Bold & GoldTM pollution control media
utilized as the sub-base layer. PCBG and PCF differ by sub-base material choice intended for
comparison of the Bold & GoldTM versus using the local site A-3 soils as the sub-base material.
It is important to test the local sandy soils for use of the sub-base material to see if the cost
savings could be justified by its performance.
All three sections are designed with six inches of pervious concrete as the surface layer,
and ten inches of sub-base layer creating a sixteen inch total depth of sections. Installation of the
sections is completed by first excavating the sixteen inches, form and pour concrete perimeter
and partitioning curbing, place filter fabric to separate parent earth from bottom of sub-base,
placing and compacting sub-base materials ten inches thick, and finally placing the pervious
concrete layer over the sub-base. The pervious concrete is cured by covering the surface with
plastic sheeting for one week after placement. Pervious pavements are designed to have a level
surface, which is intended to eliminate cross slope on a typical impervious pavement or slab.
Layout
Installation of the PC sections starts with a site survey and layout of the proposed section
dimensions and elevations. Grade stakes are driven into the ground around the perimeter of the
sections to indicate the pavement top surface. The site was prepared by the excavation of a 16-
32
inch deep section (total depth of the cross sections) and compacted using a walk behind vibratory
plate compactor to a level surface.
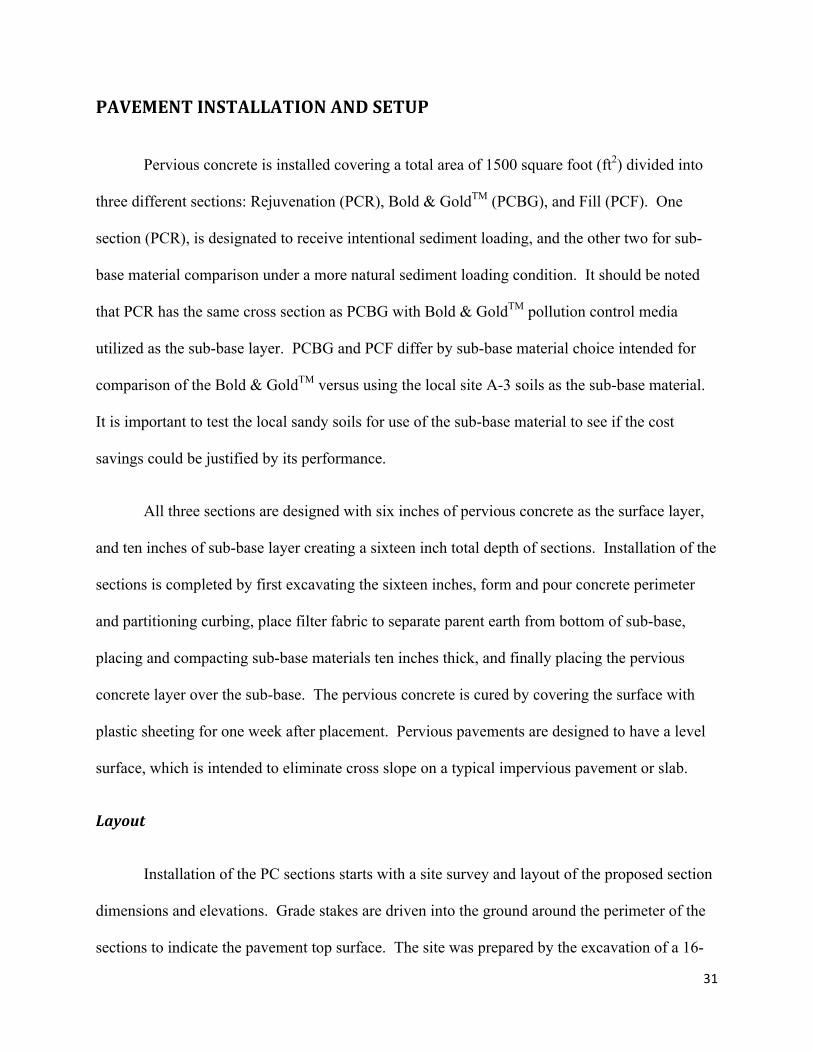
Curb Installation
Once the parent earth soils are prepared, a more detailed layout of the impervious
concrete curbing is completed using stakes and string lines to delineate form board placement
and eventually the edge of the curbs (see Figure 5 below).
Figure 5: Curbing formwork and concrete pour
Since it was expected to receive heavy vehicular loading from concrete trucks, semi-
trucks, and heavy construction vehicles, reinforcing bars were placed near the middle of the six
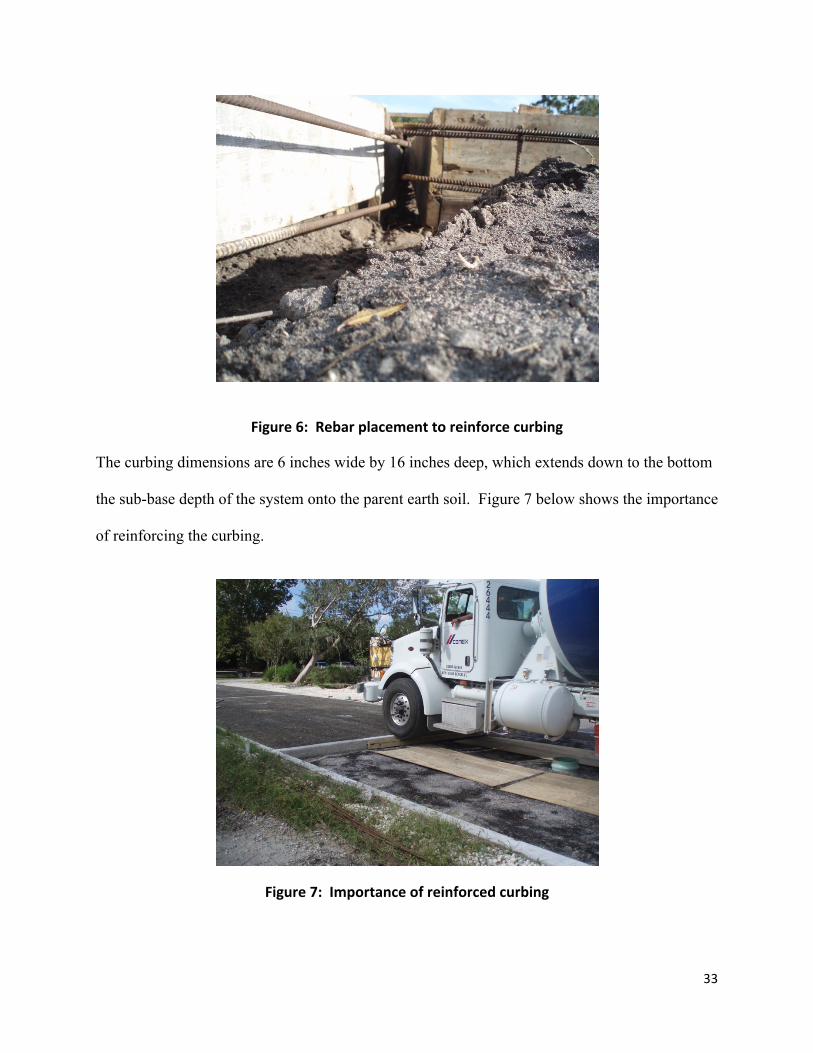
inch wide curbing, with one bar near the top and one near the bottom shown in Figure 6 below.
33
Figure 6: Rebar placement to reinforce curbing
The curbing dimensions are 6 inches wide by 16 inches deep, which extends down to the bottom
the sub-base depth of the system onto the parent earth soil. Figure 7 below shows the importance
of reinforcing the curbing.
Figure 7: Importance of reinforced curbing
34
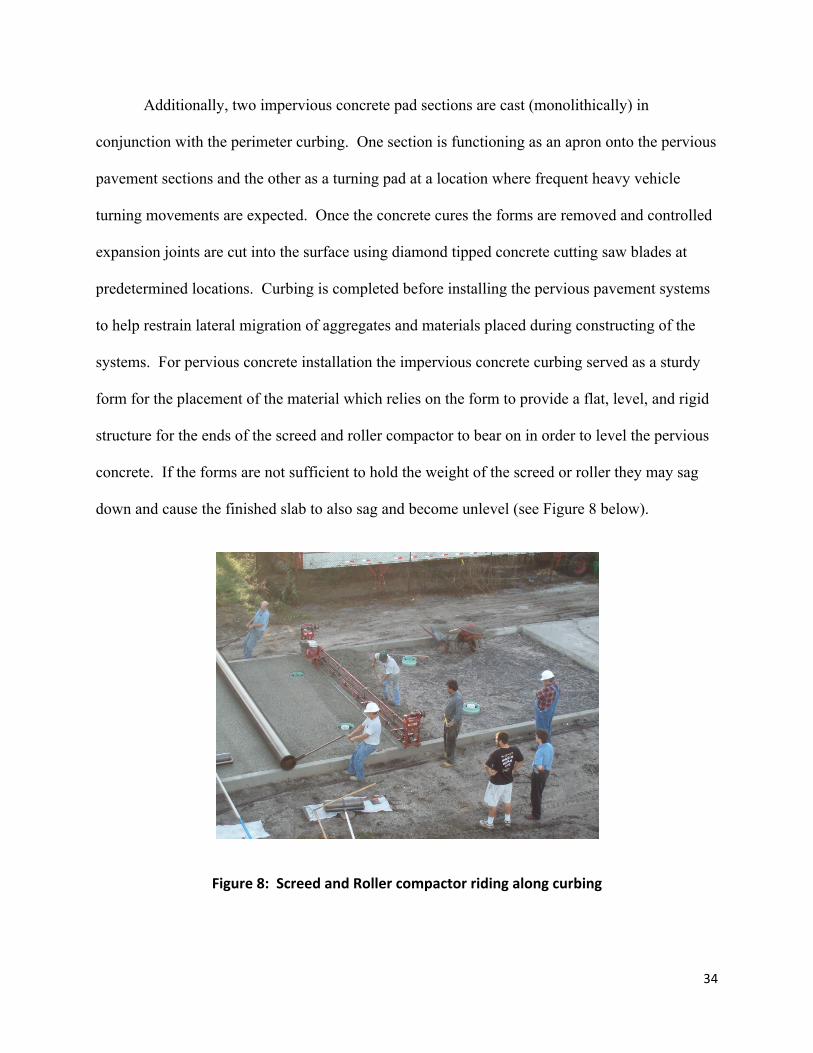
Additionally, two impervious concrete pad sections are cast (monolithically) in
conjunction with the perimeter curbing. One section is functioning as an apron onto the pervious
pavement sections and the other as a turning pad at a location where frequent heavy vehicle
turning movements are expected. Once the concrete cures the forms are removed and controlled
expansion joints are cut into the surface using diamond tipped concrete cutting saw blades at
predetermined locations. Curbing is completed before installing the pervious pavement systems
to help restrain lateral migration of aggregates and materials placed during constructing of the
systems. For pervious concrete installation the impervious concrete curbing served as a sturdy
form for the placement of the material which relies on the form to provide a flat, level, and rigid
structure for the ends of the screed and roller compactor to bear on in order to level the pervious
concrete. If the forms are not sufficient to hold the weight of the screed or roller they may sag
down and cause the finished slab to also sag and become unlevel (see Figure 8 below).
Figure 8: Screed and Roller compactor riding along curbing
35
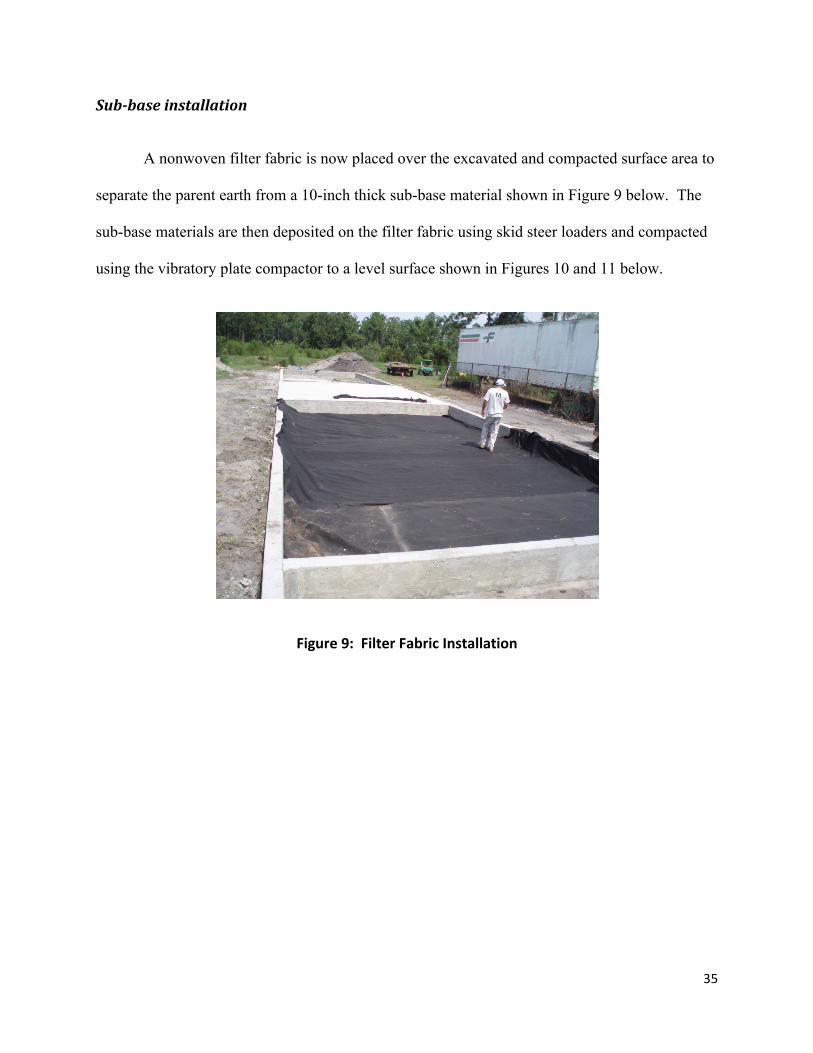
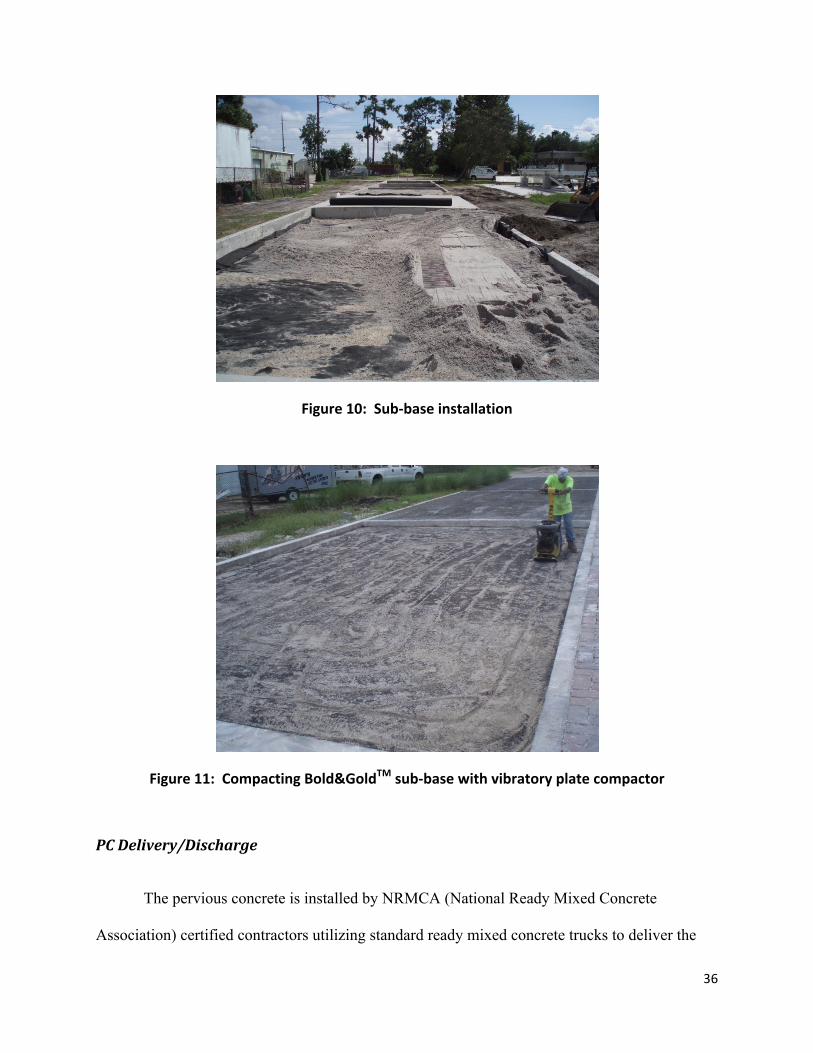
Sub-‐base installation
A nonwoven filter fabric is now placed over the excavated and compacted surface area to
separate the parent earth from a 10-inch thick sub-base material shown in Figure 9 below. The
sub-base materials are then deposited on the filter fabric using skid steer loaders and compacted
using the vibratory plate compactor to a level surface shown in Figures 10 and 11 below.
Figure 9: Filter Fabric Installation
36
Figure 10: Sub-‐base installation
Figure 11: Compacting Bold&GoldTM sub-‐base with vibratory plate compactor
PC Delivery/Discharge
The pervious concrete is installed by NRMCA (National Ready Mixed Concrete
Association) certified contractors utilizing standard ready mixed concrete trucks to deliver the
37
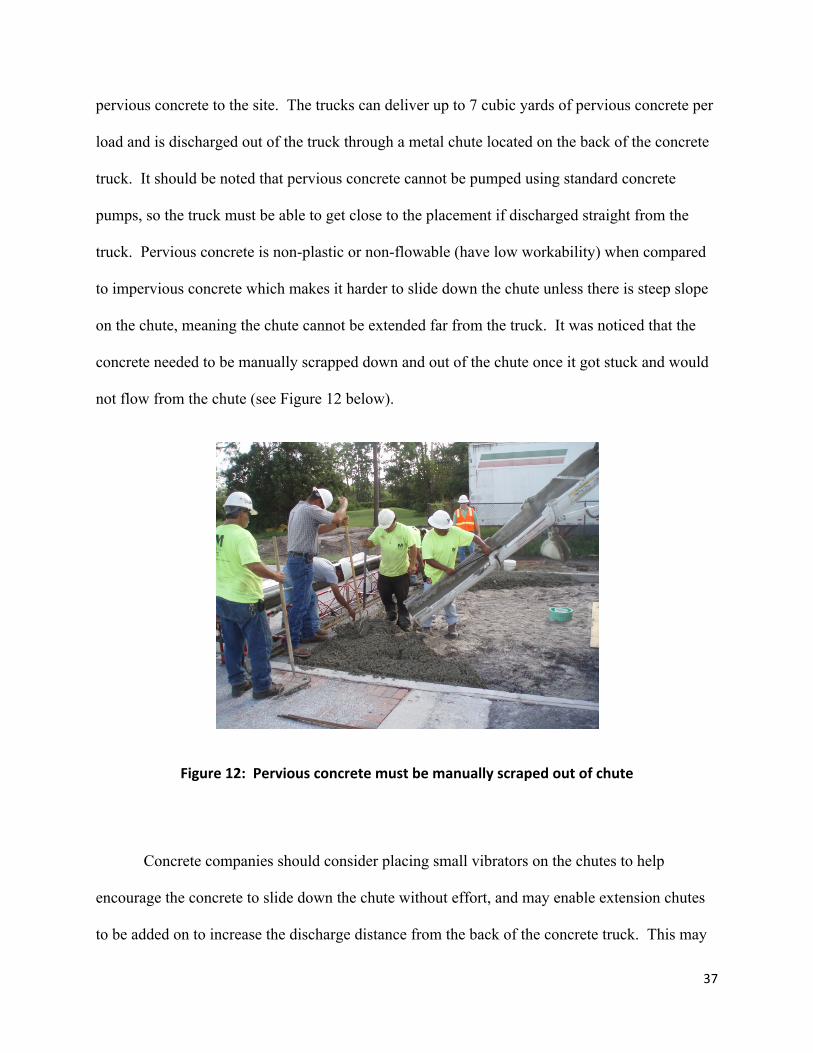
pervious concrete to the site. The trucks can deliver up to 7 cubic yards of pervious concrete per
load and is discharged out of the truck through a metal chute located on the back of the concrete
truck. It should be noted that pervious concrete cannot be pumped using standard concrete
pumps, so the truck must be able to get close to the placement if discharged straight from the
truck. Pervious concrete is non-plastic or non-flowable (have low workability) when compared
to impervious concrete which makes it harder to slide down the chute unless there is steep slope
on the chute, meaning the chute cannot be extended far from the truck. It was noticed that the
concrete needed to be manually scrapped down and out of the chute once it got stuck and would
not flow from the chute (see Figure 12 below).
Figure 12: Pervious concrete must be manually scraped out of chute
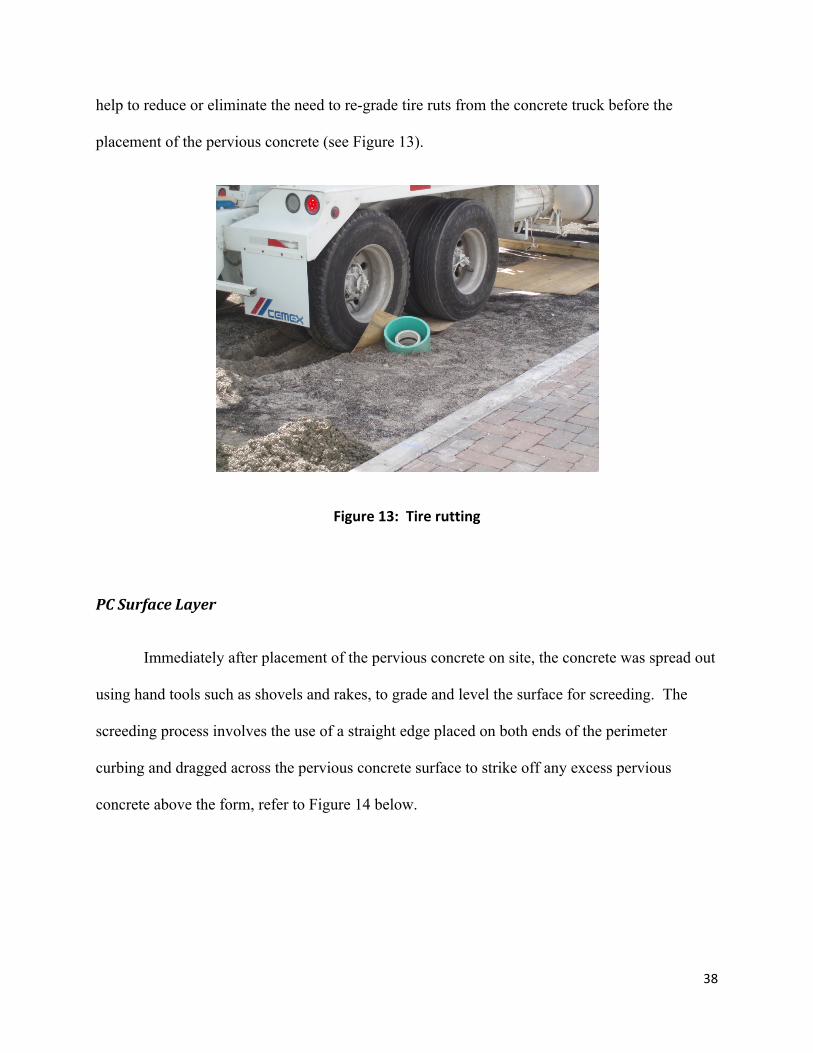
Concrete companies should consider placing small vibrators on the chutes to help
encourage the concrete to slide down the chute without effort, and may enable extension chutes
to be added on to increase the discharge distance from the back of the concrete truck. This may
38
help to reduce or eliminate the need to re-grade tire ruts from the concrete truck before the
placement of the pervious concrete (see Figure 13).
Figure 13: Tire rutting
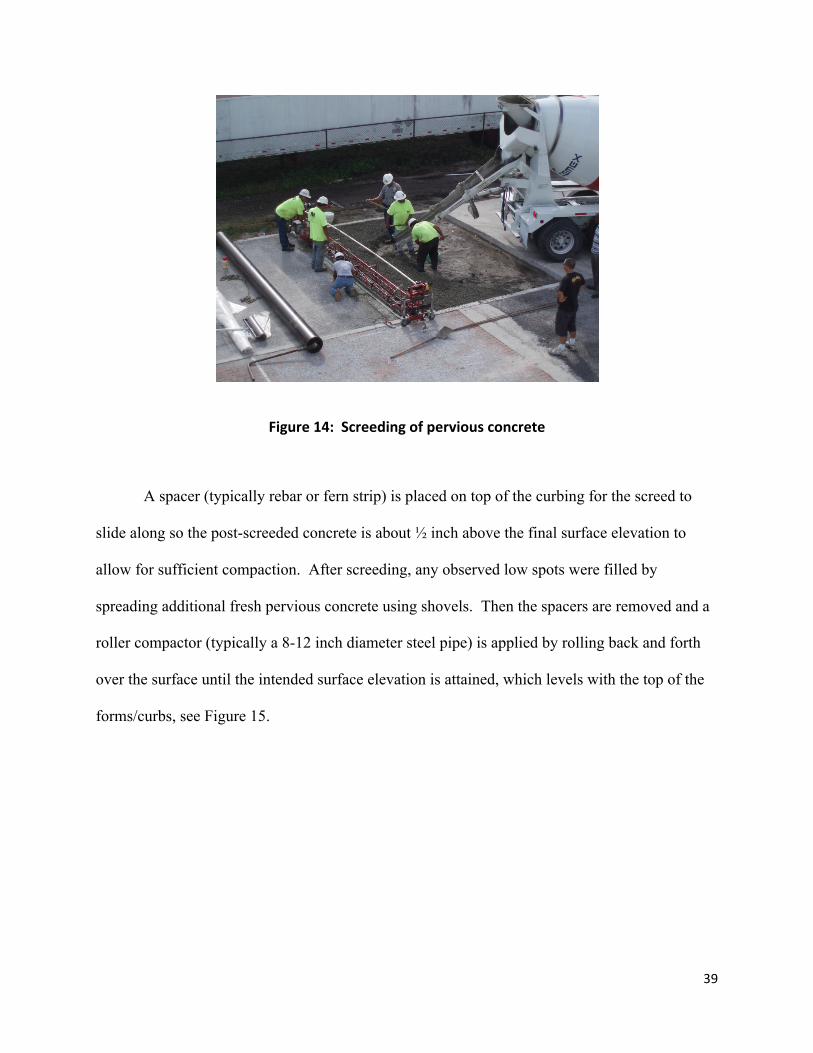
PC Surface Layer
Immediately after placement of the pervious concrete on site, the concrete was spread out
using hand tools such as shovels and rakes, to grade and level the surface for screeding. The
screeding process involves the use of a straight edge placed on both ends of the perimeter
curbing and dragged across the pervious concrete surface to strike off any excess pervious
concrete above the form, refer to Figure 14 below.
39
Figure 14: Screeding of pervious concrete
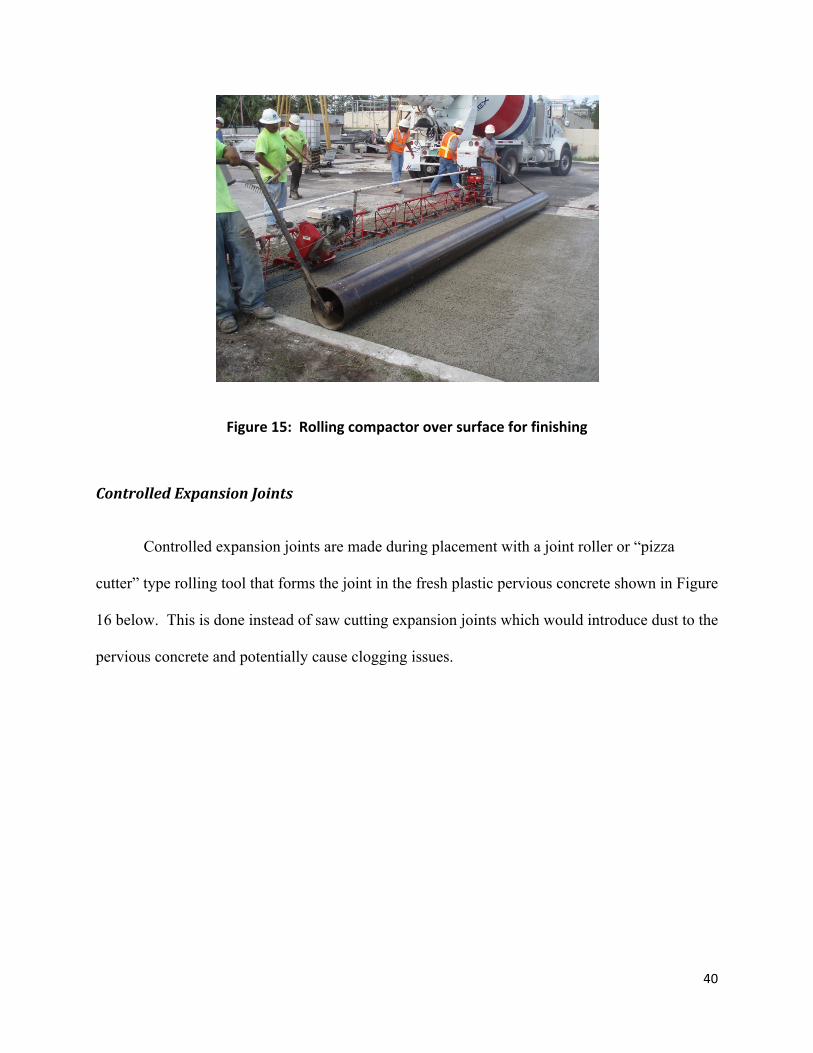
A spacer (typically rebar or fern strip) is placed on top of the curbing for the screed to
slide along so the post-screeded concrete is about ½ inch above the final surface elevation to
allow for sufficient compaction. After screeding, any observed low spots were filled by
spreading additional fresh pervious concrete using shovels. Then the spacers are removed and a
roller compactor (typically a 8-12 inch diameter steel pipe) is applied by rolling back and forth
over the surface until the intended surface elevation is attained, which levels with the top of the
forms/curbs, see Figure 15.
40
Figure 15: Rolling compactor over surface for finishing
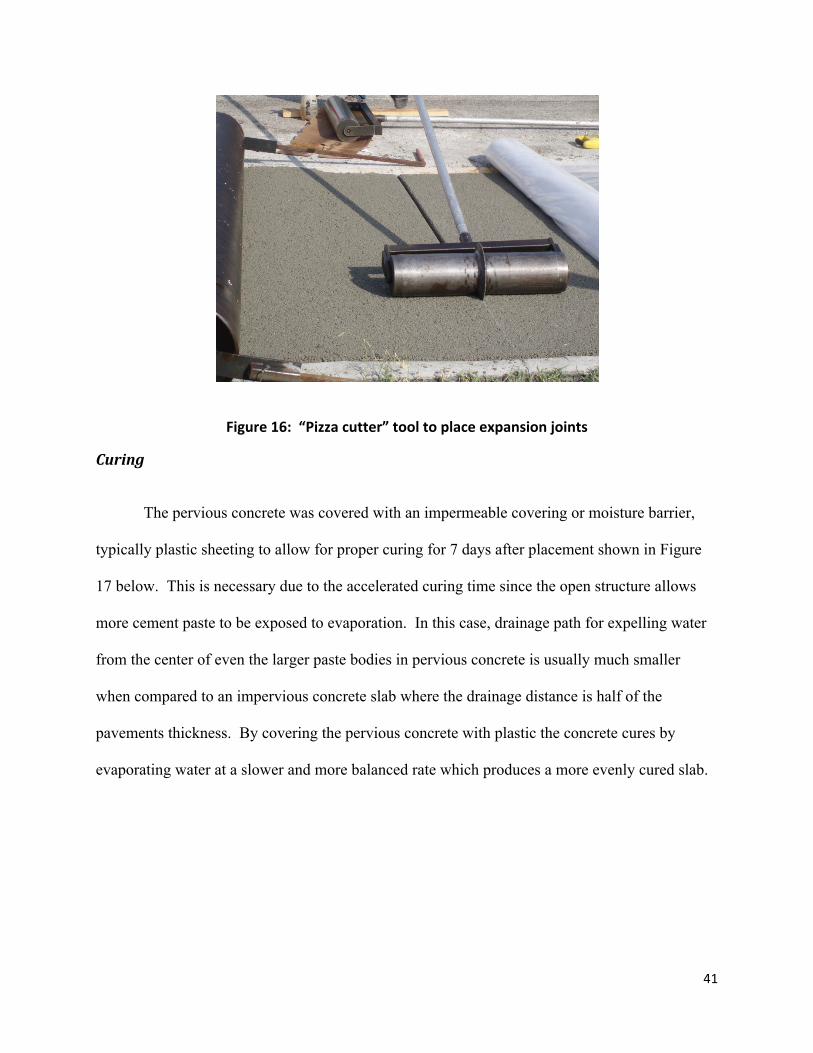
Controlled Expansion Joints
Controlled expansion joints are made during placement with a joint roller or “pizza
cutter” type rolling tool that forms the joint in the fresh plastic pervious concrete shown in Figure
16 below. This is done instead of saw cutting expansion joints which would introduce dust to the
pervious concrete and potentially cause clogging issues.
41
Figure 16: “Pizza cutter” tool to place expansion joints
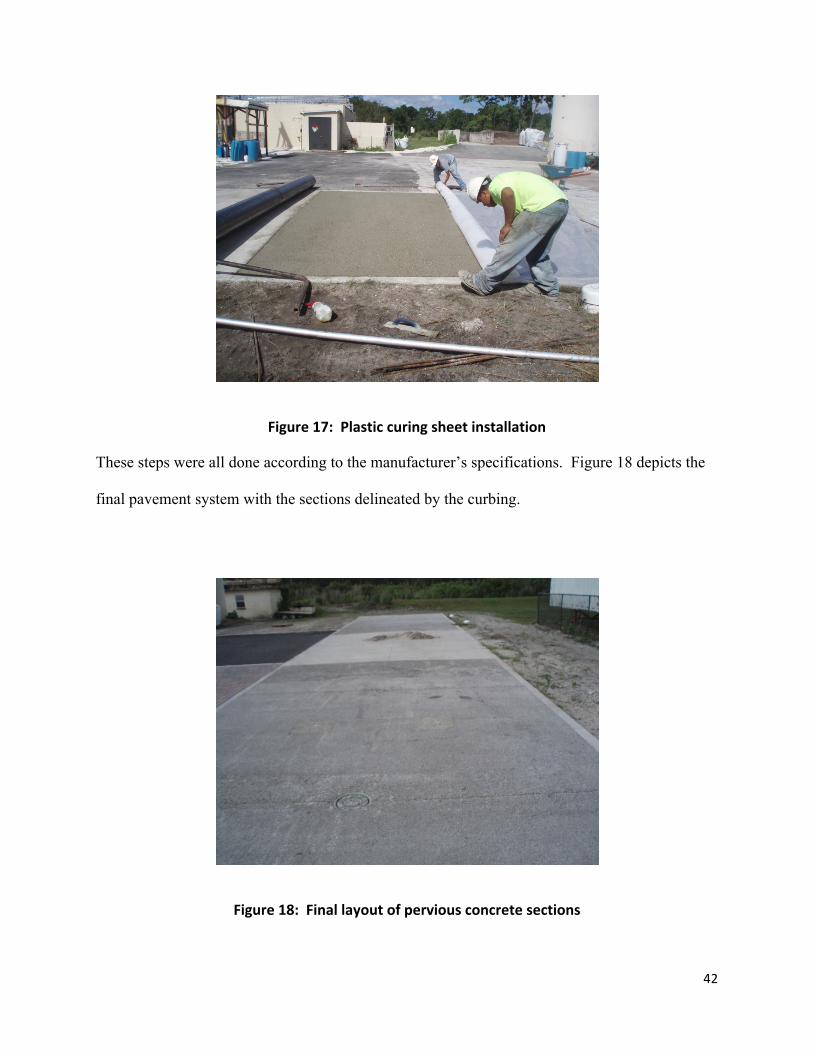
Curing
The pervious concrete was covered with an impermeable covering or moisture barrier,
typically plastic sheeting to allow for proper curing for 7 days after placement shown in Figure
17 below. This is necessary due to the accelerated curing time since the open structure allows
more cement paste to be exposed to evaporation. In this case, drainage path for expelling water
from the center of even the larger paste bodies in pervious concrete is usually much smaller
when compared to an impervious concrete slab where the drainage distance is half of the
pavements thickness. By covering the pervious concrete with plastic the concrete cures by
evaporating water at a slower and more balanced rate which produces a more evenly cured slab.
42
Figure 17: Plastic curing sheet installation
These steps were all done according to the manufacturer’s specifications. Figure 18 depicts the
final pavement system with the sections delineated by the curbing.
Figure 18: Final layout of pervious concrete sections

43
Setup for Infiltration and Rejuvenation
To simulate clogging that is expected on the pavement systems over a long period of time
or during a sudden spill event, large amounts of sediments are intentionally spread over the
surface of the pervious concrete system rejuvenation pad with a skid steer loader. The sediments
are dumped on and then spread evenly about the surface of the pavements from the loader’s
bucket and spread evenly about the surface as shown in Figure 19 below.
Figure 19: Sediment loading
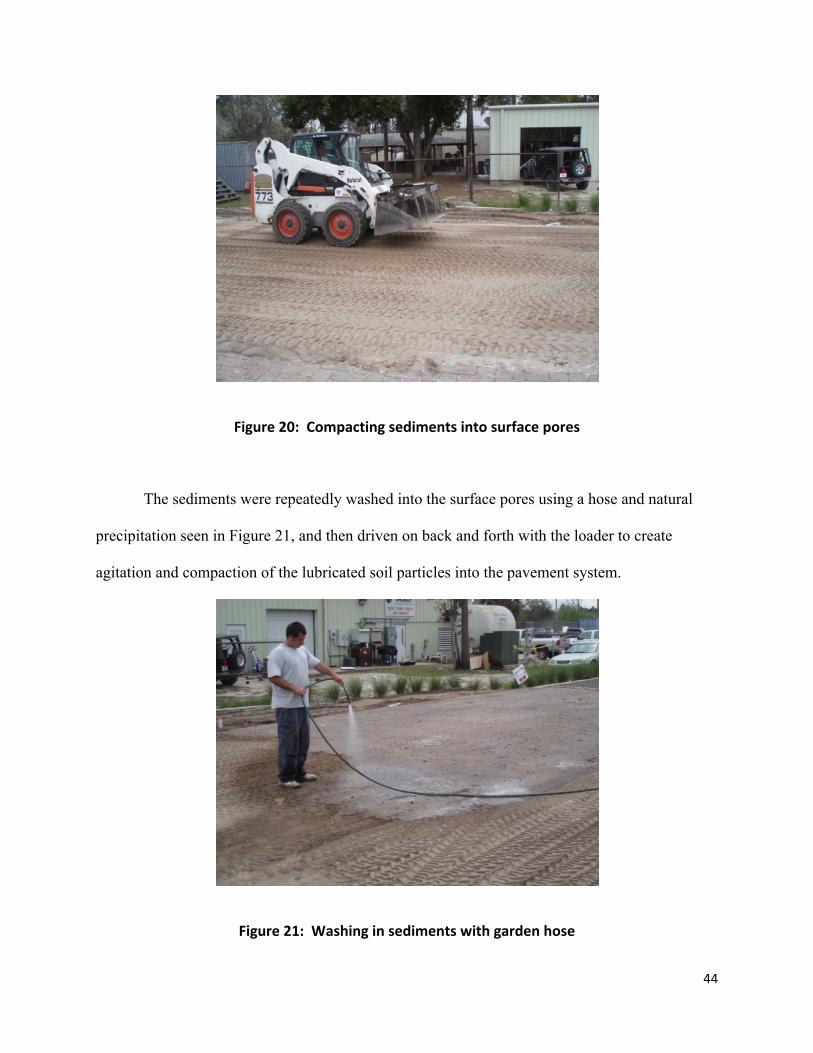
To simulate field clogging conditions where precipitation would have washed the
sediments into the pore structure and then vehicles would have helped by compacting the
sediments into the pore throats of the surface and cause vibrations that would agitate the
sediments forcing them deeper into the pore structure of the system, a similar approach was
taken and shown in Figure 20.
44
Figure 20: Compacting sediments into surface pores
The sediments were repeatedly washed into the surface pores using a hose and natural
precipitation seen in Figure 21, and then driven on back and forth with the loader to create
agitation and compaction of the lubricated soil particles into the pavement system.
Figure 21: Washing in sediments with garden hose
45
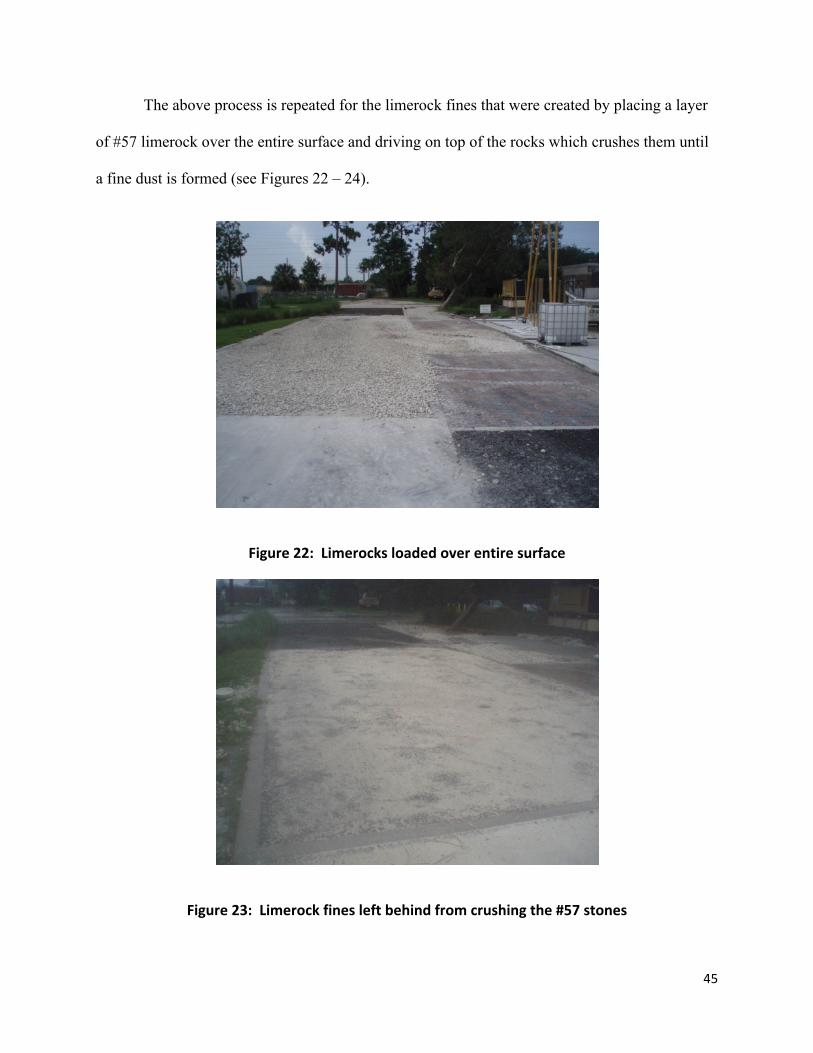
The above process is repeated for the limerock fines that were created by placing a layer
of #57 limerock over the entire surface and driving on top of the rocks which crushes them until
a fine dust is formed (see Figures 22 – 24).
Figure 22: Limerocks loaded over entire surface
Figure 23: Limerock fines left behind from crushing the #57 stones
46
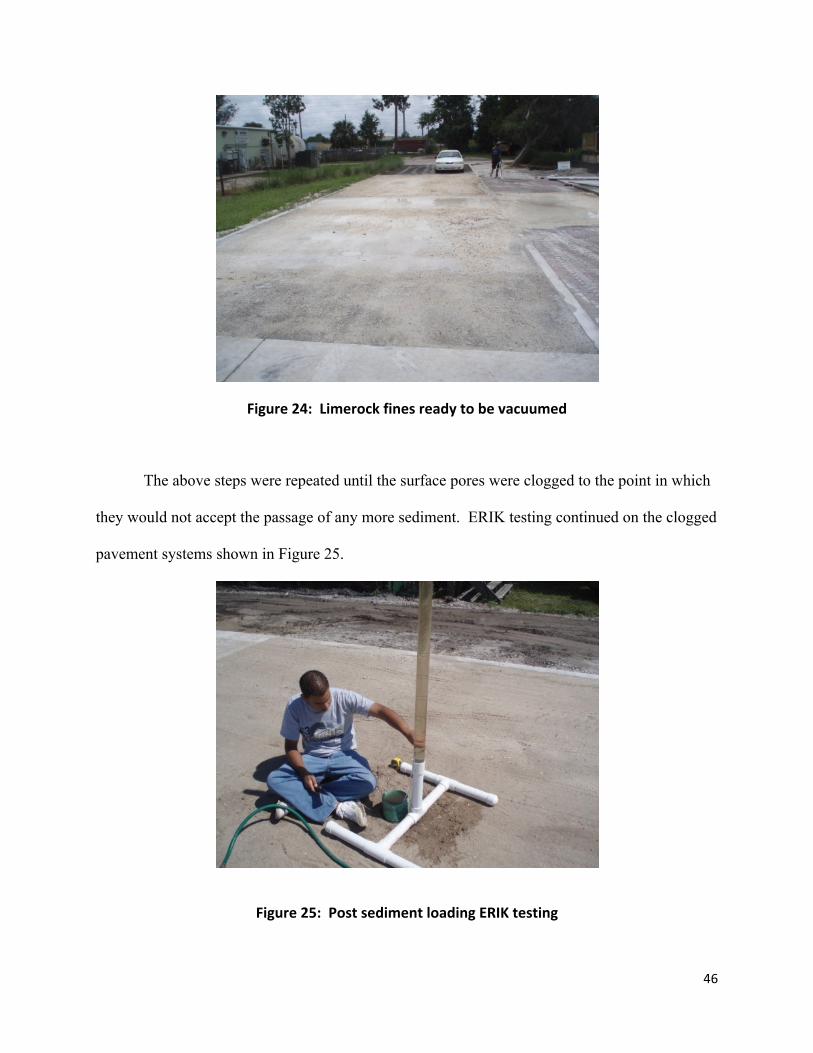
Figure 24: Limerock fines ready to be vacuumed
The above steps were repeated until the surface pores were clogged to the point in which
they would not accept the passage of any more sediment. ERIK testing continued on the clogged
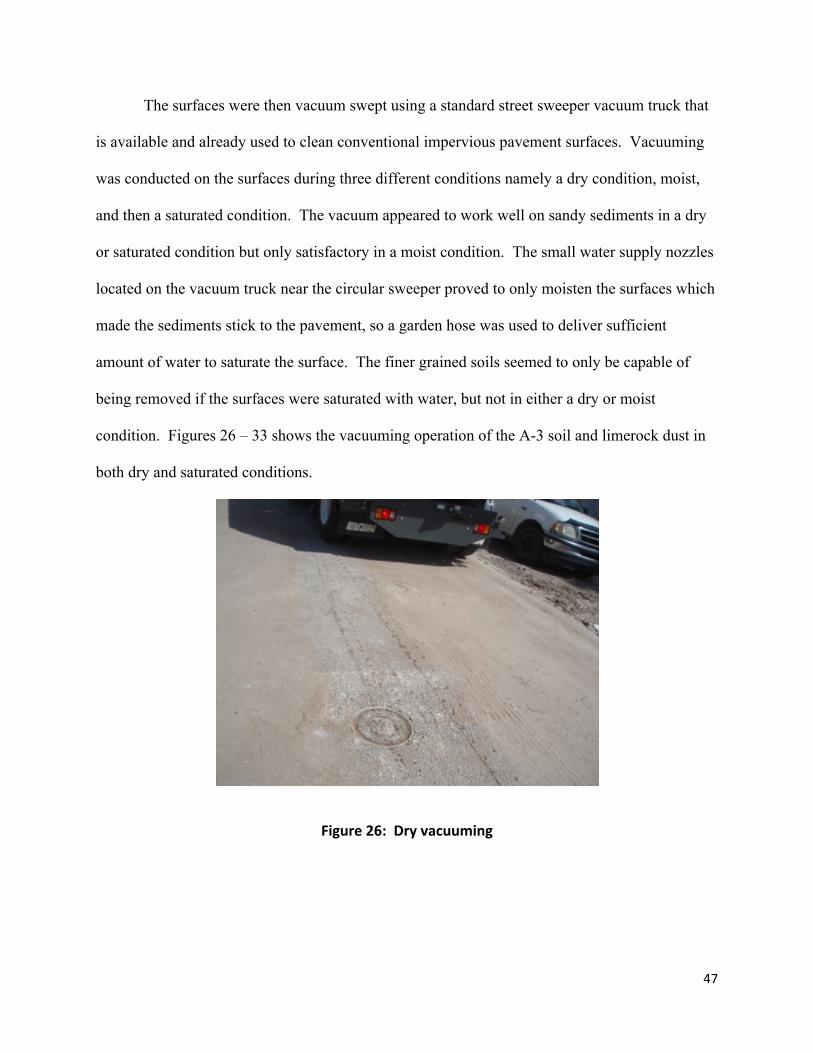
pavement systems shown in Figure 25.
Figure 25: Post sediment loading ERIK testing
47
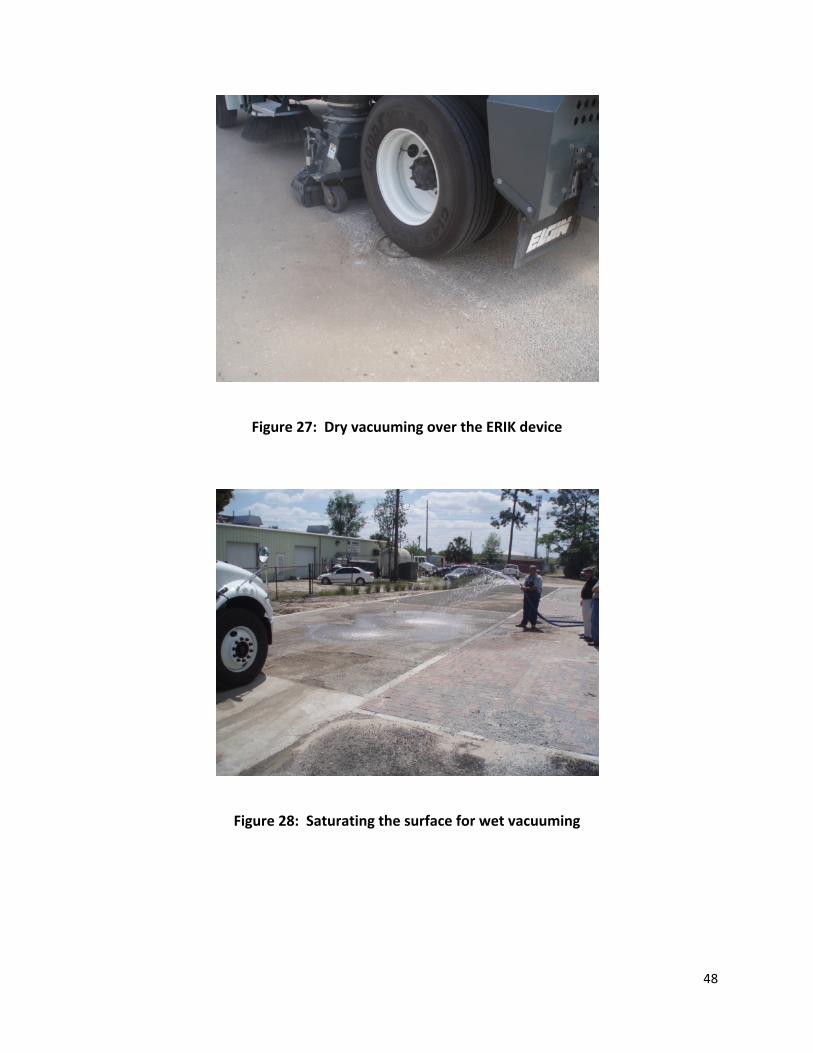
The surfaces were then vacuum swept using a standard street sweeper vacuum truck that
is available and already used to clean conventional impervious pavement surfaces. Vacuuming
was conducted on the surfaces during three different conditions namely a dry condition, moist,
and then a saturated condition. The vacuum appeared to work well on sandy sediments in a dry
or saturated condition but only satisfactory in a moist condition. The small water supply nozzles
located on the vacuum truck near the circular sweeper proved to only moisten the surfaces which
made the sediments stick to the pavement, so a garden hose was used to deliver sufficient
amount of water to saturate the surface. The finer grained soils seemed to only be capable of
being removed if the surfaces were saturated with water, but not in either a dry or moist
condition. Figures 26 – 33 shows the vacuuming operation of the A-3 soil and limerock dust in
both dry and saturated conditions.
Figure 26: Dry vacuuming
48
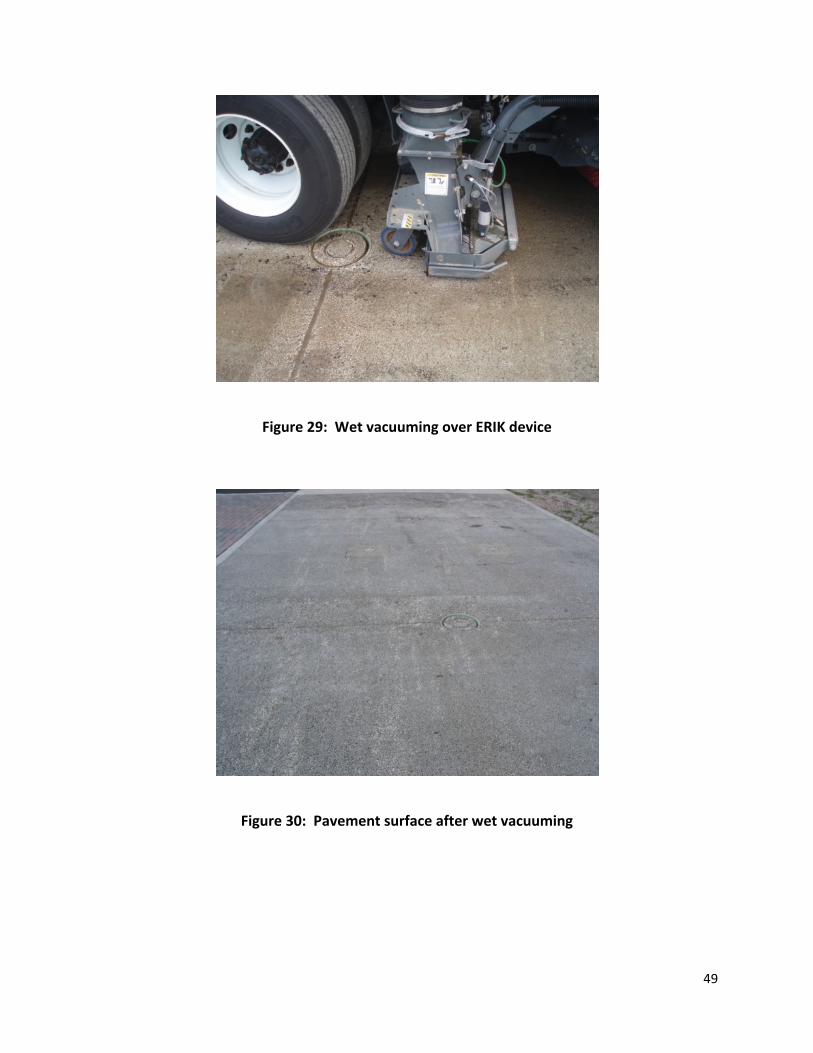
Figure 27: Dry vacuuming over the ERIK device
Figure 28: Saturating the surface for wet vacuuming
49
Figure 29: Wet vacuuming over ERIK device
Figure 30: Pavement surface after wet vacuuming
50
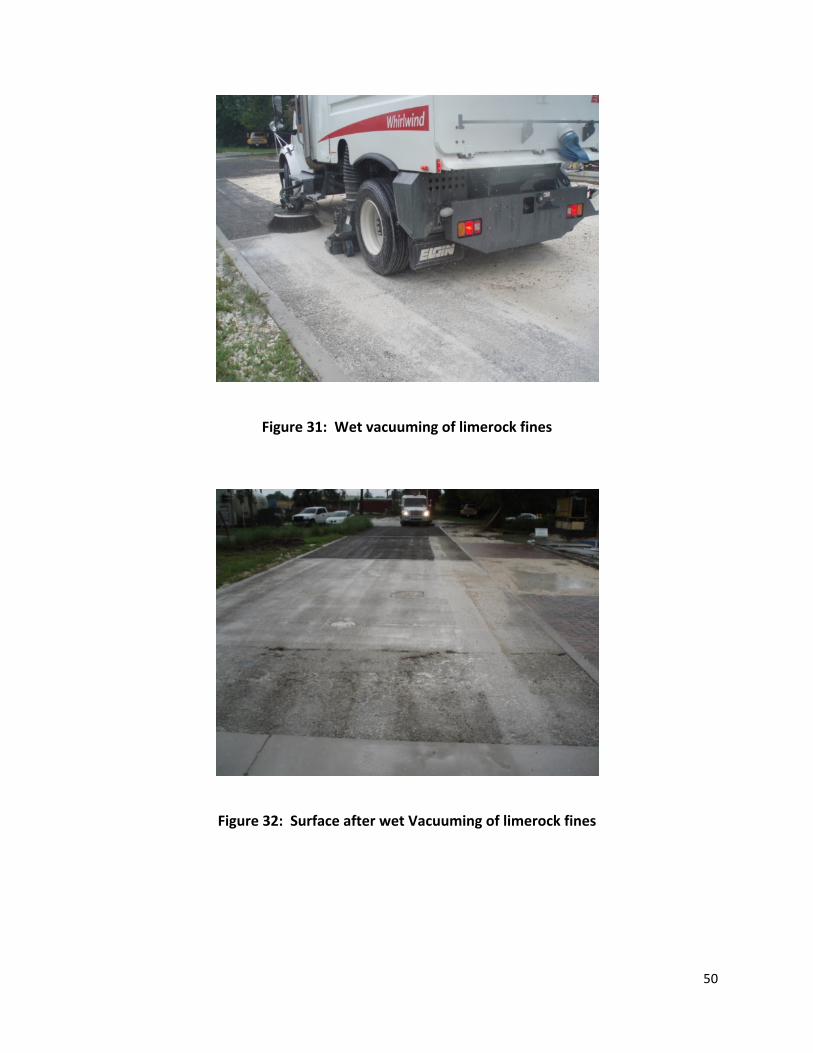
Figure 31: Wet vacuuming of limerock fines
Figure 32: Surface after wet Vacuuming of limerock fines
51
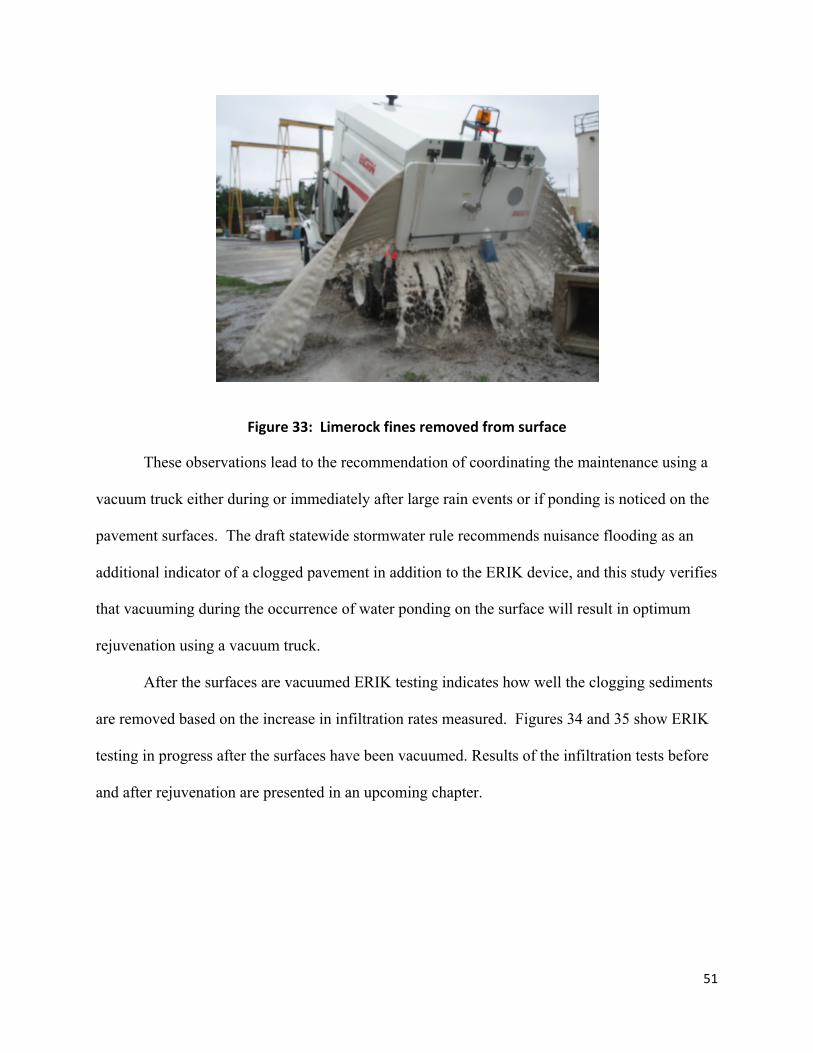
Figure 33: Limerock fines removed from surface
These observations lead to the recommendation of coordinating the maintenance using a
vacuum truck either during or immediately after large rain events or if ponding is noticed on the
pavement surfaces. The draft statewide stormwater rule recommends nuisance flooding as an
additional indicator of a clogged pavement in addition to the ERIK device, and this study verifies
that vacuuming during the occurrence of water ponding on the surface will result in optimum
rejuvenation using a vacuum truck.
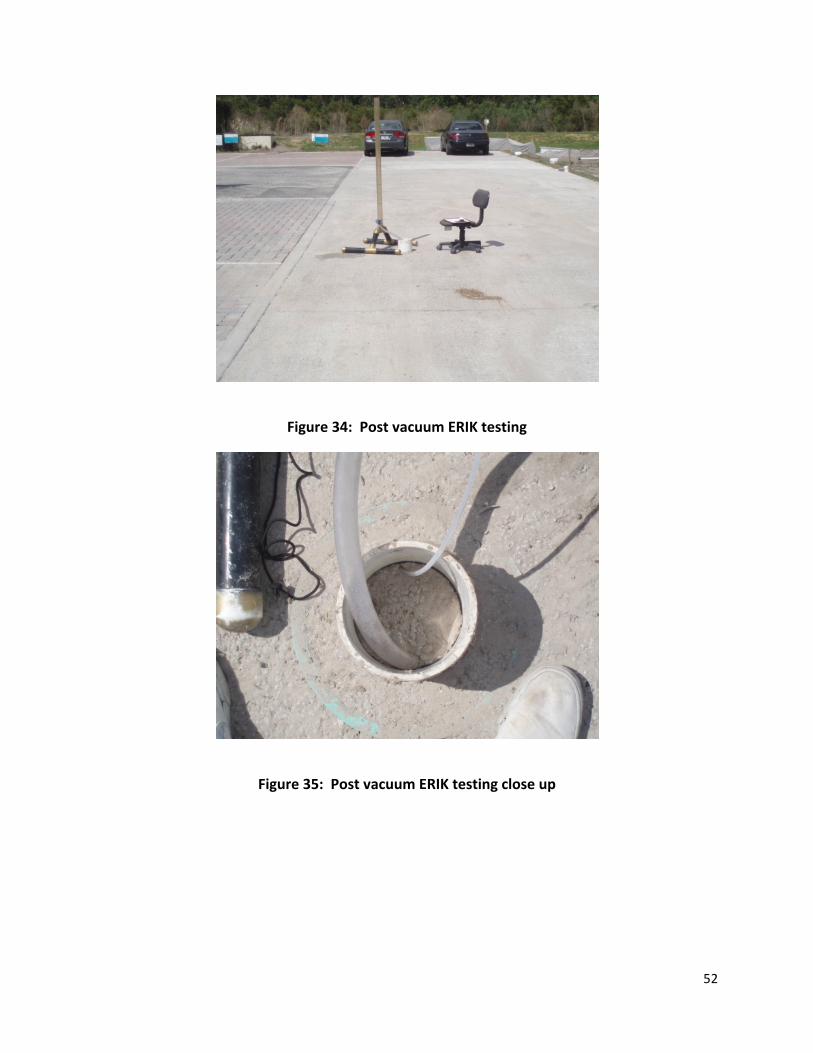
After the surfaces are vacuumed ERIK testing indicates how well the clogging sediments
are removed based on the increase in infiltration rates measured. Figures 34 and 35 show ERIK
testing in progress after the surfaces have been vacuumed. Results of the infiltration tests before
and after rejuvenation are presented in an upcoming chapter.
52
Figure 34: Post vacuum ERIK testing
Figure 35: Post vacuum ERIK testing close up
53
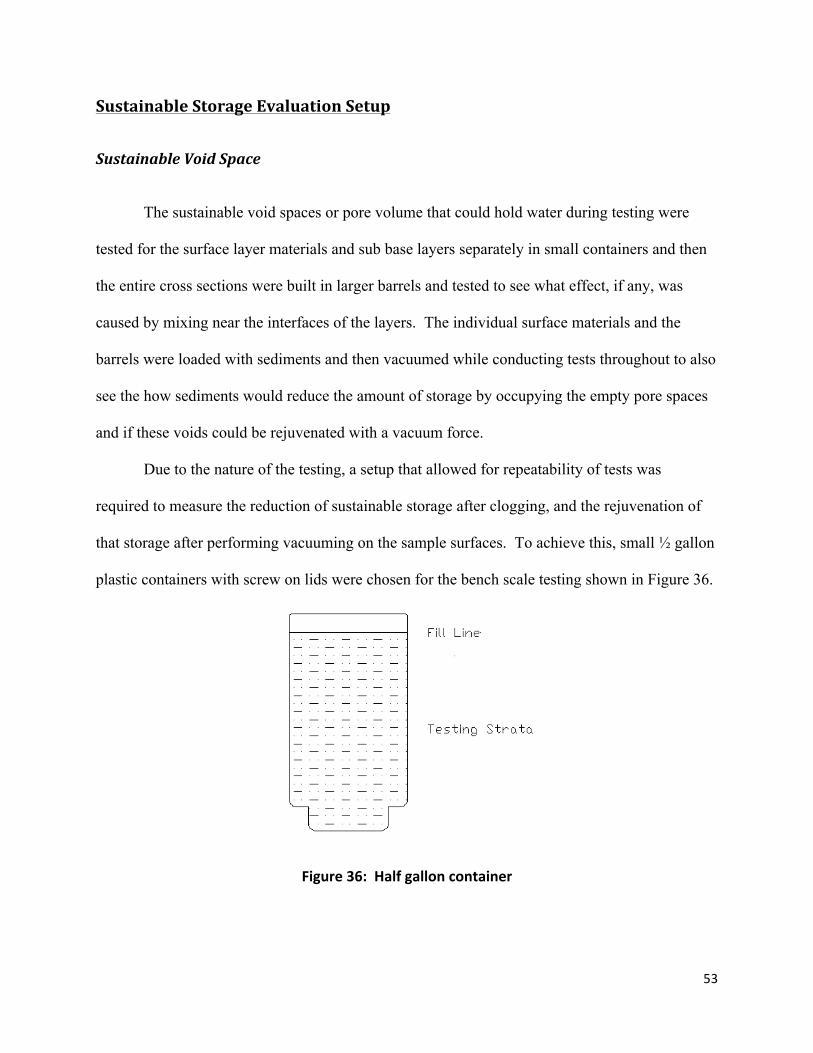
Sustainable Storage Evaluation Setup
Sustainable Void Space
The sustainable void spaces or pore volume that could hold water during testing were
tested for the surface layer materials and sub base layers separately in small containers and then
the entire cross sections were built in larger barrels and tested to see what effect, if any, was
caused by mixing near the interfaces of the layers. The individual surface materials and the
barrels were loaded with sediments and then vacuumed while conducting tests throughout to also
see the how sediments would reduce the amount of storage by occupying the empty pore spaces
and if these voids could be rejuvenated with a vacuum force.
Due to the nature of the testing, a setup that allowed for repeatability of tests was
required to measure the reduction of sustainable storage after clogging, and the rejuvenation of
that storage after performing vacuuming on the sample surfaces. To achieve this, small ½ gallon
plastic containers with screw on lids were chosen for the bench scale testing shown in Figure 36.
Figure 36: Half gallon container

54
The bench scale testing was performed to examine the storage values of the individual
aggregate components that make up the system layers. The containers were modified by turning
them upside down, cutting the bottom out, and then assembling filter fabric around the threaded
opening using a rubber band to keep the fabric in place. This allowed for the lid to be screwed
on to seal the bottom in order to measure storage of water, then the lid could be removed after
testing to drain (by gravity) the pore water. Subsequent tests could be conducting on the sample
samples without disturbing or changing the structure of the materials. Also washing and
compacting of sediments into the materials and later vacuuming could be done while testing the
storage values at the different levels of clogging and rejuvenation.
In accordance with this understanding, a variety of substrates were tested including: the
pervious concrete and Bold&GoldTM pollution control media. Again, in order to properly attain
replicable results from the testing method, the proper inventory of materials is required. This
inventory includes: the aforementioned specified testing media, a 1.89 liter ½ gallon (US) (½
gallon (US)) plastic jar (including the cap), a 18.92 liters (5 gallon (US)) bucket, nonwoven
geotextile (Marifi 160N), rubber bands, a scale capable of reading to 0.01g (SWL testing utilized
the OHAUS Explorer Pro), an evaporation pan, 1 cubic foot (Ft3) of sand, a paint brush, box
cutters, 12.7mm (½ inch) polyurethane tubing, plastic Tupperware, a proctor hammer, an oven, a
digital camera and data sheet.
The set up procedure included wrapping end with the existing lid opening with the non-
woven geotextile. Next, rubber bands were used to fasten the geotextile in place. The cap was
then fitted over the newly installed geotextile and the specified testing media was placed in the
modified ½ gallon jar to the specified “Fill Line”.
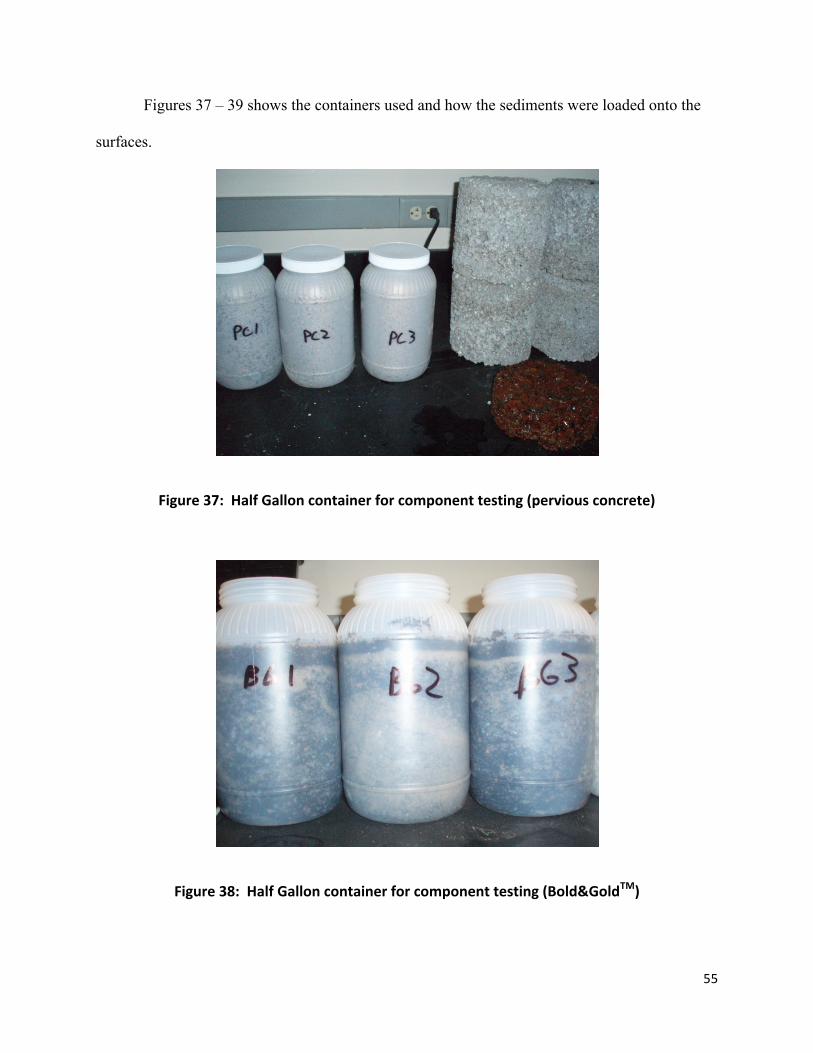
55
Figures 37 – 39 shows the containers used and how the sediments were loaded onto the
surfaces.
Figure 37: Half Gallon container for component testing (pervious concrete)
Figure 38: Half Gallon container for component testing (Bold&GoldTM)
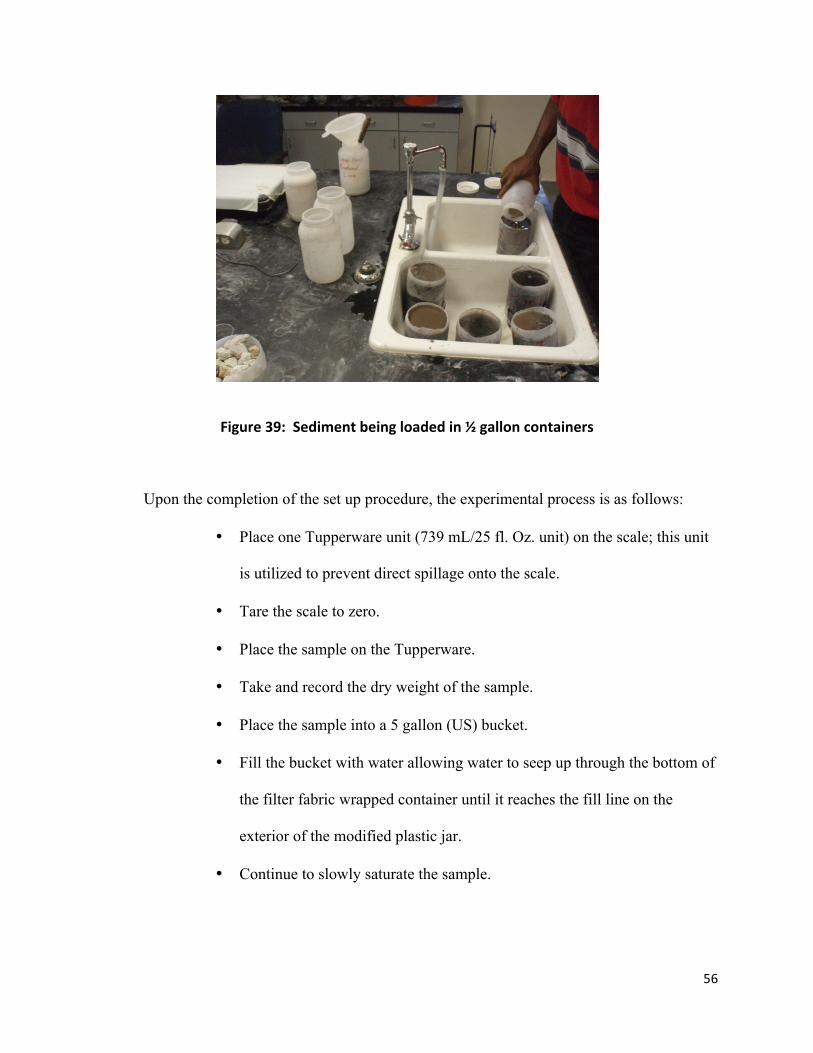
56
Figure 39: Sediment being loaded in ½ gallon containers
Upon the completion of the set up procedure, the experimental process is as follows:
• Place one Tupperware unit (739 mL/25 fl. Oz. unit) on the scale; this unit
is utilized to prevent direct spillage onto the scale.
• Tare the scale to zero.
• Place the sample on the Tupperware.
• Take and record the dry weight of the sample.
• Place the sample into a 5 gallon (US) bucket.
• Fill the bucket with water allowing water to seep up through the bottom of
the filter fabric wrapped container until it reaches the fill line on the
exterior of the modified plastic jar.
• Continue to slowly saturate the sample.
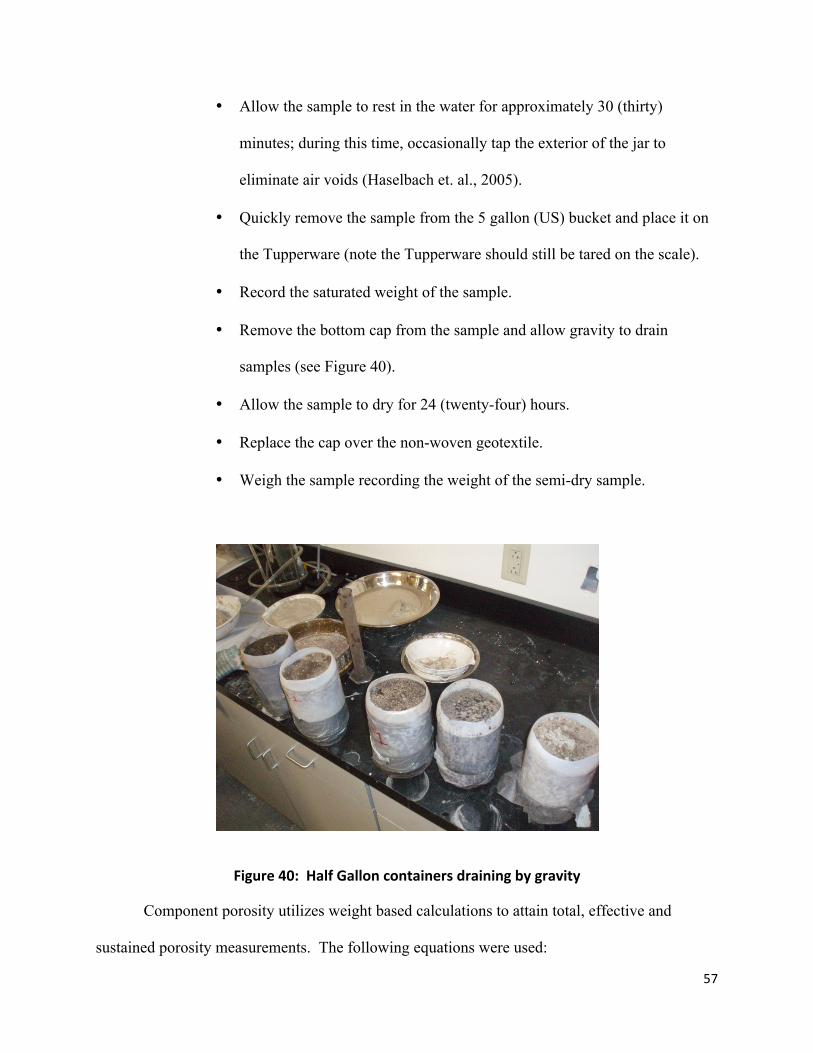
57
• Allow the sample to rest in the water for approximately 30 (thirty)
minutes; during this time, occasionally tap the exterior of the jar to
eliminate air voids (Haselbach et. al., 2005).
• Quickly remove the sample from the 5 gallon (US) bucket and place it on
the Tupperware (note the Tupperware should still be tared on the scale).
• Record the saturated weight of the sample.
• Remove the bottom cap from the sample and allow gravity to drain
samples (see Figure 40).
• Allow the sample to dry for 24 (twenty-four) hours.
• Replace the cap over the non-woven geotextile.
• Weigh the sample recording the weight of the semi-dry sample.
Figure 40: Half Gallon containers draining by gravity
Component porosity utilizes weight based calculations to attain total, effective and
sustained porosity measurements. The following equations were used:
58
The porosity of a material is given by:
! % = !!"#$%!
Equation 1
The total volume (V) can be determined by filling the testing apparatus with water to the
designated fill line:
! = !!"#$% !" !"## !"#$!!"#$%
Equation 2
After adding the desired media into the testing apparatus, the volume of voids (VVoids)
can determined via the following equation:
!!"#$% =!!"#$% !""#"/!!"#$% Equation 1
After a 24 hour draining period, the sample is reweighted to determine the amount of
residual water remaining. Hence, a new volume of voids (VVoids) value is determined yielding a
sustained porosity measurement:
!!"#$%′ =!!"#$% !""#" (!"#$%&')/!!"#$% Equation 2
Both the system and component porosity methods focus on a simple method to
adequately measure the total and effective porosity based volumetric and weight centric
calculations.
System (Barrel) porosity testing methodology was explored as a possible means of
achieving reproducible results for a porous paving system. The hypothesis was that replicating
field conditions exactly on a smaller scale will yield porosity results comparable to actual field
conditions.
A specific inventory of materials is required to properly perform the testing procedure
discussed above. These materials include: the specified testing media, tap water, a 208.2 liter
(55 gallon (US)) plastic barrel, a 2000 milliliter (0.53 gallon (US)) graduated cylinder, a 18.9
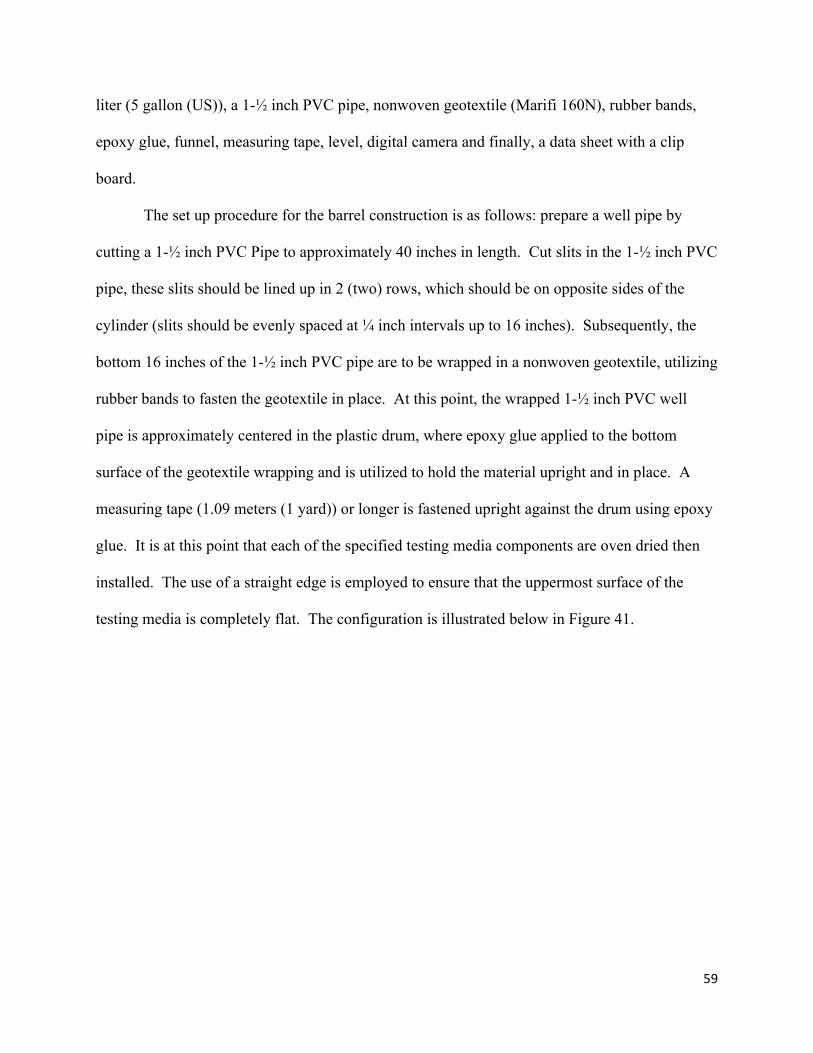
59
liter (5 gallon (US)), a 1-½ inch PVC pipe, nonwoven geotextile (Marifi 160N), rubber bands,
epoxy glue, funnel, measuring tape, level, digital camera and finally, a data sheet with a clip
board.
The set up procedure for the barrel construction is as follows: prepare a well pipe by
cutting a 1-½ inch PVC Pipe to approximately 40 inches in length. Cut slits in the 1-½ inch PVC
pipe, these slits should be lined up in 2 (two) rows, which should be on opposite sides of the
cylinder (slits should be evenly spaced at ¼ inch intervals up to 16 inches). Subsequently, the
bottom 16 inches of the 1-½ inch PVC pipe are to be wrapped in a nonwoven geotextile, utilizing
rubber bands to fasten the geotextile in place. At this point, the wrapped 1-½ inch PVC well
pipe is approximately centered in the plastic drum, where epoxy glue applied to the bottom
surface of the geotextile wrapping and is utilized to hold the material upright and in place. A
measuring tape (1.09 meters (1 yard)) or longer is fastened upright against the drum using epoxy
glue. It is at this point that each of the specified testing media components are oven dried then
installed. The use of a straight edge is employed to ensure that the uppermost surface of the
testing media is completely flat. The configuration is illustrated below in Figure 41.
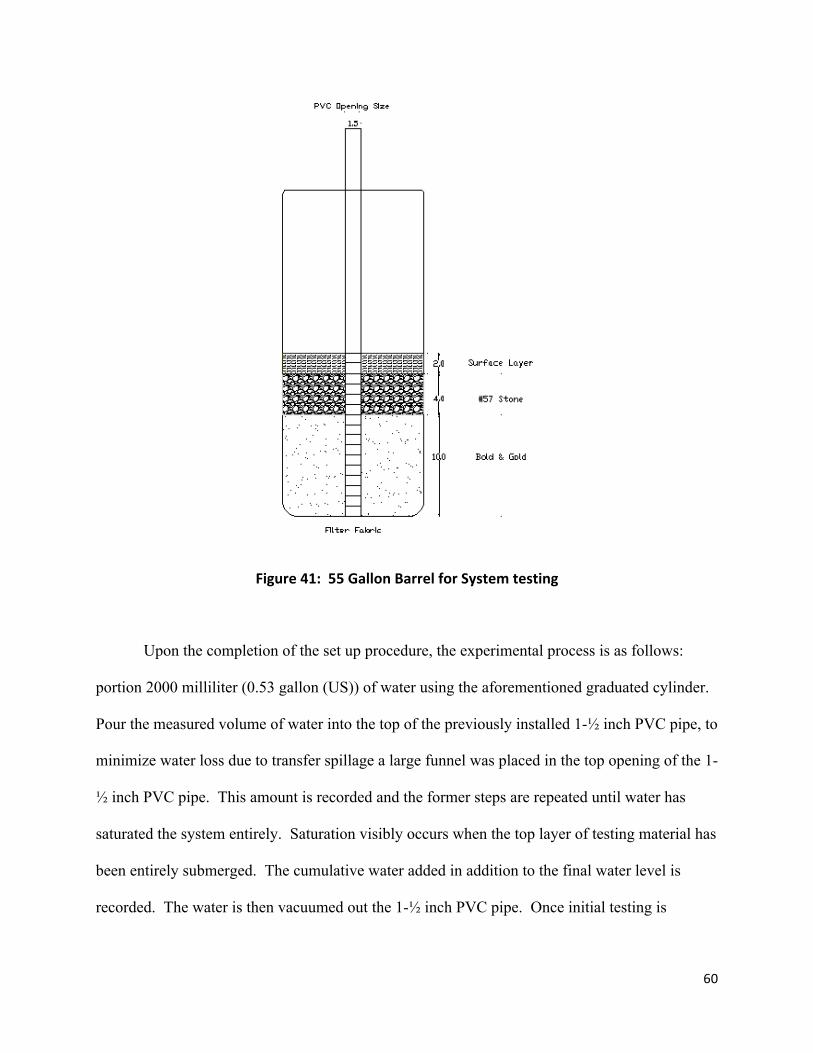
60
Figure 41: 55 Gallon Barrel for System testing
Upon the completion of the set up procedure, the experimental process is as follows:
portion 2000 milliliter (0.53 gallon (US)) of water using the aforementioned graduated cylinder.
Pour the measured volume of water into the top of the previously installed 1-½ inch PVC pipe, to
minimize water loss due to transfer spillage a large funnel was placed in the top opening of the 1-
½ inch PVC pipe. This amount is recorded and the former steps are repeated until water has
saturated the system entirely. Saturation visibly occurs when the top layer of testing material has
been entirely submerged. The cumulative water added in addition to the final water level is
recorded. The water is then vacuumed out the 1-½ inch PVC pipe. Once initial testing is
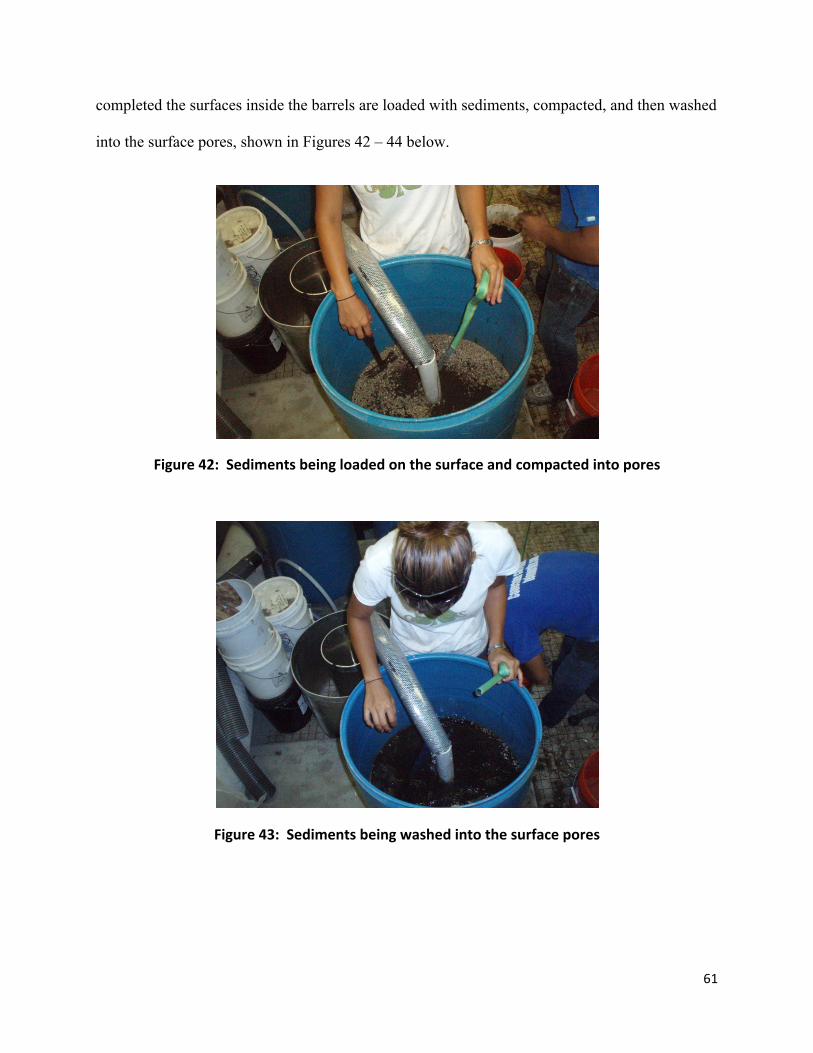
61
completed the surfaces inside the barrels are loaded with sediments, compacted, and then washed
into the surface pores, shown in Figures 42 – 44 below.
Figure 42: Sediments being loaded on the surface and compacted into pores
Figure 43: Sediments being washed into the surface pores
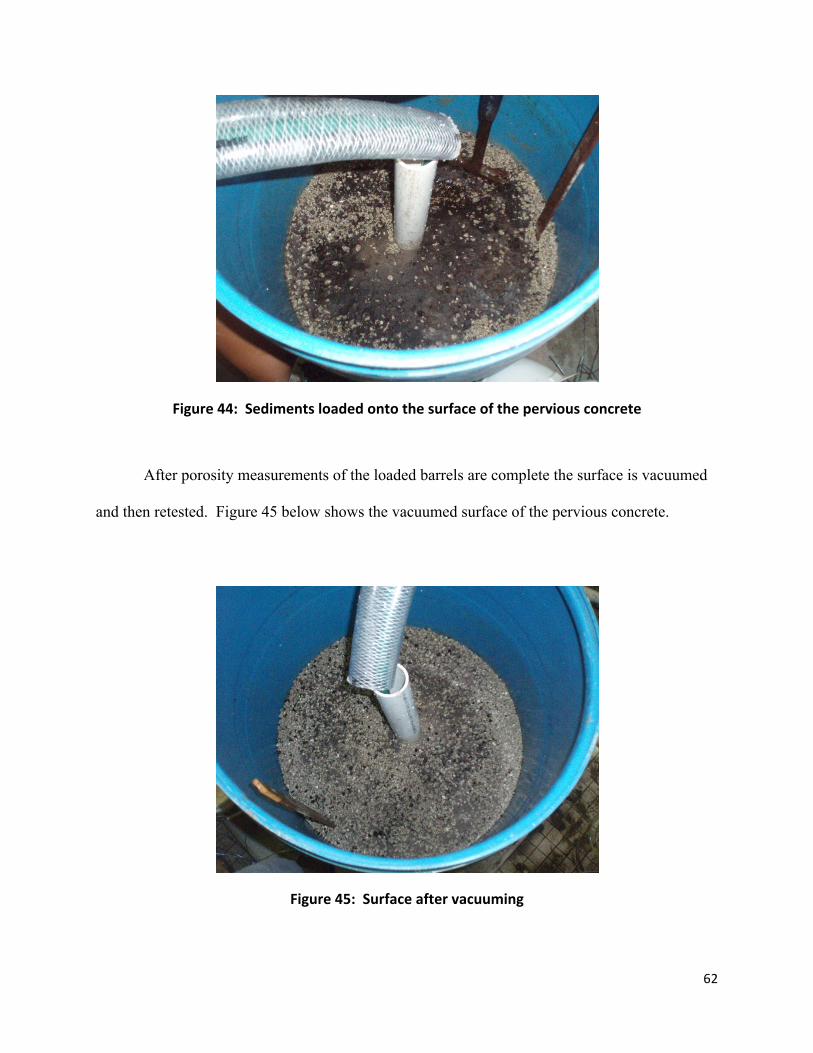
62
Figure 44: Sediments loaded onto the surface of the pervious concrete
After porosity measurements of the loaded barrels are complete the surface is vacuumed
and then retested. Figure 45 below shows the vacuumed surface of the pervious concrete.
Figure 45: Surface after vacuuming

63
The procedure for the complete systems has been determined by extrapolating the total
volume of the specimen based on its height within the 55 gallon drum previously calibrated by
adding known volumes of water and recording the height and recording the amount of water
added to effectively saturate the sample, the porosity can be calculated by utilizing the following
method.
While similar, the primary difference between the component (lab) porosity testing
method and system (barrel) method, is, as the name would suggest, the measurement of porosity
values of components of a system versus the system as a whole.
The method of calculation also differs between the two processes. System porosity is
determined via volumetric calculations.
The porosity equation is:
! % = !!"#$%!
Equation 5
The volume of voids (VVoids) is determined by the following equation:
!!"#$% = !!"#$% !""#" − !!"#$ !.!"#$%&%' Equation 6
This, subsequently, can be calculated as:
!!"#$% = !!""#" − (!!"#$% !""#" ∗!!!""#$
!
!) Equation 7
The total volume (V) can be determined via the following equations:
! = !!"##$% − !!"#$ !.!"#$%&%' Equation 8
Based on a prior analysis correlating barrel height to volume of fluid present, the
following equation has been prepared:
! = 1.745!
Where x represents the height of the fluid specimen in feet, and y represents the
subsequent volume acquired in cubic feet. This can then be used to calculate VBarrel:
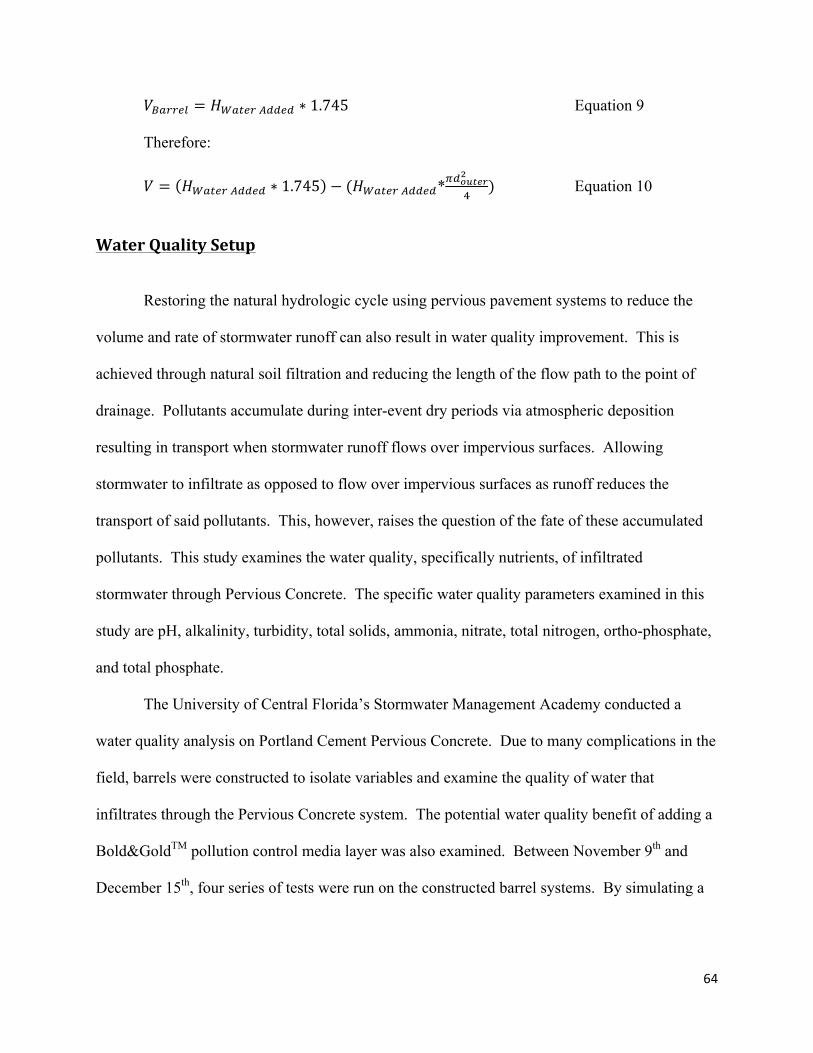
64
!!"##$% = !!"#$% !""#" ∗ 1.745 Equation 9
Therefore:
! = !!"#$% !""#" ∗ 1.745 − (!!"#$% !""#"*!!!"#$%!
!) Equation 10
Water Quality Setup
Restoring the natural hydrologic cycle using pervious pavement systems to reduce the
volume and rate of stormwater runoff can also result in water quality improvement. This is
achieved through natural soil filtration and reducing the length of the flow path to the point of
drainage. Pollutants accumulate during inter-event dry periods via atmospheric deposition
resulting in transport when stormwater runoff flows over impervious surfaces. Allowing
stormwater to infiltrate as opposed to flow over impervious surfaces as runoff reduces the
transport of said pollutants. This, however, raises the question of the fate of these accumulated
pollutants. This study examines the water quality, specifically nutrients, of infiltrated
stormwater through Pervious Concrete. The specific water quality parameters examined in this
study are pH, alkalinity, turbidity, total solids, ammonia, nitrate, total nitrogen, ortho-phosphate,
and total phosphate.
The University of Central Florida’s Stormwater Management Academy conducted a
water quality analysis on Portland Cement Pervious Concrete. Due to many complications in the
field, barrels were constructed to isolate variables and examine the quality of water that
infiltrates through the Pervious Concrete system. The potential water quality benefit of adding a
Bold&GoldTM pollution control media layer was also examined. Between November 9th and
December 15th, four series of tests were run on the constructed barrel systems. By simulating a

65
rainstorm using a watering can and stormwater collected from a nearby stormwater pond,
conclusive results were found and are presented in this report.
A total of eight test barrels were constructed to isolate the variables of interest, the effect
of Pervious Concrete and the effect of the use of a Bold&GoldTM (B&G) pollution control media
layer. There were a total of four barrels constructed with the Bold&GoldTM pollution control
layer and four constructed without, labeled B&G and Fill respectively. The pervious concrete
was poured in all but two barrels in the same way as it was installed in the field. The two barrels
without Pervious Concrete were constructed as controls, one for the B&G system and one for the
Fill system. The other six barrels represent replicates of the B&G Pervious Pavement system
and the Fill Pervious Pavement system, three replicates for each system.
The following materials were used in the construction of the barrel systems:
1. AASHTO A-3 type soil
2. Bold & GoldTM pollution control media
3. Portland cement pervious concrete
4. Non-woven filter fabric
5. Eight 55 gallon drums
6. Eight valves
7. 17 one liter sample jars
8. Nine 5 gallon buckets
9. Watering can
Preparation
At the beginning of the test series, the barrels were prepped and the driveway systems
constructed inside. First, 2 inches holes were cut above the base of the barrels large enough to fit
66
a nozzle. Nozzles were then installed and sealed. Next, the barrels were cleaned with HCl and
DI water. In order to prevent sediment from clogging the nozzles, a 4x4 inch non-woven filter
mesh was installed behind each nozzle. The barrels were labeled as follows:
a. Fill Control
b. Fill #1
c. Fill #2
d. Fill #3
e. B&G Control
f. B&G #1
g. B&G #2
h. B&G #3
Once all of the barrels were labeled, AASHTO type A-3 soil was poured into each barrel
and compacted to a height of 4 inches. Bold&GoldTM pollution control media was then poured
into the four B&G system barrels and compacted to a depth of 4 inches. Lastly, the pervious
concrete was poured into all the B&G and Fill system barrels except the control barrels to a
depth of 6 inches.
Once the barrels were completed, the eight 5 gallon buckets were cut in half horizontally
and then cleaned with HCl and DI water. Once the buckets were cleaned they were placed under
each valve to catch the infiltrated water. Lastly, the sample jars were labeled to match each
barrel, two jars per barrel one labeled A and the other B.
The following procedure was followed for each test performed. Tests were run on each
barrel between November 9th and December 15th. Two samples were collected from each barrel,
labeled A and B, per test run. First, 5 gallon buckets were placed directly under each valve to
67
catch the water that infiltrates through the system and the valves on the barrels were opened.
Next, stormwater was collected from a nearby pond and poured into each of the barrels using a
watering can, simulating a rain event. The water was allowed to infiltrate through the system for
fifteen minutes prior to sample collection. Two samples were collected for analysis of water
quality parameters per test run, making sure the samples were completely mixed. The first
sample was collected 15 minutes after filtrate started being collected and the second sample
taken after the next 15 minutes and labeled A and B respectively.
Strength Testing
Laboratory Testing
Cylinders and beams used for compressive and flexural strength testing are made for one
time use only. Pervious concrete samples were made from 3/8 inch aggregate, water and Type I
Portland Cement. The pervious concrete mixture and the cylindrical samples for testing are in
accordance with ASTM C31/C31M-03a. The pervious concrete was placed in cylinders, the
surface was leveled, and a 6mil thick polyethylene plastic covering was placed over each
cylindrical sample for proper curing. Ten (10) cylinders of pervious concrete, eight inches in
depth and 4 inches diameter were cast. In addition, five (5) pervious concrete beams of 20 inches
length and six inch by six in square cross-section were prepared to conduct flexural strength test.
These were placed in beam molds and the covered with polyethylene material for curing.
Curing was done to simulate external conditions. Visual inspection of the pervious
concrete mix was used to measure the consistency since no standard method exists to measure its
consistency during installation. This research does not focus on the effect of the mix ratio on the
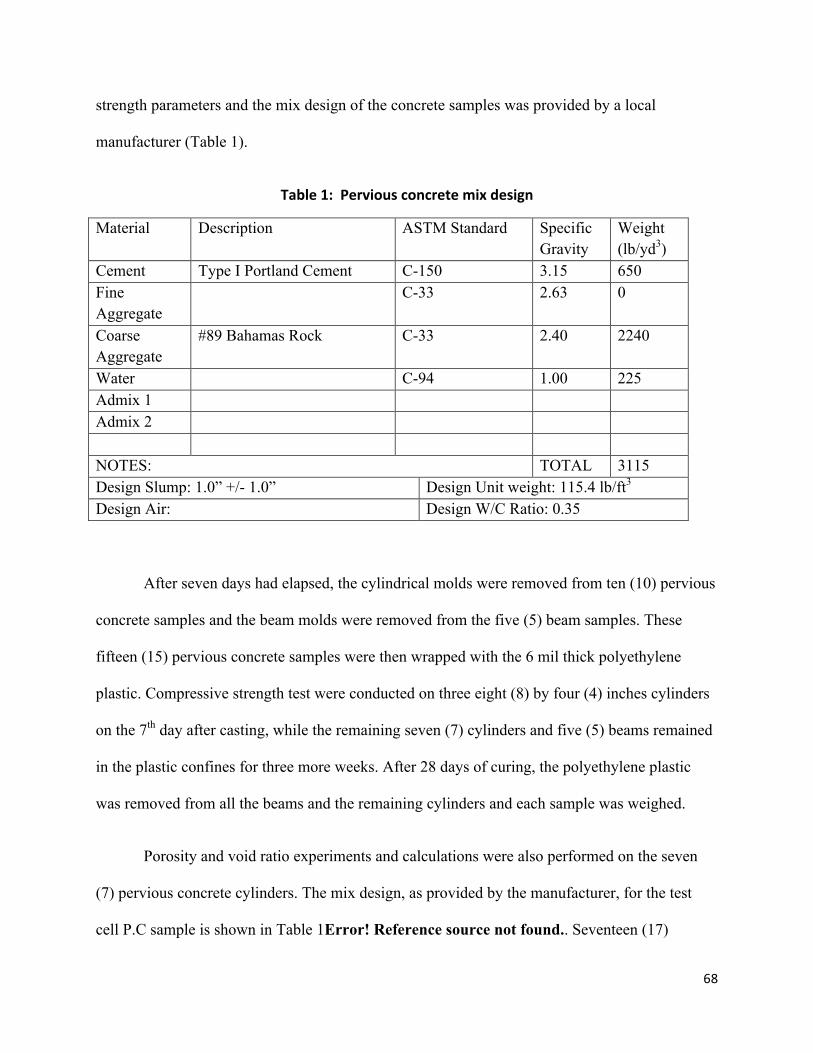
68
strength parameters and the mix design of the concrete samples was provided by a local
manufacturer (Table 1).
Table 1: Pervious concrete mix design
Material Description ASTM Standard Specific Gravity
Weight (lb/yd3)
Cement Type I Portland Cement C-150 3.15 650 Fine Aggregate
C-33 2.63 0
Coarse Aggregate
#89 Bahamas Rock C-33 2.40 2240
Water C-94 1.00 225 Admix 1 Admix 2 NOTES: TOTAL 3115 Design Slump: 1.0” +/- 1.0” Design Unit weight: 115.4 lb/ft3 Design Air: Design W/C Ratio: 0.35
After seven days had elapsed, the cylindrical molds were removed from ten (10) pervious
concrete samples and the beam molds were removed from the five (5) beam samples. These
fifteen (15) pervious concrete samples were then wrapped with the 6 mil thick polyethylene
plastic. Compressive strength test were conducted on three eight (8) by four (4) inches cylinders
on the 7th day after casting, while the remaining seven (7) cylinders and five (5) beams remained
in the plastic confines for three more weeks. After 28 days of curing, the polyethylene plastic
was removed from all the beams and the remaining cylinders and each sample was weighed.
Porosity and void ratio experiments and calculations were also performed on the seven
(7) pervious concrete cylinders. The mix design, as provided by the manufacturer, for the test
cell P.C sample is shown in Table 1Error! Reference source not found.. Seventeen (17)
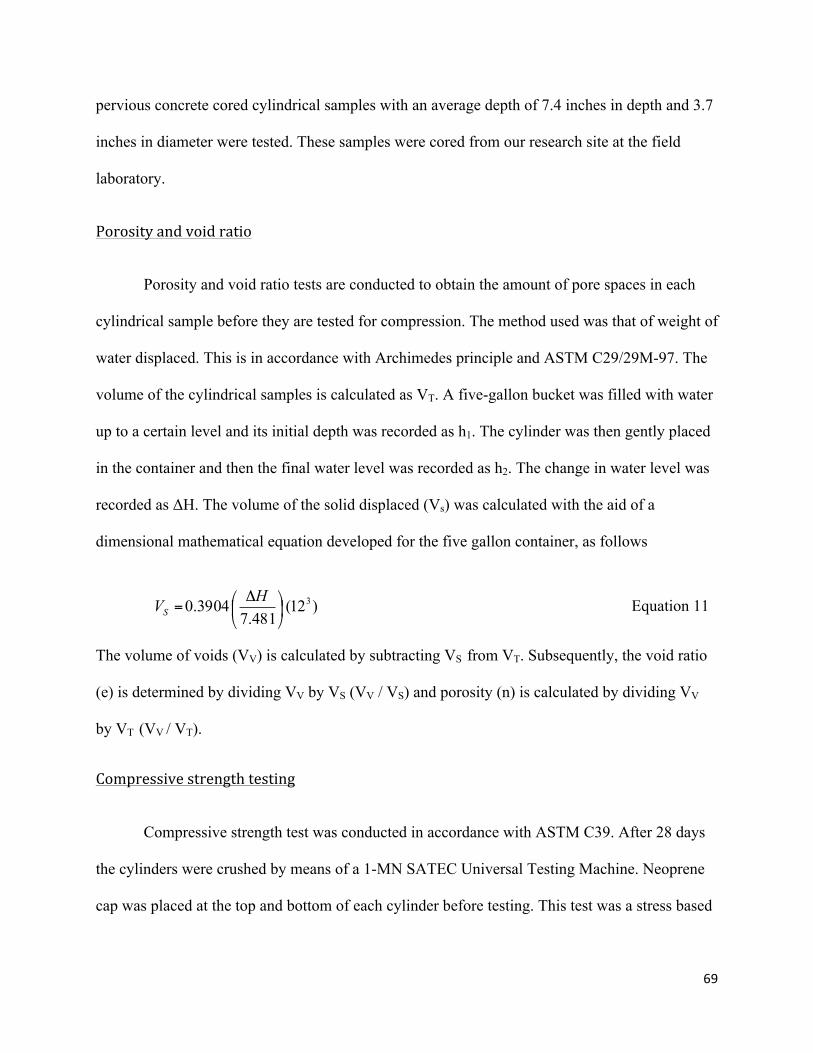
69
pervious concrete cored cylindrical samples with an average depth of 7.4 inches in depth and 3.7
inches in diameter were tested. These samples were cored from our research site at the field
laboratory.
Porosity and void ratio
Porosity and void ratio tests are conducted to obtain the amount of pore spaces in each
cylindrical sample before they are tested for compression. The method used was that of weight of
water displaced. This is in accordance with Archimedes principle and ASTM C29/29M-97. The
volume of the cylindrical samples is calculated as VT. A five-gallon bucket was filled with water
up to a certain level and its initial depth was recorded as h1. The cylinder was then gently placed
in the container and then the final water level was recorded as h2. The change in water level was
recorded as ΔH. The volume of the solid displaced (Vs) was calculated with the aid of a
dimensional mathematical equation developed for the five gallon container, as follows
)12(481.7
3904.0 3⎟⎠
⎞⎜⎝
⎛ Δ=
HVS Equation 11
The volume of voids (VV) is calculated by subtracting VS from VT. Subsequently, the void ratio
(e) is determined by dividing VV by VS (VV / VS) and porosity (n) is calculated by dividing VV
by VT (VV / VT).
Compressive strength testing
Compressive strength test was conducted in accordance with ASTM C39. After 28 days
the cylinders were crushed by means of a 1-MN SATEC Universal Testing Machine. Neoprene
cap was placed at the top and bottom of each cylinder before testing. This test was a stress based

70
test, where each sample was loaded at a rate of 35 psi/sec until fail occurred. The data obtained
was recorded as applied load (in pounds) and displacement (in inches).
Flexural strength testing
Flexural strength test was conducted in accordance with ASTM C78-02. This test was
performed using the SATEC 1-MN load cell. After the 28 day curing period, the beams were
placed on a flexural attachment which has two nose load applying points and two lower supports
blocks. This test was carried out with a loading rate of 4500 lb/min till failure occurred. The
modulus of rupture was measured from this flexural strength test.
Field Testing
Falling Weight Deflectometer
The Falling weight deflectometer (FWD) is a non-destructive field testing apparatus used for the
evaluation of the structural condition and modulus of pavements. It is made up of a trailer
mounted falling weight system, which is capable of loading a pavement in such a way that
wheel/traffic loads are simulated, in both magnitude and duration.
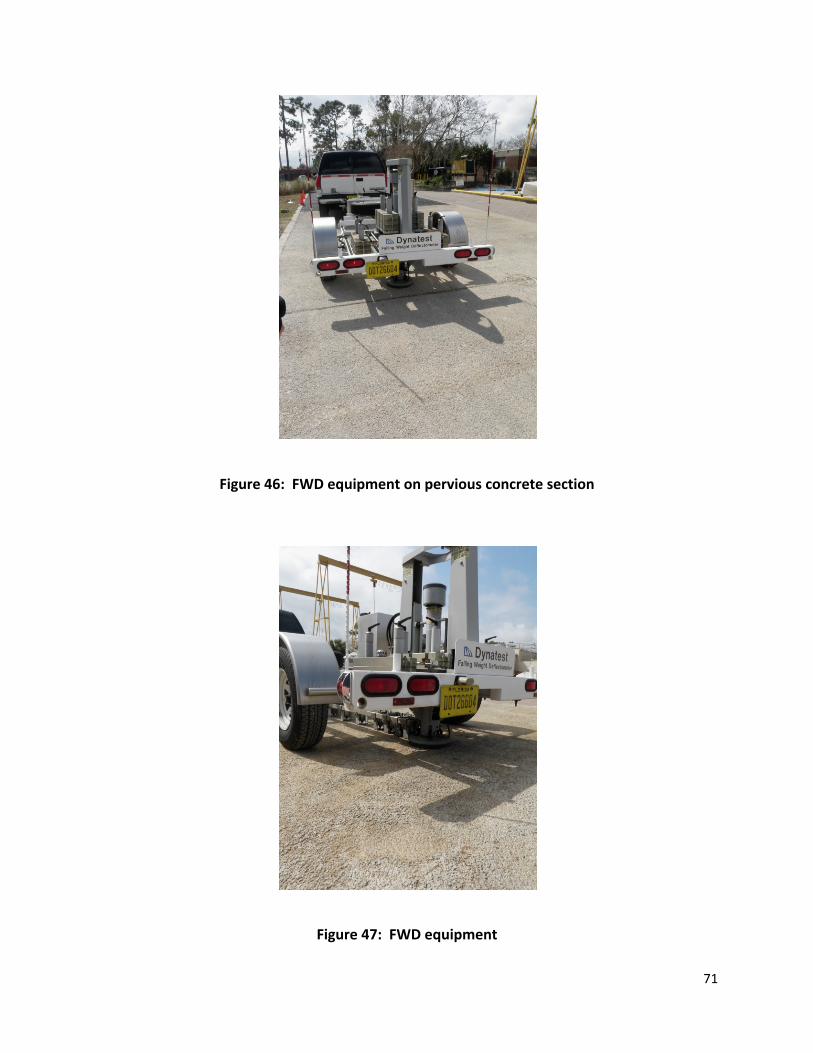
71
Figure 46: FWD equipment on pervious concrete section
Figure 47: FWD equipment
72
An impulse load is generated by dropping a mass (ranging from 6.7 – 156 KN or 1506.2
– 35,068.8 lbs) from three different heights. The mass is raised hydraulically and is then
released by an electrical signal and dropped with a buffer system on a 12-inch (300-mm)
diameter rigid steel plate. When this load is dropped a series of sensors resting on the pavements
surface at different distances from the point of impact picks up the vertical deflections caused by
dropping the mass. The deflection responses are recorded by the data acquisition system located
in the tow vehicle. Deflection is measured in “mils”, which are thousandths of an inch. FWD
deflection basins are then used to determine rehabilitation strategies for pavements and pavement
system capability under estimated traffic loads.
Back-‐Calculation Program
The traditional method for interpreting the FWD data is to back-calculate structural
pavement properties (Turkiyyah, 2004) which entails extracting the peak deflection from each
displacement trace of the sensors (deflection basin) and matching it, through an iterative
optimization method, to the calculated deflections of an equivalent pavement response model
with synthetic moduli (Goktepe, et al., 2006). Iterations are continually performed until a close
match between the measured and calculated/predicted deflection values are attained.
Back-calculation of layer moduli of pavement layers is an application of Non-destructive
testing (NDT). It involves measuring the deflection basin and varying moduli values until the
best fit between the calculated and measured deflection is reached. This is a standard method
presently used for pavement evaluation. According to Huang (2004), there is presently no
backcalcualtion method that will give reasonable moduli values for every measured deflection
basin.
73
The Modulus 6.0 microcomputer program (Liu, et al., 2001) is one of the available
programs that back-calculates layer moduli. This software is used by most DOTs here in the
U.S. The Texas Transportation Institute (TTI) developed this computer program and it can be
used to analyze 2, 3 or 4 layered structures. A linear-elastic program called WESLEA can then
be utilized to produce a deflection basin database by assuming various modulus ratios. Huang
(2004) describes a search routine that fits calculated deflection basins and measured deflection
basins. Finally, after mathematical manipulations, the modulus can be expressed as:
∑=
∑=
=s
1i)m
iωifif(
s
1i2)m
iωifif(ifaq
nE
Equation 12
Where:
fi are functions generated from the database
q is contact pressure
ωim is measured deflection at sensor i
a is the contact radius
Determination of Layer Coefficients and Structural Number
The layer coefficient (ai) and structural number (SN) can be estimated from the deflection
data obtained from FWD testing. According to (AASHTO, 1993), the effective structural
number SNeff is evaluated by using a linear elastic model which depends on a two layer structure.
SNeff is determined first before the layer coefficients of the different pavement layers. The
effective total structural number can be expressed as:
3ppeff E0.0045hSN = Equation 13
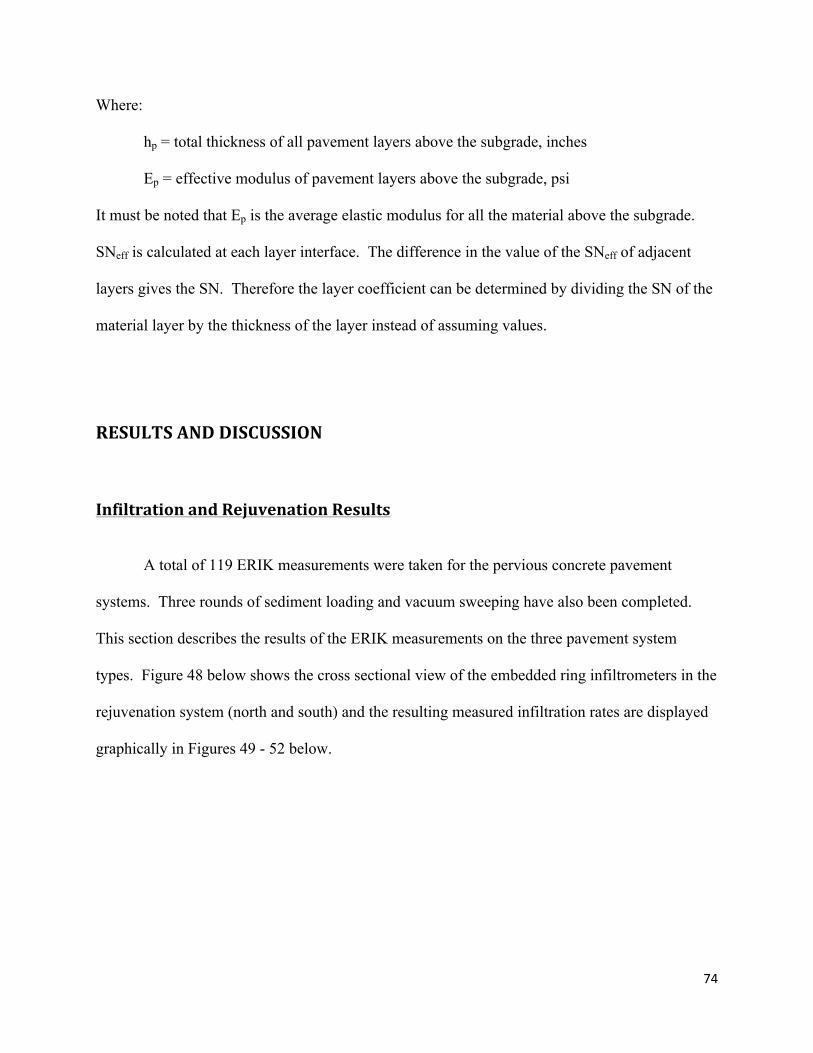
74
Where:
hp = total thickness of all pavement layers above the subgrade, inches
Ep = effective modulus of pavement layers above the subgrade, psi
It must be noted that Ep is the average elastic modulus for all the material above the subgrade.
SNeff is calculated at each layer interface. The difference in the value of the SNeff of adjacent
layers gives the SN. Therefore the layer coefficient can be determined by dividing the SN of the
material layer by the thickness of the layer instead of assuming values.
RESULTS AND DISCUSSION
Infiltration and Rejuvenation Results
A total of 119 ERIK measurements were taken for the pervious concrete pavement
systems. Three rounds of sediment loading and vacuum sweeping have also been completed.
This section describes the results of the ERIK measurements on the three pavement system
types. Figure 48 below shows the cross sectional view of the embedded ring infiltrometers in the
rejuvenation system (north and south) and the resulting measured infiltration rates are displayed
graphically in Figures 49 - 52 below.
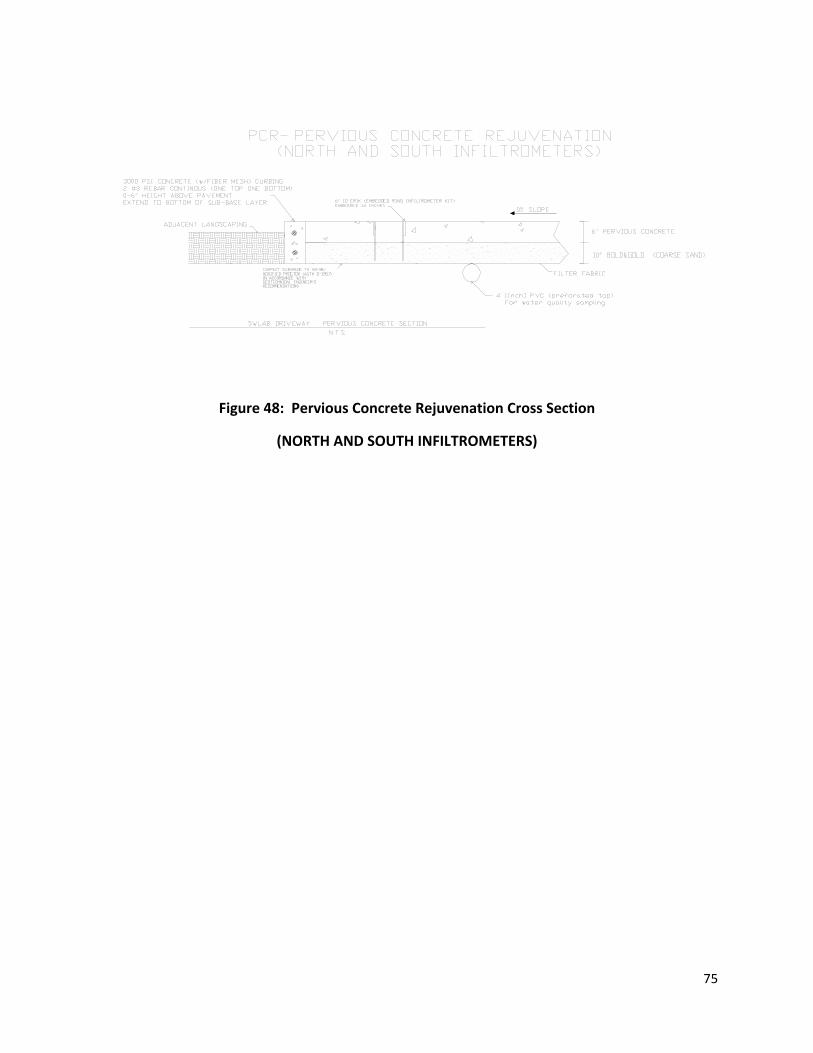
75
Figure 48: Pervious Concrete Rejuvenation Cross Section
(NORTH AND SOUTH INFILTROMETERS)
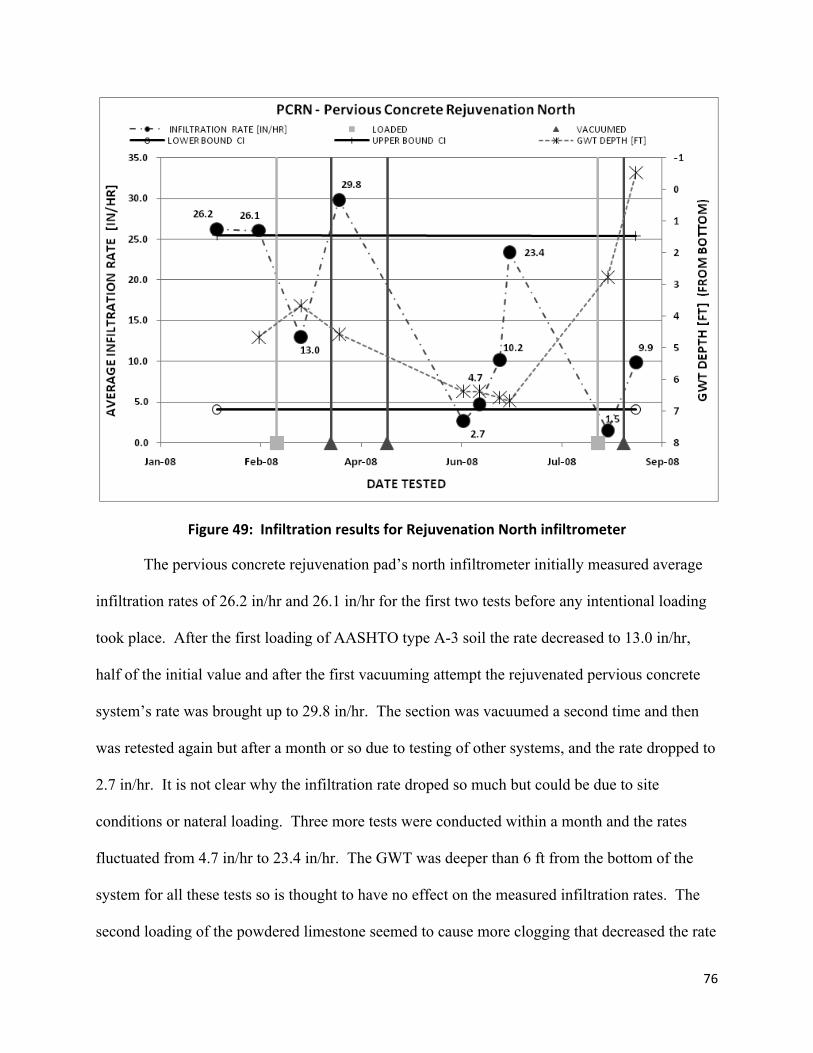
76
Figure 49: Infiltration results for Rejuvenation North infiltrometer
The pervious concrete rejuvenation pad’s north infiltrometer initially measured average
infiltration rates of 26.2 in/hr and 26.1 in/hr for the first two tests before any intentional loading
took place. After the first loading of AASHTO type A-3 soil the rate decreased to 13.0 in/hr,
half of the initial value and after the first vacuuming attempt the rejuvenated pervious concrete
system’s rate was brought up to 29.8 in/hr. The section was vacuumed a second time and then
was retested again but after a month or so due to testing of other systems, and the rate dropped to
2.7 in/hr. It is not clear why the infiltration rate droped so much but could be due to site
conditions or nateral loading. Three more tests were conducted within a month and the rates
fluctuated from 4.7 in/hr to 23.4 in/hr. The GWT was deeper than 6 ft from the bottom of the
system for all these tests so is thought to have no effect on the measured infiltration rates. The
second loading of the powdered limestone seemed to cause more clogging that decreased the rate
77
to 1.5 in/hr. However, the vacuuming restored the performance of the system back to 9.9 in/hr
even when the GWT depth had risen above the bottom of the pervious concrete system.
Figure 50: Infiltration results for New Rejuvenation North infiltrometer
After seven months of testing the pervious concrete rejuvenation pad was replaced with
new pervious concrete to see if a different mix and placement would give similar results for the
exact same location and sub-base. The new pervious concrete placement appeared to be a tighter
mix than the first, with less visible surface pores either due to the mix itself or the placement of
the new mix. The initial results agreed with this hypothesis given results of 3.8, 4.7, and 4.1
in/hr for the first three initial tests. The new pavement was loaded with the A-3 site soils in the
same manner as above with repeated cycles of washing in and compaction. Subsequent testing
indicated that the sand clogged pavement’s rate dropped down to 2.0 in/hr which was lower than
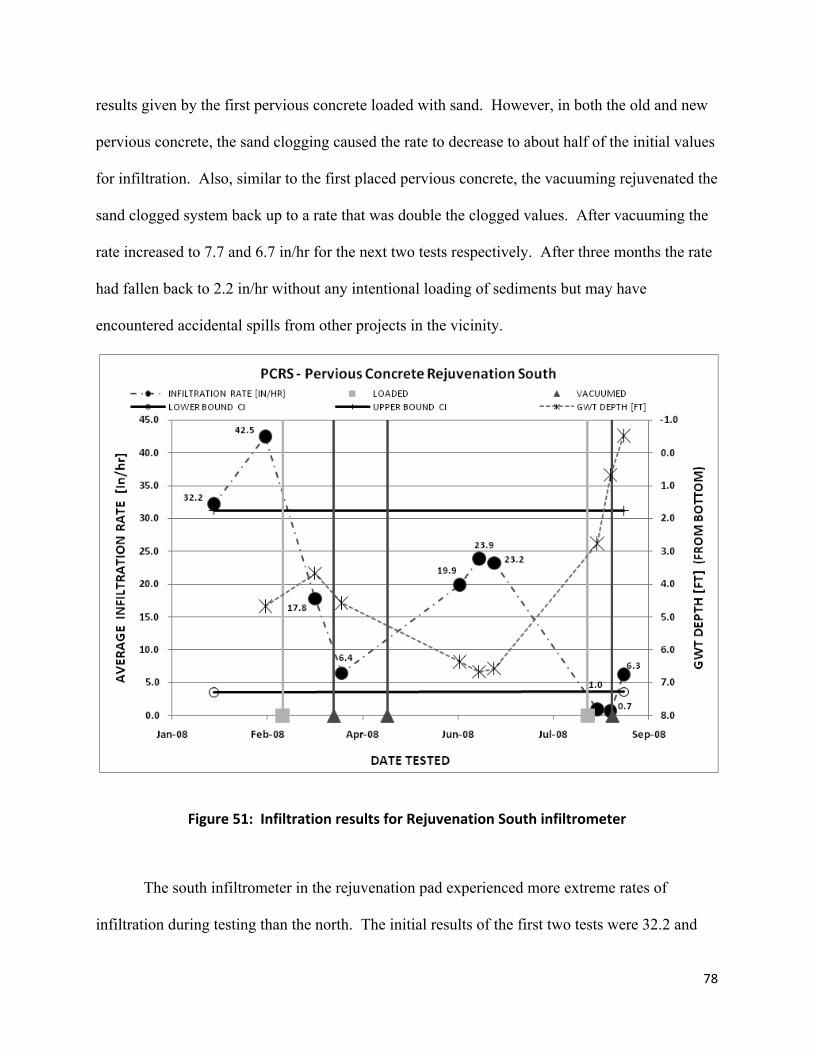
78
results given by the first pervious concrete loaded with sand. However, in both the old and new
pervious concrete, the sand clogging caused the rate to decrease to about half of the initial values
for infiltration. Also, similar to the first placed pervious concrete, the vacuuming rejuvenated the
sand clogged system back up to a rate that was double the clogged values. After vacuuming the
rate increased to 7.7 and 6.7 in/hr for the next two tests respectively. After three months the rate
had fallen back to 2.2 in/hr without any intentional loading of sediments but may have
encountered accidental spills from other projects in the vicinity.
Figure 51: Infiltration results for Rejuvenation South infiltrometer
The south infiltrometer in the rejuvenation pad experienced more extreme rates of
infiltration during testing than the north. The initial results of the first two tests were 32.2 and
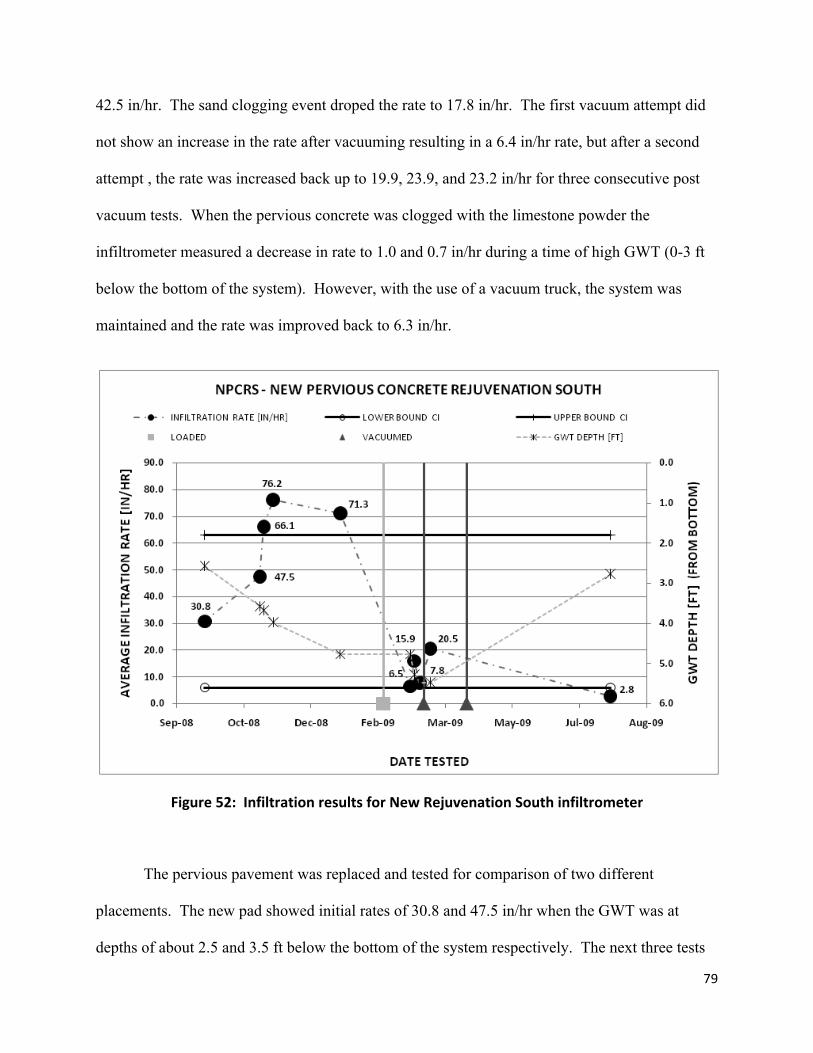
79
42.5 in/hr. The sand clogging event droped the rate to 17.8 in/hr. The first vacuum attempt did
not show an increase in the rate after vacuuming resulting in a 6.4 in/hr rate, but after a second
attempt , the rate was increased back up to 19.9, 23.9, and 23.2 in/hr for three consecutive post
vacuum tests. When the pervious concrete was clogged with the limestone powder the
infiltrometer measured a decrease in rate to 1.0 and 0.7 in/hr during a time of high GWT (0-3 ft
below the bottom of the system). However, with the use of a vacuum truck, the system was
maintained and the rate was improved back to 6.3 in/hr.
Figure 52: Infiltration results for New Rejuvenation South infiltrometer
The pervious pavement was replaced and tested for comparison of two different
placements. The new pad showed initial rates of 30.8 and 47.5 in/hr when the GWT was at
depths of about 2.5 and 3.5 ft below the bottom of the system respectively. The next three tests
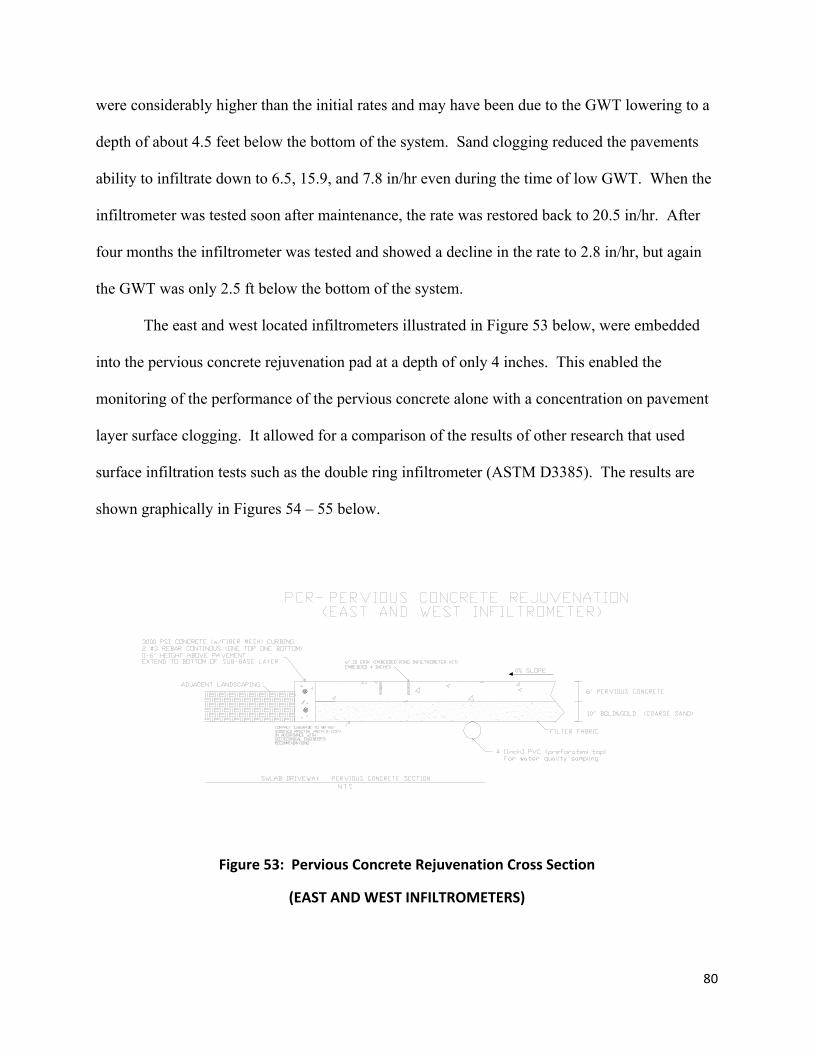
80
were considerably higher than the initial rates and may have been due to the GWT lowering to a
depth of about 4.5 feet below the bottom of the system. Sand clogging reduced the pavements
ability to infiltrate down to 6.5, 15.9, and 7.8 in/hr even during the time of low GWT. When the
infiltrometer was tested soon after maintenance, the rate was restored back to 20.5 in/hr. After
four months the infiltrometer was tested and showed a decline in the rate to 2.8 in/hr, but again
the GWT was only 2.5 ft below the bottom of the system.
The east and west located infiltrometers illustrated in Figure 53 below, were embedded
into the pervious concrete rejuvenation pad at a depth of only 4 inches. This enabled the
monitoring of the performance of the pervious concrete alone with a concentration on pavement
layer surface clogging. It allowed for a comparison of the results of other research that used
surface infiltration tests such as the double ring infiltrometer (ASTM D3385). The results are
shown graphically in Figures 54 – 55 below.
Figure 53: Pervious Concrete Rejuvenation Cross Section
(EAST AND WEST INFILTROMETERS)
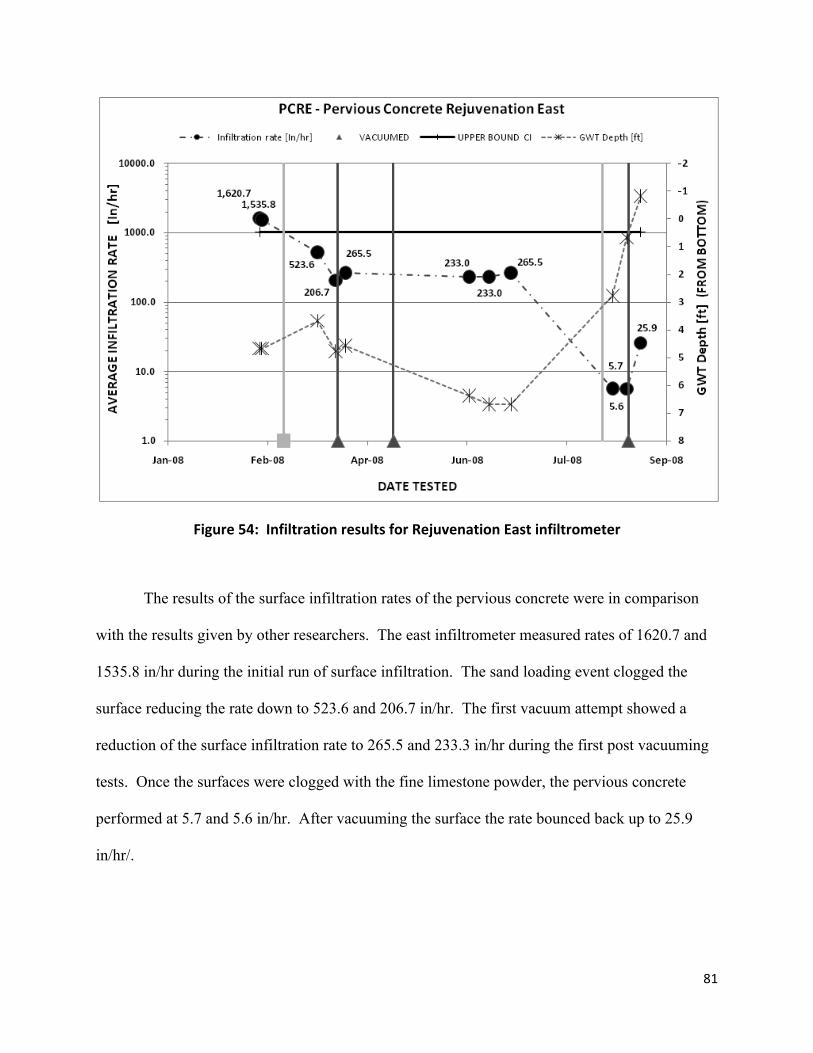
81
Figure 54: Infiltration results for Rejuvenation East infiltrometer
The results of the surface infiltration rates of the pervious concrete were in comparison
with the results given by other researchers. The east infiltrometer measured rates of 1620.7 and
1535.8 in/hr during the initial run of surface infiltration. The sand loading event clogged the
surface reducing the rate down to 523.6 and 206.7 in/hr. The first vacuum attempt showed a
reduction of the surface infiltration rate to 265.5 and 233.3 in/hr during the first post vacuuming
tests. Once the surfaces were clogged with the fine limestone powder, the pervious concrete
performed at 5.7 and 5.6 in/hr. After vacuuming the surface the rate bounced back up to 25.9
in/hr/.
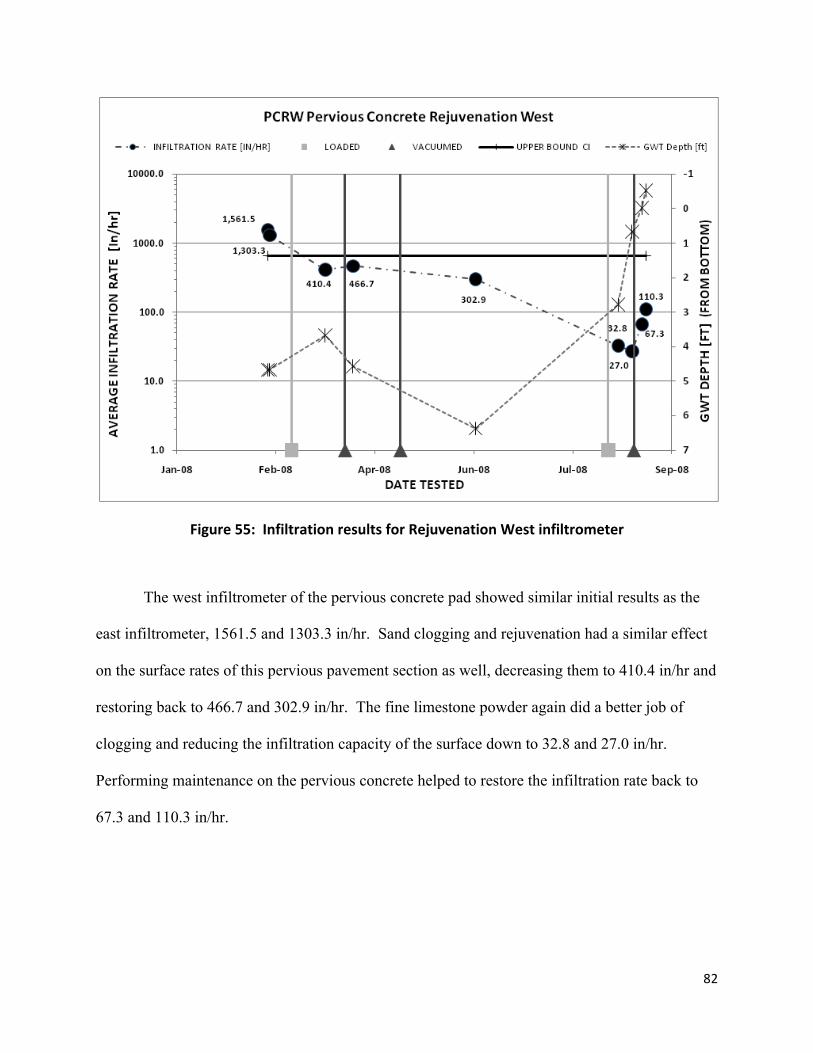
82
Figure 55: Infiltration results for Rejuvenation West infiltrometer
The west infiltrometer of the pervious concrete pad showed similar initial results as the
east infiltrometer, 1561.5 and 1303.3 in/hr. Sand clogging and rejuvenation had a similar effect
on the surface rates of this pervious pavement section as well, decreasing them to 410.4 in/hr and
restoring back to 466.7 and 302.9 in/hr. The fine limestone powder again did a better job of
clogging and reducing the infiltration capacity of the surface down to 32.8 and 27.0 in/hr.
Performing maintenance on the pervious concrete helped to restore the infiltration rate back to
67.3 and 110.3 in/hr.
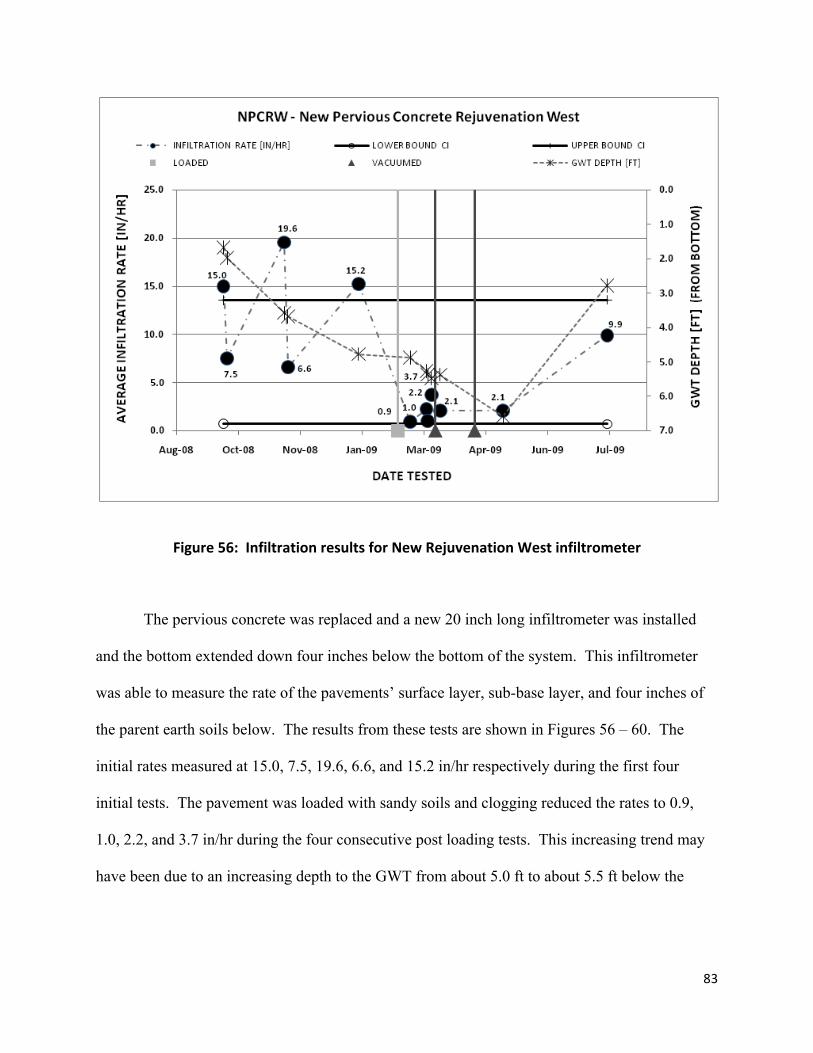
83
Figure 56: Infiltration results for New Rejuvenation West infiltrometer
The pervious concrete was replaced and a new 20 inch long infiltrometer was installed
and the bottom extended down four inches below the bottom of the system. This infiltrometer
was able to measure the rate of the pavements’ surface layer, sub-base layer, and four inches of
the parent earth soils below. The results from these tests are shown in Figures 56 – 60. The
initial rates measured at 15.0, 7.5, 19.6, 6.6, and 15.2 in/hr respectively during the first four
initial tests. The pavement was loaded with sandy soils and clogging reduced the rates to 0.9,
1.0, 2.2, and 3.7 in/hr during the four consecutive post loading tests. This increasing trend may
have been due to an increasing depth to the GWT from about 5.0 ft to about 5.5 ft below the
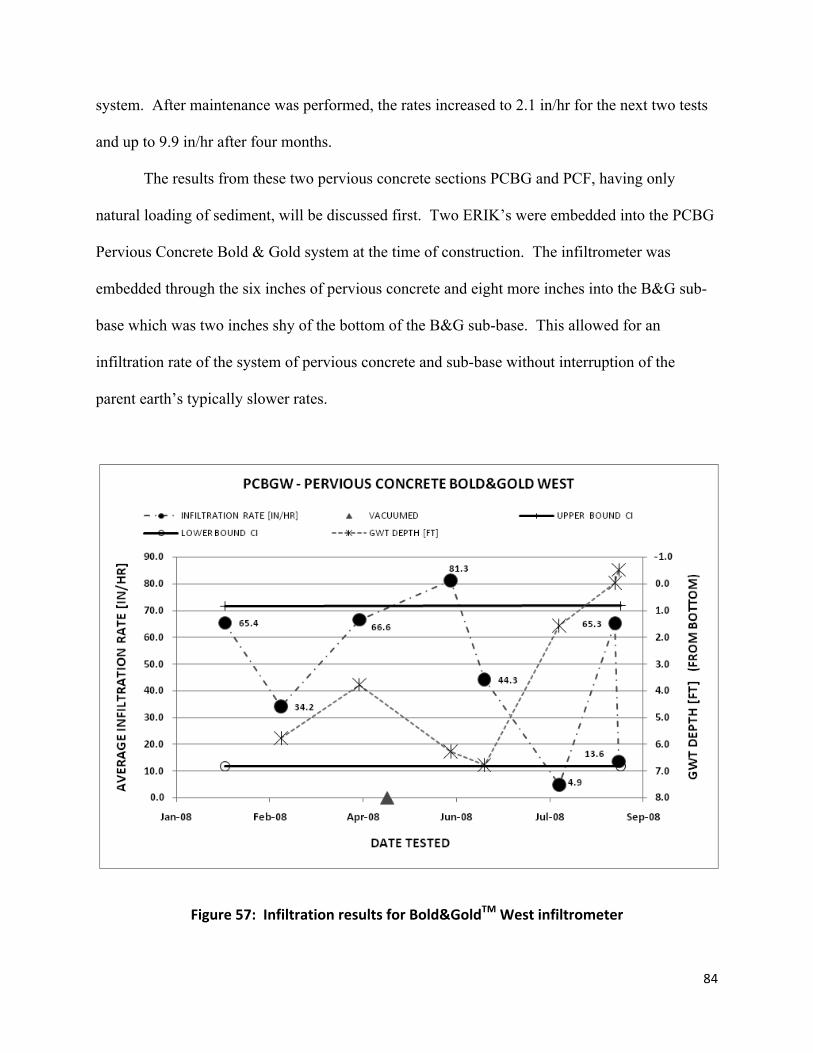
84
system. After maintenance was performed, the rates increased to 2.1 in/hr for the next two tests
and up to 9.9 in/hr after four months.
The results from these two pervious concrete sections PCBG and PCF, having only
natural loading of sediment, will be discussed first. Two ERIK’s were embedded into the PCBG
Pervious Concrete Bold & Gold system at the time of construction. The infiltrometer was
embedded through the six inches of pervious concrete and eight more inches into the B&G sub-
base which was two inches shy of the bottom of the B&G sub-base. This allowed for an
infiltration rate of the system of pervious concrete and sub-base without interruption of the
parent earth’s typically slower rates.
Figure 57: Infiltration results for Bold&GoldTM West infiltrometer
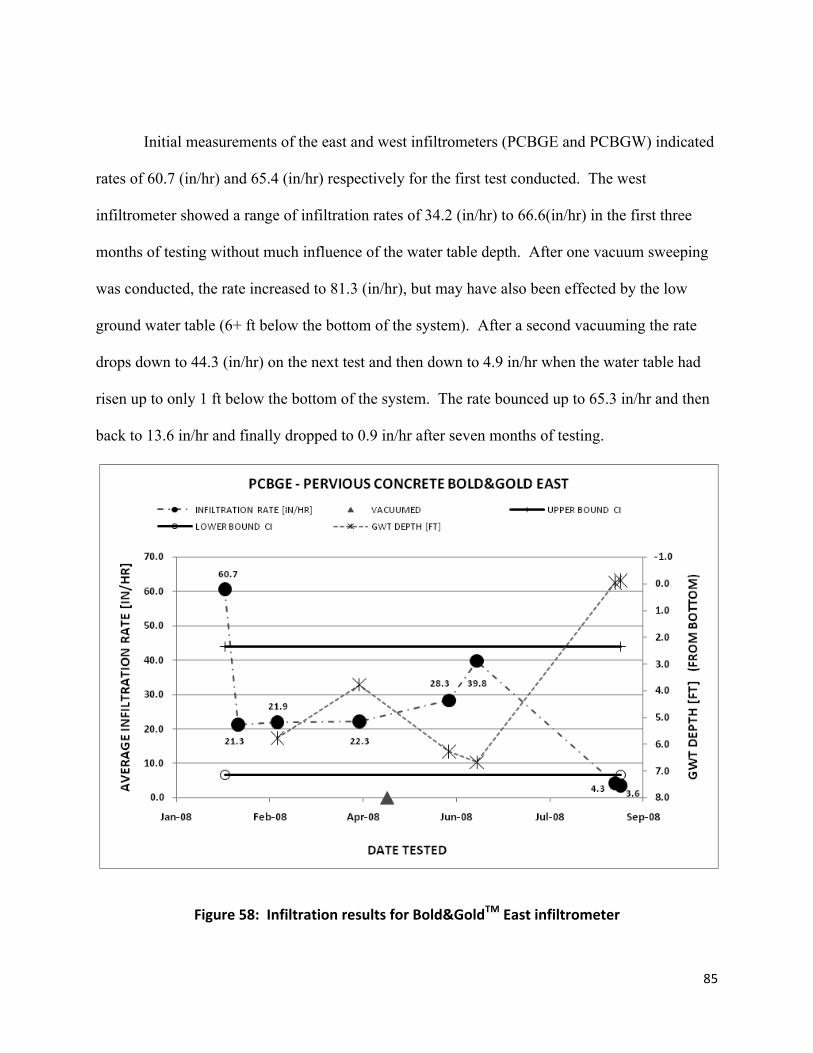
85
Initial measurements of the east and west infiltrometers (PCBGE and PCBGW) indicated
rates of 60.7 (in/hr) and 65.4 (in/hr) respectively for the first test conducted. The west
infiltrometer showed a range of infiltration rates of 34.2 (in/hr) to 66.6(in/hr) in the first three
months of testing without much influence of the water table depth. After one vacuum sweeping
was conducted, the rate increased to 81.3 (in/hr), but may have also been effected by the low
ground water table (6+ ft below the bottom of the system). After a second vacuuming the rate
drops down to 44.3 (in/hr) on the next test and then down to 4.9 in/hr when the water table had
risen up to only 1 ft below the bottom of the system. The rate bounced up to 65.3 in/hr and then
back to 13.6 in/hr and finally dropped to 0.9 in/hr after seven months of testing.
Figure 58: Infiltration results for Bold&GoldTM East infiltrometer
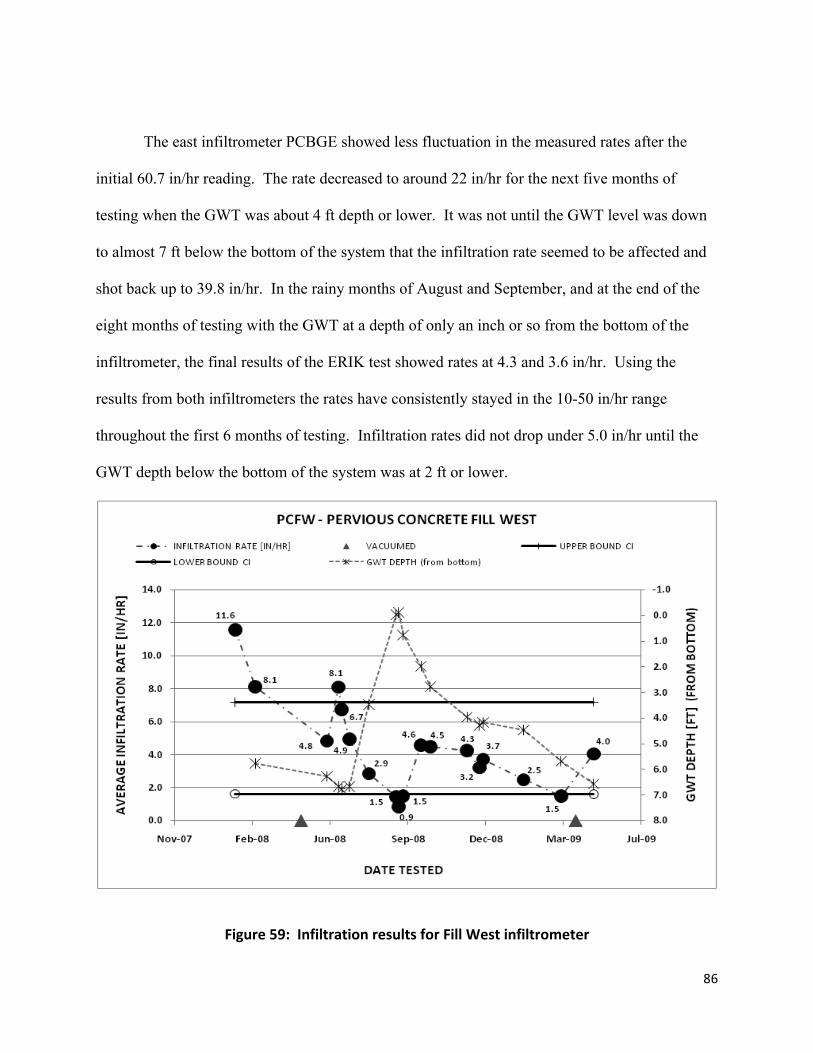
86
The east infiltrometer PCBGE showed less fluctuation in the measured rates after the
initial 60.7 in/hr reading. The rate decreased to around 22 in/hr for the next five months of
testing when the GWT was about 4 ft depth or lower. It was not until the GWT level was down
to almost 7 ft below the bottom of the system that the infiltration rate seemed to be affected and
shot back up to 39.8 in/hr. In the rainy months of August and September, and at the end of the
eight months of testing with the GWT at a depth of only an inch or so from the bottom of the
infiltrometer, the final results of the ERIK test showed rates at 4.3 and 3.6 in/hr. Using the
results from both infiltrometers the rates have consistently stayed in the 10-50 in/hr range
throughout the first 6 months of testing. Infiltration rates did not drop under 5.0 in/hr until the
GWT depth below the bottom of the system was at 2 ft or lower.
Figure 59: Infiltration results for Fill West infiltrometer
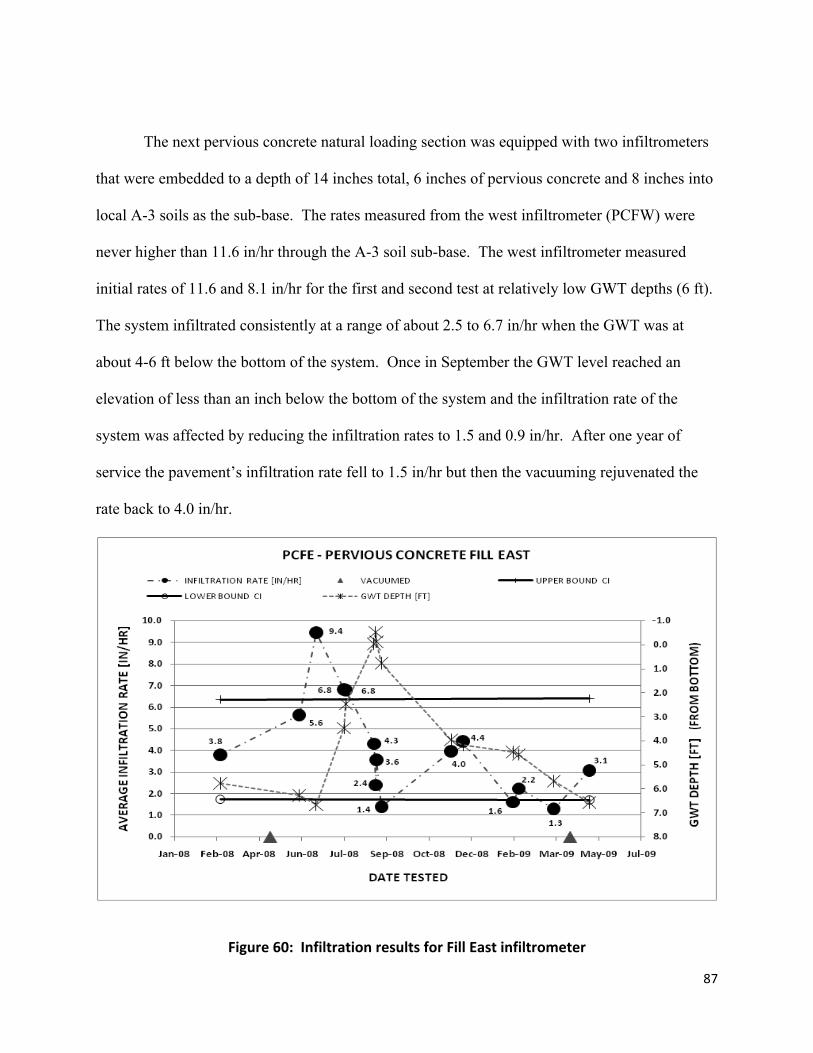
87
The next pervious concrete natural loading section was equipped with two infiltrometers
that were embedded to a depth of 14 inches total, 6 inches of pervious concrete and 8 inches into
local A-3 soils as the sub-base. The rates measured from the west infiltrometer (PCFW) were
never higher than 11.6 in/hr through the A-3 soil sub-base. The west infiltrometer measured
initial rates of 11.6 and 8.1 in/hr for the first and second test at relatively low GWT depths (6 ft).
The system infiltrated consistently at a range of about 2.5 to 6.7 in/hr when the GWT was at
about 4-6 ft below the bottom of the system. Once in September the GWT level reached an
elevation of less than an inch below the bottom of the system and the infiltration rate of the
system was affected by reducing the infiltration rates to 1.5 and 0.9 in/hr. After one year of
service the pavement’s infiltration rate fell to 1.5 in/hr but then the vacuuming rejuvenated the
rate back to 4.0 in/hr.
Figure 60: Infiltration results for Fill East infiltrometer
88
The east infiltrometer initially recorded a rate of 3.8 in/hr after installation. The
pavement was vacuumed and rates increased to 5.6 then 9.4 in/hr during a period of low GWT
depth. During the rainy season the GWT had risen to 3.5 ft, 2.5 ft, and eventually up to less than
1 ft below the bottom of the system. This high GWT resulted in the decrease of infiltration rates
from 4.3, and 3.6 in/hr, and finally down to 2.4 and 1.4 in/hr during the next four consecutive
tests. After two months the GWT receded down to lower depths (4+ ft below system) and the
next to tests measured rates of 4.0 and 4.4 in/hr. Later, the GWT remained low and the rates
decreased, likely from clogging of the surface down to 1.6, 2.2, and 1.3 in/hr during the next
three tests. One final vacuuming was performed on this section and measured rates indicated a
rejuvenation back to 3.1 in/hr.
Sustainable Storage Evaluation Results
The results of testing the porosities of the individual component materials are tabulated in
Table 1 below. The total porosity of the surface layer measured in the ½ gallon containers is
31.9%. This number represents the porosity of the surface layer after the materials were oven
dried, while the rest of the tests were conducted without oven drying the materials and thus can
be considered effective porosity. There is a slight difference in the total and effective porosities
measured. As reported in the Table 2, the average effective porosity value is 27.2%. This
indicates that the pervious concrete material itself dries relatively quickly recovering its storage
volume. Next, the pervious concrete material is loaded with sandy sediments to induce clogging
of the surface pores which resulted in an average effective loaded porosity of 23.4%. This
reduction in storage is due partially to the fact that some of the volume of sediment particles is
89
now occupying the once empty pore spaces. This also results in a larger number of smaller pore
sizes that retain a larger volume of moisture in the once air filled pores. In the preloaded
condition the pores were larger enough so gravity alone could more easily drain the water from
the pores allowing for quicker recovery of storage capacity. It was observed during the testing
that much of the sediments seemed to be trapped near the surface and only penetrated about an
inch to two inches downward from the surface. After vacuuming the surfaces the sediments
were extracted by the suction force with ease since much of the sediments remained near the
surfaces. Porosity measurements were taken after vacuuming the surfaces and an average
effective porosity of 27.8% was measured and recorded. This result confirms that the clogging
sediments near the top portion were effectively removed by vacuuming. This proves the surface
layer to be effective at filtering sandy sediments and preventing them from entering the sub-
layers, which may cause an eventual reduction in storage capacity of the deeper storage layers.
The advantage to having larger pore sizes is the ability of the surface layer to remain unclogged
by allowing passage of all sediments which helps prevent water from having a chance to become
runoff before infiltrating into the pervious pavement system.
The sub-base layer material is tested using the small scale ½ gallon containers were
tested for total (over dried) and effective (gravitational drainage) porosities. The Bold&GoldTM
pollution control media provided values of 38.9% total and 15.2% effective porosity averages in
the small containers.
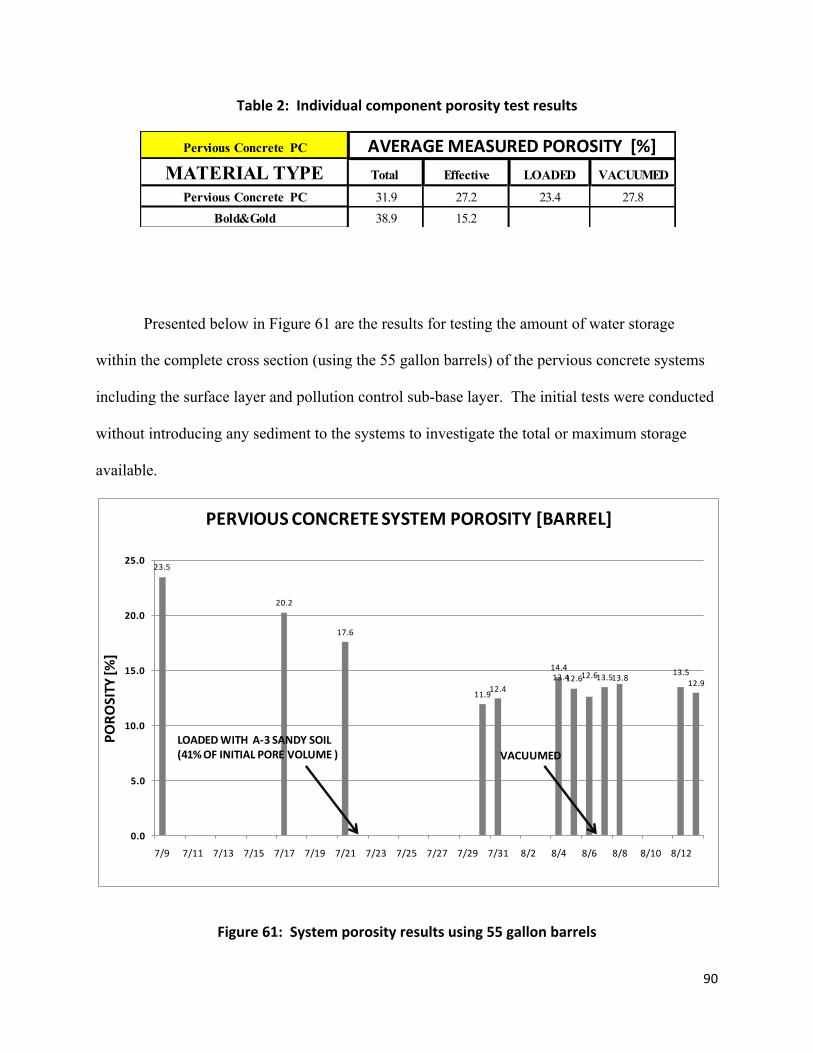
90
Table 2: Individual component porosity test results
Presented below in Figure 61 are the results for testing the amount of water storage
within the complete cross section (using the 55 gallon barrels) of the pervious concrete systems
including the surface layer and pollution control sub-base layer. The initial tests were conducted
without introducing any sediment to the systems to investigate the total or maximum storage
available.
Figure 61: System porosity results using 55 gallon barrels
Pervious Concrete PC
MATERIAL TYPE Total Effective LOADED VACUUMED
Pervious Concrete PC 31.9 27.2 23.4 27.8Bold&Gold 38.9 15.2
AVERAGE MEASURED POROSITY [%]
23.5
20.2
17.6
11.912.4
14.413.412.612.613.513.8
13.512.9
0.0
5.0
10.0
15.0
20.0
25.0
7/9 7/11 7/13 7/15 7/17 7/19 7/21 7/23 7/25 7/27 7/29 7/31 8/2 8/4 8/6 8/8 8/10 8/12
PORO
SITY [%
]
PERVIOUS CONCRETE SYSTEM POROSITY [BARREL]
LOADEDWITH A-‐3 SANDY SOIL(41% OF INITIAL PORE VOLUME ) VACUUMED
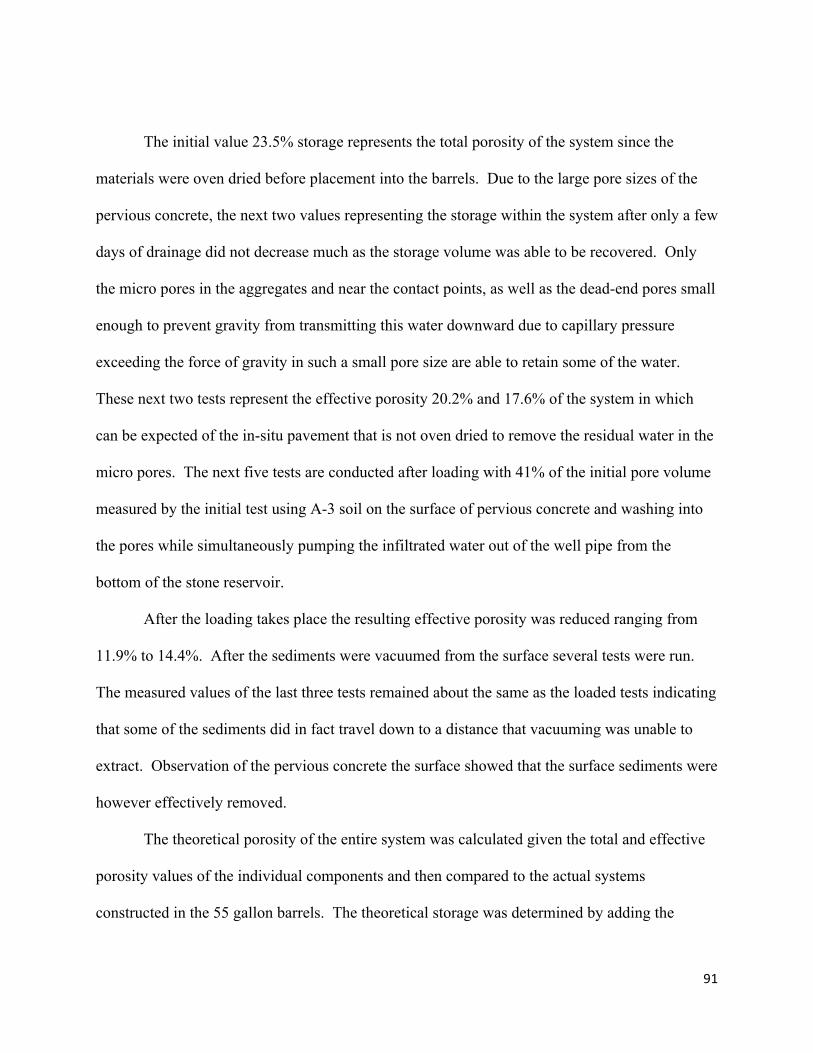
91
The initial value 23.5% storage represents the total porosity of the system since the
materials were oven dried before placement into the barrels. Due to the large pore sizes of the
pervious concrete, the next two values representing the storage within the system after only a few
days of drainage did not decrease much as the storage volume was able to be recovered. Only
the micro pores in the aggregates and near the contact points, as well as the dead-end pores small
enough to prevent gravity from transmitting this water downward due to capillary pressure
exceeding the force of gravity in such a small pore size are able to retain some of the water.
These next two tests represent the effective porosity 20.2% and 17.6% of the system in which
can be expected of the in-situ pavement that is not oven dried to remove the residual water in the
micro pores. The next five tests are conducted after loading with 41% of the initial pore volume
measured by the initial test using A-3 soil on the surface of pervious concrete and washing into
the pores while simultaneously pumping the infiltrated water out of the well pipe from the
bottom of the stone reservoir.
After the loading takes place the resulting effective porosity was reduced ranging from
11.9% to 14.4%. After the sediments were vacuumed from the surface several tests were run.
The measured values of the last three tests remained about the same as the loaded tests indicating
that some of the sediments did in fact travel down to a distance that vacuuming was unable to
extract. Observation of the pervious concrete the surface showed that the surface sediments were
however effectively removed.
The theoretical porosity of the entire system was calculated given the total and effective
porosity values of the individual components and then compared to the actual systems
constructed in the 55 gallon barrels. The theoretical storage was determined by adding the
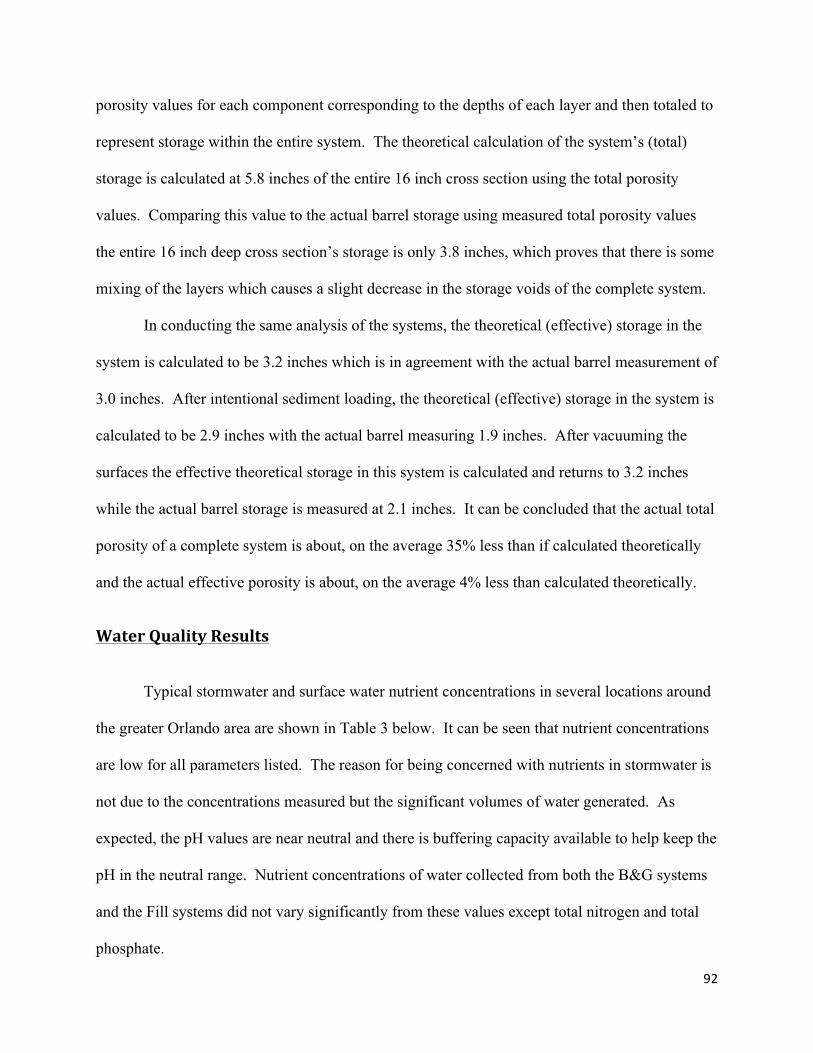
92
porosity values for each component corresponding to the depths of each layer and then totaled to
represent storage within the entire system. The theoretical calculation of the system’s (total)
storage is calculated at 5.8 inches of the entire 16 inch cross section using the total porosity
values. Comparing this value to the actual barrel storage using measured total porosity values
the entire 16 inch deep cross section’s storage is only 3.8 inches, which proves that there is some
mixing of the layers which causes a slight decrease in the storage voids of the complete system.
In conducting the same analysis of the systems, the theoretical (effective) storage in the
system is calculated to be 3.2 inches which is in agreement with the actual barrel measurement of
3.0 inches. After intentional sediment loading, the theoretical (effective) storage in the system is
calculated to be 2.9 inches with the actual barrel measuring 1.9 inches. After vacuuming the
surfaces the effective theoretical storage in this system is calculated and returns to 3.2 inches
while the actual barrel storage is measured at 2.1 inches. It can be concluded that the actual total
porosity of a complete system is about, on the average 35% less than if calculated theoretically
and the actual effective porosity is about, on the average 4% less than calculated theoretically.
Water Quality Results
Typical stormwater and surface water nutrient concentrations in several locations around
the greater Orlando area are shown in Table 3 below. It can be seen that nutrient concentrations
are low for all parameters listed. The reason for being concerned with nutrients in stormwater is
not due to the concentrations measured but the significant volumes of water generated. As
expected, the pH values are near neutral and there is buffering capacity available to help keep the
pH in the neutral range. Nutrient concentrations of water collected from both the B&G systems
and the Fill systems did not vary significantly from these values except total nitrogen and total
phosphate.
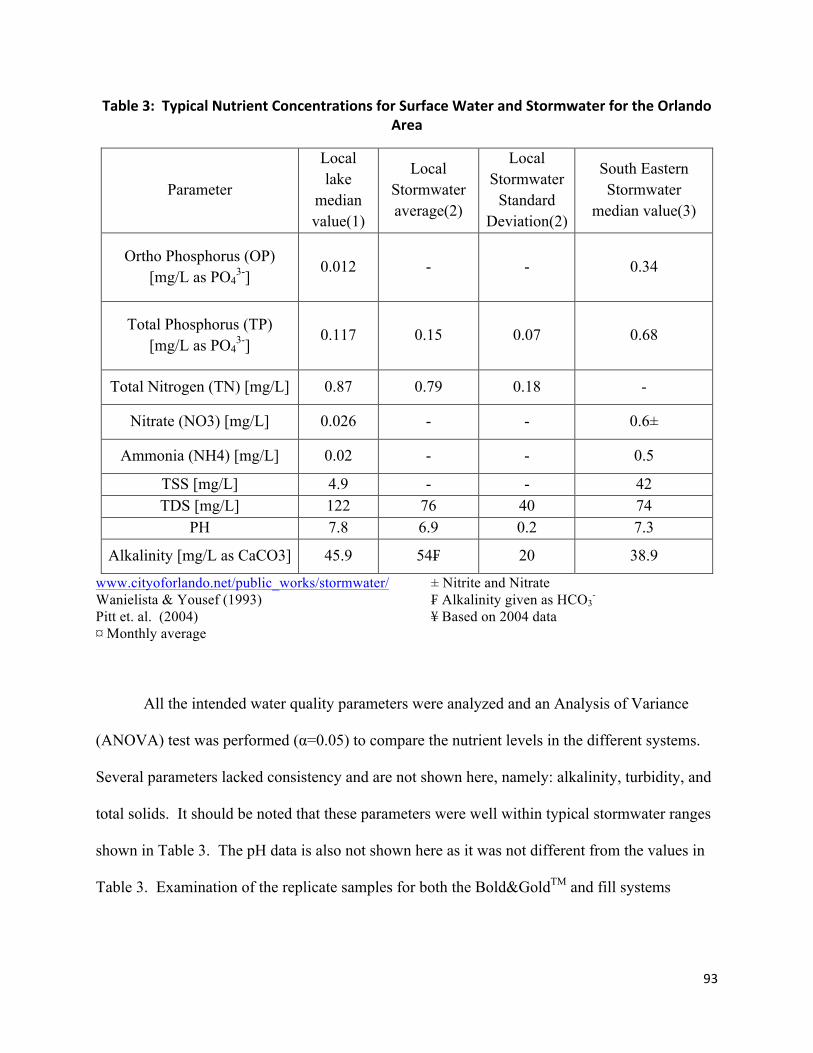
93
Table 3: Typical Nutrient Concentrations for Surface Water and Stormwater for the Orlando Area
Parameter
Local lake
median value(1)
Local Stormwater average(2)
Local Stormwater
Standard Deviation(2)
South Eastern Stormwater
median value(3)
Ortho Phosphorus (OP) [mg/L as PO4
3-] 0.012 - - 0.34
Total Phosphorus (TP) [mg/L as PO4
3-] 0.117 0.15 0.07 0.68
Total Nitrogen (TN) [mg/L] 0.87 0.79 0.18 -
Nitrate (NO3) [mg/L] 0.026 - - 0.6±
Ammonia (NH4) [mg/L] 0.02 - - 0.5
TSS [mg/L] 4.9 - - 42 TDS [mg/L] 122 76 40 74
PH 7.8 6.9 0.2 7.3
Alkalinity [mg/L as CaCO3] 45.9 54₣ 20 38.9
www.cityoforlando.net/public_works/stormwater/ ± Nitrite and Nitrate Wanielista & Yousef (1993) ₣ Alkalinity given as HCO3
- Pitt et. al. (2004) ¥ Based on 2004 data ¤ Monthly average
All the intended water quality parameters were analyzed and an Analysis of Variance
(ANOVA) test was performed (α=0.05) to compare the nutrient levels in the different systems.
Several parameters lacked consistency and are not shown here, namely: alkalinity, turbidity, and
total solids. It should be noted that these parameters were well within typical stormwater ranges
shown in Table 3. The pH data is also not shown here as it was not different from the values in
Table 3. Examination of the replicate samples for both the Bold&GoldTM and fill systems
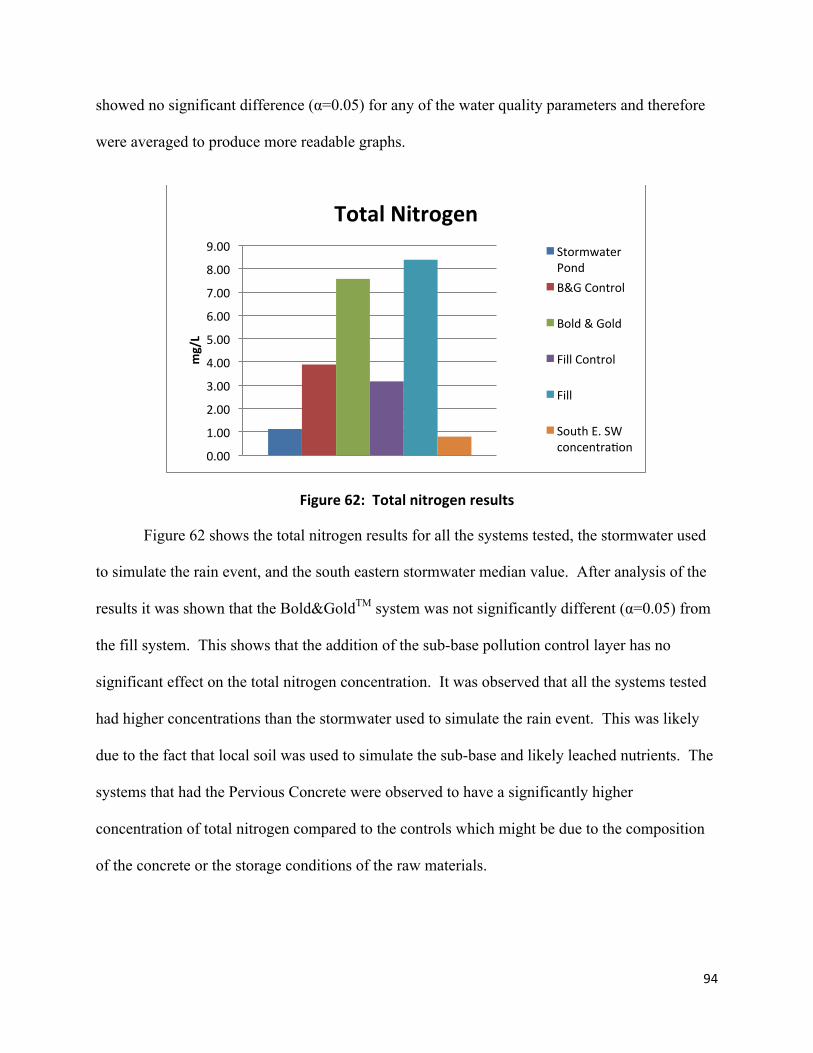
94
showed no significant difference (α=0.05) for any of the water quality parameters and therefore
were averaged to produce more readable graphs.
Figure 62: Total nitrogen results
Figure 62 shows the total nitrogen results for all the systems tested, the stormwater used
to simulate the rain event, and the south eastern stormwater median value. After analysis of the
results it was shown that the Bold&GoldTM system was not significantly different (α=0.05) from
the fill system. This shows that the addition of the sub-base pollution control layer has no
significant effect on the total nitrogen concentration. It was observed that all the systems tested
had higher concentrations than the stormwater used to simulate the rain event. This was likely
due to the fact that local soil was used to simulate the sub-base and likely leached nutrients. The
systems that had the Pervious Concrete were observed to have a significantly higher
concentration of total nitrogen compared to the controls which might be due to the composition
of the concrete or the storage conditions of the raw materials.
0.00
1.00
2.00
3.00
4.00
5.00
6.00
7.00
8.00
9.00
mg/L
Total Nitrogen Stormwater Pond B&G Control
Bold & Gold
Fill Control
Fill
South E. SW concentralon
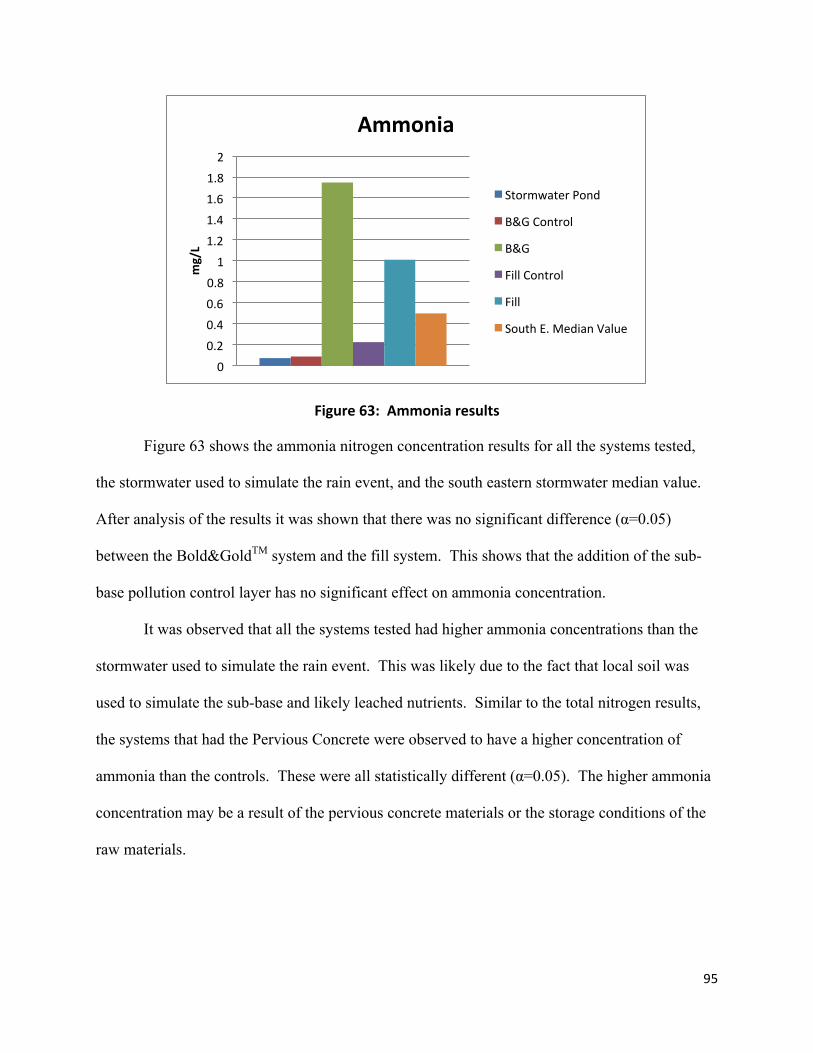
95
Figure 63: Ammonia results
Figure 63 shows the ammonia nitrogen concentration results for all the systems tested,
the stormwater used to simulate the rain event, and the south eastern stormwater median value.
After analysis of the results it was shown that there was no significant difference (α=0.05)
between the Bold&GoldTM system and the fill system. This shows that the addition of the sub-
base pollution control layer has no significant effect on ammonia concentration.
It was observed that all the systems tested had higher ammonia concentrations than the
stormwater used to simulate the rain event. This was likely due to the fact that local soil was
used to simulate the sub-base and likely leached nutrients. Similar to the total nitrogen results,
the systems that had the Pervious Concrete were observed to have a higher concentration of
ammonia than the controls. These were all statistically different (α=0.05). The higher ammonia
concentration may be a result of the pervious concrete materials or the storage conditions of the
raw materials.
0 0.2 0.4 0.6 0.8 1
1.2 1.4 1.6 1.8 2
mg/L
Ammonia
Stormwater Pond
B&G Control
B&G
Fill Control
Fill
South E. Median Value
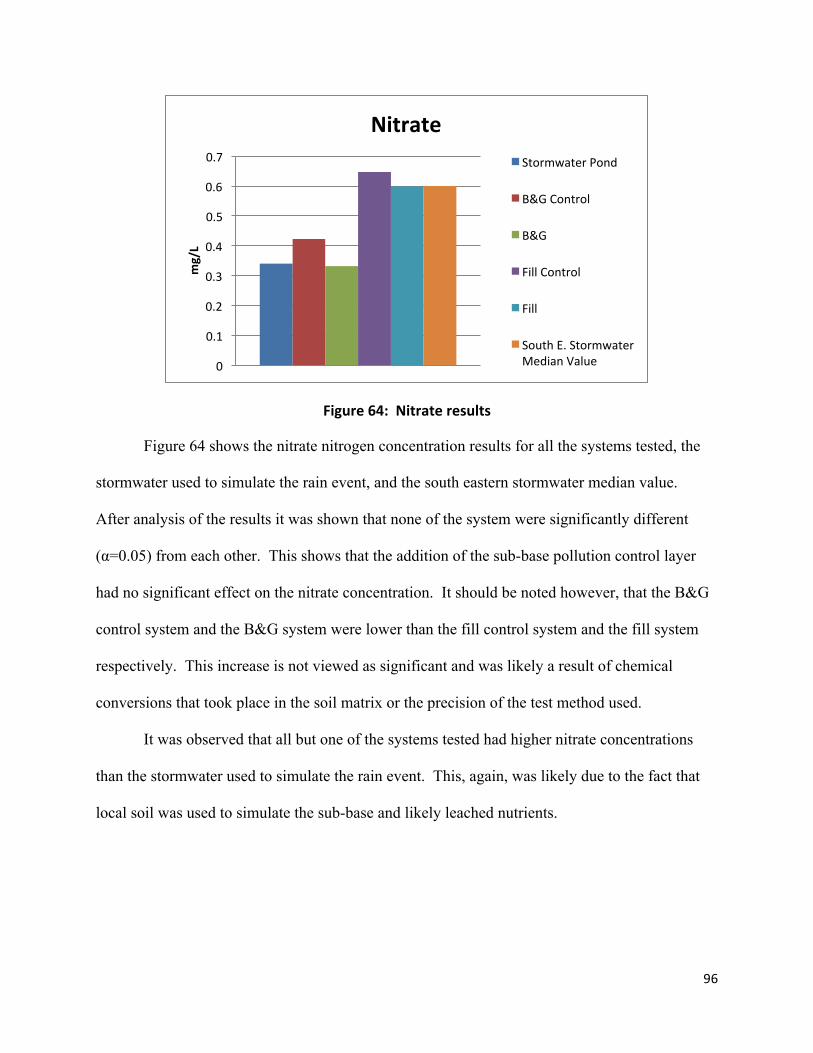
96
Figure 64: Nitrate results
Figure 64 shows the nitrate nitrogen concentration results for all the systems tested, the
stormwater used to simulate the rain event, and the south eastern stormwater median value.
After analysis of the results it was shown that none of the system were significantly different
(α=0.05) from each other. This shows that the addition of the sub-base pollution control layer
had no significant effect on the nitrate concentration. It should be noted however, that the B&G
control system and the B&G system were lower than the fill control system and the fill system
respectively. This increase is not viewed as significant and was likely a result of chemical
conversions that took place in the soil matrix or the precision of the test method used.
It was observed that all but one of the systems tested had higher nitrate concentrations
than the stormwater used to simulate the rain event. This, again, was likely due to the fact that
local soil was used to simulate the sub-base and likely leached nutrients.
0
0.1
0.2
0.3
0.4
0.5
0.6
0.7
mg/L
Nitrate Stormwater Pond
B&G Control
B&G
Fill Control
Fill
South E. Stormwater Median Value
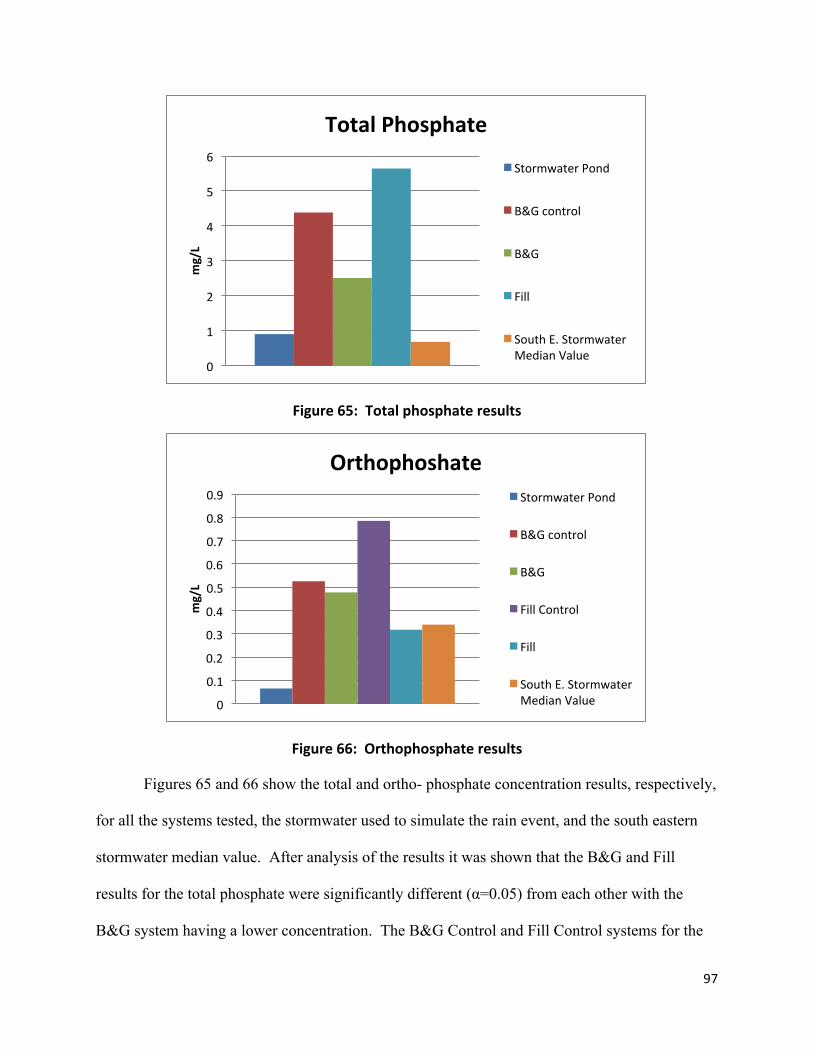
97
Figure 65: Total phosphate results
Figure 66: Orthophosphate results
Figures 65 and 66 show the total and ortho- phosphate concentration results, respectively,
for all the systems tested, the stormwater used to simulate the rain event, and the south eastern
stormwater median value. After analysis of the results it was shown that the B&G and Fill
results for the total phosphate were significantly different (α=0.05) from each other with the
B&G system having a lower concentration. The B&G Control and Fill Control systems for the
0
1
2
3
4
5
6
mg/L
Total Phosphate
Stormwater Pond
B&G control
B&G
Fill
South E. Stormwater Median Value
0
0.1
0.2
0.3
0.4
0.5
0.6
0.7
0.8
0.9
mg/L
Orthophoshate Stormwater Pond
B&G control
B&G
Fill Control
Fill
South E. Stormwater Median Value
98
orthophosphate test were also significantly different with the B&G Control having a lower
concentration. This indicates that the Bold&GoldTM pollution control media may reduce the
ortho- and total phosphate concentration of stormwater that infiltrates through the system.
It was observed that all the systems tested had higher ortho- and total phosphate
concentrations than the stormwater used to simulate the rain event. Again, this was likely due to
the fact that local soil was used to simulate the sub-base and likely leached nutrients.
Strength Results
Laboratory Testing Results
The results of the laboratory and field tests are discussed. Relationships between the compressive
strength, flexural strength, porosity are presented. In addition, a statistical analysis of the strength
parameters is provided. The results of the back-calculation and forward calculations of each
pervious pavement section are tabulated. The stress, strain and displacement of each layer of the
pavement as determined from the KENPAVE program are also presented. Comparisons of the
minimum thickness design of the flexible pavements using the AASHTO Method hand
calculation and FPS 19W program are provided.
Porosity and Unit weight
As discussed in the previous chapter, tests were conducted to evaluate the porosity and
compressive strength of the cylindrical pavement samples. The dry unit weight was also
obtained for the different pervious pavement sections. Cored and cast-in situ pervious concrete
cylinders were tested. The average depth of the core sample was 7.4 in. while the width was 3.7
99
in., so a correction factor was implemented when calculating the compressive strength. Samples
C1 – C7 cylinders were cored from the pervious concrete driveway installed in 2005 while
samples M1 – M10 were cored from PC section in the storage area which was installed in 2009.
Compressive Strength
The compressive strength values for pervious concrete samples cored from the
installation at the field laboratory ranged from 988 – 2429 psi (Table 4). Sample C4 exhibited a
very low compressive strength and high porosity. This range is an indication of the non-
homogeneous nature of the pavement. The cylindrical concrete samples were obtained from two
different production process, mix design and age.
Cast in-situ P.C cylinders of about 8 in. x 4 in. diameter size were tested. Table 5 shows
the results of 28-day strengths and porosity of the test cylinders. The compressive strength values
range from 364 – 1100 psi. The unit weight ranges from 93 – 105 pcf, while porosity ranges
from 0.25 – 0.38. The average porosity of the 8 x 4 samples is 0.29 as shown in the Table 5. The
2σ test shows that the porosity values fall within the acceptable limits. The compressive strength
range of the 8 x 4 samples is 364 – 1100 psi.
A statistical analysis was done by means of MINITAB. Statistical analysis on the results
for the compressive strength is shown in Table 6 while the corresponding analysis for porosity is
shown in Table 7. One (1σ) and two (2σ) standard deviations were used to find out the accuracy
of the data. It was found that about 59% of the porosity data passed the 1σ (less than 67%) test
while about 100% passed the 2σ test. This shows that the data provided were not within
acceptable range as shown by the 1σ test. From the statistical analysis shown in Table 6, 76% of
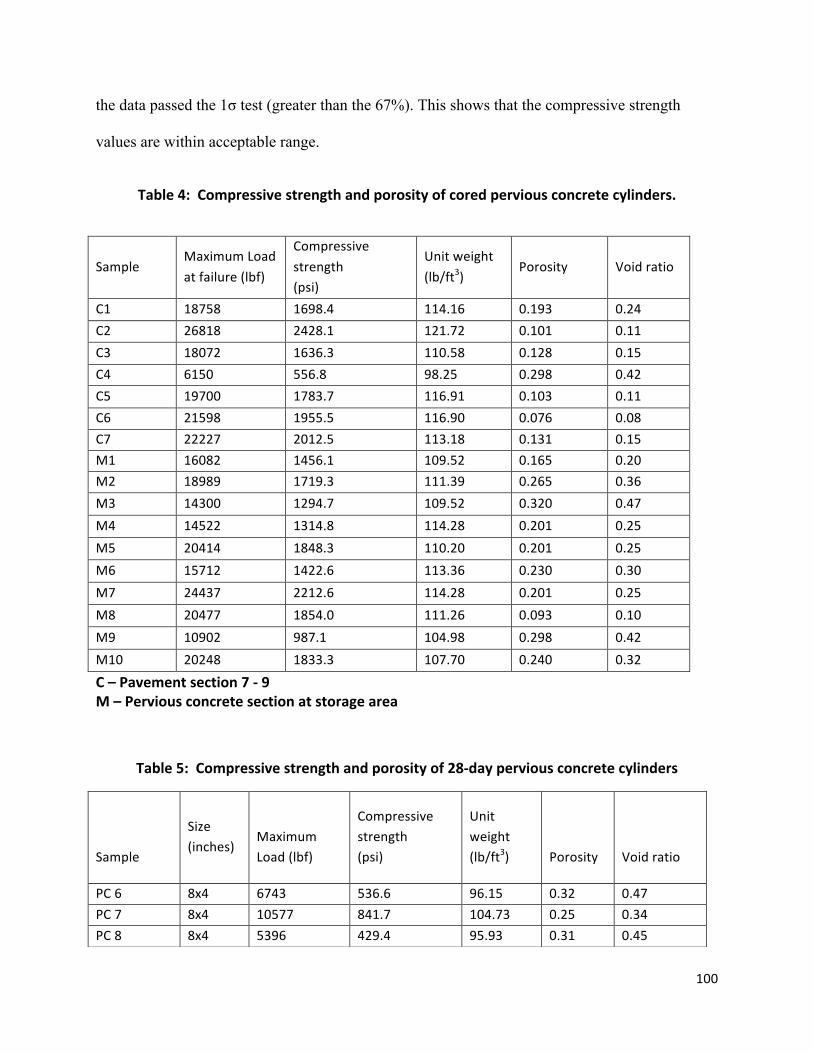
100
the data passed the 1σ test (greater than the 67%). This shows that the compressive strength
values are within acceptable range.
Table 4: Compressive strength and porosity of cored pervious concrete cylinders.
Sample Maximum Load at failure (lbf)
Compressive strength (psi)
Unit weight (lb/ft3)
Porosity Void ratio
C1 18758 1698.4 114.16 0.193 0.24 C2 26818 2428.1 121.72 0.101 0.11 C3 18072 1636.3 110.58 0.128 0.15 C4 6150 556.8 98.25 0.298 0.42 C5 19700 1783.7 116.91 0.103 0.11 C6 21598 1955.5 116.90 0.076 0.08 C7 22227 2012.5 113.18 0.131 0.15 M1 16082 1456.1 109.52 0.165 0.20 M2 18989 1719.3 111.39 0.265 0.36 M3 14300 1294.7 109.52 0.320 0.47 M4 14522 1314.8 114.28 0.201 0.25 M5 20414 1848.3 110.20 0.201 0.25 M6 15712 1422.6 113.36 0.230 0.30 M7 24437 2212.6 114.28 0.201 0.25 M8 20477 1854.0 111.26 0.093 0.10 M9 10902 987.1 104.98 0.298 0.42 M10 20248 1833.3 107.70 0.240 0.32
C – Pavement section 7 -‐ 9 M – Pervious concrete section at storage area
Table 5: Compressive strength and porosity of 28-‐day pervious concrete cylinders
Sample
Size (inches)
Maximum Load (lbf)
Compressive strength (psi)
Unit weight (lb/ft3)
Porosity
Void ratio
PC 6 8x4 6743 536.6 96.15 0.32 0.47 PC 7 8x4 10577 841.7 104.73 0.25 0.34 PC 8 8x4 5396 429.4 95.93 0.31 0.45
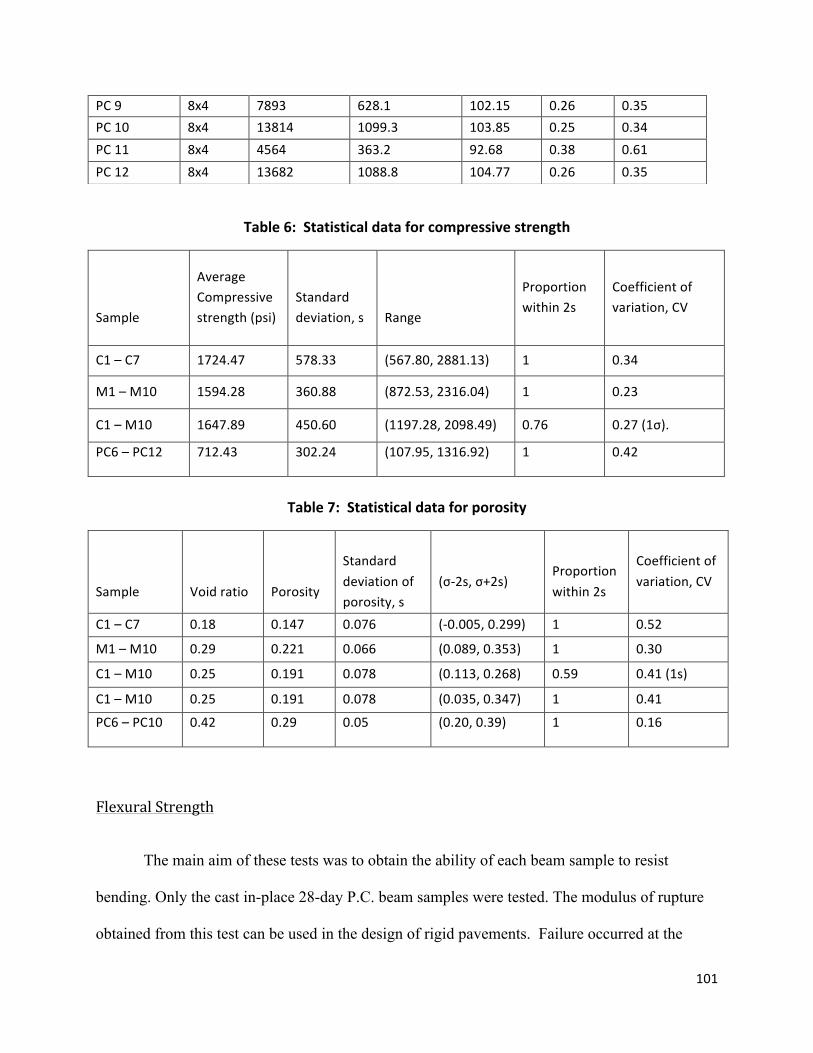
101
Table 6: Statistical data for compressive strength
Sample
Average Compressive strength (psi)
Standard deviation, s
Range
Proportion within 2s
Coefficient of variation, CV
C1 – C7 1724.47 578.33 (567.80, 2881.13) 1 0.34
M1 – M10 1594.28 360.88 (872.53, 2316.04) 1 0.23
C1 – M10 1647.89 450.60 (1197.28, 2098.49) 0.76 0.27 (1σ).
PC6 – PC12 712.43 302.24 (107.95, 1316.92) 1 0.42
Table 7: Statistical data for porosity
Sample
Void ratio
Porosity
Standard deviation of porosity, s
(σ-‐2s, σ+2s)
Proportion within 2s
Coefficient of variation, CV
C1 – C7 0.18 0.147 0.076 (-‐0.005, 0.299) 1 0.52
M1 – M10 0.29 0.221 0.066 (0.089, 0.353) 1 0.30
C1 – M10 0.25 0.191 0.078 (0.113, 0.268) 0.59 0.41 (1s)
C1 – M10 0.25 0.191 0.078 (0.035, 0.347) 1 0.41
PC6 – PC10 0.42 0.29 0.05 (0.20, 0.39) 1 0.16
Flexural Strength
The main aim of these tests was to obtain the ability of each beam sample to resist
bending. Only the cast in-place 28-day P.C. beam samples were tested. The modulus of rupture
obtained from this test can be used in the design of rigid pavements. Failure occurred at the
PC 9 8x4 7893 628.1 102.15 0.26 0.35 PC 10 8x4 13814 1099.3 103.85 0.25 0.34 PC 11 8x4 4564 363.2 92.68 0.38 0.61 PC 12 8x4 13682 1088.8 104.77 0.26 0.35

102
middle third section of the beam. Once again, the errors may have occurred as a result of batch
mixing, fabrication, sampling method and compaction. This test is very sensitive to mix design,
moisture content, sample preparation, handling and curing process (ASTM, 2004b).
Flexural strength values for pervious concrete as discussed in some literature ranges from
450 – 620 psi. The flexural strength range of conventional concrete is between 500 – 800 psi.
Table 8 shows that the modulus of rupture ranges from 198 – 279 psi. The lower values obtained
in the current study may be attributed to factors such as weaker bonding agent (cement paste)
used and improper mix design. The 2σ test in Table 9 shows that the modulus of rupture values
falls within acceptable range. The average modulus of rupture of the beams was 246 psi. This
value is almost half of that specified in some literature.
Table 8: Modulus of rupture from flexural strength test of cast in-‐situ pervious concrete
Sample Maximum Load, P
(lbf) Modulus of Rupture, M.R
(psi)
B1 2003 197.3 B2 2699 256.0 B3 2493 243.0 B4 2680 256.5 B5 2797 278.1
Table 9: Statistical data for modulus of rupture
Sample Average Modulus of rupture (psi)
Standard Deviation, s
Range Proportion within 2s
Coefficient of variation, CV
B1 – B5 246.2 30.09 (185.99, 306.36) 1 0.12
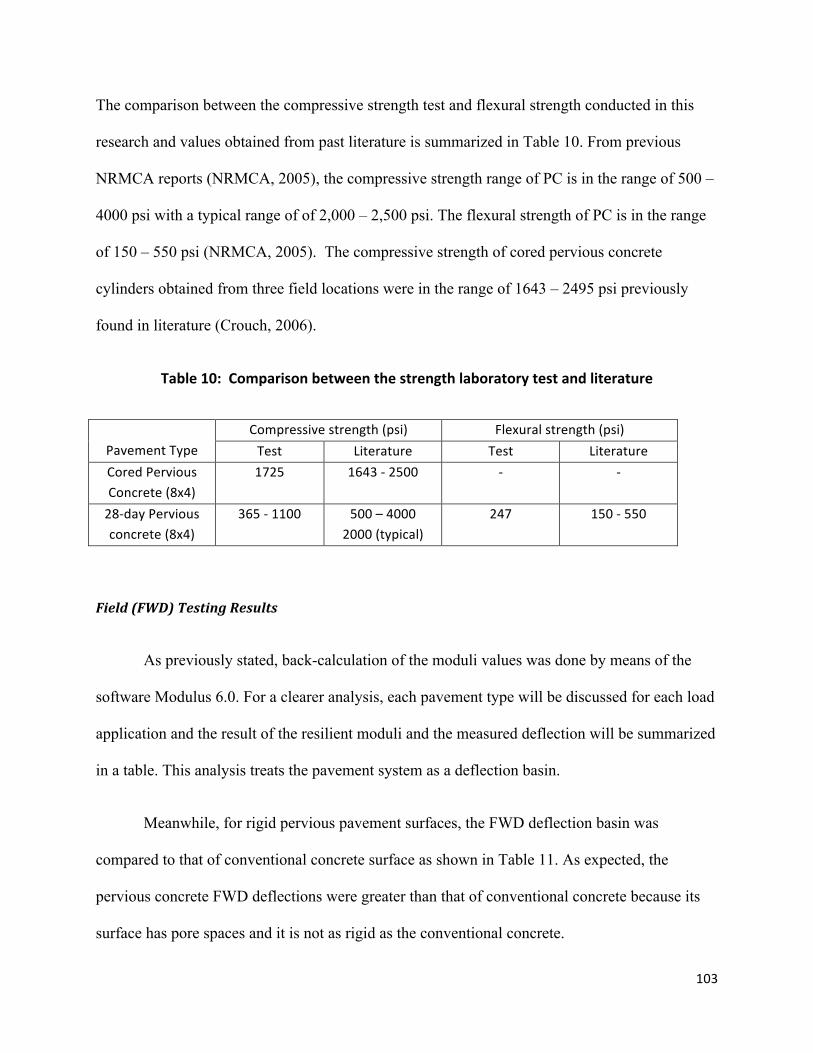
103
The comparison between the compressive strength test and flexural strength conducted in this
research and values obtained from past literature is summarized in Table 10. From previous
NRMCA reports (NRMCA, 2005), the compressive strength range of PC is in the range of 500 –
4000 psi with a typical range of of 2,000 – 2,500 psi. The flexural strength of PC is in the range
of 150 – 550 psi (NRMCA, 2005). The compressive strength of cored pervious concrete
cylinders obtained from three field locations were in the range of 1643 – 2495 psi previously
found in literature (Crouch, 2006).
Table 10: Comparison between the strength laboratory test and literature
Pavement Type Compressive strength (psi) Flexural strength (psi) Test Literature Test Literature
Cored Pervious Concrete (8x4)
1725 1643 -‐ 2500 -‐ -‐
28-‐day Pervious concrete (8x4)
365 -‐ 1100 500 – 4000 2000 (typical)
247 150 -‐ 550
Field (FWD) Testing Results
As previously stated, back-calculation of the moduli values was done by means of the
software Modulus 6.0. For a clearer analysis, each pavement type will be discussed for each load
application and the result of the resilient moduli and the measured deflection will be summarized
in a table. This analysis treats the pavement system as a deflection basin.
Meanwhile, for rigid pervious pavement surfaces, the FWD deflection basin was
compared to that of conventional concrete surface as shown in Table 11. As expected, the
pervious concrete FWD deflections were greater than that of conventional concrete because its
surface has pore spaces and it is not as rigid as the conventional concrete.
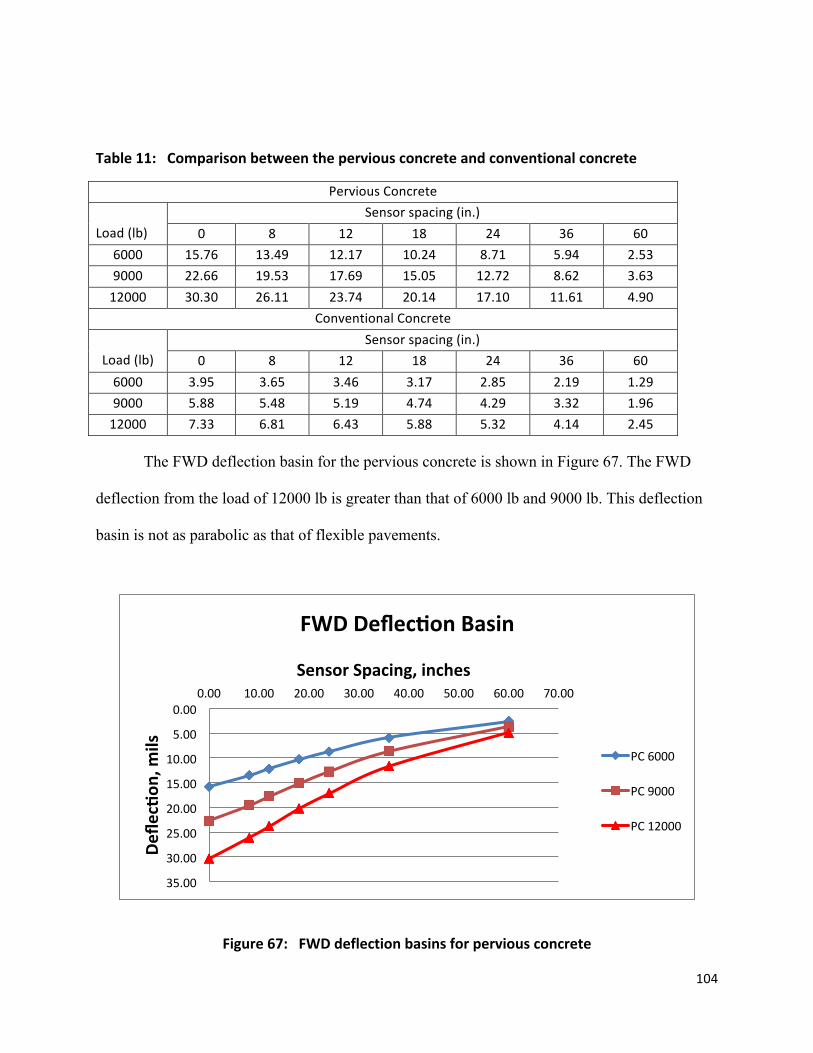
104
Table 11: Comparison between the pervious concrete and conventional concrete
Pervious Concrete Load (lb)
Sensor spacing (in.) 0 8 12 18 24 36 60
6000 15.76 13.49 12.17 10.24 8.71 5.94 2.53 9000 22.66 19.53 17.69 15.05 12.72 8.62 3.63 12000 30.30 26.11 23.74 20.14 17.10 11.61 4.90
Conventional Concrete
Load (lb) Sensor spacing (in.)
0 8 12 18 24 36 60 6000 3.95 3.65 3.46 3.17 2.85 2.19 1.29 9000 5.88 5.48 5.19 4.74 4.29 3.32 1.96 12000 7.33 6.81 6.43 5.88 5.32 4.14 2.45
The FWD deflection basin for the pervious concrete is shown in Figure 67. The FWD
deflection from the load of 12000 lb is greater than that of 6000 lb and 9000 lb. This deflection
basin is not as parabolic as that of flexible pavements.
Figure 67: FWD deflection basins for pervious concrete
0.00
5.00
10.00
15.00
20.00
25.00
30.00
35.00
0.00 10.00 20.00 30.00 40.00 50.00 60.00 70.00
Defle
chon
, mils
Sensor Spacing, inches
FWD Deflechon Basin
PC 6000
PC 9000
PC 12000
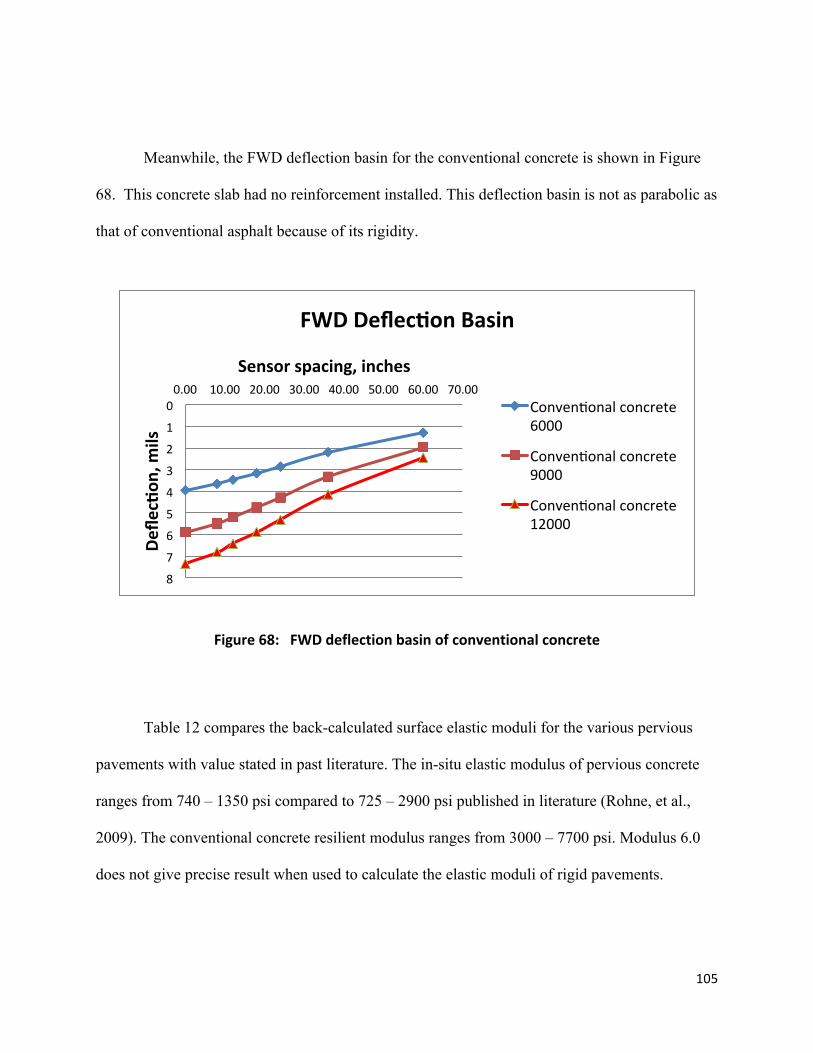
105
Meanwhile, the FWD deflection basin for the conventional concrete is shown in Figure
68. This concrete slab had no reinforcement installed. This deflection basin is not as parabolic as
that of conventional asphalt because of its rigidity.
Figure 68: FWD deflection basin of conventional concrete
Table 12 compares the back-calculated surface elastic moduli for the various pervious
pavements with value stated in past literature. The in-situ elastic modulus of pervious concrete
ranges from 740 – 1350 psi compared to 725 – 2900 psi published in literature (Rohne, et al.,
2009). The conventional concrete resilient modulus ranges from 3000 – 7700 psi. Modulus 6.0
does not give precise result when used to calculate the elastic moduli of rigid pavements.
0
1
2
3
4
5
6
7
8
0.00 10.00 20.00 30.00 40.00 50.00 60.00 70.00
Defle
chon
, mils
Sensor spacing, inches
FWD Deflechon Basin
Convenlonal concrete 6000
Convenlonal concrete 9000
Convenlonal concrete 12000
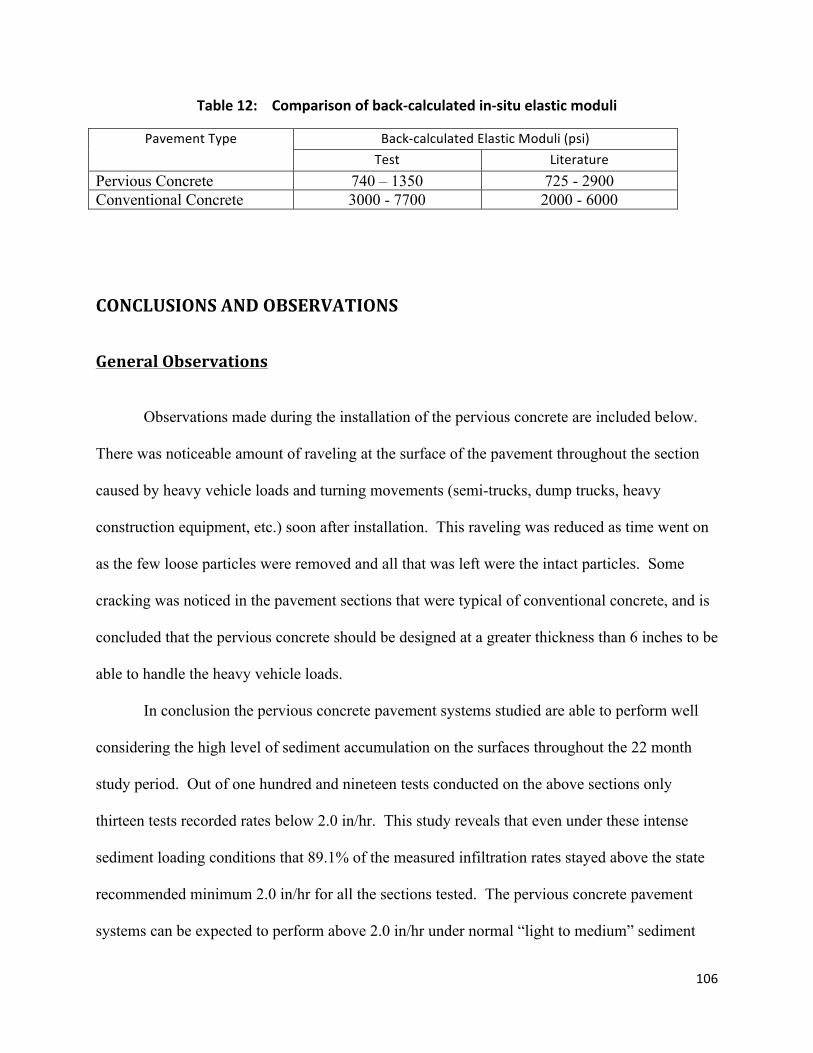
106
Table 12: Comparison of back-‐calculated in-‐situ elastic moduli
Pavement Type Back-‐calculated Elastic Moduli (psi) Test Literature
Pervious Concrete 740 – 1350 725 - 2900 Conventional Concrete 3000 - 7700 2000 - 6000
CONCLUSIONS AND OBSERVATIONS
General Observations
Observations made during the installation of the pervious concrete are included below.
There was noticeable amount of raveling at the surface of the pavement throughout the section
caused by heavy vehicle loads and turning movements (semi-trucks, dump trucks, heavy
construction equipment, etc.) soon after installation. This raveling was reduced as time went on
as the few loose particles were removed and all that was left were the intact particles. Some
cracking was noticed in the pavement sections that were typical of conventional concrete, and is
concluded that the pervious concrete should be designed at a greater thickness than 6 inches to be
able to handle the heavy vehicle loads.
In conclusion the pervious concrete pavement systems studied are able to perform well
considering the high level of sediment accumulation on the surfaces throughout the 22 month
study period. Out of one hundred and nineteen tests conducted on the above sections only
thirteen tests recorded rates below 2.0 in/hr. This study reveals that even under these intense
sediment loading conditions that 89.1% of the measured infiltration rates stayed above the state
recommended minimum 2.0 in/hr for all the sections tested. The pervious concrete pavement
systems can be expected to perform above 2.0 in/hr under normal “light to medium” sediment

107
accumulation conditions without any maintenance and the infiltration rate can fall below 2.0
in/hr if under intense “heavy” sediment loading. These systems, however, can be rejuvenated by
a standard vacuum sweeper truck to rates above 2.0 in/hr. The above mentioned intense
sediment loading may be experienced by a pavement system located near highly disturbed soils,
coastal areas, or near the end of the pavements service life only.
The amount of sediment loading depends on the site location and its exposure to
sediments being brought onto the pavement’s surface by natural (wind and water laid sediments)
or un-natural causes (ie. Tire tracking of sediments, spills, etc.). It should be noted that the
vacuum suction strength is sufficient in removing the clogging sediments in the surface pores
when done during a rain storm, shortly after a rain storm, or when the surface is saturated by
ponding water on the surface.
This permeable pavement system is recommended as an effective infiltration BMP that
will perform well throughout its service life. If the infiltration performance is degraded due to
sediment accumulation mainly in the surface pores a standard vacuum truck can successfully
improve its capability to infiltrate stormwater above 2.0 in/hr (stated as the minimum rate
recommended rate for this type of system in the statewide draft stormwater rule).
Sustainable Storage
After multiple porosity tests were conducted on all the individual components that make
up the entire pavement cross section and the actual constructed systems during conditions
including oven dried samples, gravity drained samples, loaded with sediments, and after the
sediments have been vacuumed from the top surfaces, conclusions can be made on the
sustainable storage within each system. It was found that the actual storage within a constructed
system is less than the calculated theoretical storage found by measuring each of the individual
108
components. To be conservative, the actual measured values of the complete systems should be
used to identify what the storage is in a desired section, as the amount of mixing at the interfaces
of each layer will depend on what materials are used. With this, the amount of storage in the
entire cross section of the pervious concrete system is about 12%.
Water Quality
This study examined the quality of water that infiltrates through two pervious concrete
systems, a system containing a Bold&GoldTM pollution control layer and a system without. In
the results section above, it was observed that the quality of water that infiltrates through these
systems is a little higher than the concentrations measured in stormwater in the Orlando Florida
area. While stormwater is typically treated prior to discharge to a surface water body these
systems allow the stormwater to infiltrate onsite and therefore do not discharge to a surface water
body. This implies that when assessing the water quality benefit of these systems, reduction in
water volume needs to be taken into account.
Based on the results of this study the nutrient mass reduction could be determined by
calculating the volume retained by these systems and event mean concentrations. This would
give the pollutant mass retained within the pervious system and not discharged into a receiving
water body or stormwater pond. An example problem is presented below to show this
calculation.
Sample Calculations for Quantifying Water Quality Improvement
For this example consider a 1-acre pervious parking lot using the pervious concrete
system as the specified product. The cross section for this system consists of a 10 inch deep

109
layer of Bold&GoldTM pollution control media and a 6 inch deep layer of pervious concrete on
top. There is a non-woven filter fabric separating the parent earth soil from the Bold&GoldTM
layer. The parking lot is located in Orlando Florida and a 25 year design storm is to be used.
The TN and TP mass reduction expected from this site for a 25 year storm event will be
determined. The TN and TP concentrations used are those presented in Table 2 above for
average Orlando stormwater concentration and median southeastern United States stormwater
concentration, respectively. The TN concentration is shown as 0.79 mg/L as N and the TP
concentration is shown as 0.68 mg/L as PO43-.
Using the pervious pavement water management analysis model located on the
Stormwater Management Academy website (www.stormwater.ucf.edu), a runoff coefficient for
this system is determined as 0.75. Using the rational method which states that Q = CiA, a
rainfall excess value can be determined. First the rainfall intensity and duration that has a 25
year return period needs to be determined from the Orlando Florida intensity, duration, and
frequency (IDF) curve. Based on this IDF curve the design intensity is 8.4 in/hr for a 10 minute
duration. Using the rational method, it is determined that the rainfall excess flow rate is 6.3 cfs
and multiplying that by the 10 minute duration gives a runoff volume of 3,780 cubic feet, or
107,038 liters. Therefore, the TN mass leaving the system is 84.6 grams and the TP mass
leaving the system is 72.8 grams.
Now the mass leaving a typical impervious parking lot needs to be determined for
comparison. Assuming a runoff coefficient of 0.95 for regular impervious asphalt the rainfall
excess flow rate is 8.04 cfs and multiplying that by the 10 minute duration gives a runoff volume
of 4,826 cubic feet, or 136,673 liters. Therefore, the TN mass leaving a typical impervious
asphalt parking lot is 108 grams and the TP mass leaving the system is 92.9 grams. This shows
110
that the pervious concrete system specified would have a TN mass reduction of 23.4 grams
(22%) and a TP mass reduction of 20.1 grams (22%) for a one acre parking lot.
The above analysis and example problem shows that there is a water quality benefit to
using the pervious concrete system. This benefit is only realized, however, through taking into
account the stormwater runoff volume reduction achieved. The yearly TP and TN mass
reduction has the potential to be much higher considering that more than 90% of the rainfall
events in Orlando Florida are less than one inch, which would not generate any runoff.
Strength Evaluation
The test and analysis of the structural properties the existing driveways at the Stormwater
Management Academy laboratory shows the in-situ strength parameters of pervious concrete
pavements was conducted in this study. The compressive strength values for pervious concrete
samples cored from the installation at the field laboratory ranged from 988 – 2429 psi while the
compressive strength range of the 8 x 4 cast in place samples was in the range 364 – 1100 psi.
Flexural strength values for pervious concrete as discussed in literature ranges from 450 – 620
psi. The flexural strength range of conventional concrete is between 500 – 800 psi. From the
testing in this project, the modulus of rupture ranges from 198 – 279 psi. The lower values
obtained in the current study may be attributed to factors such as weaker bonding agent (cement
paste) used and improper mix design.
Pervious concrete was found to have a range of modulus of elasticity of 740 – 1350 psi.
This is comparable to the elastic modulus value of 725 - 2900 psi specified in literature. Typical
elastic moduli for conventional concrete ranged from 2000 – 6000 psi. There are no exact mix
111
designs for pervious pavements that will produce high mechanical properties. Laboratory testing
is one of the methods of establishing a range of values which will lead to an acceptable design.
It should be emphasized that the use of pervious pavements should be limited to areas
with low volume traffic. The accumulated 18 kip equivalent single axle load (ESAL) of
approximately 412,000 was estimated as the load the pavement will be subjected to during its
design life. The summary tables at different reliability levels show the effect of traffic loading on
the structural capacity of the pavement. In rigid pavements, at a given degree of certainty and
traffic load, as the modulus of subgrade reaction increases the minimum thickness of the rigid
pervious pavement decreases.
As expected, the pervious concrete FWD deflections were greater than that of
conventional concrete because its surface has pore spaces and it is not as rigid as the
conventional concrete. The in-situ elastic modulus of pervious concrete ranges from 740 – 1350
psi compared to 725 – 2900 psi published in literature (Rohne, et al., 2009). The conventional
concrete resilient modulus ranges from 3000 – 7700 psi. Modulus 6.0 does not give precise result
when used to calculate the elastic moduli of rigid pavements.
112
REFERENCES
AASHTO, Guide for Design of Pavement Structures [Report]. - [s.l.] : American Association of State Highway and Transportation Officials, 1993.
ASTM D3385., Standard test method for infiltration rate of soils in field using double-ring infiltrometer.Vol. 04.08, in Geotechnical Engineering Standards, by D18.04 Subcommittee. West Conshohocken, PA: ASTM International, 2009.
ASTM, Standard Test Method for Flexural Strength of Concrete (Using Simple Beam with Third-Point Loading) [Book Section] // Annual Book of ASTM Standards. - West Conshohocken : ASTM International, 2004b. - Vol. 04.02.
Abbot, C. and Comino-Mateos, L. (2003). In-situ hydraulic performance of a permeable pavement sustainable urban drainage system. The Journal (volume 17) , 187-190.
Anderson. (1999). “The role of urban surfaces (permeable pavements) in regulating drainage and evaporation: development of a laboratory simulation experiment”. Hydrological Processes volume 13, 357-609.
Ballock, C., “Construction specifications and analysis of rehabilitation techniques of pervious concrete pavement”, 2007 Masters Thesis, University of Central Florida.
Bean Z. Eban, “Study on the surface infiltration rate of permeable pavements,” North Carolina State University, Raleigh, NC, 2004
Bean, E. Z., Hunt, W. and Bidelspach, D. (2007, May/June). Field survey of permeable pavement surface infiltration rates. Journal of Irrigation and Drainage Engineering.
Bloomquist, D., Viala, A., and Gartner, M., “Development of a Field Permeability Apparatus the Vertical and Horizontal In-situ Permeameter (VAHIP)”, 2007 UF. http://www.dot.state.fl.us/researchcenter/Completed_Proj/Summary_GT/FDOT_BD545_15_rpt.pdf
Booth B. Derek and Jackson C. Rhett, “Urbanization of Aquatic Systems: Degredation Thresholds, Stormwater Detection, and the Limits of Mitigation,” Journal of the American Water Resources Association (American Water Resources Association) October 1997
Brattebo, B. and Booth, D. "Long-term Stormwater Quantity and Quality Performance of Permeable Pavement Systems." Water Research Volume 37, Issue 18 (2003): 4369-4376.
Brouwer, C., Prins, K., Kay, M., and Heibloem, M. (1988). Irrigation water management: Irrigation methods. Food and Agricultural Organization. Rome, Italy: FAO.
Cahill, T. H. "Porous Asphalt: The Right Choice of Porous Pavements." Hot Mix Asphalt Technology, National Asphalt Pavement Association (2003).
Casenave A. and Valentin C., “A runoff capability classification system based on surface features criteria in semi-arid areas of West Africa,” Niamey, Niger, 1991
Cedergren, H., (1994), America’s Pavements: World’s Longest Bathtubs, Civil Engineering, ASCE, vol. 64, No. 9, pp. 56-58.

113
Chester, A. L. and James, G. C. (1996). Impervious surface coverage; The emergence of a key Environmental Indicator. Journal of American Planning Association , 62 (2).
Chopra, M., Wanielista, M. and Stuart, E., Chapter 12 in Statewide Stormwater Rule, Revised Draft Applicant’s Handbook., Florida Department of Environmental Protection, 2010 http://www.dep.state.fl.us/water/wetlands/erp/rules/stormwater/rule_docs.htm
Chopra Manoj and Wanielista Marty, Construction and Maintenance Assessment of Pervious Concrete Pavements [Report] : Final Report . - Orlando, Florida : A Joint Research Program of NRMCA, FDOT and Rinker Materials, 2007a.
Chopra Manoj and Wanielista Marty, Performance Assessment of a Pervious Concrete Pavement Used as a Shoulder for a Interstate Rest Area parking Lot [Report] : Final Report. - Orlando, Florida : A Joint Research Program of FDOT, Rinker Materials and FDEP, 2007b.
Chopra Manoj and Wanielista Marty, Performance Assessment of a Pervious Concrete Pavement Used as a Shoulder for a Interstate Rest Area Parking Lot [Report] : Final Report. - Orlando, Florida : A Joint Research Program of FDOT, Rinker Materials and FDEP, 2007c.
Chopra Manoj, Wanielista Marty and Mulligan Ann Marie, Compressice Strength of Pervious Concrete Pavements [Report] : Final Report. - Orlando, Florida : A Joint Research Program of FDOT, Rinker Materials and FDEP, 2007b.
Crouch, L.K., “Pervious PCC Compressive Strength in the Laboratory and the Field: The Effects of Aggregate Properties and Compactive Effort, Report, Tennessee Concrete Association, 2006.
Das, B. M. (2006). Principles of geotechnical engineering (6th Edition ed.). Pacific Groove, CA: Brooks/Cole.
Dietz E. Michael, “Low Impact Development Practices: A Review of Current Research Recommendations for Future Directions,” Department of Environment and Society, Utah State University, 2007
Dreelin, E. A., Fowler, L., and Roland, C. C. (2003). A test of porous pavement effectiveness on clay soils during natural storm events. Center for Water Sciences and Department of Fisheries and Wildlife. East Landing, MI: Michigan State University.
Ferguson, B., “Porous Pavements”, An integrative studies in water management and land development, 2005.
Fortez Rita, Merighi Joao, and Bandeira Alex., “Laboratory Studies on Performance of Porous Concrete,” Department of Civil Engineering, Mackenzie Presbyterian University, Brazil
Frazer, L. "Paving Paradise The Peril of Impervious Surfaces." Environmental Health Perspectives Volume 113, NO. 7 (2005): A456-A462.

114
Fwa T.W., Tan S.A., and Guwe Y.K., “Laboratory Evaluation of Clogging Potential of Porous Asphalt Mixtures,” Center for Transportation Research, National University of Singapore.
Ghafoori Nader and Dutta Shivaji Development of No-Fines Concrete Pavement Applications [Journal] // Journal of Transportation Engineering. - May/June 1995. - 3 : Vol. 126. - pp. 283-288.
Ghafoori Nader and Dutta Shivaji Laboratory Investigation of Compacted No-fines concrete for paving materials [Journal] // Journal of Materials in Civil Engineering. - August 1995. - 3 : Vol. 7. - pp. 183 - 191.
Goktepe A., Burak, A.E. and Hilmi L.A., “Advances in backcalculating the mechanical properties of flexible pavements”, Advances in Engineering Software, Vol. 37. - pp. 421-431, 2006.
Grote K., Hubbard S., and Harvey J., Rubin Y., “Evaluation of Infiltration in Layered Pavements using Surface GPR Reflection Techniques,” Department of Geology, University of Wisconsin-Eau Claire 2004
Haselbach M. Liv and Freeman M. Robert., “Vertical Porosity Distributions in Pervious Concrete Pavement,” ACI Materials Journal, Vol. 103, No. 6, 2006
Haselbach Liv, Valavala Srinivas, and Montes Felipe, “Permeability predictions for sand-clogged Portland Cement Pervious Concrete Pavement Systems,” University of South Carolina, Sept 2005
Haselbach, V. M. (2005). A new test method for porosity measurements of Portland Cement pervious concrete. Journal of ASTM International .
Huang, Y., Pavement Analysis and design, Pearson, Prentice Hall, 2004. Huang B [et al.] Laboratory and analytical study of permeability and strength properties of
Pervious concrete [Report]. - Knoxville : Dept of Civil and Environmental Engineering, The University of Tennessee, 2006.
Lake Superior Duluth Streams. 3 September 2010 <http://www.lakesuperiorstreams.org/stormwater/toolkit/paving.html >.
Illgen, M., Schmitt, T., and Welker, A. (2007). Runoff and infiltration characteristics of permeable pavements - Review of an intensive monitoring program. Water Science Technology , 1023-1030.
Kevern, J. T. (2008). Advancements in pervious concrete technology. Iowa State University, Department of Civil Engineering. Ames: John Tristan Kevern.
Kunzen, T., “Hydrologic mass balance of pervious concrete pavement with sandy soils”, 2006 UCF.
Legret M., Colandini V., and Marc Le C., “Effects of a Porous Pavement with Reservoir Structure on the Quality of Runoff Water and Soil,” Laboratory of Central Ponts et Chaussees, B.P.19, 44340 Bouguenais, France 1996

115
Liantong Mo, Huurman M, Shaopeng Wu, and Molenaar A., “Ravelling investigation of porous asphalt concrete based on fatigue characteristics of bitumen-stone adhesion and mortar,” 2009
Liu, W. and Scullion, T., “Modulus 6.0 for Windows: User’s Manual,, Texas Transportation Institute, Texas A&M University, College Station, FHWA/TX-05/0-1869-2, 2001.
Montes Felipe, Valavala Sriniva and Haselbach Liv., “A new test method for porosity measurements of portland cement pervious concrete,” Journal of ASTM International, January 2005, Vol. 2, No.1
Montes, H. (2006). Measuring hydraulic conductivity in pervious concrete. Environmental Engineering Sciences , 960-969.
Mulligan, A., “Attainable compressive strength of pervious concrete paving systems”, 2005 UCF
Pitt R.E., Maestre, A, Morquecho, R. and Williamson, D., “Collection and examination of a municipal separate storm sewer system database” , pp 257-294, In: Models and Applications to Urban Water Systems, Vol. 12., W. James (eds.), Guelph, Ontario.
Pitt Robert, Clark Shirley and Field Richard, “Groundwater Contamination Potential from Stormwater Infiltration Practices,” Department of Civil Engineering, The University of Alabama at Birmingham, September 1999
Ranieri Vittorio., “Runoff Control in Porous Pavements,” Department of Highways and Transportation, Polytechnic University of Bari, Italy
Reddi, L. N. (2003). Seepage in soils, Principles and Applications.
Rohne Ryan J. and Izevbekhai Bernard Igbafen Early Performance of Pervious Concrete Pavement [Conference] // TRB Conference. - Maplewood : [s.n.], 2009.
Schlüter, W. A. (2002). Monitoring the Outflow from a Porous Car Park. Urban Water Journal, 4. , 245-253.
Scholz, M., & Grabowiecki, P. (2006). Review of permeable pavement systems. School of Engineering and Electronics, Institute for Infrastructure and Environment. Scotland, UK: University of Edinburgh.
Smith, R., David., “Permeable Interlocking Concrete Pavements, Selection, Design, Construction, and Maintenance., Third Edition., Interlocking Concrete Pavement Institute., 2006
Spence, J., “Pervious concrete: a hydrologic analysis for stormwater management credit”, UCF., 2006
Tennis, P., Lenning, M., and Akers, D. (2004). Perviuos concrete pavements. Retrieved from Portland Cement Association: http://www.northinlet.sc.edu/training/training_pages/Pervious%20Concrete/CRMCA_CD_v2005JUN01/content/web_pages/Pervious_Concrete_Pavements.pdf
Tyner, J., Wright, W., and Dobbs, P. (2009). Increasing exfiltration from pervious concrete and temperature monitoring. Journal of Environmental Management , 1-6.
116
Turkiyyah, G. Feasibility of Backcalculation Procedures Based on Dynamic FWD response data [Report]. - [s.l.] : University of Washington, 2004.
US Environmental Protection Agency, 1994. The Quality of our Nation’s Water: 1992. United States Environmental Protection Agency #EPA-841-5-94-002. Washington, D.C.: USEPA Office of Water.
US Environmental Protection Agency, 1999. Porous Pavement, Stormwater Technology Fact Sheet. United States Environmental Protection Agency #EPA-832-F-99-023. Washington, D.C.: USEPA Office of Water.
Valavala, S., Montes, F., and Haselbach, L. (2006). Area-Rated rational coefficients for portland cement pervious concrete pavement. Journal of hydrologic engineering ASCE , 257-260.
Wanielista, M., Kersten, R., and Eaglin, R. (1997). Hydrology: Water quantity and Quality control (2nd Edition ed.). Hoboken, NJ: John Wiley & Sons, Inc.
Wanielista, M. and Yousef, Y. (1993). Stormwater Management , John Wiley & Sons, Inc. Yang, J., and Jiang, G. (2002). Experimental study on properties of pervious concrete pavement materials. Department of Civil Engineering. Beijing, China: Tsinghua University. Yang Jing and Jiang Guoliang Experimental study on properties of pervious concrete
pavement materials [Journal] // Cement and Concrete Research. - 2003. - 33. - pp. 381 - 386.