Embed Size (px)
Citation preview
Environmental Justice and Urban Freight
Genevieve GiulianoMETRANS Transportation CenterUniversity of Southern California
ITDP WebinarApril 25, 2018
MetroFreight research team
• Laetitia Dablanc, IFSTTAR, U Paris Est• Alison Conway, City College of New York• Sanggyun Kang, USC• Jean-Paul Rodrigue, Hofstra University• Quan Yuan, USC
Basics
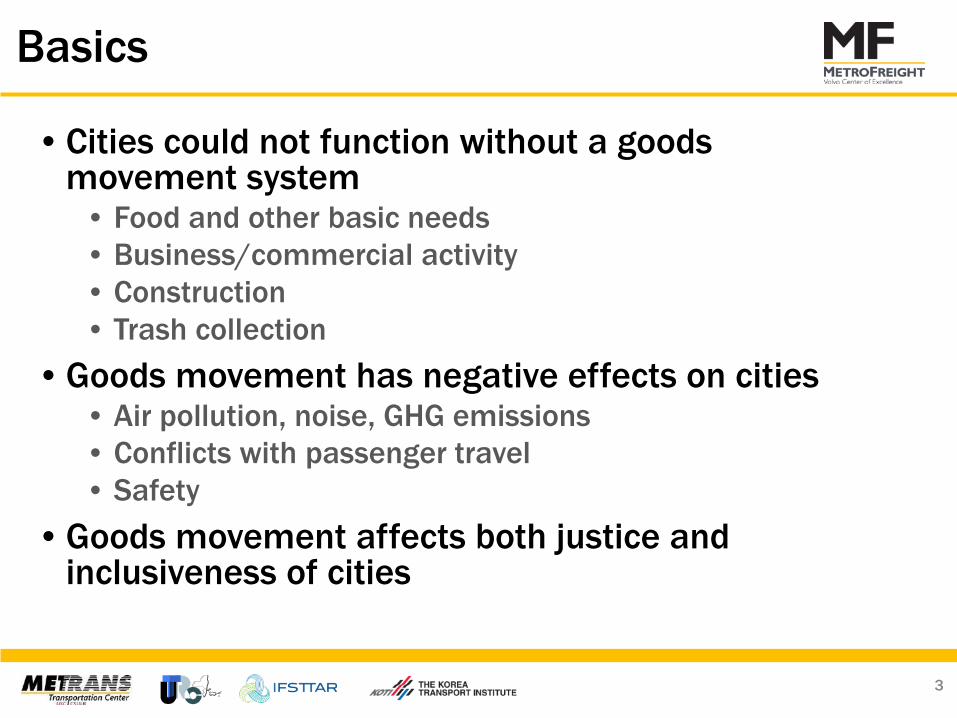
• Cities could not function without a goods movement system
• Food and other basic needs• Business/commercial activity• Construction• Trash collection
• Goods movement has negative effects on cities• Air pollution, noise, GHG emissions• Conflicts with passenger travel• Safety
• Goods movement affects both justice and inclusiveness of cities
3
Justice
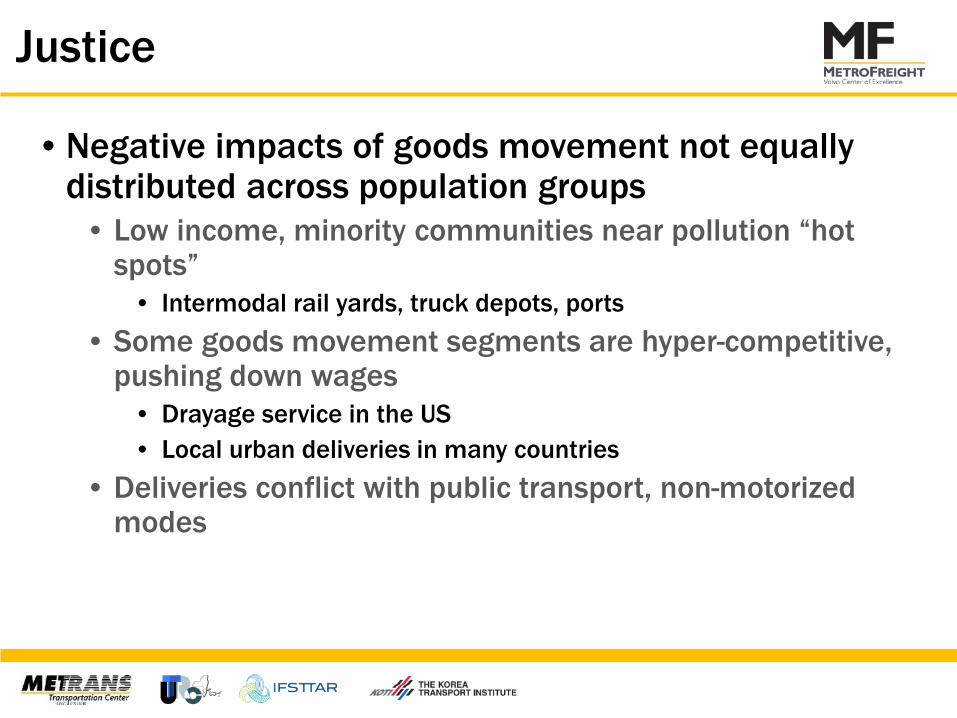
• Negative impacts of goods movement not equally distributed across population groups
• Low income, minority communities near pollution “hot spots”
• Intermodal rail yards, truck depots, ports• Some goods movement segments are hyper-competitive,
pushing down wages• Drayage service in the US• Local urban deliveries in many countries
• Deliveries conflict with public transport, non-motorized modes
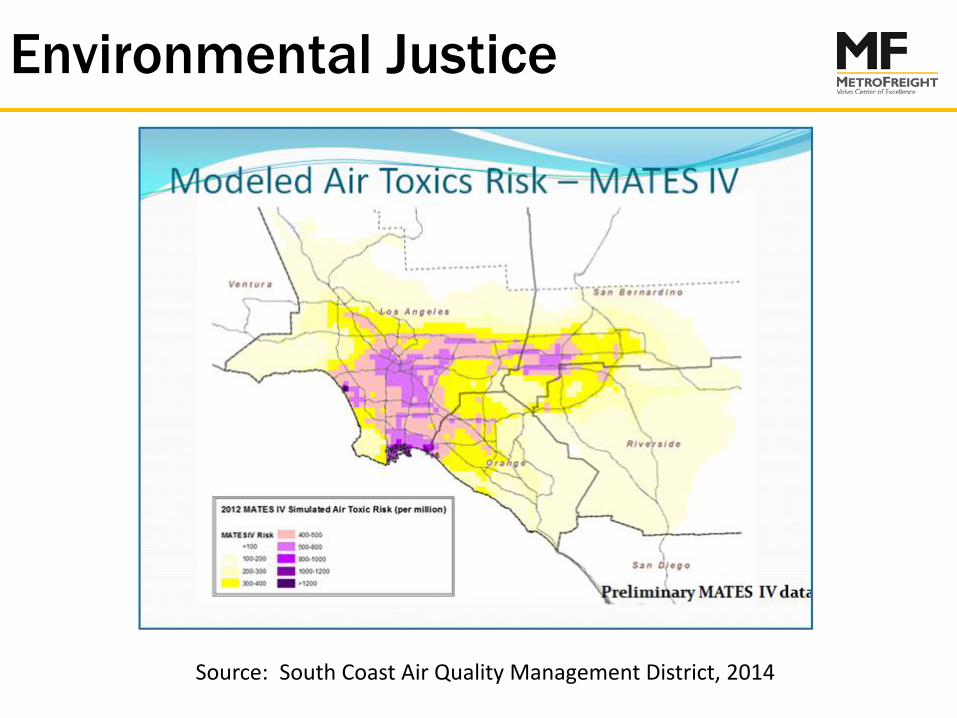
Environmental Justice
Source: South Coast Air Quality Management District, 2014
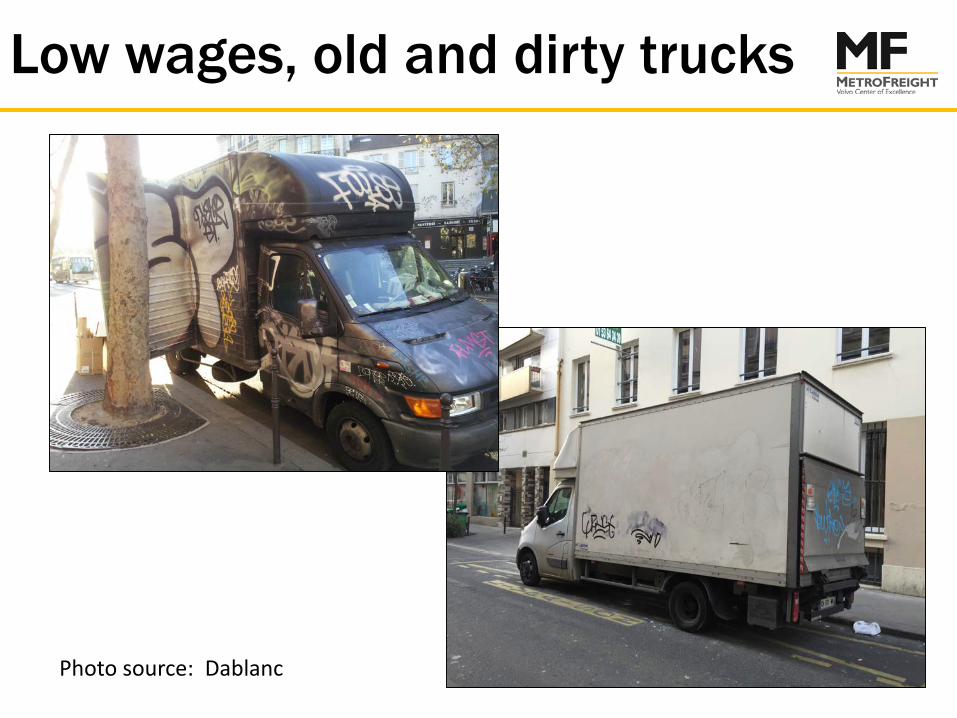
Low wages, old and dirty trucks
Photo source: Dablanc
Inclusiveness
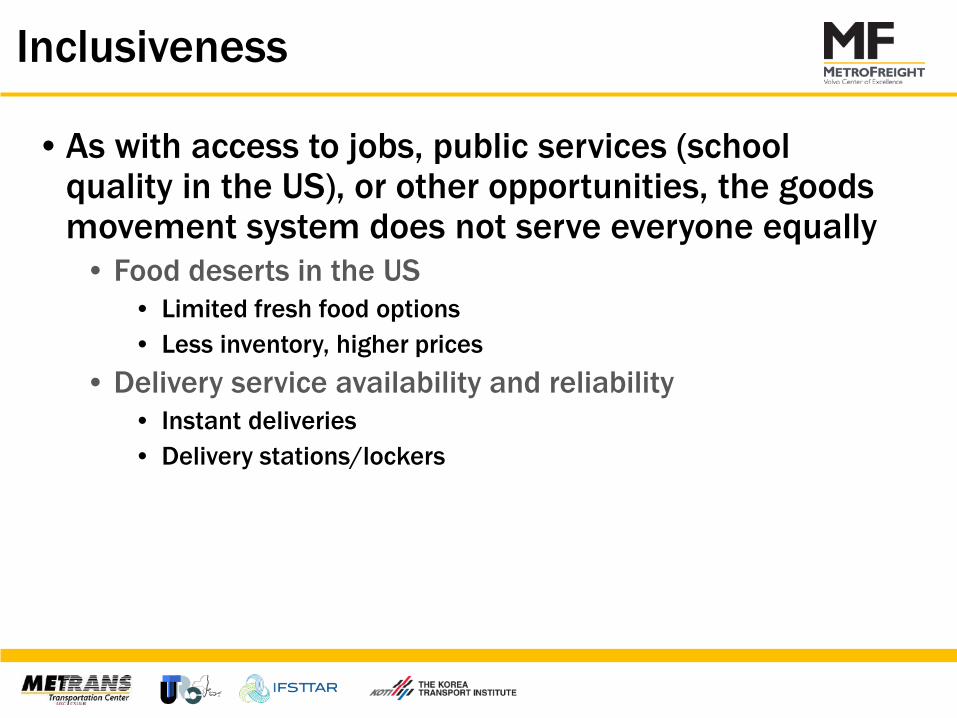
• As with access to jobs, public services (school quality in the US), or other opportunities, the goods movement system does not serve everyone equally
• Food deserts in the US• Limited fresh food options• Less inventory, higher prices
• Delivery service availability and reliability• Instant deliveries• Delivery stations/lockers
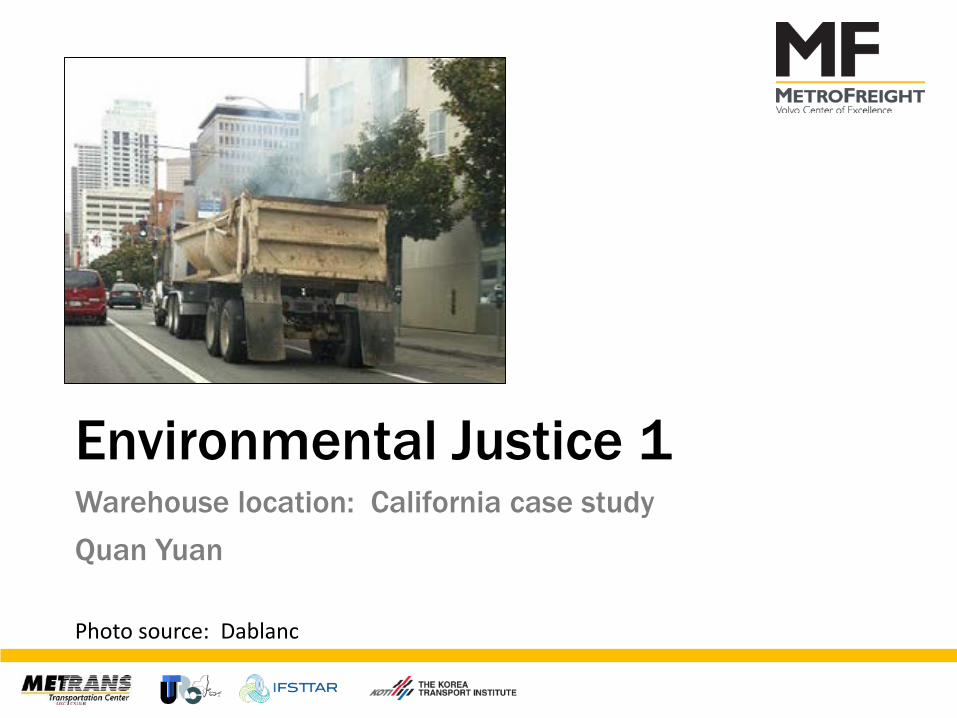
Environmental Justice 1Warehouse location: California case studyQuan Yuan
Photo source: Dablanc
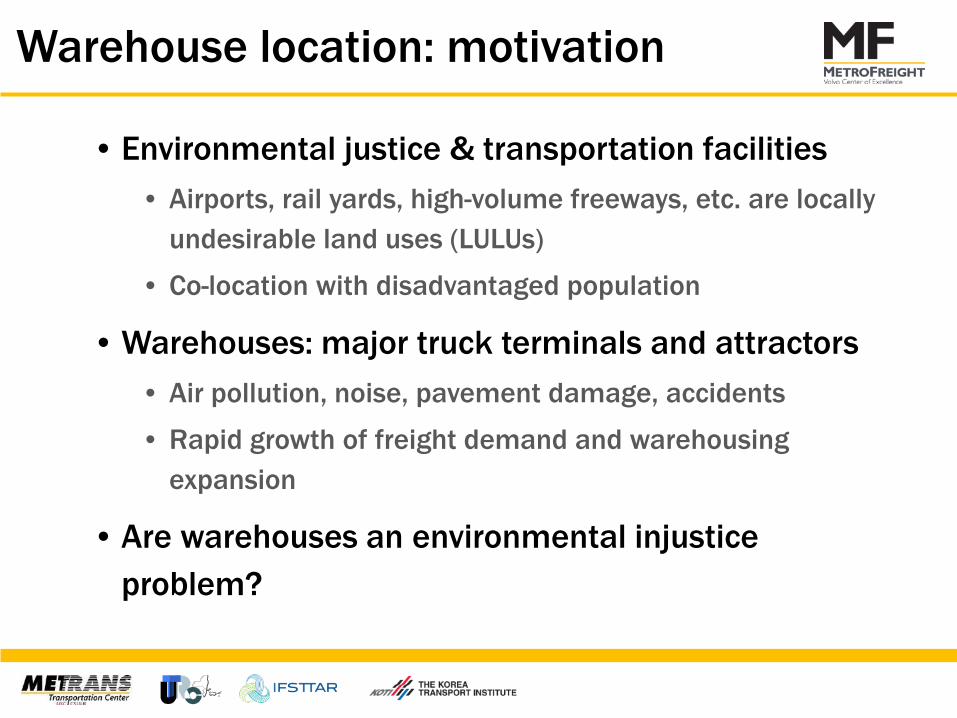
Warehouse location: motivation
• Environmental justice & transportation facilities • Airports, rail yards, high-volume freeways, etc. are locally
undesirable land uses (LULUs)
• Co-location with disadvantaged population
• Warehouses: major truck terminals and attractors• Air pollution, noise, pavement damage, accidents
• Rapid growth of freight demand and warehousing expansion
• Are warehouses an environmental injustice problem?
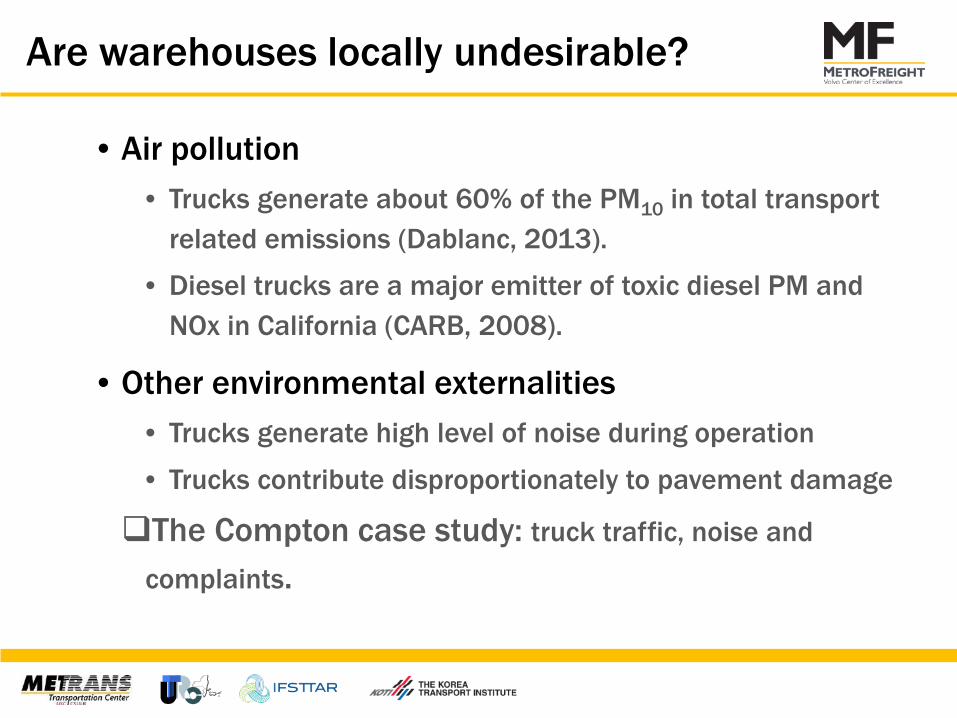
Are warehouses locally undesirable?
• Air pollution • Trucks generate about 60% of the PM10 in total transport
related emissions (Dablanc, 2013).
• Diesel trucks are a major emitter of toxic diesel PM and NOx in California (CARB, 2008).
• Other environmental externalities• Trucks generate high level of noise during operation
• Trucks contribute disproportionately to pavement damage
The Compton case study: truck traffic, noise and
complaints.
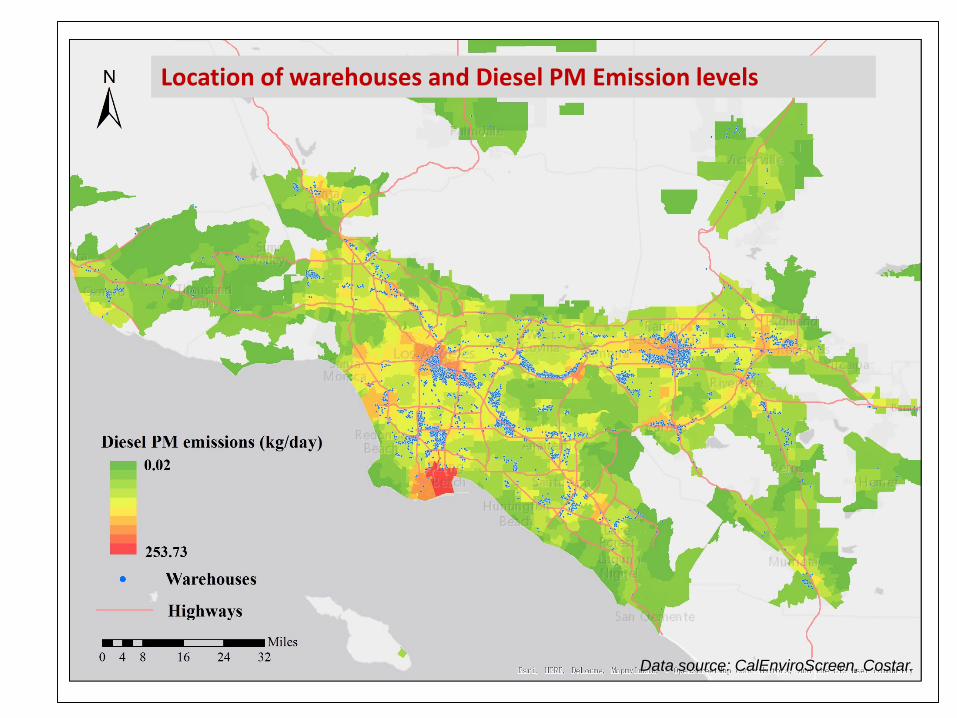
Location of warehouses and Diesel PM Emission levels
Data source: CalEnviroScreen, Costar.
Are warehouses disproportionately located in disadvantaged neighborhoods?
• Economic, Sociopolitical or Racial factors (e.g. Mohai et al., 2009).
• Land rent
• Political power of local population
• Decrease in land values
• inflow of disadvantaged population
• Environmental justice issues focus on Minority and Poor population
• The Rialto case study: jurisdictional fragmentation, lack of zoning coordination and ineffective political power.
Is a disadvantaged neighborhood more likely to have higher warehousing activity intensity?
• Warehousing activity intensity and truck “footprints”.
• Warehousing consolidation and clustering (e.g. Cidell, 2010).
• Disadvantaged neighborhoods may be more subject to high concentration of warehousing activities
Data
• Study area: The Los Angeles Region• 2nd largest metro are in the US
• The largest trade gateway in US
• Comprehensive data available
• N of observations = 3,636 census tracts (normally with
around 3,000 residents per tract)
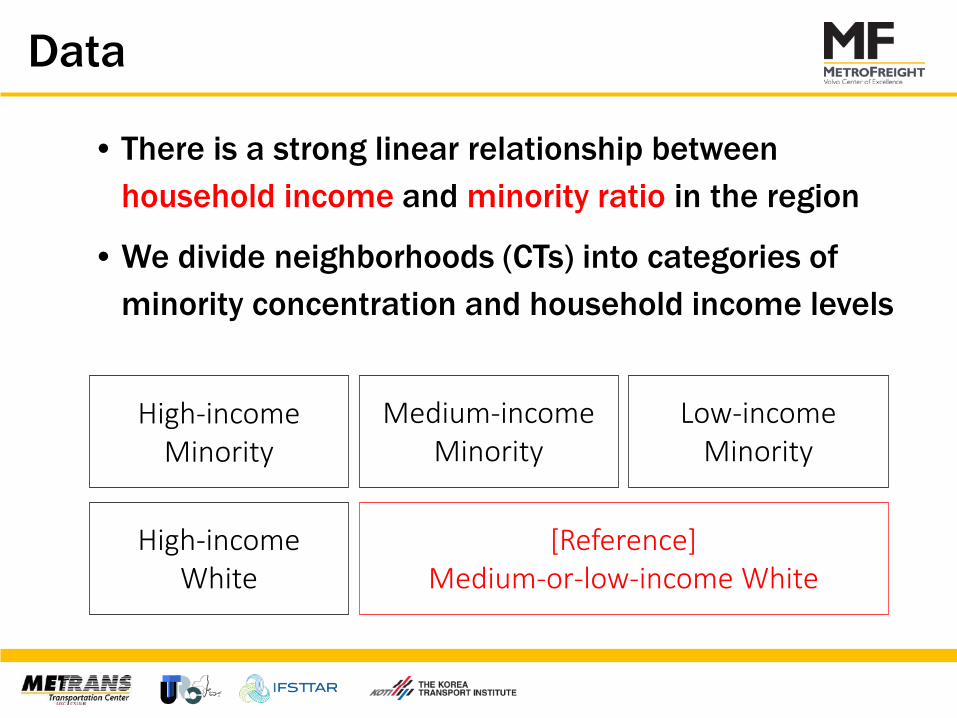
Data
• There is a strong linear relationship between household income and minority ratio in the region
• We divide neighborhoods (CTs) into categories of minority concentration and household income levels
[Reference] Medium-or-low-income White
High-income Minority
Medium-incomeMinority
Low-incomeMinority
High-incomeWhite
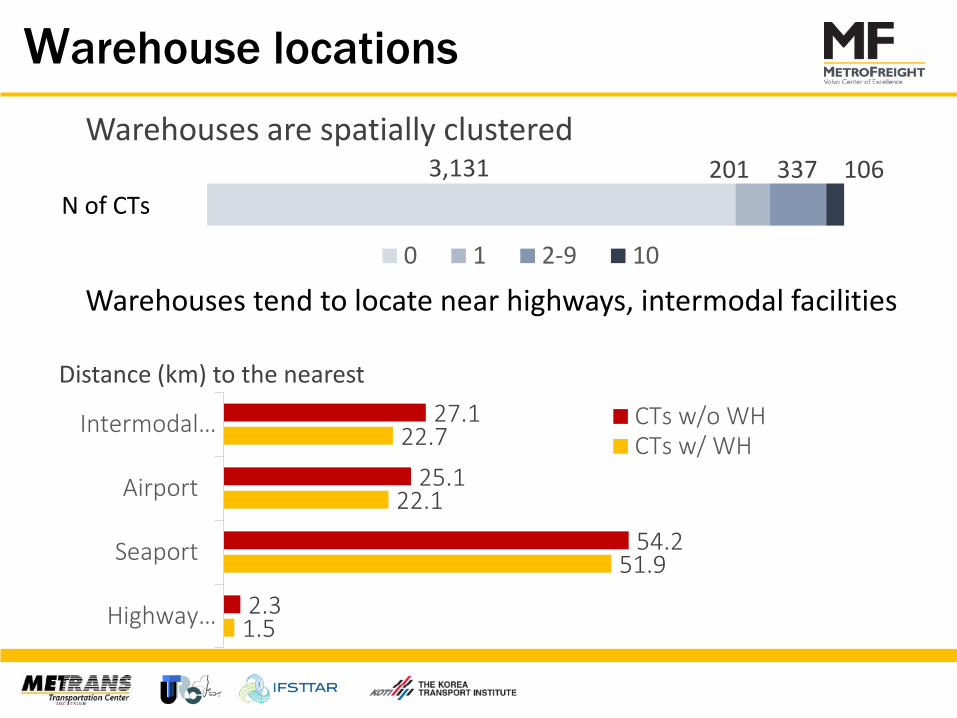
Warehouse locations
Warehouses are spatially clustered3,131 201 337 106
0 1 2-9 10
N of CTs
1.5
51.9
22.1
22.7
2.3
54.2
25.1
27.1
Highway…
Seaport
Airport
Intermodal…
Distance (km) to the nearestCTs w/o WHCTs w/ WH
Warehouses tend to locate near highways, intermodal facilities
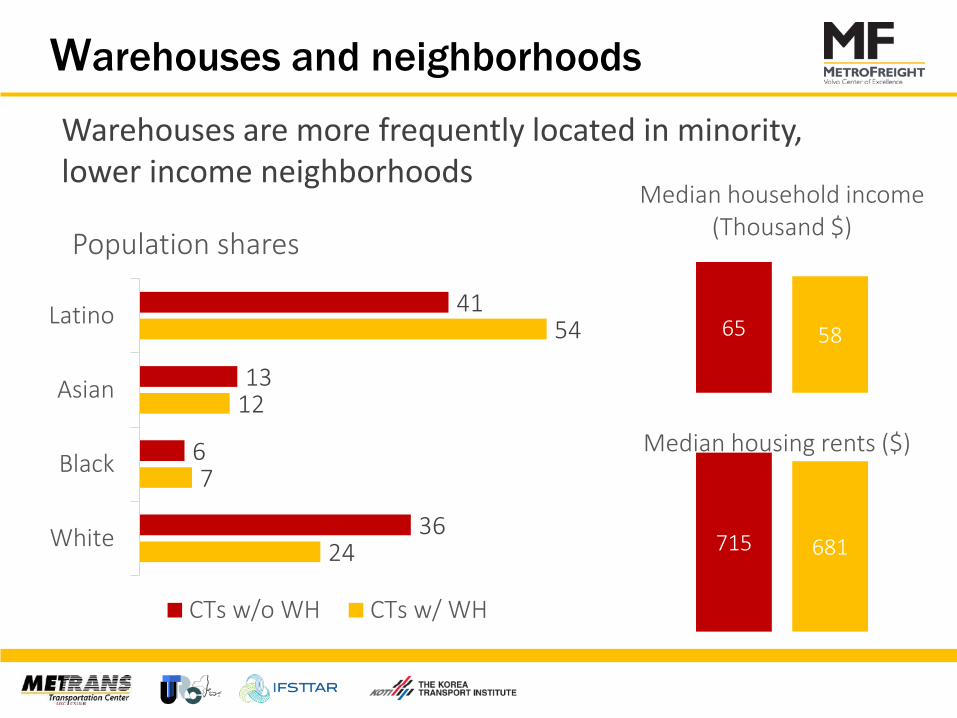
Warehouses and neighborhoods
Warehouses are more frequently located in minority, lower income neighborhoods
65 58
Median household income (Thousand $)
24
7
12
54
36
6
13
41
White
Black
Asian
Latino
Population shares
CTs w/o WH CTs w/ WH
715 681
Median housing rents ($)
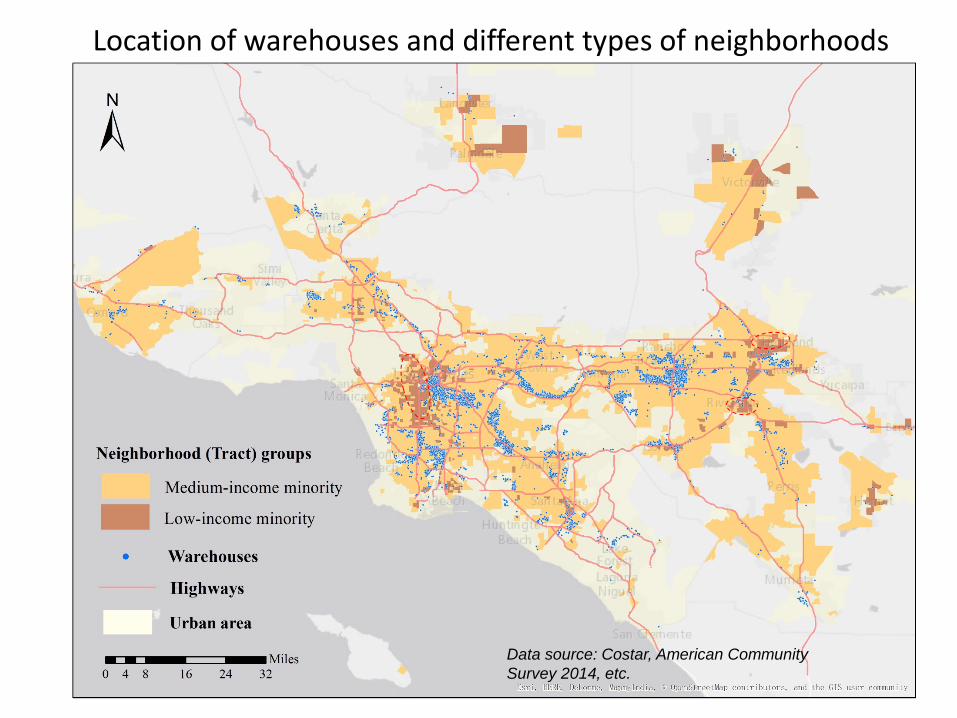
Data source: Costar, American Community Survey 2014, etc.
Location of warehouses and different types of neighborhoods
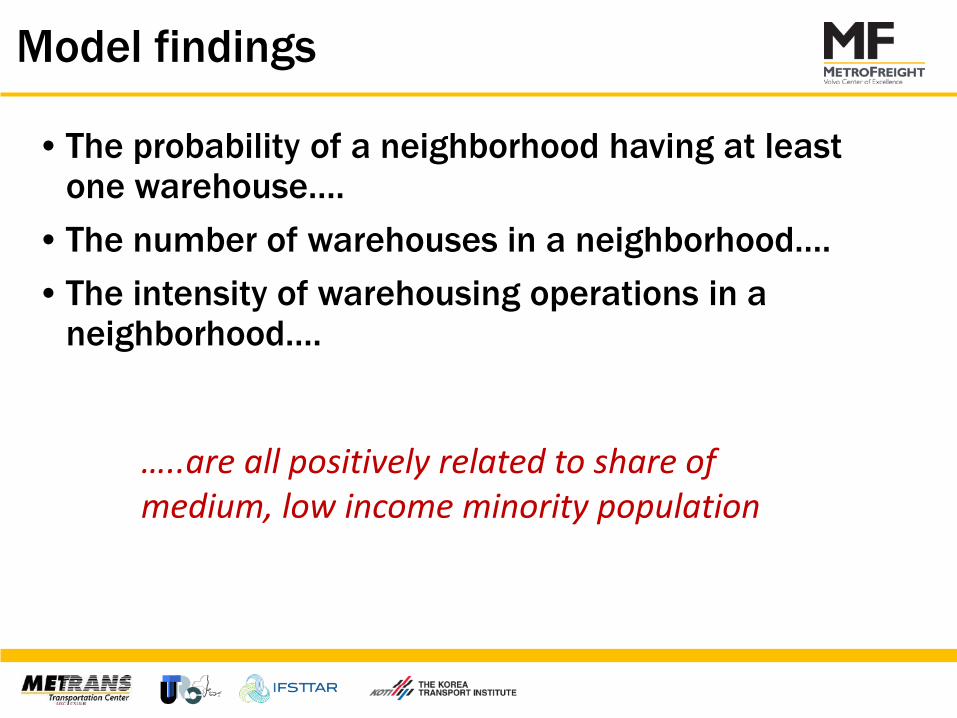
Model findings
• The probability of a neighborhood having at least one warehouse….
• The number of warehouses in a neighborhood….• The intensity of warehousing operations in a
neighborhood….
…..are all positively related to share of medium, low income minority population
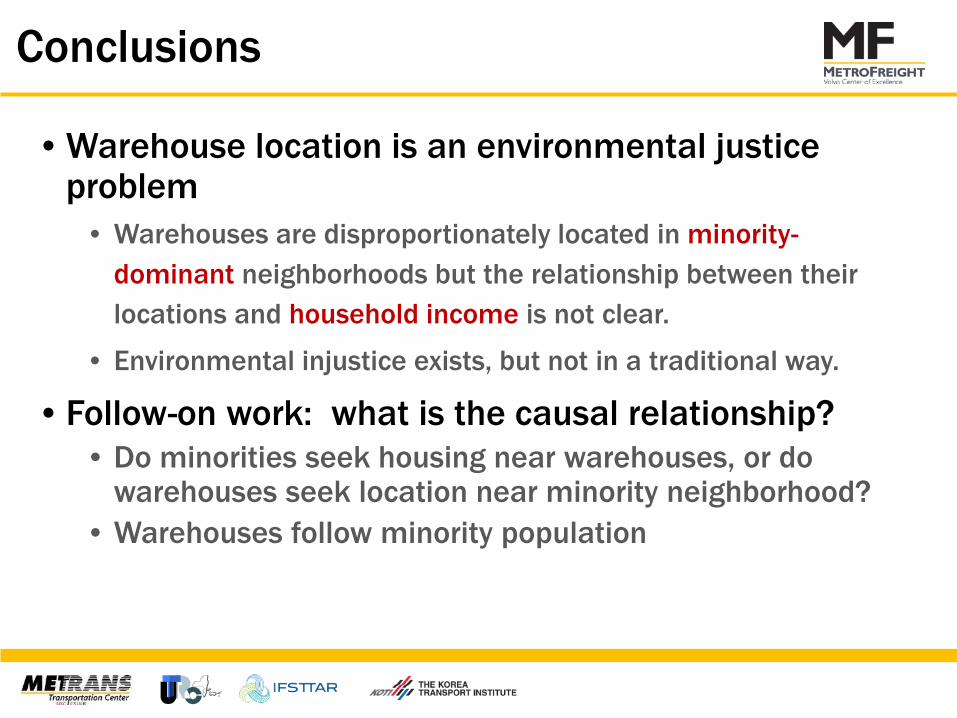
Conclusions
• Warehouse location is an environmental justice problem
• Warehouses are disproportionately located in minority-dominant neighborhoods but the relationship between their locations and household income is not clear.
• Environmental injustice exists, but not in a traditional way.
• Follow-on work: what is the causal relationship?• Do minorities seek housing near warehouses, or do
warehouses seek location near minority neighborhood?• Warehouses follow minority population
Environmental Justice 2Truck and bicycle conflicts: New York case studyAlison Conway
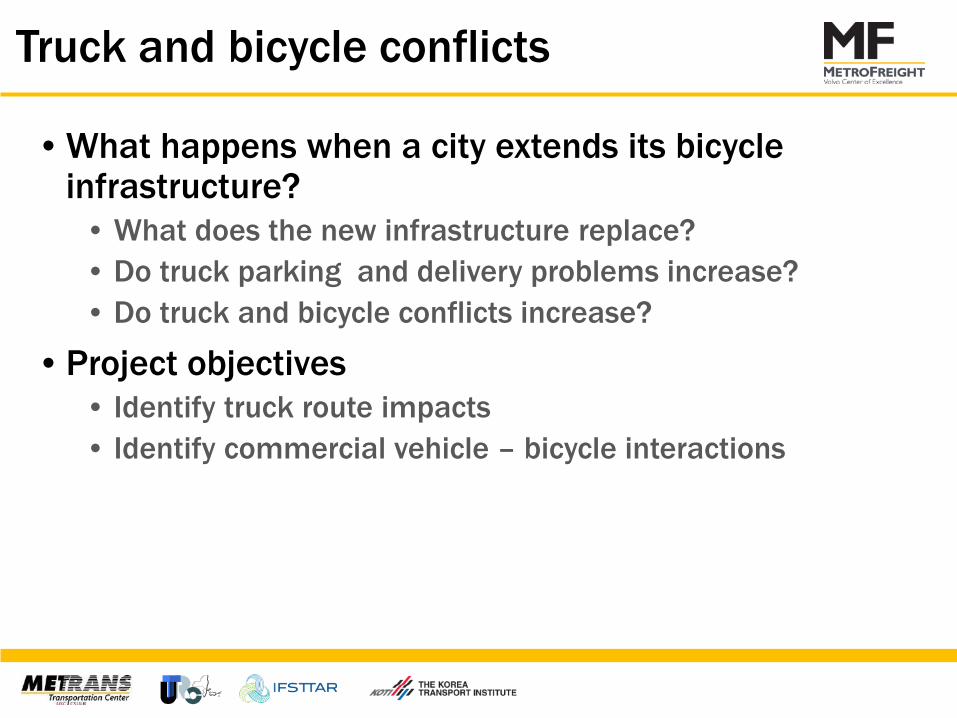
Truck and bicycle conflicts
• What happens when a city extends its bicycle infrastructure?
• What does the new infrastructure replace?• Do truck parking and delivery problems increase?• Do truck and bicycle conflicts increase?
• Project objectives• Identify truck route impacts• Identify commercial vehicle – bicycle interactions
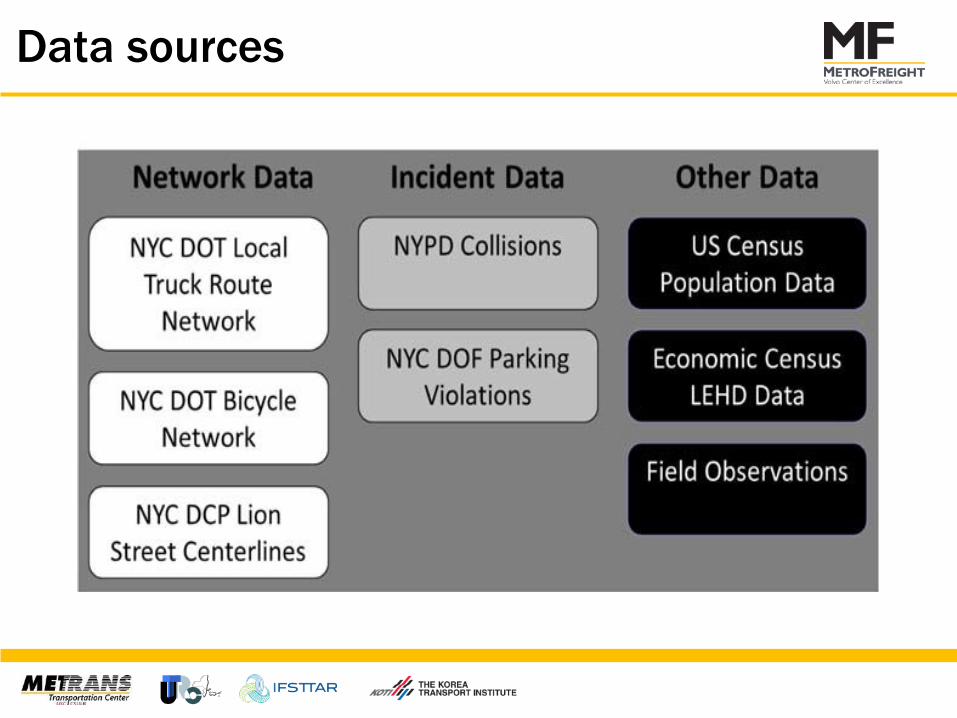
Data sources
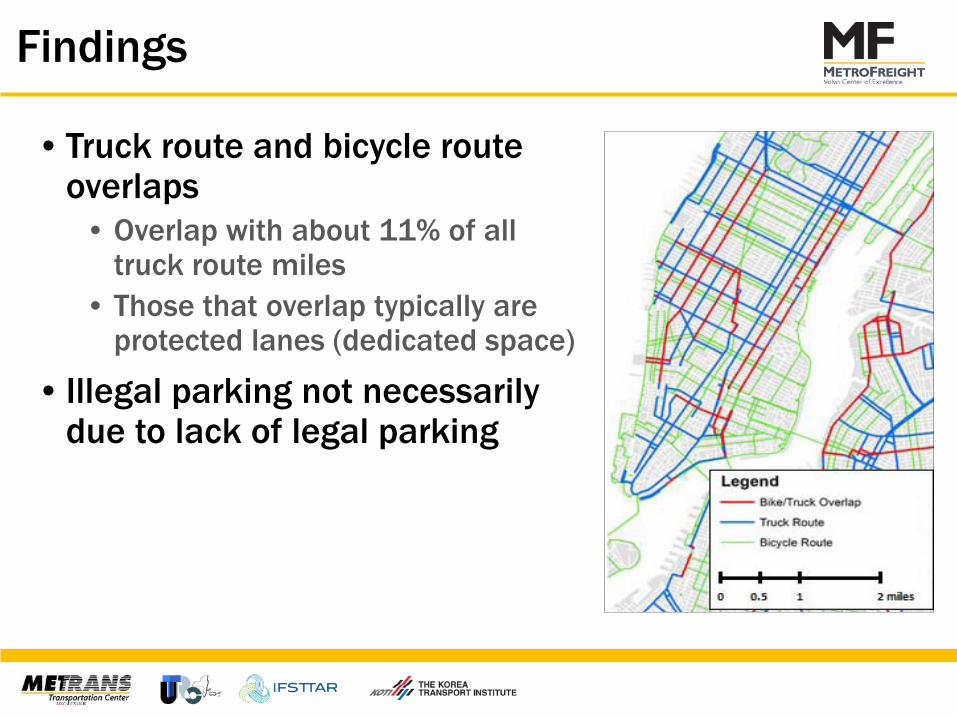
Findings
• Truck route and bicycle route overlaps
• Overlap with about 11% of all truck route miles
• Those that overlap typically are protected lanes (dedicated space)
• Illegal parking not necessarily due to lack of legal parking
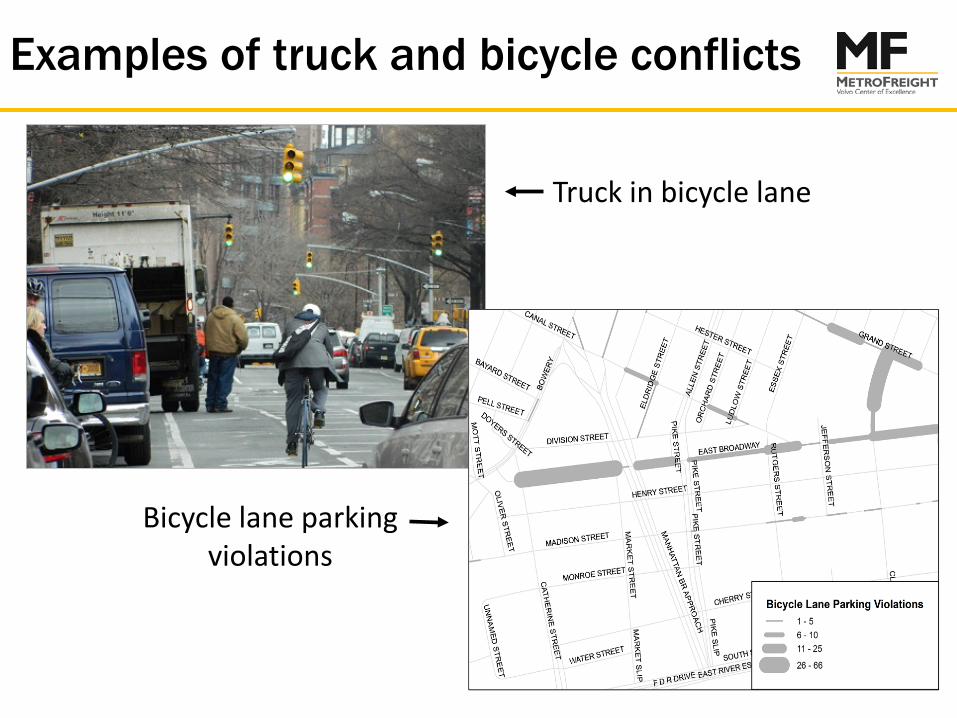
Examples of truck and bicycle conflicts
Bicycle lane parking violations
Truck in bicycle lane
Findings 2: collisions
• Truck and bicycle collisions are rare• They are frequently located in specific corridors• More than half of all bicycle collisions happen on
truck route segments, which account for 19% of on-street bicycle network
• Relatively high rate of collisions on protected paths
Conclusions
• Bicycle lanes on truck routes increase risk• Reducing capacity of truck routes does not
necessarily lead to more safety for bicyclists• Protected lanes on truck routes do not necessarily
lead to more safety for bicyclists• Wholesale, transportation, warehousing, retail are
truck attractors
The environmental justice connection
• Bicycle is essential mode of travel for low income households, especially in places with limited or expensive public transport
• Many low wage workers in wholesale, transportation, warehouse, retail sectors
• Demand for bicycle commuting may be significant• These routes may be most at risk
• Who is served by protected bicycle lanes?
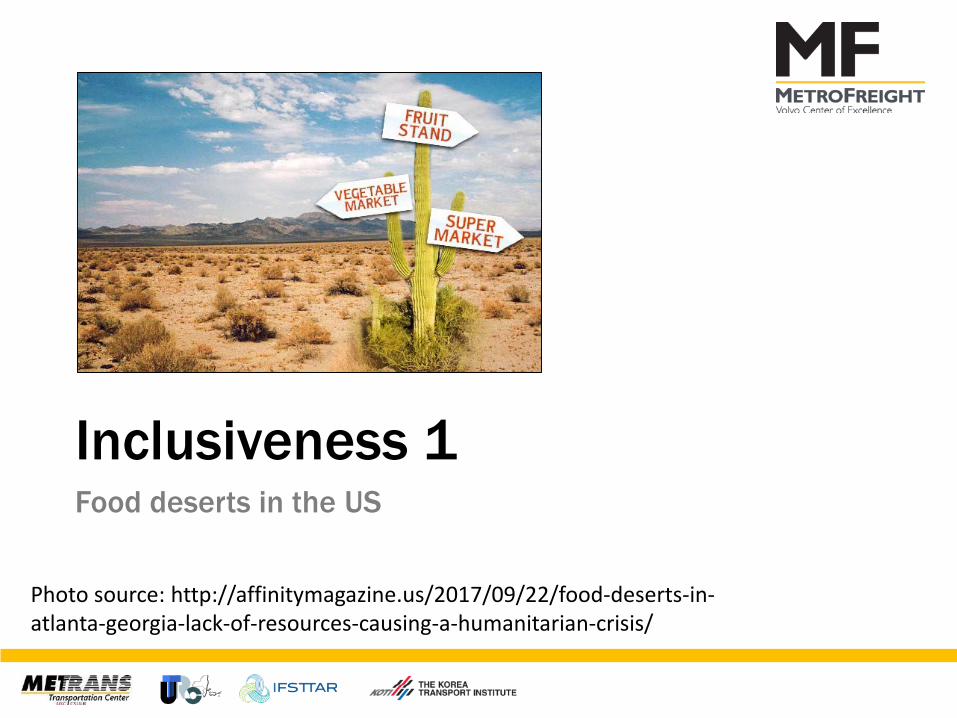
Inclusiveness 1Food deserts in the US
Photo source: http://affinitymagazine.us/2017/09/22/food-deserts-in-atlanta-georgia-lack-of-resources-causing-a-humanitarian-crisis/
What is a food desert?
• US Dept of Agriculture:• “Parts of the country where there is limited availability
of fresh fruit, vegetables, and other healthful whole foods”
• Usually in impoverished areas• Usually due to lack of grocery stores, farmers markets,
other healthy food providers
• In urban areas:• Low income and/or minority neighborhoods• More fast food, liquor stores, mini-markets• Fewer supermarkets with less selection and poorer
quality of fresh foods
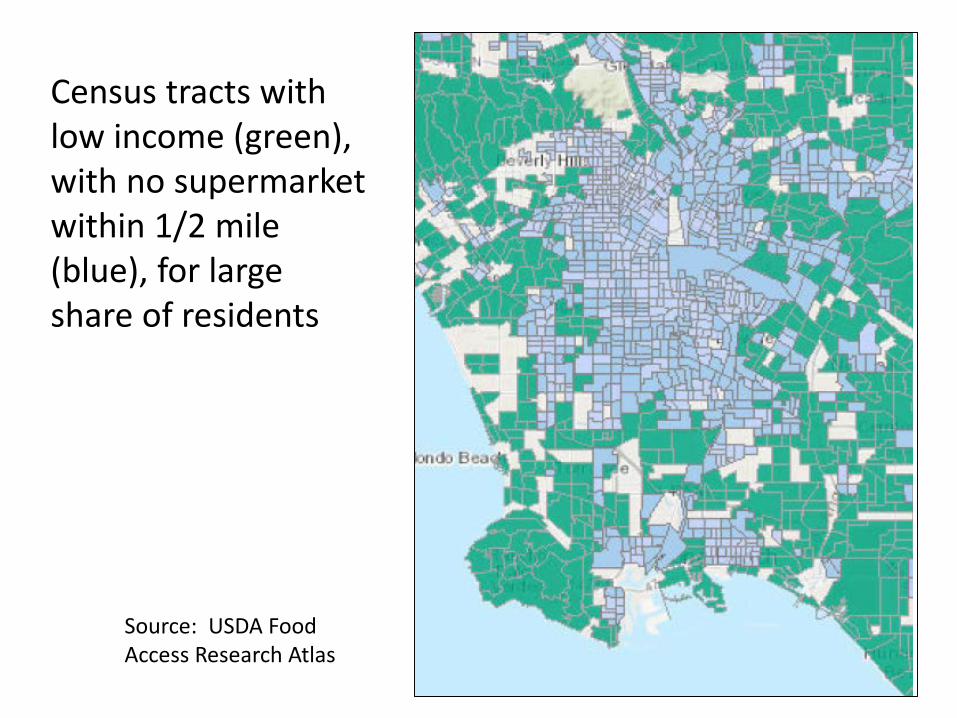
Census tracts with low income (green), with no supermarket within 1/2 mile (blue), for large share of residents
Source: USDA Food Access Research Atlas
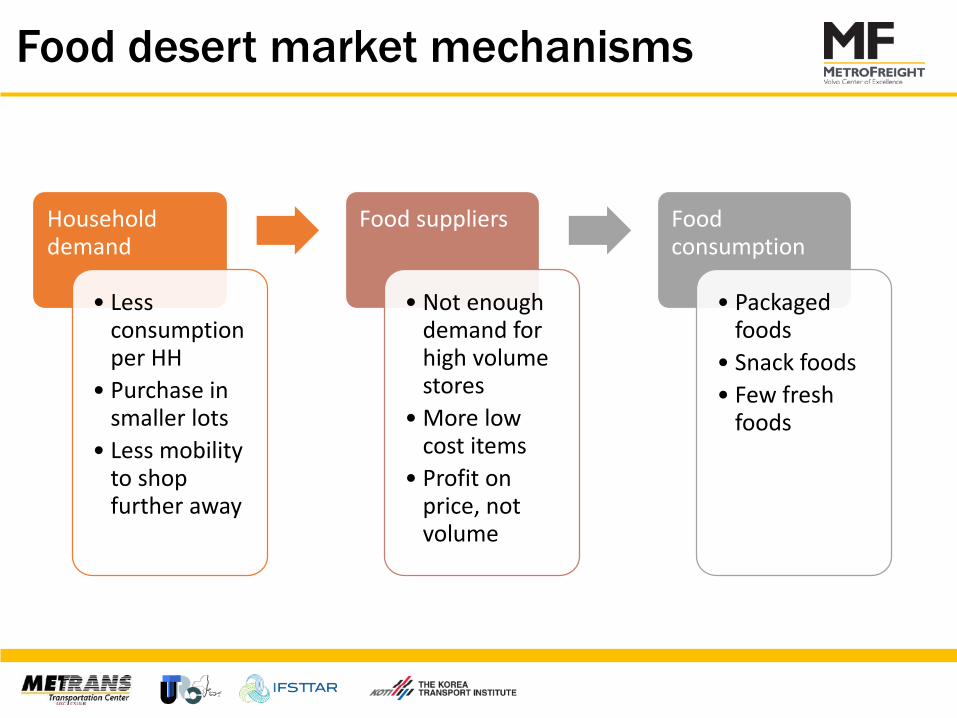
Food desert market mechanisms
Household demand
• Less consumption per HH
• Purchase in smaller lots
• Less mobility to shop further away
Food suppliers
• Not enough demand for high volume stores
• More low cost items
• Profit on price, not volume
Food consumption
• Packaged foods
• Snack foods• Few fresh
foods
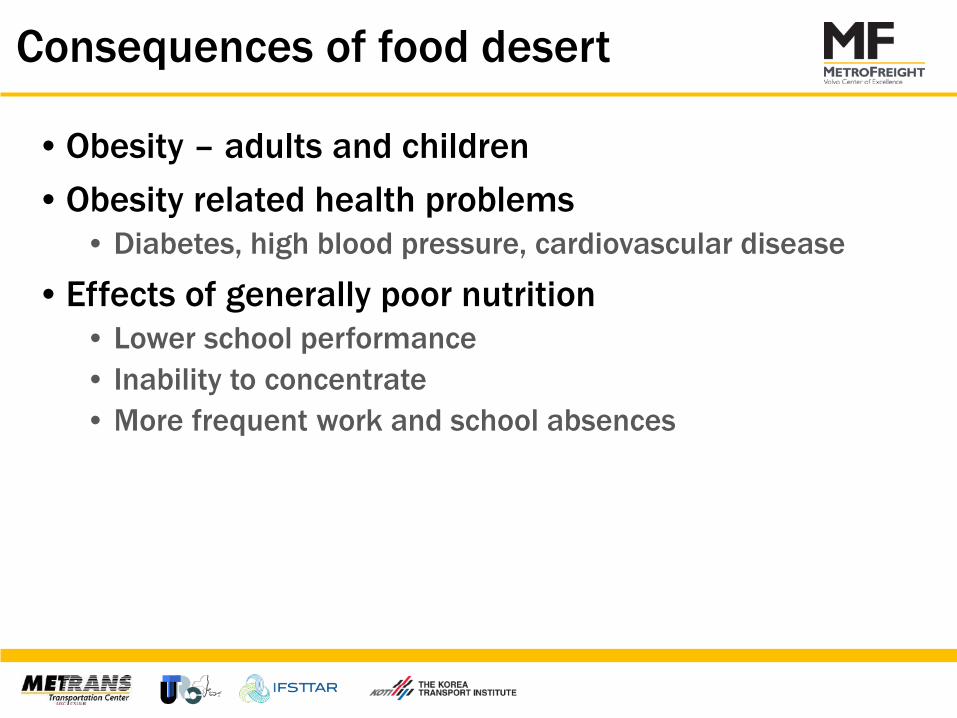
Consequences of food desert
• Obesity – adults and children• Obesity related health problems
• Diabetes, high blood pressure, cardiovascular disease
• Effects of generally poor nutrition• Lower school performance• Inability to concentrate• More frequent work and school absences
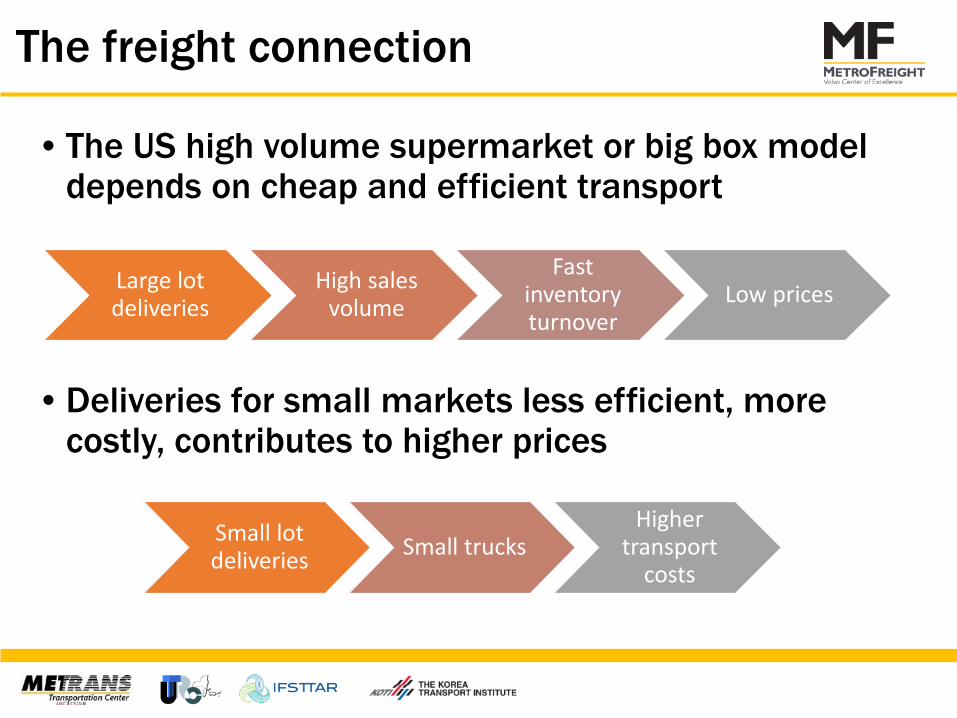
The freight connection
• The US high volume supermarket or big box model depends on cheap and efficient transport
• Deliveries for small markets less efficient, more costly, contributes to higher prices
Large lot deliveries
High sales volume
Fast inventory turnover
Low prices
Small lot deliveries Small trucks
Higher transport
costs
Inclusiveness 2Who benefits from e-Commerce?
Photo source: http://www.pewinternet.org/2016/12/19/online-shopping-and-e-commerce/
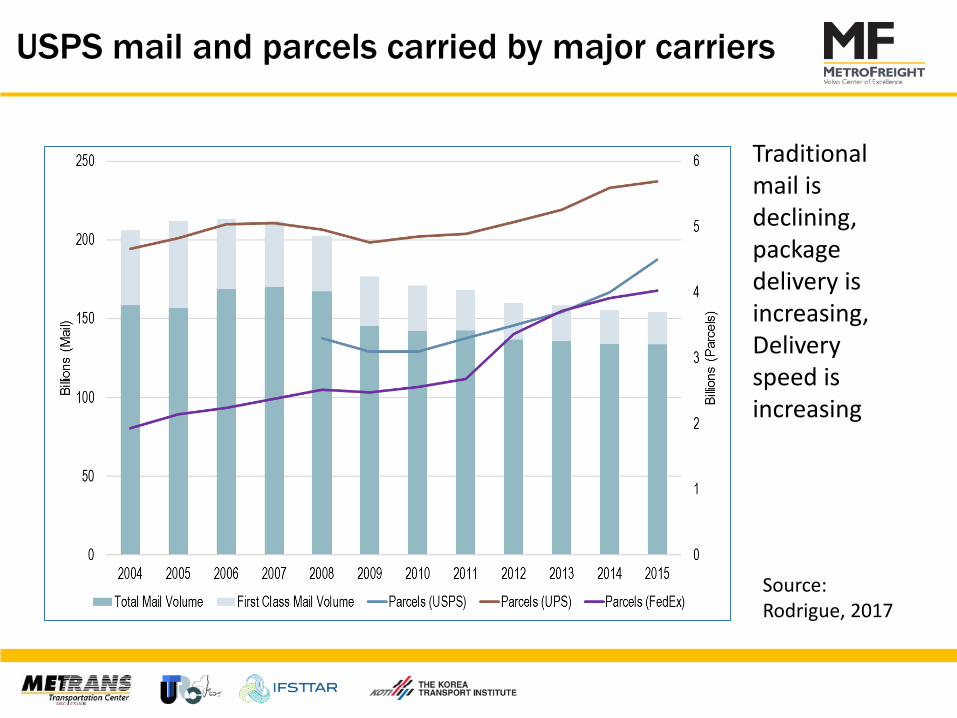
USPS mail and parcels carried by major carriers
Source: Rodrigue, 2017
Traditional mail is declining, package delivery is increasing,Delivery speed is increasing
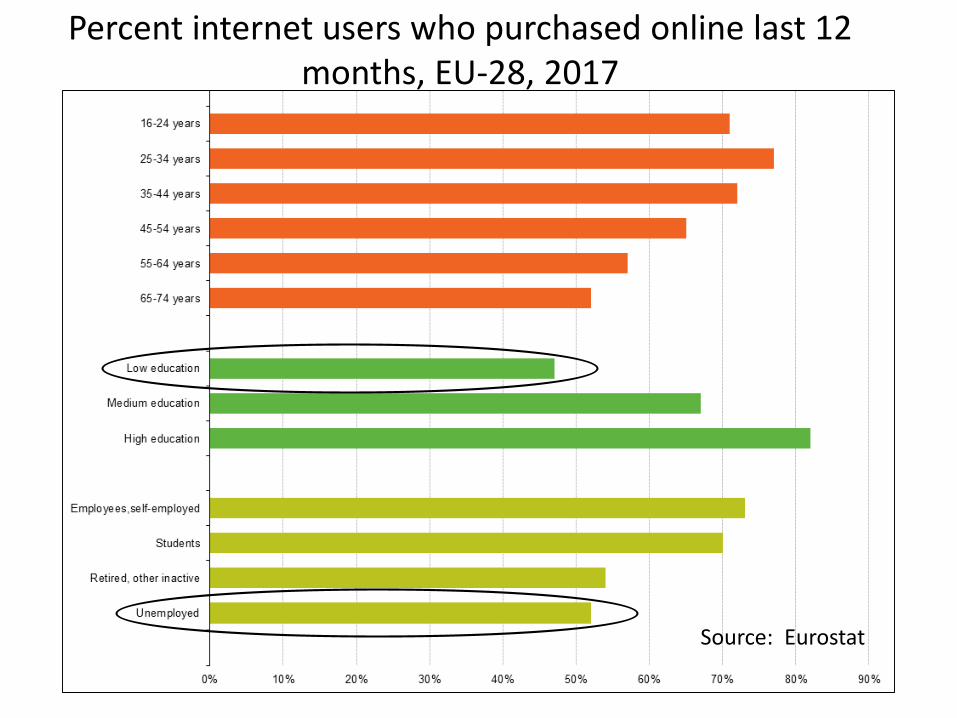
Percent internet users who purchased online last 12 months, EU-28, 2017
Source: Eurostat
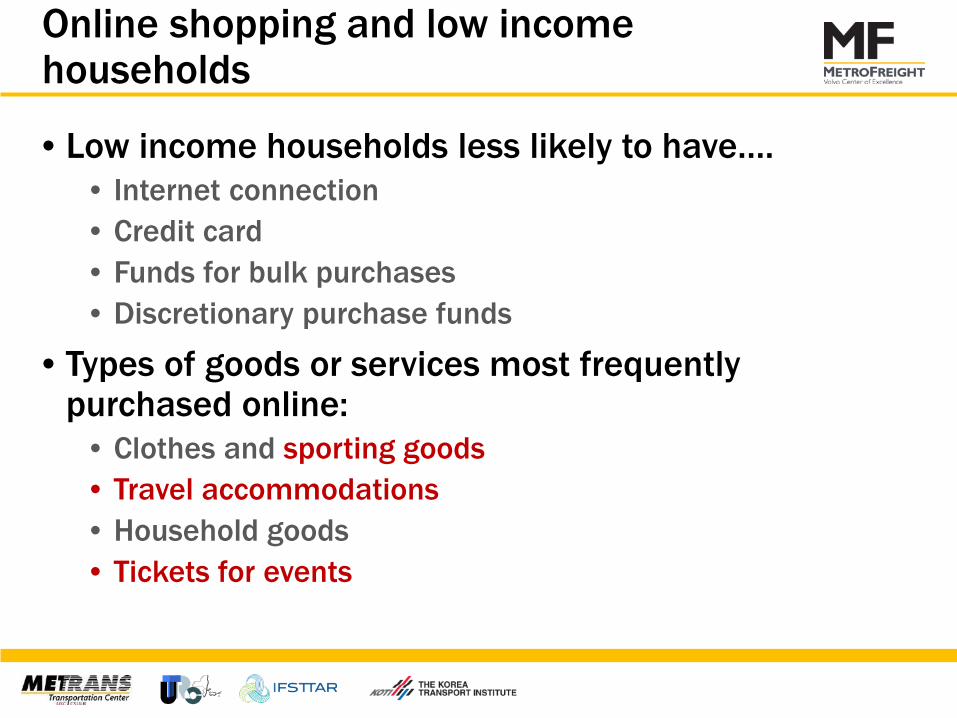
Online shopping and low income households
• Low income households less likely to have….• Internet connection• Credit card• Funds for bulk purchases• Discretionary purchase funds
• Types of goods or services most frequently purchased online:
• Clothes and sporting goods• Travel accommodations• Household goods• Tickets for events
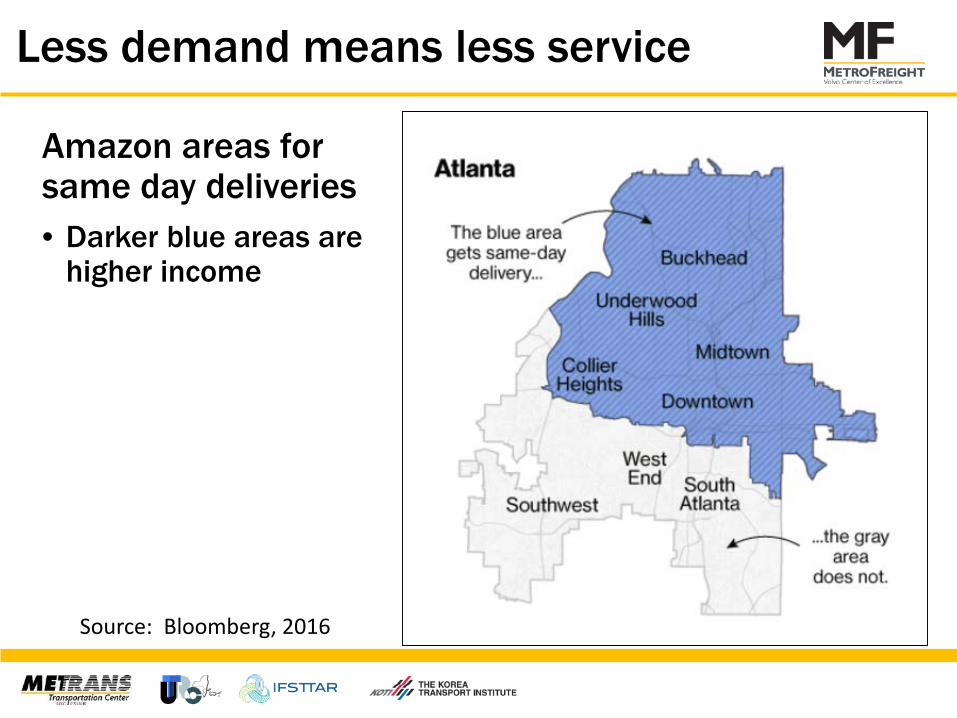
Less demand means less service
Amazon areas for same day deliveries• Darker blue areas are
higher income
Source: Bloomberg, 2016
Conclusions
• Freight is part of everyday life in cities• It influences consumer choices• It provides new conveniences and consumption
opportunities• It conflicts with passenger transport• It contributes to pollution, noise, GHG emissions
• The benefits and costs of freight are not equally distributed
• Higher income households reap the benefits of lower prices, more choices
• Lower income, minority households incur more of the costs and enjoy fewer of the benefits
Policy directions
• Freight is woven into poverty, discrimination problems
• Need to address these larger societal problems• How to reduce negative impacts
• Cleaner fuels• Active management of truck routes, parking, loading
facilities• Dematerialization
• How to expand the benefits• Universal internet access• Micro credit, purchase methods that are not credit
based• Pop-up fresh food markets
Thank [email protected]
References
Conway, A., et al, (2016) “Freight in a bicycle friendly city: Exploratory analysis with New York City open data,” Transportation Research Record 2547, 91-101
Eurostat, http://ec.europa.eu/eurostat/statistics-explained/index.php?title=File:Internet_users_who_bought_or_ordered_goods_or_services_for_private_use_in_the_previous_12_months,_EU-28,_2017_(%25_of_internet_users).png
Rodrique, J-P (2017) Rodrigue, J-P (2018) Residential Parcel Deliveries: Evidence from a Large Apartment Complex. MetroFreight Final Report, Project 17-5.1a. Available at https://www.metrans.org/research-projects/metrofreight.
USDA Economic Research Service, Food Access Research Atlas, https://www.ers.usda.gov/data-products/food-access-research-atlas/go-to-the-atlas.aspx
Yuan, Q. (2017) “Location of warehouses and environmental justice,” Manuscript submitted for publication in Journal of Planning Education and Research.