Embed Size (px)
Citation preview
Environmental footprints of food products and dishes in Germany
Guido Reinhardt, Sven Gärtner, Tobias Wagner
Heidelberg, 2020
ifeu Wilckensstraße 3 D - 69120 Heidelberg Phone +49 6221 4767-0 Fax -19 Email: [email protected] www.ifeu.de
© a
nu
sorn
– s
tock
.ad
ob
e.co
m
© M
araz
em
/ D
ream
stim
e.co
m
© e
yetr
on
ic /
Fo
tolia
.de
2 Environmental footprints of food products and dishes in Germany ifeu
Environmental footprints of food products and dishes
in Germany
Authors:
Dr Guido Reinhardt
Dipl Phys Ing Sven Gärtner
MSc Tobias Wagner
Contact:
Dr Guido Reinhardt
ifeu - Institut für Energie- und Umweltforschung Heidelberg
Wilckensstraße 3, 69120 Heidelberg, Germany
Phone: +49-6221-4767-0, Fax: +49-6221-4767-19
[email protected], www.ifeu.de
Acknowledgements:
Part of this work was funded by the Federal Ministry for the Environment, Nature Conservation and Nuclear
Safety within the framework of the KEEKS project (funding code 03KF0037) as well as by the Federal Envi-
ronment Agency within the framework of the project „Online-Verbraucherinformation zum nachhaltigen
Konsum: Wissenschaftliche Datenbasis für Bilanzierungsinstrumente und sozialwissenschaftliche Auswer-
tungen“ (Online consumer information on sustainable consumption: scientific database for assessment tools
and social science evaluations, funding code 3718163130). We would like to thank the funding agencies,
especially Dr Michael Bilharz from the Federal Environment Agency for his uncomplicated way of support and
constructive discourse. We would also like to thank Dr Hans Marten Paulsen from the Thuenen Institute of
Organic Agriculture for his great efforts in providing data on the feeding of dairy cows [Paulsen 2020]. Fur-
thermore, we would like to thank our ifeu colleagues Marie Hemmen, Heiko Keller, Nils Rettenmaier and
Christina Zinke for their valuable advice and active support for this study.
Heidelberg, 2020
ifeu Environmental footprints of food products and dishes in Germany 3
Table of contents
1 Background and objectives 4
2 Food products considered 5
3 Methodology 5
4 Results 7
4.1 Results: CO2 footprints 8
4.1.1 Fruit and vegetables 8
4.1.2 Milk products, eggs and milk substitute products 11
4.1.3 Meat and alternative protein sources 13
4.1.4 Products rich in starch, oil or sugar 15
4.1.5 Beverages 17
4.1.6 Dishes 18
4.2 Results: Various environmental footprints 19
4.3 Guidance on interpretation and use of results 21
5 Literature 22
4 Environmental footprints of food products and dishes in Germany ifeu
1 Background and objectives
In recent years, public interest in the environmental impact of food production and consumption has in-
creased, in particular in the CO2 footprint of specific food products. However, data on CO2 footprints of food-
stuff differ considerably, including publicly available data from the World Food LCA Database [World Food
LCA Database 2015], the CO2 calculator “Klimatarier” [ifeu 2016] and the application to dishes [Eyrich et al.
2019]. While LCA experts are aware of the reasons for this, it is difficult for the general public to understand
the details.
In addition to the CO2 footprint, the use of natural resources for food production is increasingly discussed.
Since the natural resources water, land and phosphate rock are limited, use competition leads to conflicts in
many regions of the world.
This study aims to raise awareness in this matter. Three main issues are addressed and explained using suita-
ble examples:
Issue 1 deals with the influence of different processes on the environmental impact of food supply, in-
cluding sub-aspects such as packaging, transport, etc. The aim is to enable readers to understand that
carbon footprints depend on different parameters such as the type of agricultural production (conven-
tional or organic farming), the system boundary (food at supermarket checkout or prepared on the
plate), the type of packaging (glass jar or composite carton), and others. Therefore, the following sub-
aspects of the CO2 footprint will be examined in detail for almost 200 food products:
Conventional or organic farming
Average or seasonal / regional production
Domestic production or import by truck, ship or airplane
Different food packaging types
Fresh or frozen goods.
Issue 2 addresses the fact that aside from the CO2 footprint, other important environmental footprints
are associated with food production as well. Thus, the phosphate rock, land use and water footprints of
several food products are presented as examples as well.
Issue 3 provides CO2 footprints for selected, prepared dishes (system boundary: plate) in addition to the
footprints for individual food products mentioned above. This illustrates the considerable influence of
the preparation process and shows possible effects of recipe changes on the total footprint (such as soya
instead of meat bolognese or pasta instead of rice).
In addition to raising awareness of these issues, readers should also be given the opportunity to use the
numbers in their daily life, such as for assessing the environmental impacts of dietary choices available in
Germany. Information on the use of the values is also included in this study.
ifeu Environmental footprints of food products and dishes in Germany 5
2 Food products considered
Almost 200 different food products with various differentiations (cultivation, packaging, import etc., see
above) were selected, divided into the following groups:
Fruit and vegetables
Milk products, eggs and milk substitutes
Meat and alternative protein sources
Products rich in starch, oil or sugar
Beverages.
In all groups, various differentiations were made, which are particularly pronounced within the respective
group. These are shown in the presentations of the respective results.
3 Methodology
The following methodological elements were applied to the calculation of all environmental footprints as-
sessed in this study:
System boundary "supermarket checkout": The system boundary covers agricultural production (includ-
ing all upstream processes such as fertiliser production), food processing (including washing, sorting and,
where appropriate, preserving), packaging (including disposal) and the distribution of individual food-
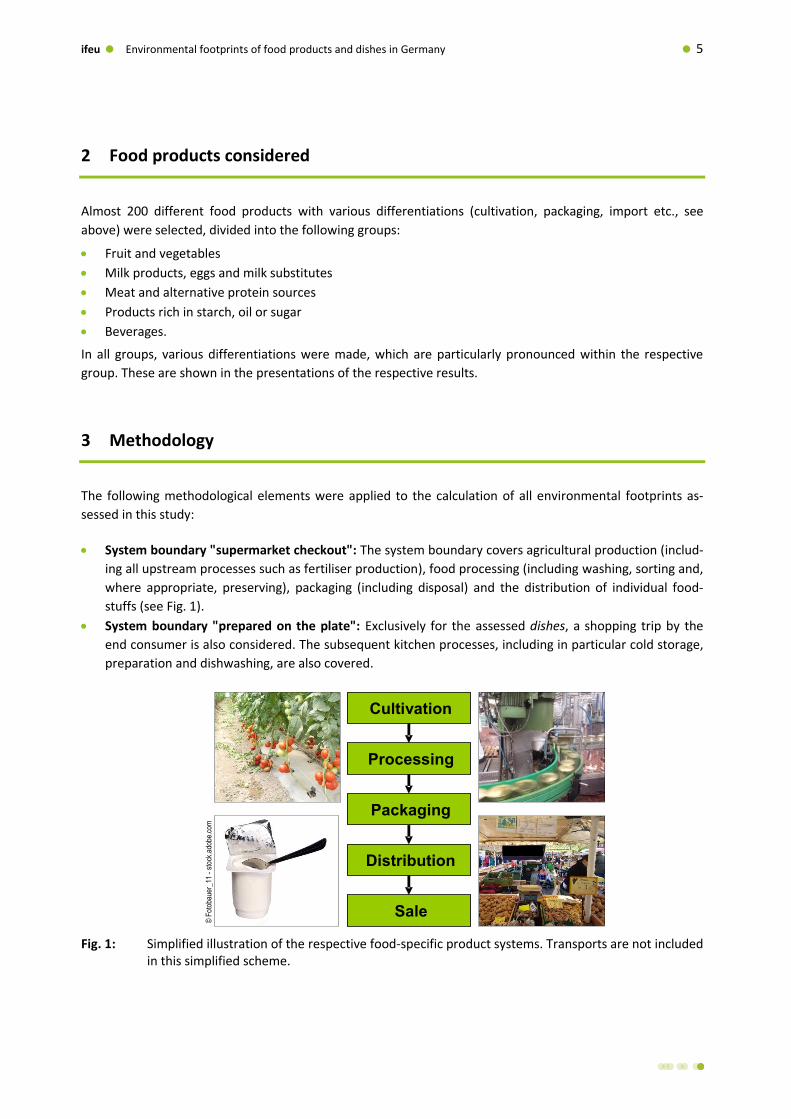
stuffs (see Fig. 1).
System boundary "prepared on the plate": Exclusively for the assessed dishes, a shopping trip by the
end consumer is also considered. The subsequent kitchen processes, including in particular cold storage,
preparation and dishwashing, are also covered.
Fig. 1: Simplified illustration of the respective food-specific product systems. Transports are not included in this simplified scheme.
Cultivation
Processing
Distribution
Sale
Packaging
© F
otob
auer
_11
- st
ock.
adob
e.co
m
6 Environmental footprints of food products and dishes in Germany ifeu
Reference unit for food products: The respective environmental footprint of each food product is relat-
ed to 1 kilogram of food "at the supermarket checkout". It must be pointed out that a comparison per
kilogram of food is only meaningful if the food under consideration fulfils an identical nutritional func-
tion. Approximate comparisons can be made using a suitable reference value reflecting the main func-
tion of the compared foods in the diet (e.g. protein content). See also section 4.3.
Reference unit for dishes: For the dishes the reference unit is defined as 1 serving of the particular dish.
Methodological framework: The ISO 14040 and 14044 standards on product life cycle assessment [ISO
2006a; b] serve as a methodological framework for the calculation of all environmental footprints as-
sessed, using the so-called attributional approach.
Representation of an average food product: Unless stated otherwise, the food products represent an
average food product sold in Germany, i.e. the calculation is based on the weighting of
the share of domestic production and imports
the import shares of different countries of origin
the cultivation methods (open field, greenhouse) throughout all months of the year (including
seasonal / non-seasonal cultivation) and
the respective transports, such as the shares of sea and air transport.
Modelling of transport processes based on the current TREMOD model: The greenhouse gas emissions
related to transport processes are calculated based on the current TREMOD model [ifeu 2020] and the
latest available vehicle data underlying the model.
Modelling of kitchen processes for a household of 4 persons: To calculate the CO2 footprints of pre-
pared dishes, it was assumed that the kitchen processes are conducted in a household of 4 persons.
Among others, this implies better efficiency for preparation processes (cooking, baking, mixing, etc.) than
in a single household, but worse than in a commercial kitchen. For the assessment of dishes, the emis-
sions associated with kitchen processes such as cold storage, preparation and dishwashing include the
average time spent in the refrigerator or freezer, average preparation processes and energy consump-
tion of appliances (such as dishwashers).
CO2 footprint:
In accordance with the ISO 14067 standard for the carbon footprint of products [ISO 2018], all green-
house gas emissions are considered. Besides carbon dioxide (CO2), these also include methane (CH4) and
nitrous oxide (N2O) which are summed to CO2 equivalents using conversion factors [IPCC 2013].
Land use changes and associated greenhouse gas emissions (especially deforestation for agricultural
purposes) were considered using an attributional land use change approach, for details see [Fehrenbach
et al. 2020].
In total, 188 food products and 8 dishes were assessed. The CO2 footprint was calculated for all food-
stuffs and dishes. Additionally, for 35 selected food products the phosphate rock, land use and water
footprint as well as the energy demand was determined. For many food products, different options were
assessed, e.g. "Brussels sprouts, fresh" and "Brussels sprouts, frozen". Two of the eight dishes were as-
sessed with 11 optimised variants. The complete lists are shown in Table 1 to Table 7.
Phosphate rock footprint
Phosphate as a non-renewable resource usually is imported. The main contributor to the phosphate rock
footprint of food is phosphate used as a fertiliser for agricultural production. Moreover, phosphates are
added to processed food. For details see [Reinhardt et al. 2019].
The values for the 35 selected food products in Table 7 are expressed in grams of phosphate rock stand-
ard. This refers to the mass of phosphate rock consumed per 1 kilogram of food.
ifeu Environmental footprints of food products and dishes in Germany 7
Land use footprint:
The land use was calculated by weighing the land types (such as agriculture, roads, industrial land) with a
factor describing the distance from undisturbed natural state. For details see [Fehrenbach et al. 2019].
The values for the 35 selected food products in Table 7 are expressed in square metre years of natural
land use. All different land types of the life cycle are converted into equivalents of completely sealed1
land used for one year for the respective food product2.
Water footprint:
The water volumes consumed are weighted according to the water scarcity in the country of consump-
tion. This and other methodological elements are essentially based on the AWARE method [Boulay et al.
2018].
The values for the 35 selected food products in Table 7 are expressed in litres of water equivalents. This
represents the equivalent of water volume of average scarcity needed for the food product.
Energy demand:
The cumulative energy demand (primary energy) is calculated as non-renewable energy use (NREU), see
e.g. [VDI (Verein Deutscher Ingenieure) 2012].
The values for the 35 selected food products in Table 7 are expressed in kilowatt hours of primary energy
equivalents.
4 Results
Section 4.1 provides the calculated CO2 footprints. Section 4.1.1 – 4.1.5 present the CO2 footprints of select-
ed food products sorted by groups. The selected dishes are shown in section 4.1.6. Section 4.2 lists the phos-
phate rock, land use and water footprints as well as the energy demand of the 35 selected food products.
Finally, section 4.3 provides guidance on the use and interpretation of the results.
1 e.g. land sealed with asphalt. Technical term: artificial land.
2 For example, the land use footprint of 1 kg of conventional beet sugar is mainly caused by agricultural cultivation and sugar
production. Approximately 0.9 m² are used for cultivation for one year. Conventional sugar beet cultivation is classified as the most intensive agricultural type of cultivation. Consequently, it is multiplied by a factor of 0.5 (for details, including hemeroby classes, see [Fehrenbach et al. 2019]). In addition, approx. 0.0005 m² of industrial land is used for sugar production per kilogram of sugar. The sealed land is multiplied by a factor of 1.0 due to the maximum “distance to nature”. Thus, the industrial land is weighted twice as much as the cultivated land, but still contributes significantly less than 1% to the total land use footprint.
8 Environmental footprints of food products and dishes in Germany ifeu
4.1 Results: CO2 footprints
4.1.1 Fruit and vegetables
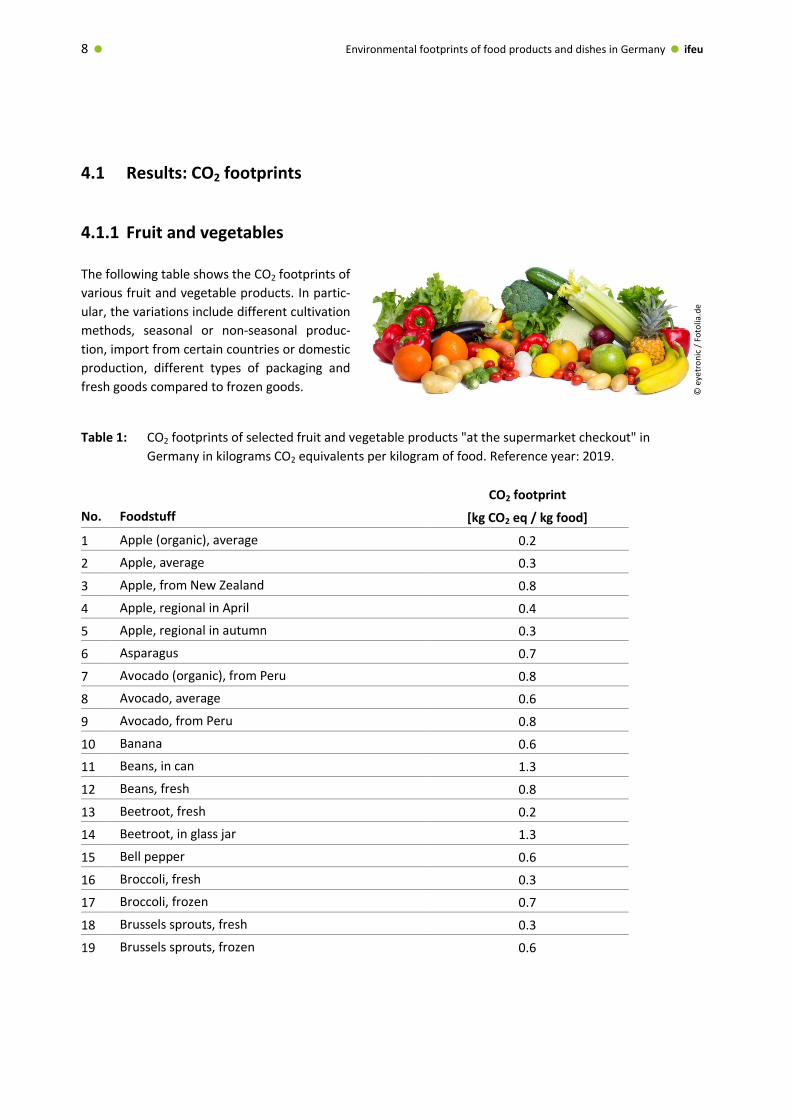
The following table shows the CO2 footprints of
various fruit and vegetable products. In partic-
ular, the variations include different cultivation
methods, seasonal or non-seasonal produc-
tion, import from certain countries or domestic
production, different types of packaging and
fresh goods compared to frozen goods.
Table 1: CO2 footprints of selected fruit and vegetable products "at the supermarket checkout" in
Germany in kilograms CO2 equivalents per kilogram of food. Reference year: 2019.
CO2 footprint
[kg CO2 eq / kg food] No. Foodstuff
1 Apple (organic), average 0.2
2 Apple, average 0.3
3 Apple, from New Zealand 0.8
4 Apple, regional in April 0.4
5 Apple, regional in autumn 0.3
6 Asparagus 0.7
7 Avocado (organic), from Peru 0.8
8 Avocado, average 0.6
9 Avocado, from Peru 0.8
10 Banana 0.6
11 Beans, in can 1.3
12 Beans, fresh 0.8
13 Beetroot, fresh 0.2
14 Beetroot, in glass jar 1.3
15 Bell pepper 0.6
16 Broccoli, fresh 0.3
17 Broccoli, frozen 0.7
18 Brussels sprouts, fresh 0.3
19 Brussels sprouts, frozen 0.6
© e
yetr
on
ic /
Fo
tolia
.de
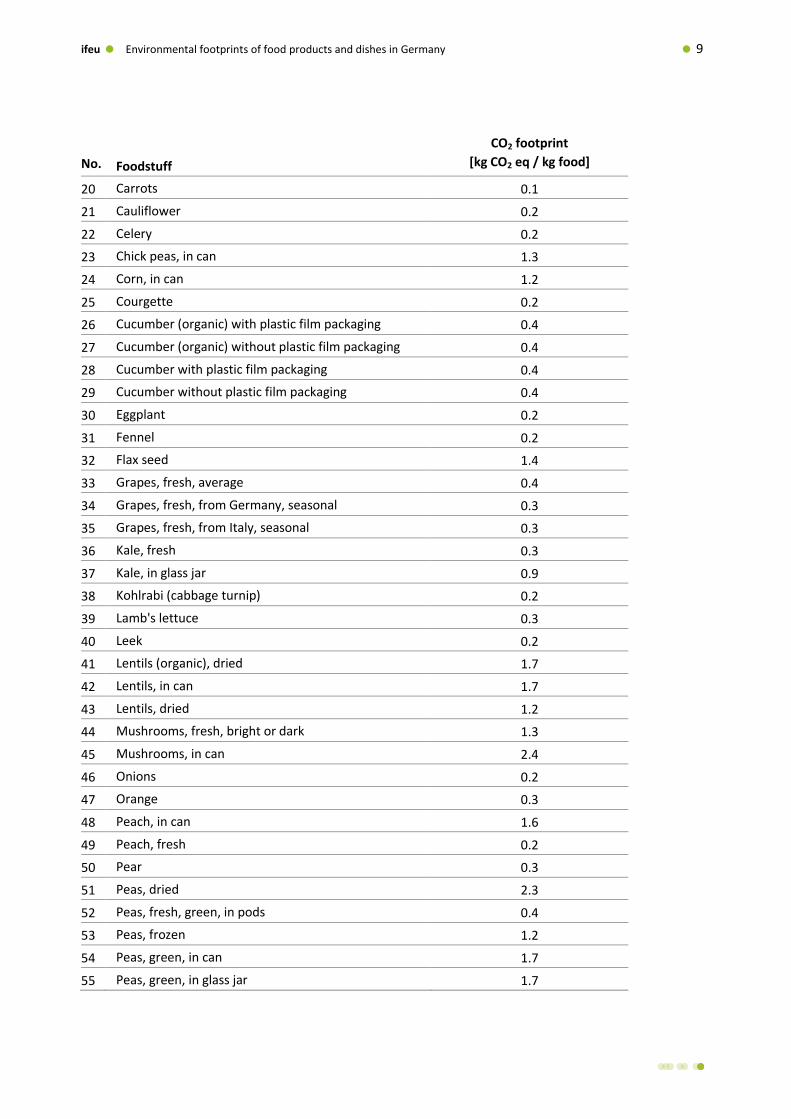
ifeu Environmental footprints of food products and dishes in Germany 9
CO2 footprint
[kg CO2 eq / kg food] No. Foodstuff
20 Carrots 0.1
21 Cauliflower 0.2
22 Celery 0.2
23 Chick peas, in can 1.3
24 Corn, in can 1.2
25 Courgette 0.2
26 Cucumber (organic) with plastic film packaging 0.4
27 Cucumber (organic) without plastic film packaging 0.4
28 Cucumber with plastic film packaging 0.4
29 Cucumber without plastic film packaging 0.4
30 Eggplant 0.2
31 Fennel 0.2
32 Flax seed 1.4
33 Grapes, fresh, average 0.4
34 Grapes, fresh, from Germany, seasonal 0.3
35 Grapes, fresh, from Italy, seasonal 0.3
36 Kale, fresh 0.3
37 Kale, in glass jar 0.9
38 Kohlrabi (cabbage turnip) 0.2
39 Lamb's lettuce 0.3
40 Leek 0.2
41 Lentils (organic), dried 1.7
42 Lentils, in can 1.7
43 Lentils, dried 1.2
44 Mushrooms, fresh, bright or dark 1.3
45 Mushrooms, in can 2.4
46 Onions 0.2
47 Orange 0.3
48 Peach, in can 1.6
49 Peach, fresh 0.2
50 Pear 0.3
51 Peas, dried 2.3
52 Peas, fresh, green, in pods 0.4
53 Peas, frozen 1.2
54 Peas, green, in can 1.7
55 Peas, green, in glass jar 1.7
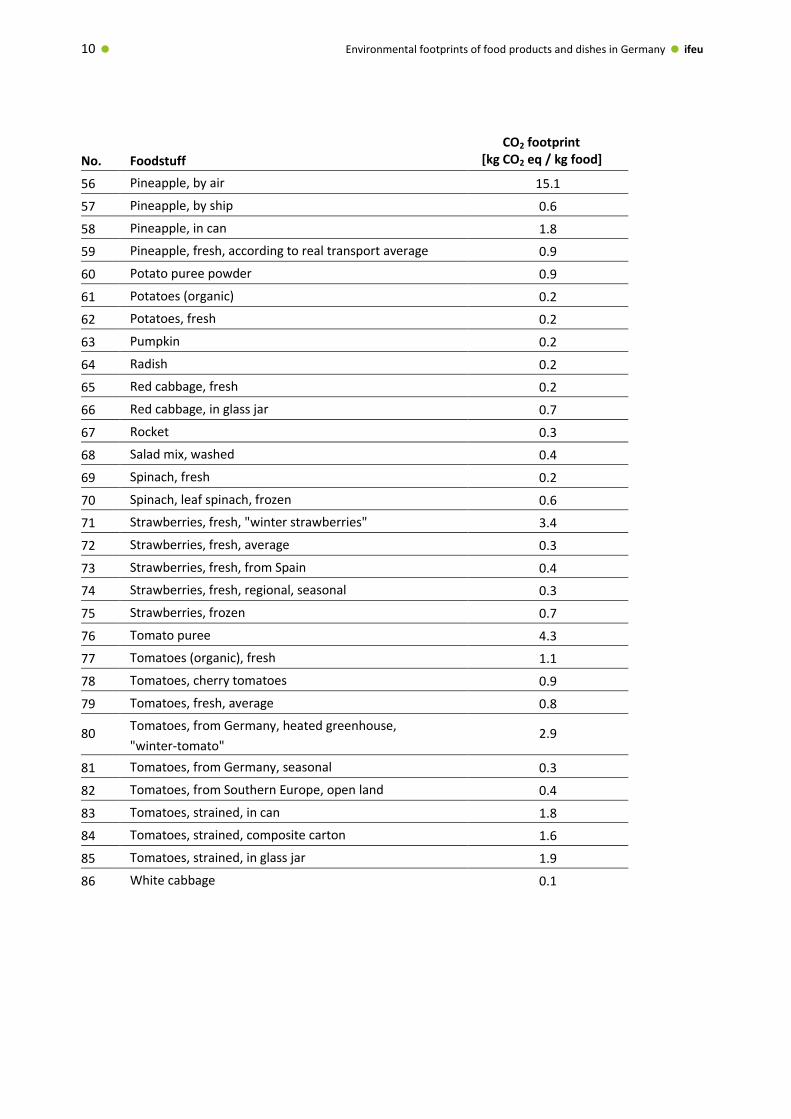
10 Environmental footprints of food products and dishes in Germany ifeu
CO2 footprint [kg CO2 eq / kg food] No. Foodstuff
56 Pineapple, by air 15.1
57 Pineapple, by ship 0.6
58 Pineapple, in can 1.8
59 Pineapple, fresh, according to real transport average 0.9
60 Potato puree powder 0.9
61 Potatoes (organic) 0.2
62 Potatoes, fresh 0.2
63 Pumpkin 0.2
64 Radish 0.2
65 Red cabbage, fresh 0.2
66 Red cabbage, in glass jar 0.7
67 Rocket 0.3
68 Salad mix, washed 0.4
69 Spinach, fresh 0.2
70 Spinach, leaf spinach, frozen 0.6
71 Strawberries, fresh, "winter strawberries" 3.4
72 Strawberries, fresh, average 0.3
73 Strawberries, fresh, from Spain 0.4
74 Strawberries, fresh, regional, seasonal 0.3
75 Strawberries, frozen 0.7
76 Tomato puree 4.3
77 Tomatoes (organic), fresh 1.1
78 Tomatoes, cherry tomatoes 0.9
79 Tomatoes, fresh, average 0.8
80 Tomatoes, from Germany, heated greenhouse,
"winter-tomato" 2.9
81 Tomatoes, from Germany, seasonal 0.3
82 Tomatoes, from Southern Europe, open land 0.4
83 Tomatoes, strained, in can 1.8
84 Tomatoes, strained, composite carton 1.6
85 Tomatoes, strained, in glass jar 1.9
86 White cabbage 0.1
ifeu Environmental footprints of food products and dishes in Germany 11
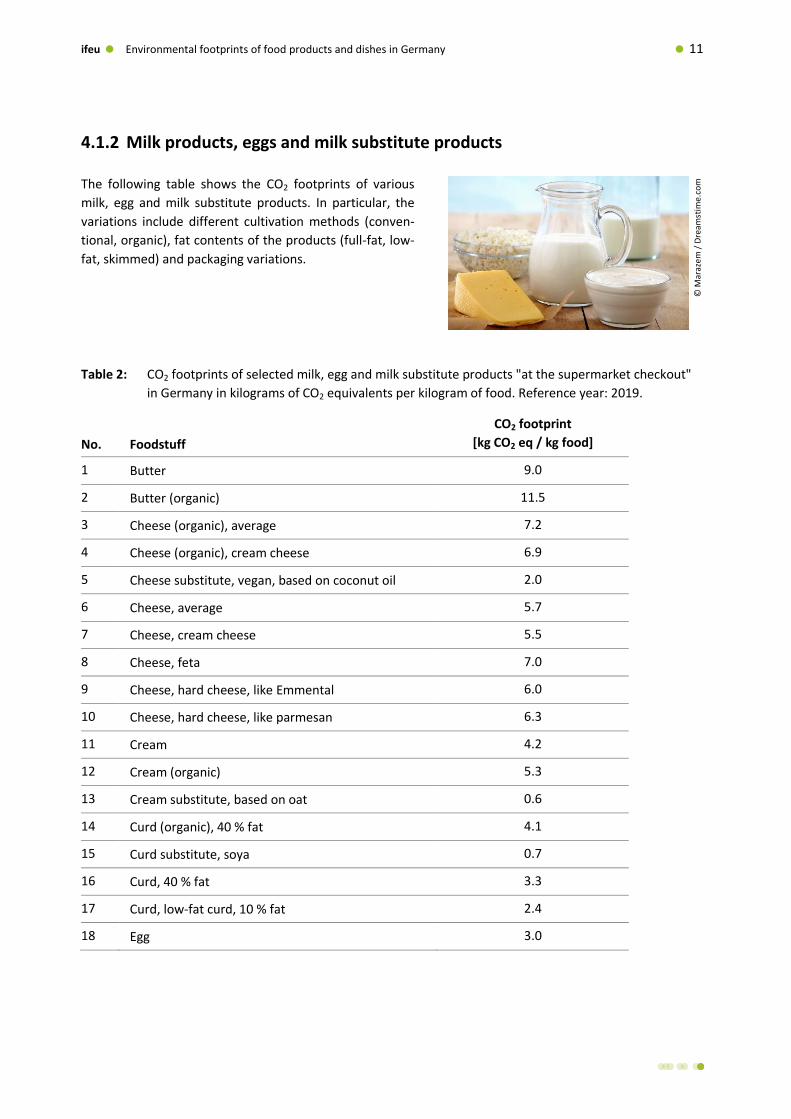
4.1.2 Milk products, eggs and milk substitute products
The following table shows the CO2 footprints of various
milk, egg and milk substitute products. In particular, the
variations include different cultivation methods (conven-
tional, organic), fat contents of the products (full-fat, low-
fat, skimmed) and packaging variations.
Table 2: CO2 footprints of selected milk, egg and milk substitute products "at the supermarket checkout"
in Germany in kilograms of CO2 equivalents per kilogram of food. Reference year: 2019.
CO2 footprint
[kg CO2 eq / kg food] No. Foodstuff
1 Butter 9.0
2 Butter (organic) 11.5
3 Cheese (organic), average 7.2
4 Cheese (organic), cream cheese 6.9
5 Cheese substitute, vegan, based on coconut oil 2.0
6 Cheese, average 5.7
7 Cheese, cream cheese 5.5
8 Cheese, feta 7.0
9 Cheese, hard cheese, like Emmental 6.0
10 Cheese, hard cheese, like parmesan 6.3
11 Cream 4.2
12 Cream (organic) 5.3
13 Cream substitute, based on oat 0.6
14 Curd (organic), 40 % fat 4.1
15 Curd substitute, soya 0.7
16 Curd, 40 % fat 3.3
17 Curd, low-fat curd, 10 % fat 2.4
18 Egg 3.0
© M
araz
em
/ D
ream
stim
e.co
m
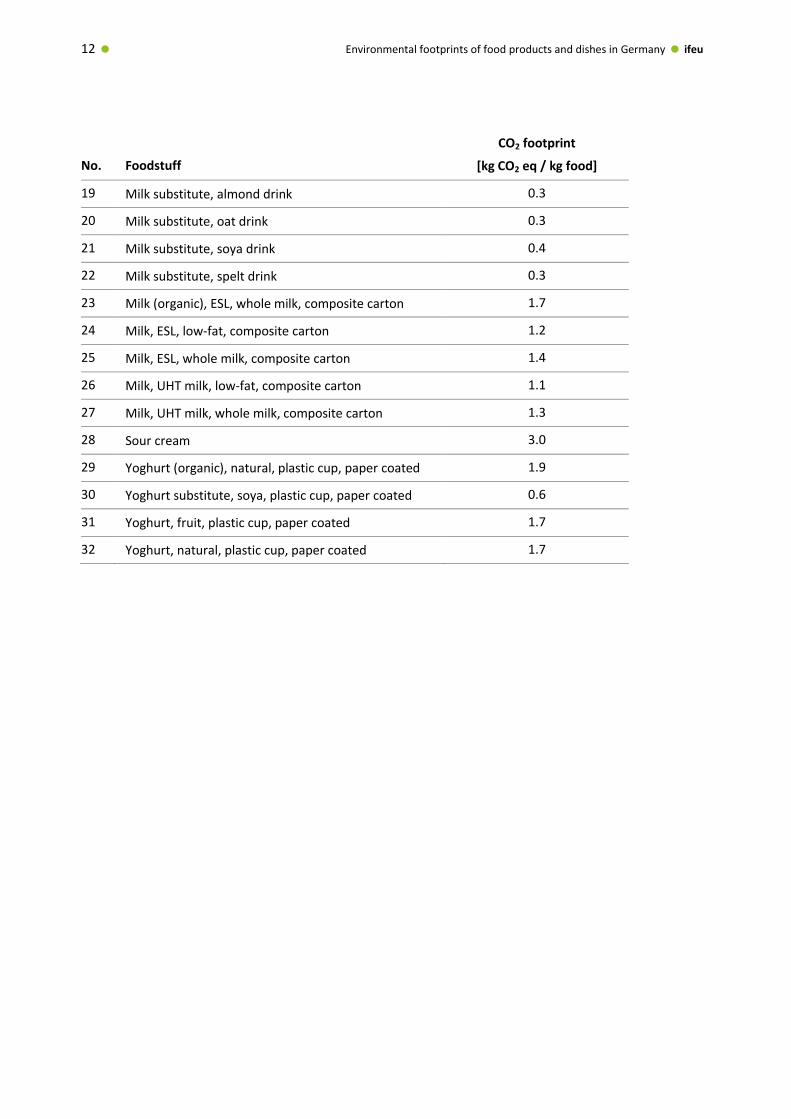
12 Environmental footprints of food products and dishes in Germany ifeu
CO2 footprint
[kg CO2 eq / kg food] No. Foodstuff
19 Milk substitute, almond drink 0.3
20 Milk substitute, oat drink 0.3
21 Milk substitute, soya drink 0.4
22 Milk substitute, spelt drink 0.3
23 Milk (organic), ESL, whole milk, composite carton 1.7
24 Milk, ESL, low-fat, composite carton 1.2
25 Milk, ESL, whole milk, composite carton 1.4
26 Milk, UHT milk, low-fat, composite carton 1.1
27 Milk, UHT milk, whole milk, composite carton 1.3
28 Sour cream 3.0
29 Yoghurt (organic), natural, plastic cup, paper coated 1.9
30 Yoghurt substitute, soya, plastic cup, paper coated 0.6
31 Yoghurt, fruit, plastic cup, paper coated 1.7
32 Yoghurt, natural, plastic cup, paper coated 1.7
ifeu Environmental footprints of food products and dishes in Germany 13
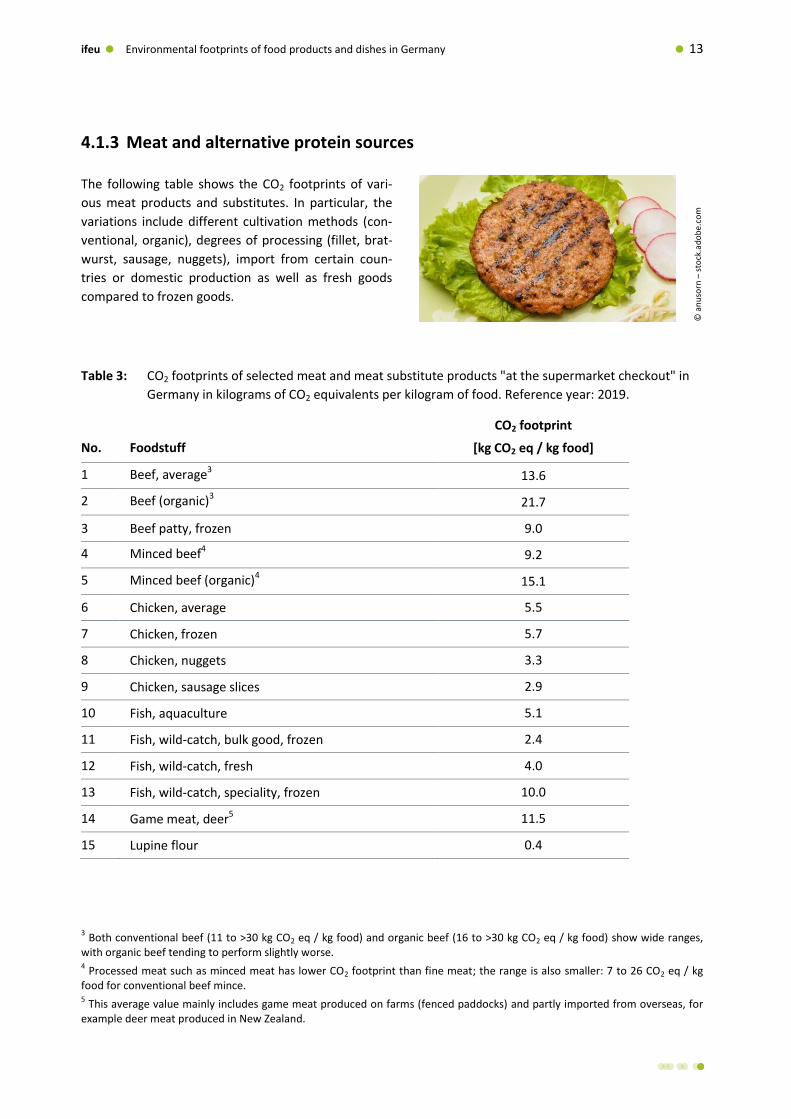
4.1.3 Meat and alternative protein sources
The following table shows the CO2 footprints of vari-
ous meat products and substitutes. In particular, the
variations include different cultivation methods (con-
ventional, organic), degrees of processing (fillet, brat-
wurst, sausage, nuggets), import from certain coun-
tries or domestic production as well as fresh goods
compared to frozen goods.
Table 3: CO2 footprints of selected meat and meat substitute products "at the supermarket checkout" in
Germany in kilograms of CO2 equivalents per kilogram of food. Reference year: 2019.
CO2 footprint
[kg CO2 eq / kg food] No. Foodstuff
1 Beef, average3 13.6
2 Beef (organic)3 21.7
3 Beef patty, frozen 9.0
4 Minced beef4 9.2
5 Minced beef (organic)4 15.1
6 Chicken, average 5.5
7 Chicken, frozen 5.7
8 Chicken, nuggets 3.3
9 Chicken, sausage slices 2.9
10 Fish, aquaculture 5.1
11 Fish, wild-catch, bulk good, frozen 2.4
12 Fish, wild-catch, fresh 4.0
13 Fish, wild-catch, speciality, frozen 10.0
14 Game meat, deer5 11.5
15 Lupine flour 0.4
3 Both conventional beef (11 to >30 kg CO2 eq / kg food) and organic beef (16 to >30 kg CO2 eq / kg food) show wide ranges,
with organic beef tending to perform slightly worse. 4 Processed meat such as minced meat has lower CO2 footprint than fine meat; the range is also smaller: 7 to 26 CO2 eq / kg
food for conventional beef mince. 5 This average value mainly includes game meat produced on farms (fenced paddocks) and partly imported from overseas, for
example deer meat produced in New Zealand.
© a
nu
sorn
– s
tock
.ad
ob
e.co
m
14 Environmental footprints of food products and dishes in Germany ifeu
CO2 footprint
[kg CO2 eq / kg food] No. Foodstuff
16 Pork (organic) 5.2
17 Pork, average 4.6
18 Pork, frozen 4.6
19 Prawns, frozen 12.5
20 Sausage slices, beef, cold cuts 7.9
21 Sausage substitute, vegan bratwurst 1.7
22 Sausage, bratwurst, “Thüringer Rostbratwurst”
(Thuringian bratwurst) 2.9
23 Seitan 2.5
24 Soya granules, Textured Vegetable Protein (TVP) 1.0
25 Tempeh 0.7
26 Tofu 1.0
27 Vegetable nuggets /-schnitzel 1.3
ifeu Environmental footprints of food products and dishes in Germany 15
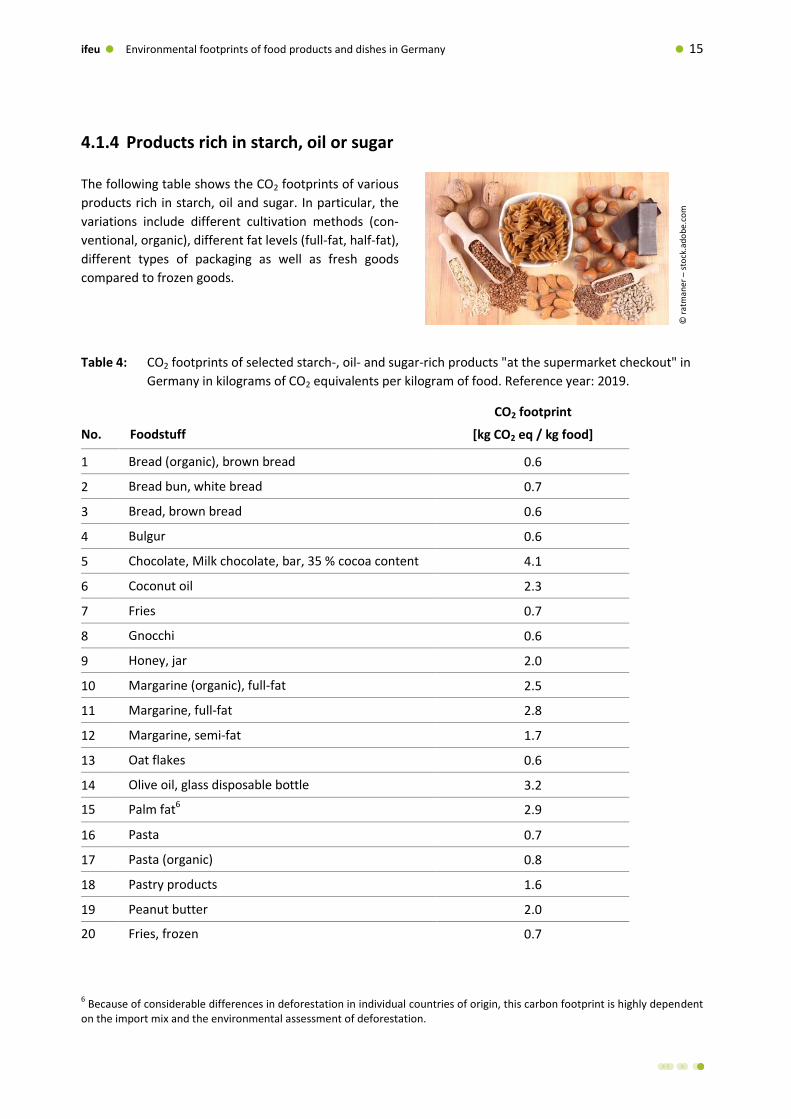
4.1.4 Products rich in starch, oil or sugar
The following table shows the CO2 footprints of various
products rich in starch, oil and sugar. In particular, the
variations include different cultivation methods (con-
ventional, organic), different fat levels (full-fat, half-fat),
different types of packaging as well as fresh goods
compared to frozen goods.
Table 4: CO2 footprints of selected starch-, oil- and sugar-rich products "at the supermarket checkout" in
Germany in kilograms of CO2 equivalents per kilogram of food. Reference year: 2019.
CO2 footprint
[kg CO2 eq / kg food] No. Foodstuff
1 Bread (organic), brown bread 0.6
2 Bread bun, white bread 0.7
3 Bread, brown bread 0.6
4 Bulgur 0.6
5 Chocolate, Milk chocolate, bar, 35 % cocoa content 4.1
6 Coconut oil 2.3
7 Fries 0.7
8 Gnocchi 0.6
9 Honey, jar 2.0
10 Margarine (organic), full-fat 2.5
11 Margarine, full-fat 2.8
12 Margarine, semi-fat 1.7
13 Oat flakes 0.6
14 Olive oil, glass disposable bottle 3.2
15 Palm fat6 2.9
16 Pasta 0.7
17 Pasta (organic) 0.8
18 Pastry products 1.6
19 Peanut butter 2.0
20 Fries, frozen 0.7
6 Because of considerable differences in deforestation in individual countries of origin, this carbon footprint is highly dependent
on the import mix and the environmental assessment of deforestation.
© r
atm
aner
– s
tock
.ad
ob
e.co
m
16 Environmental footprints of food products and dishes in Germany ifeu
CO2 footprint
[kg CO2 eq / kg food] No. Foodstuff
21 Rapeseed oil 3.3
22 Rice 3.1
23 Spelt, rice substitute 0.7
24 Sugar (organic), beet sugar 0.5
25 Sugar (organic), cane sugar 0.9
26 Sugar, beet sugar 0.7
27 Sugar, cane sugar 1.0
28 Sunflower oil, glass disposable bottle 3.2
29 Sunflower seeds 1.5
30 Walnuts, in shell 0.9
ifeu Environmental footprints of food products and dishes in Germany 17
4.1.5 Beverages
The following table shows the CO2 footprints of
various beverages. The variations focus on
different packaging types.
Table 5: CO2 footprints of selected beverages "at the supermarket checkout" in Germany in kilograms of
CO2 equivalents per kilogram of food. Reference year: 2019.
CO2 footprint
[kg CO2 eq / kg food] No. Foodstuff
1 Beer, 0.5 L returnable glass bottle 0.9
2 Beer, 0.5 L tinplate can 1.0
3 Cocoa, ground 5.0
4 Coffee, ground 5.6
5 Juice, apple juice, 1.0 L composite carton 0.4
6 Juice, apple juice, 1.0 L returnable glass bottle 0.4
7 Juice, orange juice, 1.0 L composite carton 0.7
8 Lemonade, orange lemonade,
0.75 L disposable plastic botte 0.4
9 Mineral water, 0.7 L returnable glass bottle 0.2
10 Water, tap water 0.0
11 Wine, 0.75 L disposable glass botte 1.0
© s
tokk
ete
– s
tock
.ad
ob
e.co
m
18 Environmental footprints of food products and dishes in Germany ifeu
4.1.6 Dishes
The following table shows the CO2 footprints of a few se-
lected dishes. The selection is intended to
demonstrate potential savings which can be
achieved in common dishes by substituting certain
foods, and also to
illustrate the range of greenhouse gas emissions
from meat, vegetarian and vegan dishes.
Table 6: CO2 footprints of 8 dishes "prepared on the plate" in kilograms of CO2 equivalents per serving.
The kitchen processes are represented for a household of 4 persons (see section 3). The measures
for dishes 1 and 2 both show the footprint of the dish with the applied.
Reference year: 2019.
CO2 footprint
[kg CO2 eq / kg food]
Measures
Dish 1: Beef patty with rice and fresh peas 2.0
with measure 1: Chicken breast fillet instead of beef patty 1.3
with measure 2: Veggie patty based on soya instead of beef patty 1.0
with measure 3: Pasta instead of rice 1.9
with measure 4: Potatoes instead of rice 1.9
with measure 5: Frozen peas instead of fresh peas 2.0
with measure 6: Fresh carrots instead of fresh peas 1.9
Dish 2: Lasagne 1.6
with measure 1: Minced pork instead of minced beef 1.0
with measure 2: Soya granules instead of minced beef 0.7
with measure 3: Vegan cheese substitute based on coconut oil instead of cheese 1.5
with measure 4: Oat drink instead of cow's milk 1.5
with measure 5: Strained tomatoes from composite carton instead of canned 1.5
Meat-based: high and low CO2 footprints
Dish 3: Beef goulash 2.6
Dish 4: Pollock fillet with cauliflower and couscous 0.6
Vegetarian: high and low CO2 footprints
Dish 5: Rice-vegetable gratin 1.0
Dish 4: Spaghetti with paprika cream sauce 0.6
Vegan: high and low CO2 footprints
Dish 7: Soya bolognese with rice 0.9
Dish 8: Penne Napoli 0.6
© A
nat
oly
Rep
in –
sto
ck.a
do
be.
com
ifeu Environmental footprints of food products and dishes in Germany 19
4.2 Results: Various environmental footprints
The following table shows the phosphate rock, land use and water footprints
as well as the energy demands of a selection of 35 food products. The food
products have been selected in order to include entries for as many different
food categories as possible.
Table 7: Phosphate rock, land use and water footprints as well as energy demand of selected food prod-
ucts "at the supermarket checkout" in Germany, each per kilogram of food product (FP).
Reference year: 2019.
Phosphate rock
footprint
Land use
footprint
Water
footprint
Energy
demand
No. Foodstuff [g phosphate
rock std / kg FP] [m² ∙ y natural
land use7 / kg FP]
[L water
eq / kg FP]
[kWh primary energy eq / kg FP]
1 Apple, average 1 0.1 1,500 0.8
2 Beef 70 7 20,000 8
3 Bread, brown bread 30 0.3 600 2
4 Butter 100 3 10,000 10
5 Cheese, average 60 1.5 6,000 8
6 Chicken, average 60 4 20,000 10
7 Cream substitute, based on oat 20 0.3 800 1.5
8 Curd, 40 % fat 30 0.8 3,000 6
9 Egg 10 3 900 6
10 Fish, aquaculture 20 3 15,000 15
11 Fish, wild-catch, bulk good,
frozen 1 0 80 10
12 Fish, wild-catch, speciality,
frozen 2 0 100 40
13 Juice, orange juice, 1.0 L
composite carton 5 0.2 40,000 3
14 Margarine, full-fat 100 0.9 3,000 4
15 Milk substitute, oat drink 8 0.2 300 3
16 Milk substitute, soya drink 8 0.3 3,000 1.5
17 Milk, ESL, whole milk,
composite carton 20 0.5 2,000 2
18 Minced beef 50 5 15,000 6
7 See section "Land use footprint" in section 3 and the demonstrated example.
© A
rcad
y –
sto
ck.a
do
be.
com
20 Environmental footprints of food products and dishes in Germany ifeu
Phosphate rock
footprint
Land use
footprint
Water
footprint
Energy
demand
No. Foodstuff [g phosphate
rock std / kg FP] [m² ∙ y natural
land use / kg FP]
[L water
eq / kg FP]
[kWh primary energy eq / kg FP]
19 Olive oil, disposable glass bottle8 300 3 900,000 10
20 Orange 2 0.1 15,000 1
21 Pasta 40 0.4 600 2
22 Potatoes, fresh 6 0.1 100 2
23 Rapeseed oil, disposable
glass bottle 150 2 800 5
24 Rice 30 0.7 60,000 5
25 Sausage slices, beef, cold cuts 60 4 10,000 6
26 Seitan 200 2 3,000 5
27 Soya granules, Textured
Vegetable Protein (TVP) 15 2 30,000 3
28 Spelt, rice substitute 30 0.6 600 1.5
29 Sugar, beet sugar 20 0.5 90 2
30 Sunflower oil, disposable
glass bottle 200 1 7,000 5
31 Sunflower seeds 70 1 7,000 2
32 Tofu 3 0.5 7,000 3
33 Tomatoes, fresh, average 2 0.1 1,000 1.5
34 Vegetable nuggets /-schnitzel 20 0.5 1,000 5
35 Yoghurt substitute, soya,
plastic cup, paper coated 1 0.3 3,000 3
8 The environmental burden of olive production is almost entirely attributed to olive oil, as in many cases there is no high-
quality use of the by-products (especially the press cake). In contrast, the press cake from rapeseed and sunflower oil are used as high-quality animal feed, which consequently bears a part of the environmental burden. The high water footprint is ex-plained by the fact that olives are grown in countries with high water scarcity.
ifeu Environmental footprints of food products and dishes in Germany 21
4.3 Guidance on interpretation and use of results
The following guidance should be considered when using and interpreting the results:
Deviations from literature: Some of the CO2 footprints shown in Table 1 to Table 5 deviate significantly
from values reported in the literature (e.g. from values reported in the CO2 calculator “Kimatarier” [ifeu
2016]). The main reason is the inclusion of proportional greenhouse gas emissions due to land use
changes in accordance with [Fehrenbach et al. 2020] as explained in section 3. Other reasons are differ-
ent system boundaries ("supermarket checkout" etc.), goods produced only in Germany compared to the
annual average of sales including imports and more, as described in sections 1 and 3.
Contra-intuitive results: Even for experts, some resulting values in sections 4.1 and 4.2 may be surpris-
ing. For example, this could include the average (including imports) or country-specific CO2 footprints of
food products or those of conventional or organic food9. Several particularly striking results are explained
in footnotes.
Using the results to compare options for action: The present study is based on methodological specifica-
tions that are not suitable to answer every possible question. For example, a standardised allocation of
burdens to food (a so-called attributional approach) was used. Furthermore, the current average of the
food was represented in most cases. For future-oriented questions, these specifications can only be used
to a limited extent10. For these questions, scenarios have to be developed and the environmental foot-
prints have to be calculated with adapted methods (e.g. using a consequential approach). Moreover, fur-
ther footprints would have to be added.
Deliberate choice of the reference value for comparative statements: The results in Table 1 to Table 5
and Table 7 are related to 1 kg of food. However, in most cases a comparison per kilogram of food is only
meaningful if the food products fulfil an identical nutritional function. In particular when making com-
parative statements and recommendations, an appropriate reference value should be chosen (e.g. by
converting the CO2 footprints per kilogram in Table 1 to Table 5 to a typical serving size or to specific nu-
trient content such as protein). Moreover, sometimes meaningful comparisons between food products
require that life cycle stages subsequent to the purchase are considered as well, in particular cold storage
and preparation. Reliable comparisons can be achieved for complete dishes "prepared on the plate" with
intentionally varied ingredient compositions while maintaining essentially the same nutritional values in
the different variations.
Interpretation of land use and water footprint: Since land occupation and water consumption are
weighted according to the degree of their environmental burden, the results cannot be interpreted like
ordinary square metres or litres of water (see section 3).
9 Because of lower yields and associated larger land requirements, organic food usually is not favorable in terms of CO2 foot-
print compared to conventional food. Greenhouse gas emissions are attributed proportionately to this land use; in Germany this is mainly due to the fact that former peatlands are used for agricultural purposes. 10
Consumers might conclude that they should no longer buy organic food, as the methodology used here does not usually show any climate advantages or even disadvantages. Nevertheless, organic food is advantageous with regard to other environ-mental aspects (e.g. conservation of biodiversity). However, a restraint in purchasing would probably change only little about the agricultural use of former peatlands in Germany which is one of the main reasons why the increased land use of organic food has a negative impact. Thus, these emissions would only have to be attributed proportionately to other food products. In contrast, political decision-makers should use these results to question whether further agricultural use of former peatlands is compatible with sustainable consumption.

22 Environmental footprints of food products and dishes in Germany ifeu
5 Literature
Boulay, A.-M., Bare, J., Benini, L., Berger, M., Lathuillière, M. J., Manzardo, A., Margni, M., Motoshita, M., Núñez, M., Pastor, A. V., Ridoutt, B., Oki, T., Worbe, S., Pfister, S. (2018): The WULCA consensus characterization model for water scarcity footprints: assessing impacts of water consumption based on available water remaining (AWARE). The International Journal of Life Cycle Assessment, Vol. 23, No.2, pp. 368–378.
Eyrich, R., Meurer, U., Wagner, T., Buchheim, E., Reinhardt, G., Sven;, G., Hemmen, M., Monetti, S., Stübner, M., Koch, S., Hildebrandt, T., Scharp, M. (2019): KEEKS-Web-App – Klimaschonende Schulküche mit vielen Rezepten. KEEKS-Material 2019-E. <https://smartlearning.izt.de/keeks/rezepte>.
Fehrenbach, H., Keller, H., Abdalla, N., Rettenmaier, N. (2020): Attributional land use (aLU) and attributional land use change (aLUC) - A new method to address land use and land use change in life cycle assessments, version 2.1 of ifeu paper 03/2018. ifeu - Institute for Energy and Environmental Research Heidelberg, Heidelberg, Germany. www.ifeu.de/en/ifeu-papers/.
Fehrenbach, H., Rettenmaier, N., Reinhardt, G., Busch, M. (2019): Festlegung des Indikators für die Bilanzierung der Ressource Fläche bzw. Naturraum in Ökobilanzen [Land use in life cycle assessment: proposal for an indicator and application guidelines]. In: ifeu papers 02/2019, ifeu - Institut für Energie- und Umweltforschung Heidelberg, Heidelberg, Germany. www.ifeu.de/ifeu-papers/.
ifeu (2016): Klimatarier-Rechner. CO2-Fußabdrücke von 150 ausgewählten Lebensmitteln [CO2 calculator “Klimatarier”. CO2 footprints of 150 selected food products]. https://www.klimatarier.com/de/CO2_Rechner.
ifeu (2020): Aktualisierung der Modelle TREMOD/TREMOD-MM für die Emissionsberichterstattung 2020 (Berichtsperiode 1990-2018) – Berichtsteil „TREMOD“. ifeu - Institut für Energie- und Umweltforschung Heidelberg, Heidelberg, Deutschland. https://www.ifeu.de/tremod.
IPCC (2013): Climate Change 2013: The Physical Science Basis. Contribution of Working Group I to the Fifth Assessment Report of the Intergovernmental Panel on Climate Change. Cambridge University Press, Cambridge, United Kingdom and New York, NY, USA.
ISO (2006a): ISO 14040:2006 Environmental management - Life cycle assessment - Principles and framework. International Organization for Standardization.
ISO (2006b): ISO 14044:2006 Environmental management - Life cycle assessment - Requirements and guidelines. International Organization for Standardization.
ISO (2018): ISO 14067:2018 Greenhouse gases - Carbon footprint of products - Requirements and guidelines for quantification. International Organization for Standardization.
Paulsen, H. M. (2020): Kraftfutterkomponenten in mittleren Futterrationen der Milchkühe ökologischer und konventioneller Betriebe (2008-2010, Netzwerk Pilotbetriebe, www.pilotbetriebe.de). Ergänzung zur Datengrundlage. In: Schulz, F., Warnecke, S., Paulsen, H. M., Rahmann, G. (2013) Unterschiede der Fütterung ökologischer und konventioneller Betriebe und deren Einfluss auf die Methan-Emission aus der Verdauung von Milchkühen. Thünen Report 8:189-205, Tabelle 4.8-1, Thünen-Institut für Ökologischen Landbau.
Reinhardt, G., Rettenmaier, N., Vogt, R. (2019): Establishment of the indicator for the accounting of the resource “phosphate” in environmental assessments. In: ifeu papers 01/2019, ifeu - Institute for Energy and Environmental Research Heidelberg, Heidelberg, Germany. www.ifeu.de/en/ifeu-papers.
VDI (Association of German Engineers) (2012): VDI Standard 4600: Cumulative energy demand - Terms, definitions, methods of calculation. VDI (Association of German Engineers) e.V. / Beuth Verlag GmbH, Düsseldorf / Berlin, Germany. http://www.vdi.eu/nc/guidelines/vdi_4600-kumulierter_energieaufwand_kea_begriffe_berechnungsmethoden/.
World Food LCA Database (2015): World Food LCA Database. Agroscope.