Embed Size (px)
Citation preview
June, 2010
Research Paper: 2010-08
SURFACE FREIGHT ENVIRONMENTAL FOOTPRINTS IN THE ONTARIO-
QUÉBEC CONTINENTAL CORRIDOR: FOCUS ON EMISSIONS
JOHN LAWSON1
1 Lawson Economics Research, Ottawa, Canada; [email protected]
Surface Freight Environmental Footprints in the Ontario-Québec Continental Corridor – Focus on Emissions
Prepared for:
The Asia Pacific Gateway and Corridor Initiative Toronto Workshop June 17-18, 2010
John Lawson Ottawa, Canada
_____________________________________________________________________ Surface Freight Transport Environmental Footprints
1
Introduction This paper summarises and updates research by the author to identify and compare aspects of the environmental impacts of the main competing freight modes – truck, rail and ship – within the transport networks identified in Transport Canada’s Gateway initiative as the “Ontario-Québec Continental Gateway and Trade Corridor.” The Corridor includes the main road, rail and water links extending from the international ports of the St. Lawrence estuary through to Chicago, and the freight necessarily includes all the domestic and international movements on those links. The initial comparisons were made by the author for the US Transportation Research Board’s Committee on the St. Lawrence Seaway: Options to Eliminate Introduction of Nonindigenous Species into the Great Lakes, which reported as TRB Special Report 291, “Great Lakes Shipping, Trade and Aquatic Invasive Species” in June 2007. While the Committee’s focus was shipping, the author was asked to compare the environmental “footprints” of shipping in the Great Lakes/St Lawrence Seaway (GLSLS) system with those of the alternative modes of transporting the relevant freight. The results were published with the Committee’s report as a “White Paper.”1 The list of effects considered was broad, to encompass a number of dimensions of freight transport impacts that have been proposed as environmental effects, as follows:
• Fuel use • Greenhouse gas emissions • Criteria air contaminant emissions • Area of land occupied • Water contamination (spills) • Accidents • Noise • Congestion • Aesthetics • Introduction of nonindigenous species
The TRB Seaway Committee wished to compare the “environmental footprint” of each mode. This invites analogy with the “ecological footprint” proposed by Rees to represent consumption of the earth’s resources by communities,2 or as estimated by the World Wildlife Fund for countries. 3 Such a footprint combines a number of the major components of consumption by the land area that their production consumes; and it adds the use of energy from fossil fuels, by converting their carbon content into the amount of land needed for its fixation. It computes the “area of biologically productive land and water needed to provide ecological resources and services – food, fibre and timber, land on which to build and land to absorb CO2 released by burning fossil fuels.”4 This is then compared to the actual land area of each country. It is clear, however, that no such conversion into a single measure or index is possible for all the additional dimensions of the freight mode impacts, including emissions of other air
_____________________________________________________________________ Surface Freight Transport Environmental Footprints
2
pollutants, noise, spills, congestion, etc. Instead the effects were tabulated, with as much quantification as is possible, and otherwise by qualitative rankings. After examination of data sources, the quantitative analysis actually focused on emissions, with some more limited consideration of accidents and land occupation, and otherwise the impacts were compared and ranked only qualitatively. The findings have been updated for the present paper, with the focus almost exclusively on emissions. The author argues that emissions of greenhouse gases (GHG) and criteria air contaminants (CACs) are the most important aspects of the environmental impacts of the three modes, in the current government policy context, and certainly the aspects that are the subject of the most debate in public and professional circles. Part of the reason for the debate is that estimates available in the literature provide confusing variation and in some cases misleading findings. The paper includes some new analysis, drawing and expanding on reports of two studies by the author for Transport Canada, comparing system-wide GHG emission rates among all transport modes,5 and examining the limitations of current transport emissions data.6 As will be seen, the comparisons made in the present paper rely mainly on secondary sources – reports of estimates made in Canada and other countries – but are supplemented by unpublished information available to the author from the previous work, including judgements and interpretations to make the necessary comparisons from the limited data. The author re-examined available information, particularly for ship and truck freight, and attempted to provide comparable estimates for the freight of interest, which is that for which the three main freight modes are alternatives. That is defined to be the freight that could be carried by truck or rail or by vessels within the Great Lakes/ St. Lawrence Seaway. Notionally, it would include freight between any O-D’s that could include a vessel movement, but effectively it limits the network to the waterways and the main road and rail links in the Corridor. To the extent possible, the quantitative measures are standardised to comparable units of traffic. The customary units to represent transport services are tonne-kilometres, combining distance carried and weight of shipments, both of course crucial to the physical requirements for transportation. Comparisons can then be made among rates of the various dimensions of environmental effects per tonne-kilometre of freight carried by the modes. Such standardization provokes some controversy, particularly when (as all-too often) average rates per tonne-kilometre across the entire range of services by each mode are compared, and inferences drawn that shifting freight among the modes would change the impacts by the difference between the averages. Within each of the modes, there will be large differences in rates per tonne-kilometre of any of the impacts, depending on technological characteristics of the vehicles or craft, the commodity carried, the load factor (proportion of capacity used), nature of the route, etc., that all make comparisons of averages misleading. Truck carriers are quick to point out that the services provided by the modes differ substantially, notably in commodities, trip distances and speed, all of
_____________________________________________________________________ Surface Freight Transport Environmental Footprints
3
which affect average fuel consumption and emissions per tonne-kilometre. In comparison to trains or ships, trucks tend to carry less-dense commodities over shorter distances and at higher speeds, all of which raise their average emissions per tonne-km. It can also be recognised that tonne-kilometres (tonne-km or tkm) do not represent differences in the “quality” of haulage services, notably for example their speed, reliability and security. Nor of course do comparisons among the modes of their total traffic in tonne-km represent the value of the commodities carried, and therefore the value of the services to customers. Indeed, the characterisation of the modes as competing for freight is to a large extent incorrect, as the modes are complementary for much traffic, with e.g. water and rail combining in long-distance movements of grain and iron ore, and truck providing collection and distribution services for goods shipped by water or rail. However, much of the research and policy interest in comparing the modes is to reveal the possible effects of shifts of traffic between modes. The differences in environmental impacts would be represented more appropriately if only directly competitive services were compared – i.e. if only the same commodity-O-D movements were included, or if all the movements by one mode could be simulated in each of the other modes. But either comparison would require trip-level records that are not available in any accessible database, apart from some research studies comparing limited samples of trips. In fact, the data available to make comparisons among the modes are sparse and strictly inadequate, as will be noted below. Far from comparing details of similar movements, we are able to make comparisons only using estimates of tonne-kilometres for total operations of groups of carriers or types of service, which in the case of two of the modes – truck and ship – are based on severely-limited information. Nevertheless, attempts have been made, as will be described below, to represent comparable classes of service among the three modes. The final, possibly most important, qualification to be made is that the environmental performance of each of the modes is far from static. Some of the impacts can be expected to change relatively rapidly in future, particularly as vehicle/craft technologies and fuels respond to emissions regulations. More stringent regulations of CACs and fuels have recently been introduced or announced that will reduce emission rates substantially in the US and Canada, notably and fastest for NOx and particulates from trucks, and subsequently for locomotives and ships. GHG regulations are planned in both jurisdictions for heavy trucks, and will potentially be introduced also for locomotives and ships. Estimates of average fleet performance, as presented below, from the last decade are already outdated particularly for truck CACs. Continued re-estimation for future years will be essential to monitor performance, and resolution of the data issues all the more urgent. Quantification issues The key problem in producing standardised comparisons among the modes is the lack of consistent activity and fuel consumption data for either shipping or trucking, in both Canada and the US. Rail freight is exceptional, due to its history of data regulation, and the greater practicality of obtaining from the small number of carriers their total fuel use
_____________________________________________________________________ Surface Freight Transport Environmental Footprints
4
and total tonne-km for the same set of activities, derived from details of shipments. Otherwise, for ship and truck transport, such national statistics of tonne-km as are available are for sets of activities that are not identifiable within national statistics of fuel consumption. Calculation of consistent rates of fuel consumption per tonne-km is impossible from those sources. Analysts, including those who produce “official” federal estimates for fuel use and emissions in Canada, are forced to base them to some extent on unverifiable judgements and inferences. Some of those official estimates are described and challenged below, together with the basis of the author’s estimates. Fuel consumption and emissions The emissions of interest are the following:
- Greenhouse gases (GHG), of which the most important from transportation sources are:
� Carbon dioxide (CO2) � Nitrous oxide (N2O) � Methane (CH4)
- Criteria air contaminants (CACs), as follows: � Carbon monoxide � Volatile organic compounds (VOC) or hydrocarbons (HC) � Nitrogen oxides (NOx) � Sulphur oxides (SOx) � Particulate matter (PM)
CACs are regulated air pollutants in US and Canada, with standards for emissions by transport vehicles. Transport GHGs have not been regulated, except through fuel consumption standards for cars and light trucks, now being replaced (from 2011 in Canada) by CO2 standards. However, regulation of truck GHGs is imminent, and it seems possible that regulations will eventually be extended to rail and marine transport. Fuel use statistics are compiled in Canada from reports by refiners of sales by type of fuel and tax category, which differs at least slightly from fuel used nationally, to the extent for example that domestic carriers consume the fuels beyond national borders (and waters) and that foreign carriers use fuels purchased beyond those borders. Furthermore, refiners’ fuel sales records are unable to distinguish final uses of fuels by type of vehicle, vessel or activity, separating for example the private use of road diesel fuel by cars and light trucks from commercial use by heavier trucks, or separating the use of marine diesel and residual fuel oils by fishing vessels, ferries, cruise ships, other recreational vessels or military vessels from commercial freighters. Such partitioning of fuels by type of use is attempted in both countries by government energy and transport analysts, but differently by the relevant transport, energy and environmental agencies (i.e. US DOT, DOE and EPA, and Canadian departments of Transport, Natural Resources and Environment), illustrating the uncertainty.
_____________________________________________________________________ Surface Freight Transport Environmental Footprints
5
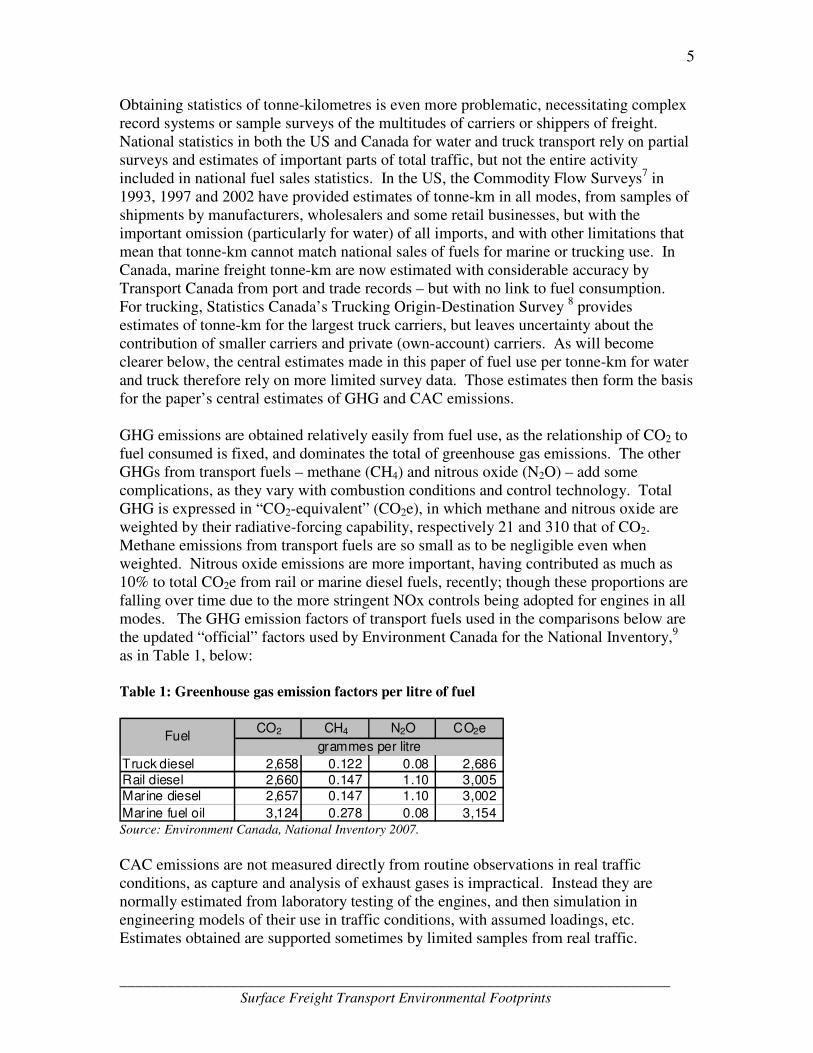
Obtaining statistics of tonne-kilometres is even more problematic, necessitating complex record systems or sample surveys of the multitudes of carriers or shippers of freight. National statistics in both the US and Canada for water and truck transport rely on partial surveys and estimates of important parts of total traffic, but not the entire activity included in national fuel sales statistics. In the US, the Commodity Flow Surveys7 in 1993, 1997 and 2002 have provided estimates of tonne-km in all modes, from samples of shipments by manufacturers, wholesalers and some retail businesses, but with the important omission (particularly for water) of all imports, and with other limitations that mean that tonne-km cannot match national sales of fuels for marine or trucking use. In Canada, marine freight tonne-km are now estimated with considerable accuracy by Transport Canada from port and trade records – but with no link to fuel consumption. For trucking, Statistics Canada’s Trucking Origin-Destination Survey 8 provides estimates of tonne-km for the largest truck carriers, but leaves uncertainty about the contribution of smaller carriers and private (own-account) carriers. As will become clearer below, the central estimates made in this paper of fuel use per tonne-km for water and truck therefore rely on more limited survey data. Those estimates then form the basis for the paper’s central estimates of GHG and CAC emissions. GHG emissions are obtained relatively easily from fuel use, as the relationship of CO2 to fuel consumed is fixed, and dominates the total of greenhouse gas emissions. The other GHGs from transport fuels – methane (CH4) and nitrous oxide (N2O) – add some complications, as they vary with combustion conditions and control technology. Total GHG is expressed in “CO2-equivalent” (CO2e), in which methane and nitrous oxide are weighted by their radiative-forcing capability, respectively 21 and 310 that of CO2. Methane emissions from transport fuels are so small as to be negligible even when weighted. Nitrous oxide emissions are more important, having contributed as much as 10% to total CO2e from rail or marine diesel fuels, recently; though these proportions are falling over time due to the more stringent NOx controls being adopted for engines in all modes. The GHG emission factors of transport fuels used in the comparisons below are the updated “official” factors used by Environment Canada for the National Inventory,9 as in Table 1, below: Table 1: Greenhouse gas emission factors per litre of fuel
CO2 CH4 N2O CO2e
Truck diesel 2,658 0.122 0.08 2,686
Rail diesel 2,660 0.147 1.10 3,005
Marine diesel 2,657 0.147 1.10 3,002
Marine fuel oil 3,124 0.278 0.08 3,154
grammes per litreFuel
Source: Environment Canada, National Inventory 2007.
CAC emissions are not measured directly from routine observations in real traffic conditions, as capture and analysis of exhaust gases is impractical. Instead they are normally estimated from laboratory testing of the engines, and then simulation in engineering models of their use in traffic conditions, with assumed loadings, etc. Estimates obtained are supported sometimes by limited samples from real traffic.
_____________________________________________________________________ Surface Freight Transport Environmental Footprints
6
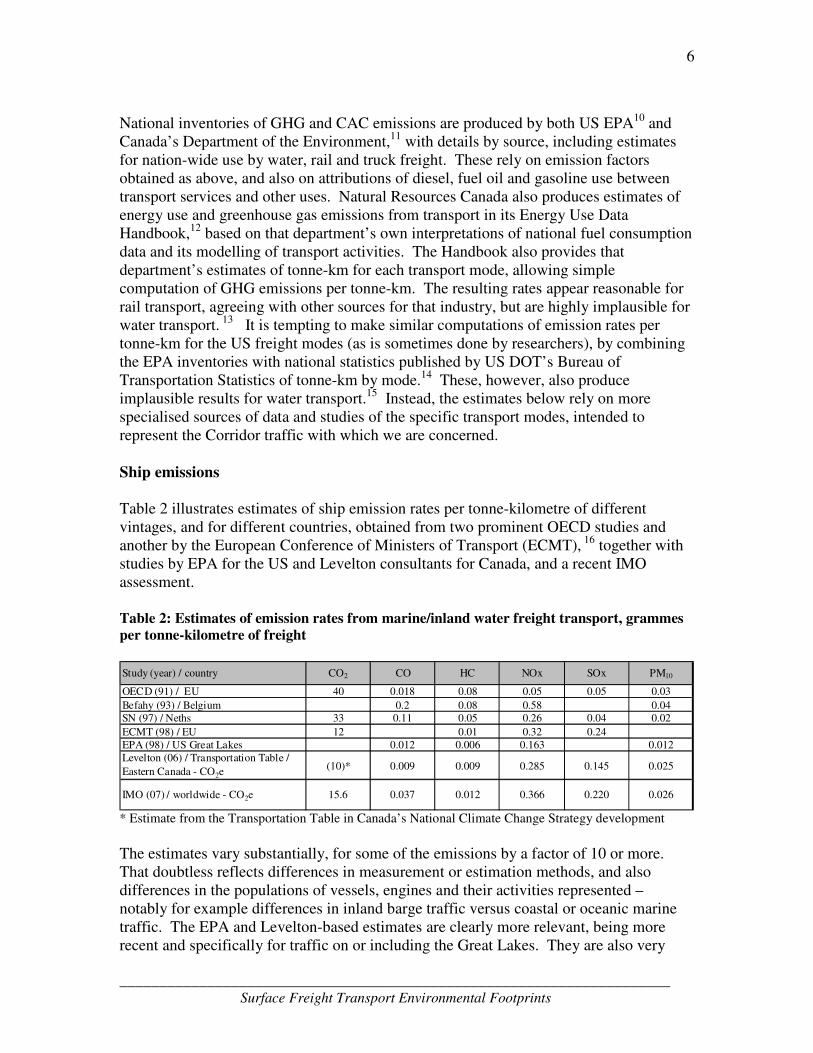
National inventories of GHG and CAC emissions are produced by both US EPA10 and Canada’s Department of the Environment,11 with details by source, including estimates for nation-wide use by water, rail and truck freight. These rely on emission factors obtained as above, and also on attributions of diesel, fuel oil and gasoline use between transport services and other uses. Natural Resources Canada also produces estimates of energy use and greenhouse gas emissions from transport in its Energy Use Data Handbook,12 based on that department’s own interpretations of national fuel consumption data and its modelling of transport activities. The Handbook also provides that department’s estimates of tonne-km for each transport mode, allowing simple computation of GHG emissions per tonne-km. The resulting rates appear reasonable for rail transport, agreeing with other sources for that industry, but are highly implausible for water transport. 13 It is tempting to make similar computations of emission rates per tonne-km for the US freight modes (as is sometimes done by researchers), by combining the EPA inventories with national statistics published by US DOT’s Bureau of Transportation Statistics of tonne-km by mode.14 These, however, also produce implausible results for water transport.15 Instead, the estimates below rely on more specialised sources of data and studies of the specific transport modes, intended to represent the Corridor traffic with which we are concerned. Ship emissions Table 2 illustrates estimates of ship emission rates per tonne-kilometre of different vintages, and for different countries, obtained from two prominent OECD studies and another by the European Conference of Ministers of Transport (ECMT), 16 together with studies by EPA for the US and Levelton consultants for Canada, and a recent IMO assessment. Table 2: Estimates of emission rates from marine/inland water freight transport, grammes per tonne-kilometre of freight
Study (year) / country CO2 CO HC NOx SOx PM10
OECD (91) / EU 40 0.018 0.08 0.05 0.05 0.03
Befahy (93) / Belgium 0.2 0.08 0.58 0.04SN (97) / Neths 33 0.11 0.05 0.26 0.04 0.02
ECMT (98) / EU 12 0.01 0.32 0.24EPA (98) / US Great Lakes 0.012 0.006 0.163 0.012Levelton (06) / Transportation Table /
Eastern Canada - CO2e(10)* 0.009 0.009 0.285 0.145 0.025
IMO (07) / worldwide - CO2e 15.6 0.037 0.012 0.366 0.220 0.026
* Estimate from the Transportation Table in Canada’s National Climate Change Strategy development
The estimates vary substantially, for some of the emissions by a factor of 10 or more. That doubtless reflects differences in measurement or estimation methods, and also differences in the populations of vessels, engines and their activities represented – notably for example differences in inland barge traffic versus coastal or oceanic marine traffic. The EPA and Levelton-based estimates are clearly more relevant, being more recent and specifically for traffic on or including the Great Lakes. They are also very
_____________________________________________________________________ Surface Freight Transport Environmental Footprints
7
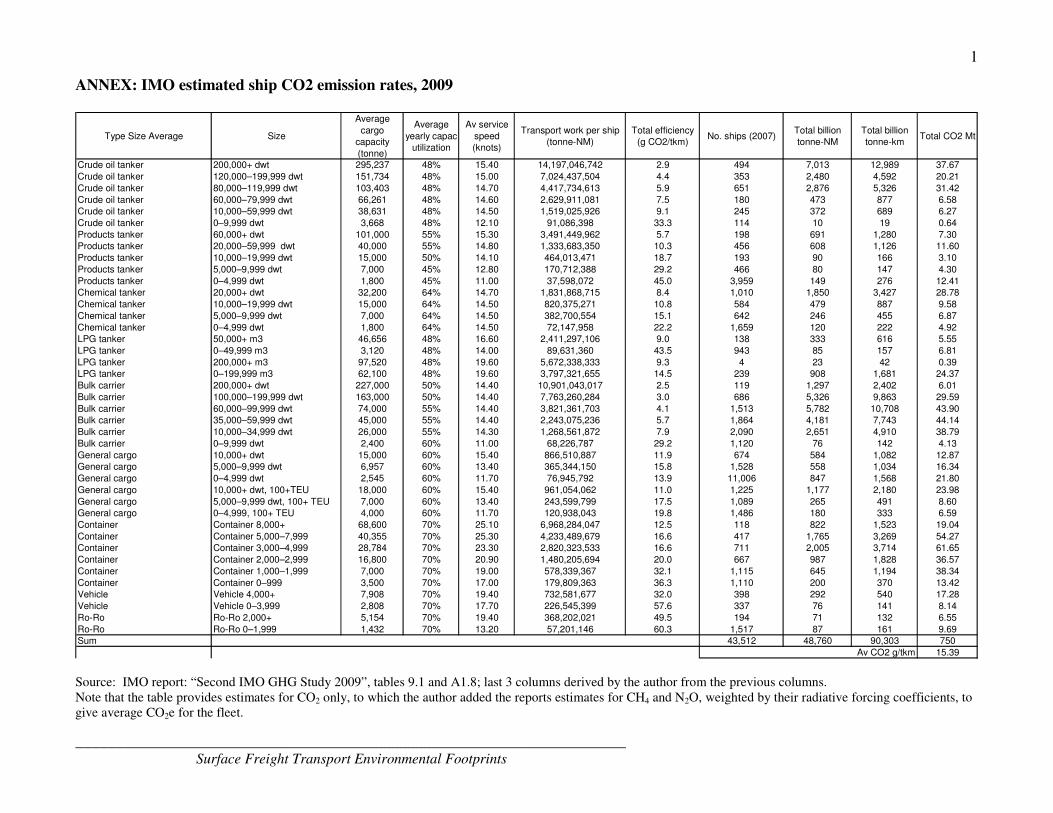
consistent, relative to the European estimates. This is partly because they are based on the same recent industry research on engine emission rates, though the manner in which they are related to tonne-km is very different. The EPA study used records of ship movements which included deadweight tonnage, and assumed they were loaded to 60% of that tonnage, to estimate total tonne-km. The Levelton study similarly obtained emissions from ship movement records, by estimating trip distances and vessel speeds, and applying emission factors for the specific engines. It provided great detail of emissions by type of vessel and location, for all movements in eastern Canadian inland and coastal waters in 2003. The study did not however estimate tonne-km. Therefore tonne-km were derived for this paper by calculating from the Levelton study’s estimates of CO2 emissions the implied fuel use, then applying the estimate of CO2 emissions per tonne-km obtained by the Transportation Table, from a survey in 1998 of Eastern Canadian freight carriers – of 10 grammes per tonne-km.17 That the resulting estimates of CAC emissions per tonne-km are so close to those produced by EPA gives some confidence that this crude estimate of tonne-km is reasonable. However, the table then includes in its final row the most recent, and arguably most comprehensive, estimate of ship emissions, produced in 2009 by the International Maritime Organisation (IMO).18 Entitled “The Second IMO GHG Study 2009”, the study actually provided estimates not only for GHG emissions but also for CACs, for all world shipping. This was a “bottom-up” estimation of emissions, from descriptions of the world-wide fleet by type of ship and engine technologies (giving 42 classes of freight carriers). But without records of actual movements, the study estimated both fuel consumption and loading, based on assumptions and the judgement of its authors. Average rates of fuel consumption were assumed for each ship type and engine technology, and applied to estimates of annual average distance travelled per ship in order to estimate total annual fuel use. Assumptions were also made about average loads, allowing estimates of total tonne-kilometres. Rates of CO2 emissions per tonne-km were then derived. Average CAC emission factors per unit of fuel were assumed for each vintage of technology, and applied to the existing fleet of ships by type, after which the estimates of emission rates per tonne-km were derived. The authors of the report recognise the uncertainty in these assumptions and estimates by allowing margins of error of ±20% around their central estimates. The IMO report provides estimates of GHG by type of ship, without any fleet-average; but the author of the present paper has used the report’s details of number of ships and average distance travelled to derive the world-wide fleet-averages for all freight ships appearing in Table 2 (see Annex). The central estimate of the GHG emission rate from this IMO world-wide assessment is 15.6 grams of CO2e per tonne-km. That is substantially greater than the estimate of 10 g/tonne-km for Eastern Canada provided by the Eastern Canadian carriers for the Transportation Table work. However, as shown in the Annex to this paper, the IMO study suggests many classes of ship achieve rates as low as 10 g/tone-km or lower – notably bulk carriers. It seems plausible therefore that the Eastern Canadian estimate in Table 2 is consistent with that of the IMO. That could be verified only if true records of vessel movements became available, including fuel consumption and loading.
_____________________________________________________________________ Surface Freight Transport Environmental Footprints
8
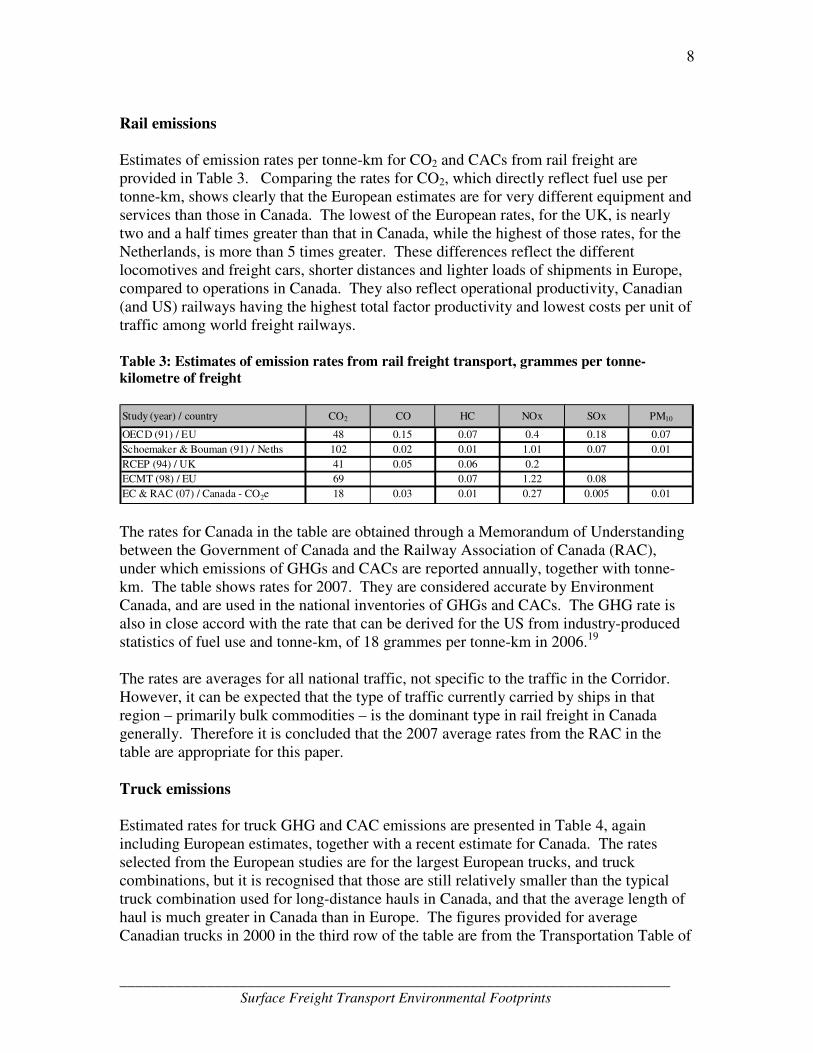
Rail emissions Estimates of emission rates per tonne-km for CO2 and CACs from rail freight are provided in Table 3. Comparing the rates for CO2, which directly reflect fuel use per tonne-km, shows clearly that the European estimates are for very different equipment and services than those in Canada. The lowest of the European rates, for the UK, is nearly two and a half times greater than that in Canada, while the highest of those rates, for the Netherlands, is more than 5 times greater. These differences reflect the different locomotives and freight cars, shorter distances and lighter loads of shipments in Europe, compared to operations in Canada. They also reflect operational productivity, Canadian (and US) railways having the highest total factor productivity and lowest costs per unit of traffic among world freight railways. Table 3: Estimates of emission rates from rail freight transport, grammes per tonne-kilometre of freight
Study (year) / country CO2 CO HC NOx SOx PM10
OECD (91) / EU 48 0.15 0.07 0.4 0.18 0.07
Schoemaker & Bouman (91) / Neths 102 0.02 0.01 1.01 0.07 0.01
RCEP (94) / UK 41 0.05 0.06 0.2
ECMT (98) / EU 69 0.07 1.22 0.08
EC & RAC (07) / Canada - CO2e 18 0.03 0.01 0.27 0.005 0.01 The rates for Canada in the table are obtained through a Memorandum of Understanding between the Government of Canada and the Railway Association of Canada (RAC), under which emissions of GHGs and CACs are reported annually, together with tonne-km. The table shows rates for 2007. They are considered accurate by Environment Canada, and are used in the national inventories of GHGs and CACs. The GHG rate is also in close accord with the rate that can be derived for the US from industry-produced statistics of fuel use and tonne-km, of 18 grammes per tonne-km in 2006.19 The rates are averages for all national traffic, not specific to the traffic in the Corridor. However, it can be expected that the type of traffic currently carried by ships in that region – primarily bulk commodities – is the dominant type in rail freight in Canada generally. Therefore it is concluded that the 2007 average rates from the RAC in the table are appropriate for this paper.
Truck emissions Estimated rates for truck GHG and CAC emissions are presented in Table 4, again including European estimates, together with a recent estimate for Canada. The rates selected from the European studies are for the largest European trucks, and truck combinations, but it is recognised that those are still relatively smaller than the typical truck combination used for long-distance hauls in Canada, and that the average length of haul is much greater in Canada than in Europe. The figures provided for average Canadian trucks in 2000 in the third row of the table are from the Transportation Table of

_____________________________________________________________________ Surface Freight Transport Environmental Footprints
9
the National Climate Change Strategy development (estimated by the present author) and refer to all for-hire trucking in Canada, both long- and short-haul, including all the local pick-up and delivery. The CO2e emission rate was calculated using Statistics Canada survey results as noted above, while the CAC rates were derived from emission factors per litre of fuel recommended by Natural Resources Canada for the work of the Table. It is evident from the CO2e emission rate, which again primarily reflected fuel use per tonne-km, that Canadian for-hire operations on average were at that time more fuel-efficient than the long-haul traffic in Europe, though the ECMT estimate for large long-haul trucks was essentially the same as the Canadian average. Table 4: Estimates of emission rates from truck freight transport, grammes per tonne-kilometre of freight
Study (year) / country CO2 CO HC NOx SOx PM10
OECD (91) / EU* 140 0.25 0.32 3 0.18 0.17
Schoemaker & Bouman (91) / Neths* 127 0.34 0.34 2.3 0.11 0.19
ECMT (98) / EU* 100 0.05 1.2 0.03
Transport Canada (00) /Canada average
for-hire truck - CO2e103 1.52 0.14 2.6 0.05 0.11
Lawson (07) / Canada long-haul trucking
- CO2e88 0.12 0.02 0.53 0.001 0.01
Lawson (07) / Canada 8-axle
combinationaverage for-hire truck -
CO2e
33 0.04 0.01 0.20 0.0004 0.005
*large EU trucks/tractor-trailers
The table then provides new estimates by the author, to represent average rates in 2007, for “long-haul trucking”, and for the large Canadian combination truck that competes typically with rail or ship. Since the previous estimates for the Transportation Table, it is unfortunate that Statistics Canada (STC) has ceased to provide estimates of vehicle-kilometres from the Motor Carriers of Freight Survey. Improved data on tonne-kilometres should be available from the redesigned Truck Commodity Origin-Destination (TOD) Survey, particularly as the survey’s coverage has been extended to include short shipments and smaller carriers, so it should now better represent all truck traffic by Canadian carriers. However, publication of tonne-km estimates was made in only a preliminary fashion for years 2004 and 2005, and has then been dropped from the publications of final figures for those years, and for 2006; and at the same time the CANSIM series for the previous survey was discontinued after 2003, and has not been replaced for the new survey. Finally, in September 2009 Transport Canada was able to obtain a finalised estimate from STC for 2007, of 228.75 billion tonne-km.20 Unfortunately, the survey is not able to provide an equivalent estimate of truck vehicle-km or fuel consumption – as a survey of shipments it is able to make estimates only for the movements of the freight shipments, not the vehicles in which they are carried. Environment Canada’s Inventory estimates from the Mobile Greenhouse Gas Emission
Model (MGEM) show total medium- and heavy-duty truck fuel use as 2.88 billion litres
_____________________________________________________________________ Surface Freight Transport Environmental Footprints
10
of gasoline and 14.92 billion litres of diesel in 2007, giving emissions of 46.72 Mt. Its estimate of heavy truck activity in the year is billion veh-km, and estimated fuel consumption rates 33.36 l/100km for gasoline vehicles and 34.43 l/100 km for diesel vehicles. Furthermore, the detailed data from MGEM for 2005 has been made available in November 2009,21 providing estimates of fuel consumption and emissions for trucks of different weight classes, which reveal that in 2005 there were 381,400 freight trucks of classes 7 and 8 (i.e. over 26,000 lbs/11,800 kg laden weight) which travelled 20.97 billion veh-km, using 9.83 billion litres of fuel, at an average rate of 46.88 litres/100 km. These are the workhorse diesel-fuelled trucks that carry long-distance freight in Canada, and it can be argued that this fuel consumption rate is therefore appropriate for the freight represented in the STC TOD survey. An equivalent estimate for 2007 is not yet available, but the overall fuel consumption rates for all classes of diesel medium- and heavy-duty trucks estimated in MGEM were almost identical in 2005 and 2007 (34.56 vs 33.43 l/100km respectively); therefore it is assumed that the 2005 rate for classes 7 & 8 trucks still applied in 2007. However, MGEM does not create or use any estimate of tonne-km to compare to the STC survey estimate. In the absence of more compatible estimates of tonne-km and vehicle-km for a well-defined set of movements or of freight, it is proposed that the tonne-km estimate from the STC Truck O-D survey be converted to vehicle-km by an assumed average load. The best available load information in Canada is from the CCMTA/Transport Canada National Roadside Trucking Surveys, the last of which was undertaken in 2006.22 The surveys intercept trucks at a sample of sites and collect descriptions of the truck and load, including measurements of trucks unladen weight and weight of freight carried. The samples cannot be entirely representative due to the limitation on the number of sites, and their bias toward longer-distance trips. In the case of the 2006 survey, there were also limitations on the coverage of provinces and territories. However, the survey methods have been modified over time to improve reliability, and the resulting estimates are certainly the best available representations of truck conditions, particularly of weights and freight loads. The 2006 survey allowed an estimated average load of a for-hire truck of 14.74 tonnes. The 1999 survey estimate was almost identical, at 14.82 tonnes, confirming that the 2006 figure could be used also to represent 2007. Applying this average load to the STC Truck O-D survey estimate of 228.75 billion tonne-km in 2007, the trucking would have involved 15.52 billion vehicle-km. Then applying the average fuel consumption rate for class 7 and 8 trucks from MGEM, of 46.88 litres/100 km, the total fuel consumption would have been 7.276 billion litres. The resulting estimate of the average GHG emission rate for for-hire trucks in 2007 was 85.4 grams per tonne-km. This is a significantly lower than previous estimates – the estimate for 1997 was 103 g/tkm – raising questions about its plausibility. It is evident that the estimate of tonne-km from the STC TOD survey has increased very substantially in the interim – the estimate for 1997 was only 140 billion tkm. Meanwhile, the average fuel efficiency of trucks has improved. The remaining factor in the calculation is the average load, which is less certain, but the National Roadside Survey data are persuasive. It is concluded that the estimate of 85 g/tkm is the best available, and applicable to the subset of trucking represented in the TOD survey.
_____________________________________________________________________ Surface Freight Transport Environmental Footprints
11
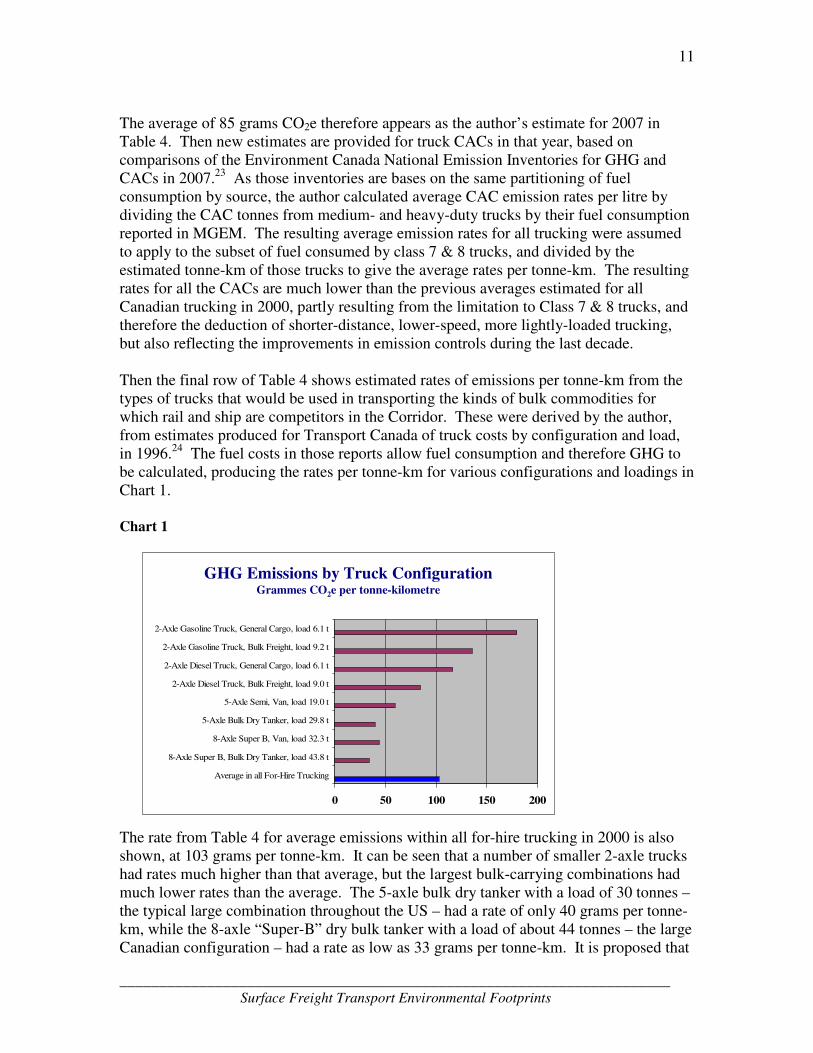
The average of 85 grams CO2e therefore appears as the author’s estimate for 2007 in Table 4. Then new estimates are provided for truck CACs in that year, based on comparisons of the Environment Canada National Emission Inventories for GHG and CACs in 2007.23 As those inventories are bases on the same partitioning of fuel consumption by source, the author calculated average CAC emission rates per litre by dividing the CAC tonnes from medium- and heavy-duty trucks by their fuel consumption reported in MGEM. The resulting average emission rates for all trucking were assumed to apply to the subset of fuel consumed by class 7 & 8 trucks, and divided by the estimated tonne-km of those trucks to give the average rates per tonne-km. The resulting rates for all the CACs are much lower than the previous averages estimated for all Canadian trucking in 2000, partly resulting from the limitation to Class 7 & 8 trucks, and therefore the deduction of shorter-distance, lower-speed, more lightly-loaded trucking, but also reflecting the improvements in emission controls during the last decade. Then the final row of Table 4 shows estimated rates of emissions per tonne-km from the types of trucks that would be used in transporting the kinds of bulk commodities for which rail and ship are competitors in the Corridor. These were derived by the author, from estimates produced for Transport Canada of truck costs by configuration and load, in 1996.24 The fuel costs in those reports allow fuel consumption and therefore GHG to be calculated, producing the rates per tonne-km for various configurations and loadings in Chart 1. Chart 1
The rate from Table 4 for average emissions within all for-hire trucking in 2000 is also shown, at 103 grams per tonne-km. It can be seen that a number of smaller 2-axle trucks had rates much higher than that average, but the largest bulk-carrying combinations had much lower rates than the average. The 5-axle bulk dry tanker with a load of 30 tonnes – the typical large combination throughout the US – had a rate of only 40 grams per tonne-km, while the 8-axle “Super-B” dry bulk tanker with a load of about 44 tonnes – the large Canadian configuration – had a rate as low as 33 grams per tonne-km. It is proposed that
0 50 100 150 200
Average in all For-Hire Trucking
8-Axle Super B, Bulk Dry Tanker, load 43.8 t
8-Axle Super B, Van, load 32.3 t
5-Axle Bulk Dry Tanker, load 29.8 t
5-Axle Semi, Van, load 19.0 t
2-Axle Diesel Truck, Bulk Freight, load 9.0 t
2-Axle Diesel Truck, General Cargo, load 6.1 t
2-Axle Gasoline Truck, Bulk Freight, load 9.2 t
2-Axle Gasoline Truck, General Cargo, load 6.1 t
GHG Emissions by Truck Configuration Grammes CO2e per tonne-kilometre
_____________________________________________________________________ Surface Freight Transport Environmental Footprints
12
this large truck would be the practical alternative for freight carried by rail or ship. The freight concerned is almost all bulk or containerised, for which the largest truck configurations provide the lowest cost option. No more recent estimate of the fuel consumption/GHG emission rates for these largest trucks is available, so it is assumed that the rate would still be representative in 2007 (it seems likely that in reality it might have fallen, as all trucks have become slightly more fuel-efficient). CAC emission rates for these larger trucks are not available separately, therefore the assumption is made in the table that they would be proportional to fuel use, and therefore would be lower by the same proportion as CO2 emissions relative to the average for-hire truck. These rates are proposed as appropriate for this paper.
A recent US study for the Federal Railroad Administration provides yet another comparison of truck and rail fuel efficiency.25 The prime feature of the report was its analysis of 23 hypothetical freight movements, for which rail and truck are competitive, in which it estimated fuel consumption assuming the line-haul was undertaken by truck or rail, and took account of the drayage required to complete rail movements, and the likelihood of empty return hauls. It concluded that rail was more fuel–efficient on all the example movements, with the ratio of ton-miles per gallon between rail and truck ranging from 1.9 to 5.5. It also provided summary estimates of system-wide average fuel efficiency for the modes, using the data on fuel consumption and ton-miles for Class I rail carriers from the American Association of Railroads (AAR) and similar data on trucking from the Bureau of Census Surveys (TIUS and VIUS now discontinued).26 The average for rail was estimated to have improved between 1992 and 2006 from 360 to 422 ton-miles per gallon. Over the same period, the average for long-haul combination trucks was estimated to have improved from 111 to 120 ton-miles per gallon. Converting those 2006 estimates to GHG emission rates, the average for rail would have been 18.5 grams/tonne-km, and that for long-haul combination trucks 65 grams/tonne-km. Such a rate for similar long-haul combination trucks in Canada would not be inconsistent with an average of 88 g/tonne-km for Classes 7 & 8 trucks.
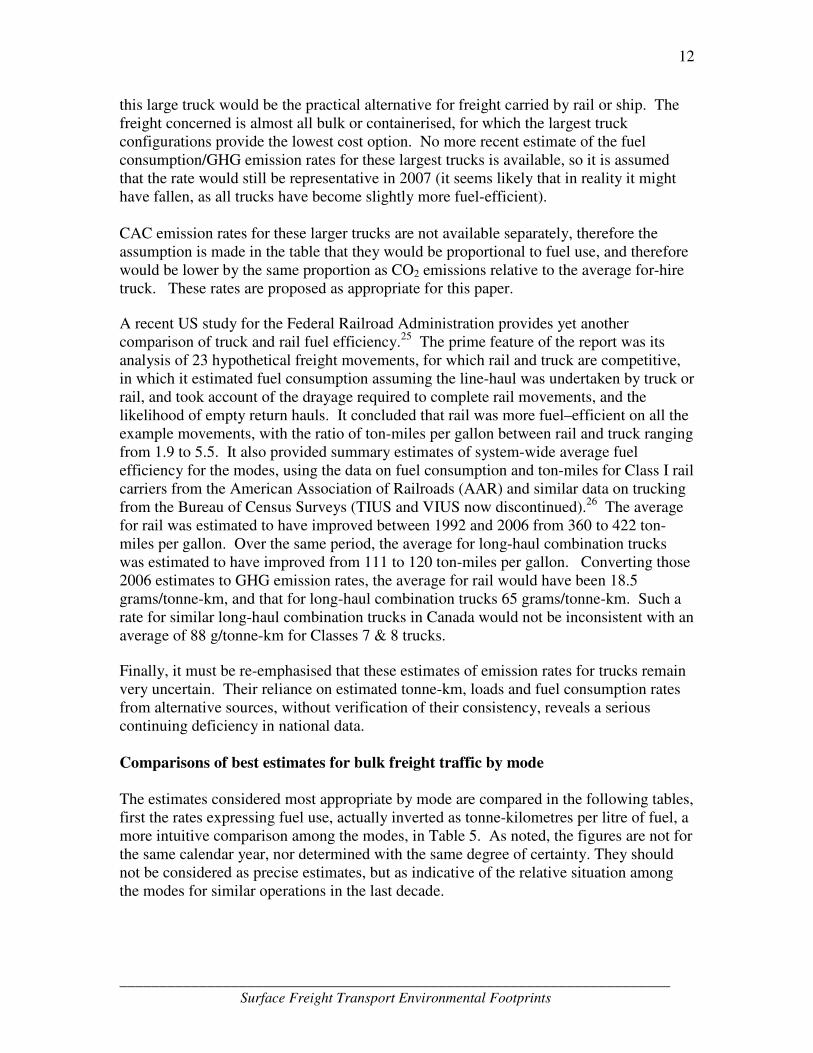
Finally, it must be re-emphasised that these estimates of emission rates for trucks remain very uncertain. Their reliance on estimated tonne-km, loads and fuel consumption rates from alternative sources, without verification of their consistency, reveals a serious continuing deficiency in national data. Comparisons of best estimates for bulk freight traffic by mode The estimates considered most appropriate by mode are compared in the following tables, first the rates expressing fuel use, actually inverted as tonne-kilometres per litre of fuel, a more intuitive comparison among the modes, in Table 5. As noted, the figures are not for the same calendar year, nor determined with the same degree of certainty. They should not be considered as precise estimates, but as indicative of the relative situation among the modes for similar operations in the last decade.
_____________________________________________________________________ Surface Freight Transport Environmental Footprints
13
Table 5: Estimates of fuel use rates by mode of transport, in tonne-kilometres per litre of fuel
Freight modeTonne-km
per litre
Ship (06) 315
Rail (07) 169
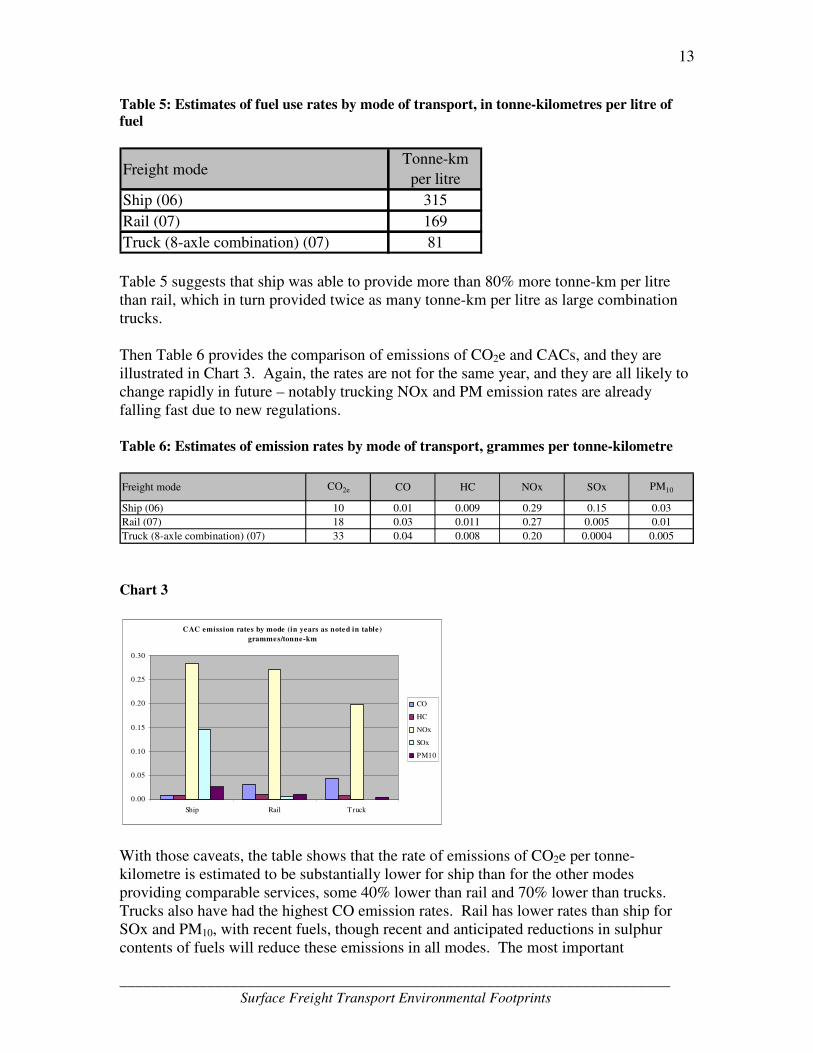
Truck (8-axle combination) (07) 81 Table 5 suggests that ship was able to provide more than 80% more tonne-km per litre than rail, which in turn provided twice as many tonne-km per litre as large combination trucks. Then Table 6 provides the comparison of emissions of CO2e and CACs, and they are illustrated in Chart 3. Again, the rates are not for the same year, and they are all likely to change rapidly in future – notably trucking NOx and PM emission rates are already falling fast due to new regulations. Table 6: Estimates of emission rates by mode of transport, grammes per tonne-kilometre
Freight mode CO2e CO HC NOx SOx PM10
Ship (06) 10 0.01 0.009 0.29 0.15 0.03
Rail (07) 18 0.03 0.011 0.27 0.005 0.01
Truck (8-axle combination) (07) 33 0.04 0.008 0.20 0.0004 0.005 Chart 3
CAC emission rates by mode (in years as noted in table)
grammes/tonne-km
0.00
0.05
0.10
0.15
0.20
0.25
0.30
Ship Rail Truck
CO
HC
NOx
SOx
PM10
With those caveats, the table shows that the rate of emissions of CO2e per tonne-kilometre is estimated to be substantially lower for ship than for the other modes providing comparable services, some 40% lower than rail and 70% lower than trucks. Trucks also have had the highest CO emission rates. Rail has lower rates than ship for SOx and PM10, with recent fuels, though recent and anticipated reductions in sulphur contents of fuels will reduce these emissions in all modes. The most important
_____________________________________________________________________ Surface Freight Transport Environmental Footprints
14
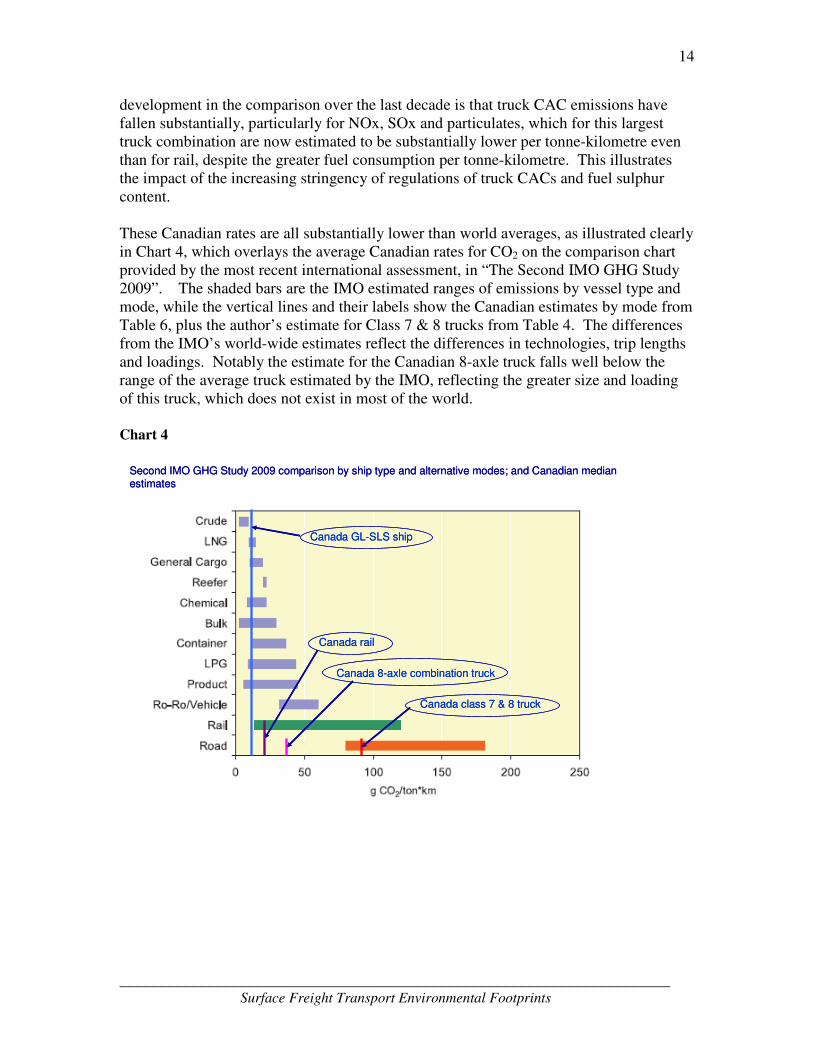
development in the comparison over the last decade is that truck CAC emissions have fallen substantially, particularly for NOx, SOx and particulates, which for this largest truck combination are now estimated to be substantially lower per tonne-kilometre even than for rail, despite the greater fuel consumption per tonne-kilometre. This illustrates the impact of the increasing stringency of regulations of truck CACs and fuel sulphur content. These Canadian rates are all substantially lower than world averages, as illustrated clearly in Chart 4, which overlays the average Canadian rates for CO2 on the comparison chart provided by the most recent international assessment, in “The Second IMO GHG Study 2009”. The shaded bars are the IMO estimated ranges of emissions by vessel type and mode, while the vertical lines and their labels show the Canadian estimates by mode from Table 6, plus the author’s estimate for Class 7 & 8 trucks from Table 4. The differences from the IMO’s world-wide estimates reflect the differences in technologies, trip lengths and loadings. Notably the estimate for the Canadian 8-axle truck falls well below the range of the average truck estimated by the IMO, reflecting the greater size and loading of this truck, which does not exist in most of the world. Chart 4
Second IMO GHG Study 2009 comparison by ship type and alternative modes; and Canadian median estimatesSecond IMO GHG Study 2009 comparison by ship type and alternative modes; and Canadian median estimates
Canada GL-SLS shipCanada GL-SLS ship
Canada railCanada rail
Canada class 7 & 8 truckCanada class 7 & 8 truck
Canada 8-axle combination truckCanada 8-axle combination truck

_____________________________________________________________________ Surface Freight Transport Environmental Footprints
15
Other quantified dimensions of the “Environmental Footprint” As noted in the Introduction, most of the environmental impacts other than emissions were subject only to qualitative rankings in the assessment for the TRB project. The exceptions were land occupied and accident rates, for which some quantification was possible. Brief notes on their derivation follow. Land Area Occupied An attempt was made for the TRB study to make rough estimates of the land area occupied by facilities required for freight transport by ship, rail and truck in the service area of the Great Lakes and St. Lawrence Seaway. The exercise was considered dubious by the author, for reasons explained further below, but as it was a central intention of the TRB project, an attempt was made. The methods and estimates are described in greater detail in the TRB White Paper, but can be summarised as follows: For ship transport, the land area included is that of the 15 major GL-SLS ports in the US and 11 in Canada, plus the area of land occupied by the Seaway facilities themselves – the canals and locks – from published descriptions of the ports and facilities. The estimates were certainly very rough, but resulted in estimates of 3,500-5,000 hectares of port land, plus about 5,600 hectares for the dedicated land surrounding the Seaway and canals, for a rounded total of 10,000 hectares. For roads, it was assumed that the relevant road network was that linking all of the 26 main GL-SLS ports with Montreal – i.e. those roads necessary to serve all those ports from Montreal if ship traffic were transferred to road. The length of each link was estimated, together with the portions of each link that are limited-access highways as opposed to undivided roads. The total length concerned was estimated as 4,969 kilometres, of which 2,975 km was limited-access. Only a simple approximation of the area of land occupied is possible, of course. Assumptions were made of the average widths of roads (which the author had made in previous Canadian research27), namely that the right-of-way required for a limited-access highway is 100 metres, and that for an undivided interurban road is 30 metres. The resulting estimates are that the area occupied by freeways was 29,754 hectares, and the total occupied by undivided roads 5,981 hectares, for a rounded total of 36,000 hectares. This does not of course consider the requirements for land for truck terminals, storage and transhipment of freight, equivalent to the terminal space in ports. For rail track, the length of the rail network linking the main GL/SLS ports was assumed to be the same as the road network – i.e. approximately 5,000 kilometres. The land required for the tracks was again estimated from an assumed average width of the right-of-way owned by the rail carriers, of 20-30 metres. The resulting estimate of land occupied by railtracks is therefore between 10,000 and 15,000 hectares. Again, this estimate does not consider land required for terminals for storage and transhipment.
_____________________________________________________________________ Surface Freight Transport Environmental Footprints
16
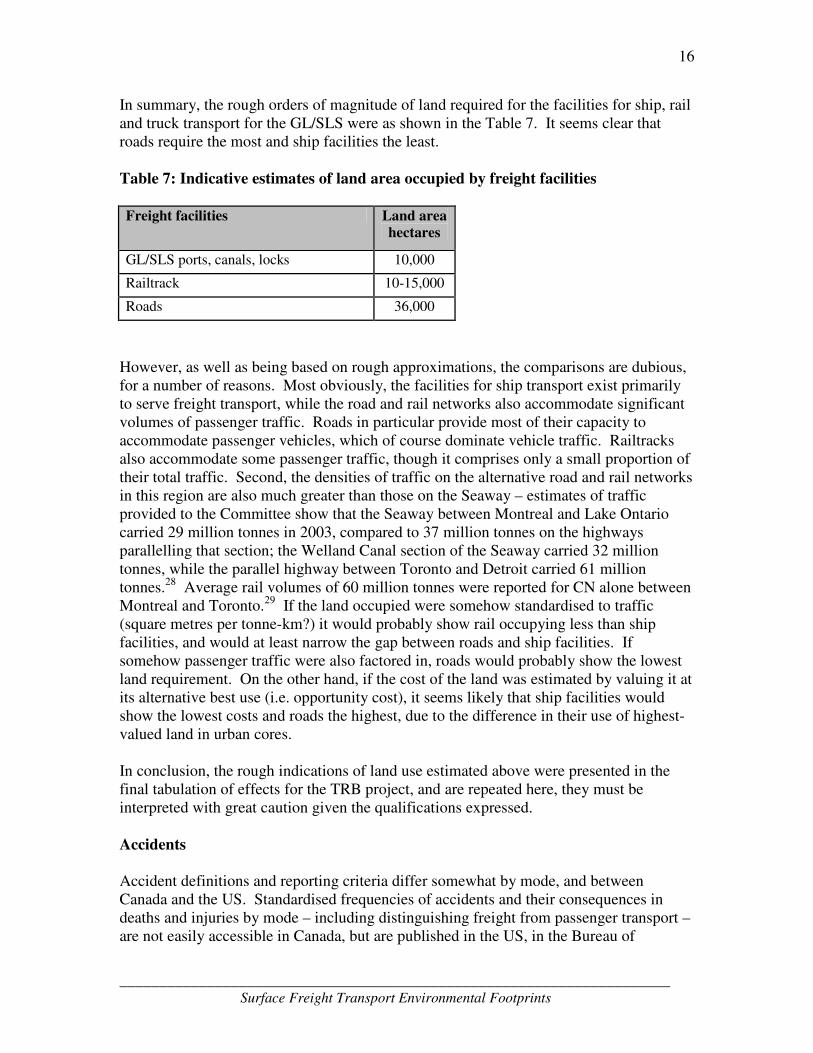
In summary, the rough orders of magnitude of land required for the facilities for ship, rail and truck transport for the GL/SLS were as shown in the Table 7. It seems clear that roads require the most and ship facilities the least. Table 7: Indicative estimates of land area occupied by freight facilities
Freight facilities Land area hectares
GL/SLS ports, canals, locks 10,000
Railtrack 10-15,000
Roads 36,000
However, as well as being based on rough approximations, the comparisons are dubious, for a number of reasons. Most obviously, the facilities for ship transport exist primarily to serve freight transport, while the road and rail networks also accommodate significant volumes of passenger traffic. Roads in particular provide most of their capacity to accommodate passenger vehicles, which of course dominate vehicle traffic. Railtracks also accommodate some passenger traffic, though it comprises only a small proportion of their total traffic. Second, the densities of traffic on the alternative road and rail networks in this region are also much greater than those on the Seaway – estimates of traffic provided to the Committee show that the Seaway between Montreal and Lake Ontario carried 29 million tonnes in 2003, compared to 37 million tonnes on the highways parallelling that section; the Welland Canal section of the Seaway carried 32 million tonnes, while the parallel highway between Toronto and Detroit carried 61 million tonnes.28 Average rail volumes of 60 million tonnes were reported for CN alone between Montreal and Toronto.29 If the land occupied were somehow standardised to traffic (square metres per tonne-km?) it would probably show rail occupying less than ship facilities, and would at least narrow the gap between roads and ship facilities. If somehow passenger traffic were also factored in, roads would probably show the lowest land requirement. On the other hand, if the cost of the land was estimated by valuing it at its alternative best use (i.e. opportunity cost), it seems likely that ship facilities would show the lowest costs and roads the highest, due to the difference in their use of highest-valued land in urban cores. In conclusion, the rough indications of land use estimated above were presented in the final tabulation of effects for the TRB project, and are repeated here, they must be interpreted with great caution given the qualifications expressed.
Accidents Accident definitions and reporting criteria differ somewhat by mode, and between Canada and the US. Standardised frequencies of accidents and their consequences in deaths and injuries by mode – including distinguishing freight from passenger transport – are not easily accessible in Canada, but are published in the US, in the Bureau of
_____________________________________________________________________ Surface Freight Transport Environmental Footprints
17
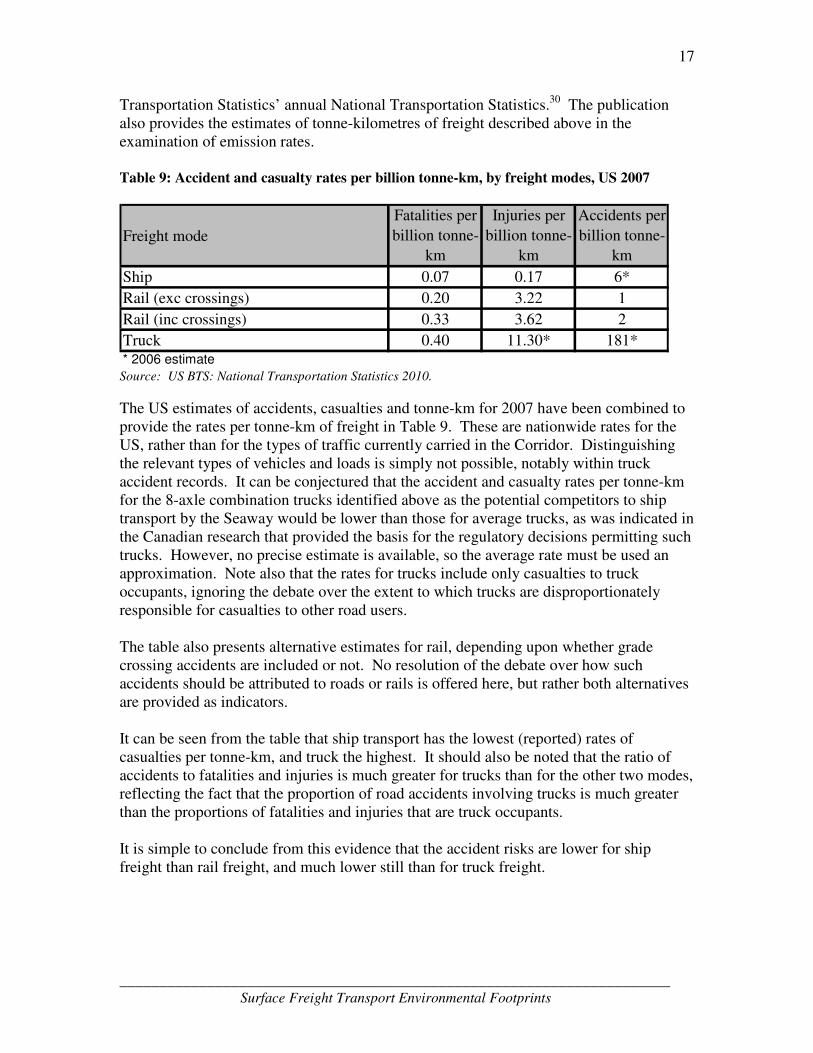
Transportation Statistics’ annual National Transportation Statistics.30 The publication also provides the estimates of tonne-kilometres of freight described above in the examination of emission rates. Table 9: Accident and casualty rates per billion tonne-km, by freight modes, US 2007
Freight mode
Fatalities per
billion tonne-
km
Injuries per
billion tonne-
km
Accidents per
billion tonne-
km
Ship 0.07 0.17 6*
Rail (exc crossings) 0.20 3.22 1
Rail (inc crossings) 0.33 3.62 2
Truck 0.40 11.30* 181** 2006 estimate Source: US BTS: National Transportation Statistics 2010.
The US estimates of accidents, casualties and tonne-km for 2007 have been combined to provide the rates per tonne-km of freight in Table 9. These are nationwide rates for the US, rather than for the types of traffic currently carried in the Corridor. Distinguishing the relevant types of vehicles and loads is simply not possible, notably within truck accident records. It can be conjectured that the accident and casualty rates per tonne-km for the 8-axle combination trucks identified above as the potential competitors to ship transport by the Seaway would be lower than those for average trucks, as was indicated in the Canadian research that provided the basis for the regulatory decisions permitting such trucks. However, no precise estimate is available, so the average rate must be used an approximation. Note also that the rates for trucks include only casualties to truck occupants, ignoring the debate over the extent to which trucks are disproportionately responsible for casualties to other road users. The table also presents alternative estimates for rail, depending upon whether grade crossing accidents are included or not. No resolution of the debate over how such accidents should be attributed to roads or rails is offered here, but rather both alternatives are provided as indicators. It can be seen from the table that ship transport has the lowest (reported) rates of casualties per tonne-km, and truck the highest. It should also be noted that the ratio of accidents to fatalities and injuries is much greater for trucks than for the other two modes, reflecting the fact that the proportion of road accidents involving trucks is much greater than the proportions of fatalities and injuries that are truck occupants. It is simple to conclude from this evidence that the accident risks are lower for ship freight than rail freight, and much lower still than for truck freight.
_____________________________________________________________________ Surface Freight Transport Environmental Footprints
18
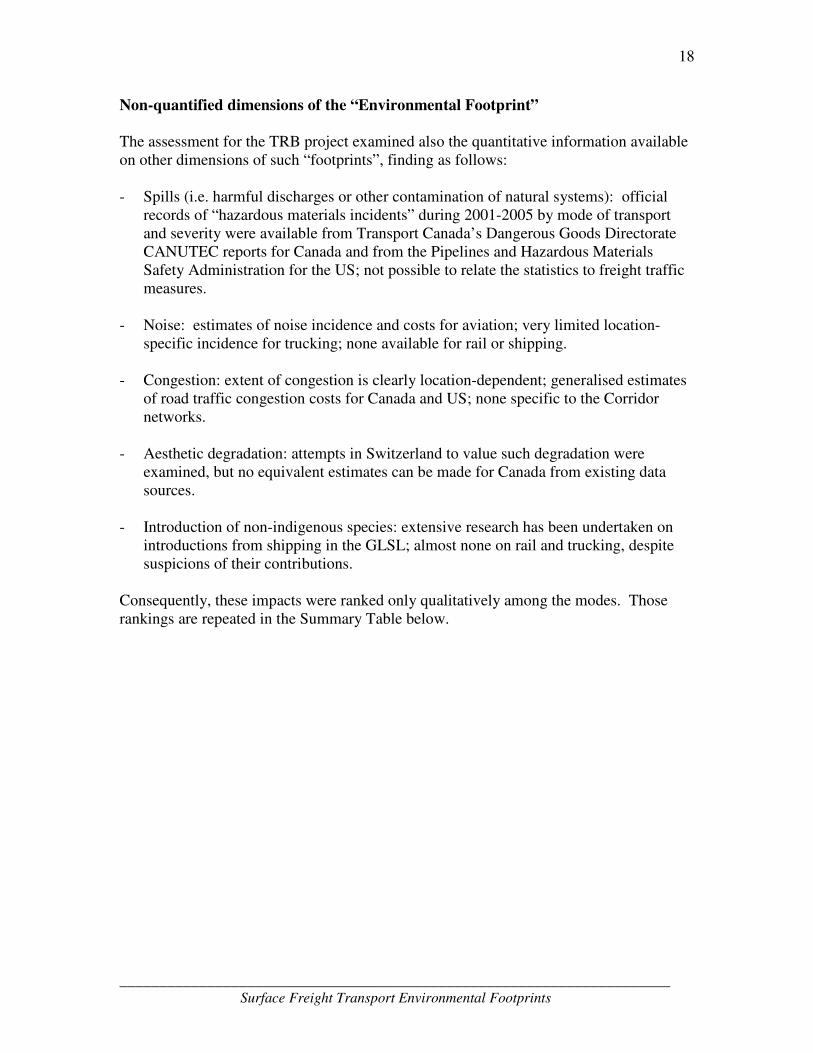
Non-quantified dimensions of the “Environmental Footprint” The assessment for the TRB project examined also the quantitative information available on other dimensions of such “footprints”, finding as follows: - Spills (i.e. harmful discharges or other contamination of natural systems): official
records of “hazardous materials incidents” during 2001-2005 by mode of transport and severity were available from Transport Canada’s Dangerous Goods Directorate CANUTEC reports for Canada and from the Pipelines and Hazardous Materials Safety Administration for the US; not possible to relate the statistics to freight traffic measures.
- Noise: estimates of noise incidence and costs for aviation; very limited location-
specific incidence for trucking; none available for rail or shipping. - Congestion: extent of congestion is clearly location-dependent; generalised estimates
of road traffic congestion costs for Canada and US; none specific to the Corridor networks.
- Aesthetic degradation: attempts in Switzerland to value such degradation were
examined, but no equivalent estimates can be made for Canada from existing data sources.
- Introduction of non-indigenous species: extensive research has been undertaken on
introductions from shipping in the GLSL; almost none on rail and trucking, despite suspicions of their contributions.
Consequently, these impacts were ranked only qualitatively among the modes. Those rankings are repeated in the Summary Table below.
_____________________________________________________________________ Surface Freight Transport Environmental Footprints
19
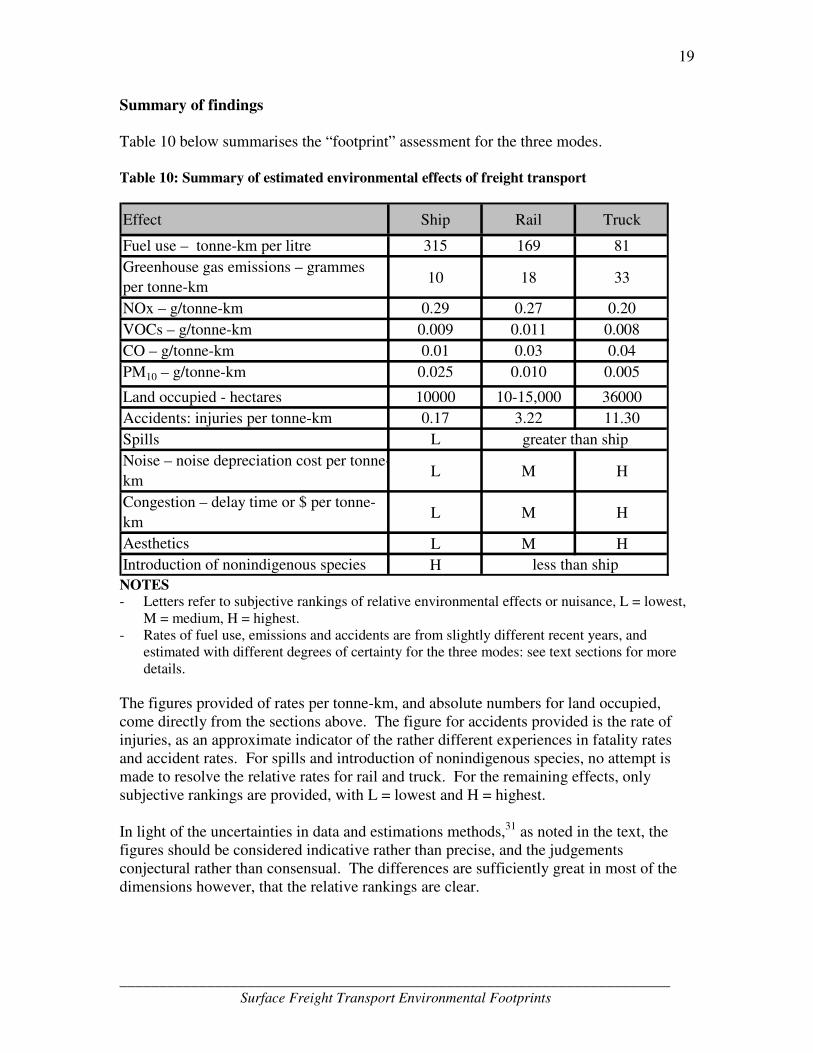
Summary of findings Table 10 below summarises the “footprint” assessment for the three modes. Table 10: Summary of estimated environmental effects of freight transport
Effect Ship Rail Truck
Fuel use – tonne-km per litre 315 169 81
Greenhouse gas emissions – grammes
per tonne-km10 18 33
NOx – g/tonne-km 0.29 0.27 0.20
VOCs – g/tonne-km 0.009 0.011 0.008
CO – g/tonne-km 0.01 0.03 0.04
PM10 – g/tonne-km 0.025 0.010 0.005
Land occupied - hectares 10000 10-15,000 36000
Accidents: injuries per tonne-km 0.17 3.22 11.30
Spills L
Noise – noise depreciation cost per tonne-
kmL M H
Congestion – delay time or $ per tonne-
kmL M H
Aesthetics L M H
Introduction of nonindigenous species H
greater than ship
less than ship NOTES - Letters refer to subjective rankings of relative environmental effects or nuisance, L = lowest,
M = medium, H = highest. - Rates of fuel use, emissions and accidents are from slightly different recent years, and
estimated with different degrees of certainty for the three modes: see text sections for more details.
The figures provided of rates per tonne-km, and absolute numbers for land occupied, come directly from the sections above. The figure for accidents provided is the rate of injuries, as an approximate indicator of the rather different experiences in fatality rates and accident rates. For spills and introduction of nonindigenous species, no attempt is made to resolve the relative rates for rail and truck. For the remaining effects, only subjective rankings are provided, with L = lowest and H = highest. In light of the uncertainties in data and estimations methods,31 as noted in the text, the figures should be considered indicative rather than precise, and the judgements conjectural rather than consensual. The differences are sufficiently great in most of the dimensions however, that the relative rankings are clear.
_____________________________________________________________________ Surface Freight Transport Environmental Footprints
1
ANNEX: IMO estimated ship CO2 emission rates, 2009
Type Size Average Size
Average
cargo
capacity
(tonne)
Average
yearly capac
utilization
Av service
speed
(knots)
Transport work per ship
(tonne-NM)
Total efficiency
(g CO2/tkm)No. ships (2007)
Total billion
tonne-NM
Total billion
tonne-kmTotal CO2 Mt
Crude oil tanker 200,000+ dwt 295,237 48% 15.40 14,197,046,742 2.9 494 7,013 12,989 37.67
Crude oil tanker 120,000–199,999 dwt 151,734 48% 15.00 7,024,437,504 4.4 353 2,480 4,592 20.21
Crude oil tanker 80,000–119,999 dwt 103,403 48% 14.70 4,417,734,613 5.9 651 2,876 5,326 31.42
Crude oil tanker 60,000–79,999 dwt 66,261 48% 14.60 2,629,911,081 7.5 180 473 877 6.58
Crude oil tanker 10,000–59,999 dwt 38,631 48% 14.50 1,519,025,926 9.1 245 372 689 6.27
Crude oil tanker 0–9,999 dwt 3,668 48% 12.10 91,086,398 33.3 114 10 19 0.64
Products tanker 60,000+ dwt 101,000 55% 15.30 3,491,449,962 5.7 198 691 1,280 7.30
Products tanker 20,000–59,999 dwt 40,000 55% 14.80 1,333,683,350 10.3 456 608 1,126 11.60
Products tanker 10,000–19,999 dwt 15,000 50% 14.10 464,013,471 18.7 193 90 166 3.10
Products tanker 5,000–9,999 dwt 7,000 45% 12.80 170,712,388 29.2 466 80 147 4.30
Products tanker 0–4,999 dwt 1,800 45% 11.00 37,598,072 45.0 3,959 149 276 12.41
Chemical tanker 20,000+ dwt 32,200 64% 14.70 1,831,868,715 8.4 1,010 1,850 3,427 28.78
Chemical tanker 10,000–19,999 dwt 15,000 64% 14.50 820,375,271 10.8 584 479 887 9.58
Chemical tanker 5,000–9,999 dwt 7,000 64% 14.50 382,700,554 15.1 642 246 455 6.87
Chemical tanker 0–4,999 dwt 1,800 64% 14.50 72,147,958 22.2 1,659 120 222 4.92
LPG tanker 50,000+ m3 46,656 48% 16.60 2,411,297,106 9.0 138 333 616 5.55
LPG tanker 0–49,999 m3 3,120 48% 14.00 89,631,360 43.5 943 85 157 6.81
LPG tanker 200,000+ m3 97,520 48% 19.60 5,672,338,333 9.3 4 23 42 0.39
LPG tanker 0–199,999 m3 62,100 48% 19.60 3,797,321,655 14.5 239 908 1,681 24.37
Bulk carrier 200,000+ dwt 227,000 50% 14.40 10,901,043,017 2.5 119 1,297 2,402 6.01
Bulk carrier 100,000–199,999 dwt 163,000 50% 14.40 7,763,260,284 3.0 686 5,326 9,863 29.59
Bulk carrier 60,000–99,999 dwt 74,000 55% 14.40 3,821,361,703 4.1 1,513 5,782 10,708 43.90
Bulk carrier 35,000–59,999 dwt 45,000 55% 14.40 2,243,075,236 5.7 1,864 4,181 7,743 44.14
Bulk carrier 10,000–34,999 dwt 26,000 55% 14.30 1,268,561,872 7.9 2,090 2,651 4,910 38.79
Bulk carrier 0–9,999 dwt 2,400 60% 11.00 68,226,787 29.2 1,120 76 142 4.13
General cargo 10,000+ dwt 15,000 60% 15.40 866,510,887 11.9 674 584 1,082 12.87
General cargo 5,000–9,999 dwt 6,957 60% 13.40 365,344,150 15.8 1,528 558 1,034 16.34
General cargo 0–4,999 dwt 2,545 60% 11.70 76,945,792 13.9 11,006 847 1,568 21.80
General cargo 10,000+ dwt, 100+TEU 18,000 60% 15.40 961,054,062 11.0 1,225 1,177 2,180 23.98
General cargo 5,000–9,999 dwt, 100+ TEU 7,000 60% 13.40 243,599,799 17.5 1,089 265 491 8.60
General cargo 0–4,999, 100+ TEU 4,000 60% 11.70 120,938,043 19.8 1,486 180 333 6.59
Container Container 8,000+ 68,600 70% 25.10 6,968,284,047 12.5 118 822 1,523 19.04
Container Container 5,000–7,999 40,355 70% 25.30 4,233,489,679 16.6 417 1,765 3,269 54.27
Container Container 3,000–4,999 28,784 70% 23.30 2,820,323,533 16.6 711 2,005 3,714 61.65
Container Container 2,000–2,999 16,800 70% 20.90 1,480,205,694 20.0 667 987 1,828 36.57
Container Container 1,000–1,999 7,000 70% 19.00 578,339,367 32.1 1,115 645 1,194 38.34
Container Container 0–999 3,500 70% 17.00 179,809,363 36.3 1,110 200 370 13.42
Vehicle Vehicle 4,000+ 7,908 70% 19.40 732,581,677 32.0 398 292 540 17.28
Vehicle Vehicle 0–3,999 2,808 70% 17.70 226,545,399 57.6 337 76 141 8.14
Ro-Ro Ro-Ro 2,000+ 5,154 70% 19.40 368,202,021 49.5 194 71 132 6.55
Ro-Ro Ro-Ro 0–1,999 1,432 70% 13.20 57,201,146 60.3 1,517 87 161 9.69
Sum 43,512 48,760 90,303 750
Av CO2 g/tkm 15.39 Source: IMO report: “Second IMO GHG Study 2009”, tables 9.1 and A1.8; last 3 columns derived by the author from the previous columns. Note that the table provides estimates for CO2 only, to which the author added the reports estimates for CH4 and N2O, weighted by their radiative forcing coefficients, to give average CO2e for the fleet.
_____________________________________________________________________ Surface Freight Transport Environmental Footprints
1
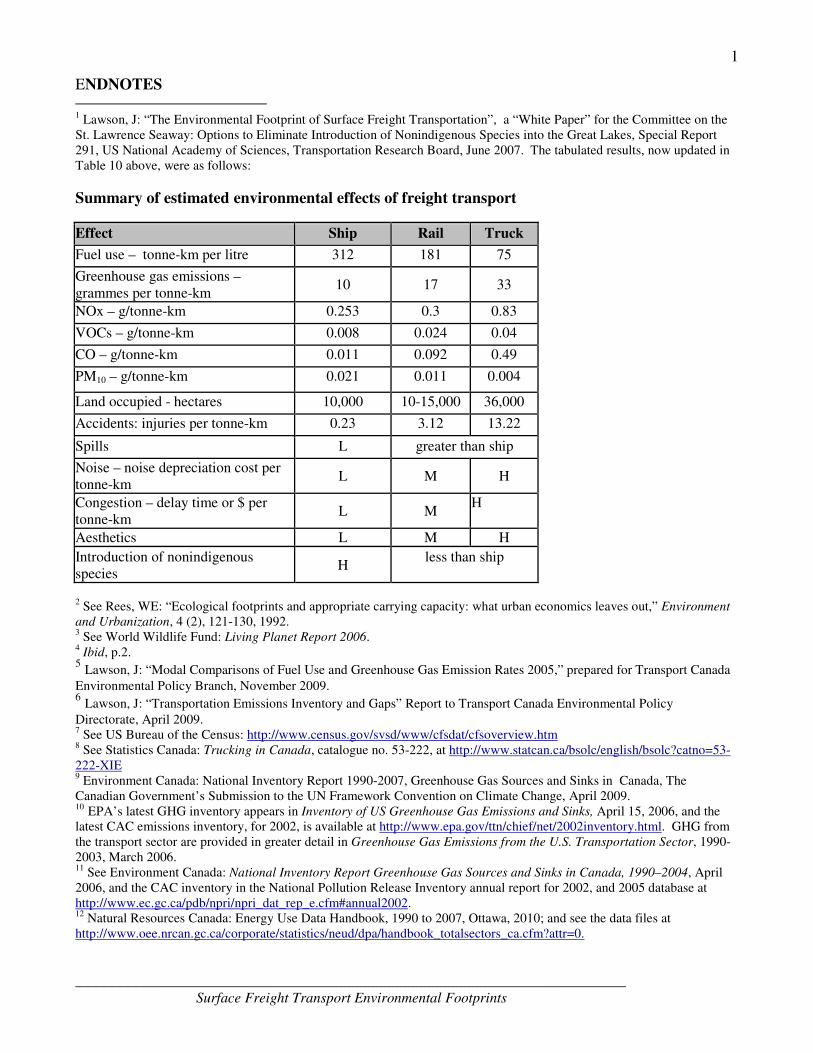
ENDNOTES 1 Lawson, J: “The Environmental Footprint of Surface Freight Transportation”, a “White Paper” for the Committee on the St. Lawrence Seaway: Options to Eliminate Introduction of Nonindigenous Species into the Great Lakes, Special Report 291, US National Academy of Sciences, Transportation Research Board, June 2007. The tabulated results, now updated in Table 10 above, were as follows:
Summary of estimated environmental effects of freight transport
Effect Ship Rail Truck
Fuel use – tonne-km per litre 312 181 75
Greenhouse gas emissions – grammes per tonne-km
10 17 33
NOx – g/tonne-km 0.253 0.3 0.83
VOCs – g/tonne-km 0.008 0.024 0.04
CO – g/tonne-km 0.011 0.092 0.49
PM10 – g/tonne-km 0.021 0.011 0.004
Land occupied - hectares 10,000 10-15,000 36,000
Accidents: injuries per tonne-km 0.23 3.12 13.22
Spills L greater than ship
Noise – noise depreciation cost per tonne-km
L M H
Congestion – delay time or $ per tonne-km
L M H
Aesthetics L M H
Introduction of nonindigenous species
H less than ship
2 See Rees, WE: “Ecological footprints and appropriate carrying capacity: what urban economics leaves out,” Environment
and Urbanization, 4 (2), 121-130, 1992. 3 See World Wildlife Fund: Living Planet Report 2006. 4 Ibid, p.2. 5 Lawson, J: “Modal Comparisons of Fuel Use and Greenhouse Gas Emission Rates 2005,” prepared for Transport Canada
Environmental Policy Branch, November 2009. 6 Lawson, J: “Transportation Emissions Inventory and Gaps” Report to Transport Canada Environmental Policy
Directorate, April 2009. 7 See US Bureau of the Census: http://www.census.gov/svsd/www/cfsdat/cfsoverview.htm 8 See Statistics Canada: Trucking in Canada, catalogue no. 53-222, at http://www.statcan.ca/bsolc/english/bsolc?catno=53-222-XIE 9 Environment Canada: National Inventory Report 1990-2007, Greenhouse Gas Sources and Sinks in Canada, The Canadian Government’s Submission to the UN Framework Convention on Climate Change, April 2009. 10 EPA’s latest GHG inventory appears in Inventory of US Greenhouse Gas Emissions and Sinks, April 15, 2006, and the latest CAC emissions inventory, for 2002, is available at http://www.epa.gov/ttn/chief/net/2002inventory.html. GHG from the transport sector are provided in greater detail in Greenhouse Gas Emissions from the U.S. Transportation Sector, 1990-2003, March 2006. 11 See Environment Canada: National Inventory Report Greenhouse Gas Sources and Sinks in Canada, 1990–2004, April 2006, and the CAC inventory in the National Pollution Release Inventory annual report for 2002, and 2005 database at http://www.ec.gc.ca/pdb/npri/npri_dat_rep_e.cfm#annual2002. 12 Natural Resources Canada: Energy Use Data Handbook, 1990 to 2007, Ottawa, 2010; and see the data files at http://www.oee.nrcan.gc.ca/corporate/statistics/neud/dpa/handbook_totalsectors_ca.cfm?attr=0.
_____________________________________________________________________ Surface Freight Transport Environmental Footprints
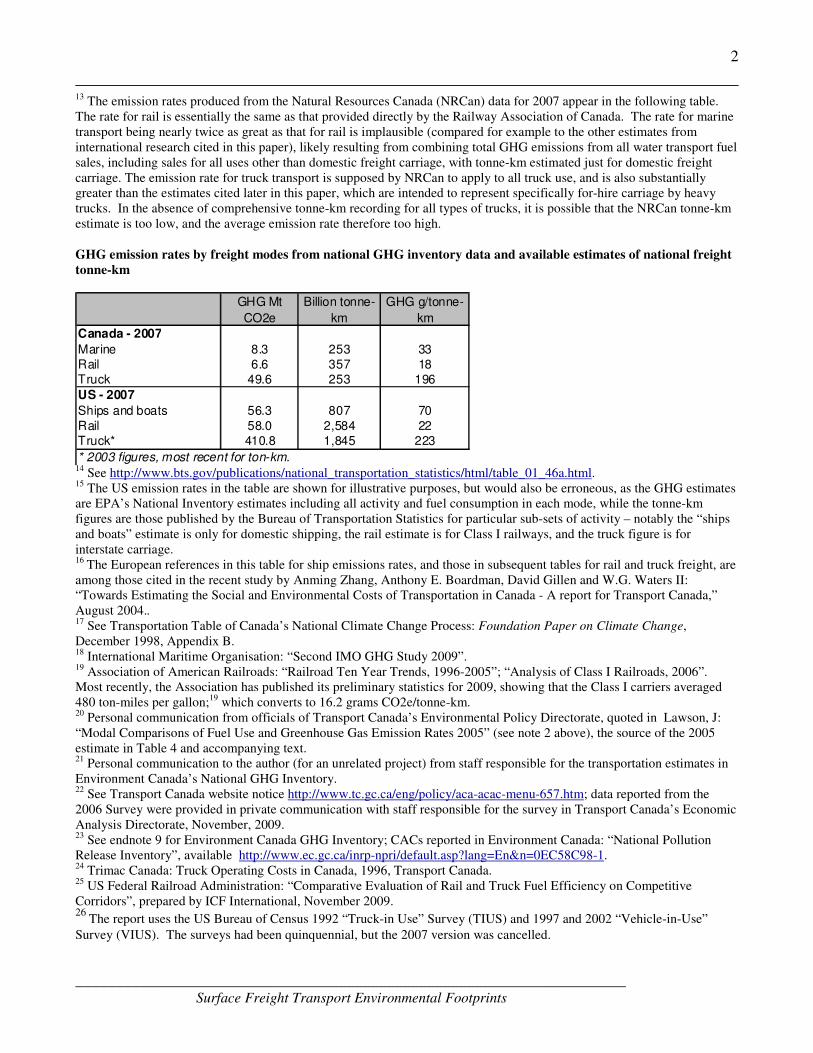
2
13 The emission rates produced from the Natural Resources Canada (NRCan) data for 2007 appear in the following table. The rate for rail is essentially the same as that provided directly by the Railway Association of Canada. The rate for marine transport being nearly twice as great as that for rail is implausible (compared for example to the other estimates from international research cited in this paper), likely resulting from combining total GHG emissions from all water transport fuel sales, including sales for all uses other than domestic freight carriage, with tonne-km estimated just for domestic freight carriage. The emission rate for truck transport is supposed by NRCan to apply to all truck use, and is also substantially greater than the estimates cited later in this paper, which are intended to represent specifically for-hire carriage by heavy trucks. In the absence of comprehensive tonne-km recording for all types of trucks, it is possible that the NRCan tonne-km estimate is too low, and the average emission rate therefore too high. GHG emission rates by freight modes from national GHG inventory data and available estimates of national freight
tonne-km
GHG Mt
CO2e
Billion tonne-
km
GHG g/tonne-
km
Canada - 2007
Marine 8.3 253 33Rail 6.6 357 18Truck 49.6 253 196
US - 2007
Ships and boats 56.3 807 70
Rail 58.0 2,584 22Truck* 410.8 1,845 223
* 2003 figures, most recent for ton-km. 14 See http://www.bts.gov/publications/national_transportation_statistics/html/table_01_46a.html. 15 The US emission rates in the table are shown for illustrative purposes, but would also be erroneous, as the GHG estimates are EPA’s National Inventory estimates including all activity and fuel consumption in each mode, while the tonne-km figures are those published by the Bureau of Transportation Statistics for particular sub-sets of activity – notably the “ships and boats” estimate is only for domestic shipping, the rail estimate is for Class I railways, and the truck figure is for interstate carriage. 16
The European references in this table for ship emissions rates, and those in subsequent tables for rail and truck freight, are among those cited in the recent study by Anming Zhang, Anthony E. Boardman, David Gillen and W.G. Waters II: “Towards Estimating the Social and Environmental Costs of Transportation in Canada - A report for Transport Canada,” August 2004.. 17 See Transportation Table of Canada’s National Climate Change Process: Foundation Paper on Climate Change, December 1998, Appendix B. 18 International Maritime Organisation: “Second IMO GHG Study 2009”. 19 Association of American Railroads: “Railroad Ten Year Trends, 1996-2005”; “Analysis of Class I Railroads, 2006”. Most recently, the Association has published its preliminary statistics for 2009, showing that the Class I carriers averaged 480 ton-miles per gallon;19 which converts to 16.2 grams CO2e/tonne-km. 20 Personal communication from officials of Transport Canada’s Environmental Policy Directorate, quoted in Lawson, J: “Modal Comparisons of Fuel Use and Greenhouse Gas Emission Rates 2005” (see note 2 above), the source of the 2005 estimate in Table 4 and accompanying text. 21 Personal communication to the author (for an unrelated project) from staff responsible for the transportation estimates in Environment Canada’s National GHG Inventory. 22 See Transport Canada website notice http://www.tc.gc.ca/eng/policy/aca-acac-menu-657.htm; data reported from the 2006 Survey were provided in private communication with staff responsible for the survey in Transport Canada’s Economic Analysis Directorate, November, 2009. 23 See endnote 9 for Environment Canada GHG Inventory; CACs reported in Environment Canada: “National Pollution Release Inventory”, available http://www.ec.gc.ca/inrp-npri/default.asp?lang=En&n=0EC58C98-1. 24 Trimac Canada: Truck Operating Costs in Canada, 1996, Transport Canada.
25 US Federal Railroad Administration: “Comparative Evaluation of Rail and Truck Fuel Efficiency on Competitive Corridors”, prepared by ICF International, November 2009. 26
The report uses the US Bureau of Census 1992 “Truck-in Use” Survey (TIUS) and 1997 and 2002 “Vehicle-in-Use”
Survey (VIUS). The surveys had been quinquennial, but the 2007 version was cancelled.
_____________________________________________________________________ Surface Freight Transport Environmental Footprints
3
27 See Royal Commission on National Passenger Transportion, Final report, Volume 2, Ottawa, Supply and Services Canada, 1992. 28 Tardif, R: “Trucking Activity Current Status, Hwy Limitations, Future Opportunities” presentation to National Academies/TRB Committee on the St. Lawrence Seaway: Options to Eliminate Introduction of Nonindigenous Species into the Great Lakes, Montreal, Sept 28, 2004. 29 Lemieux, Y: “Modal Competitive Dynamics Along the St.Lawrence Seaway and Great Lakes”, presentation to National Academies/TRB Committee on the St. Lawrence Seaway: Options to Eliminate Introduction of Nonindigenous Species into the Great Lakes, Montreal, Sept 28, 2004. 30 US Bureau of Transportation Statistics: National Transportation Statistics 2006. 31 The most important and practical requirements for additional data and research into the environmental effects of freight transport are noted in the Annex to this paper.