Embed Size (px)
Citation preview
Resource Footprints are Good Proxies of Environmental DamageZoran J. N. Steinmann,*,† Aafke M. Schipper,†,∥ Mara Hauck,†,⊥ Stefan Giljum,‡ Gregor Wernet,§
and Mark A. J. Huijbregts†
†Department of Environmental Science, Institute for Water and Wetland Research, Radboud University, Heyendaalseweg 135, 6525AJ Nijmegen, The Netherlands‡Institute for Ecological Economics, Vienna University of Economics and Business (WU), Welthandelsplatz 1, 1020 Vienna, Austria§Ecoinvent, Technoparkstrasse 1, 8057 Zurich, Switzerland
*S Supporting Information
ABSTRACT: Environmental footprints are increasingly used to quantify andcompare environmental impacts of for example products, technologies, households,or nations. This has resulted in a multitude of footprint indicators, ranging fromrelatively simple measures of resource use (water, energy, materials) to integratedmeasures of eventual damage (for example, extinction of species). Yet, the possibleredundancies among these different footprints have not yet been quantified. Thispaper analyzes the relationships between two comprehensive damage footprints andfour resource footprints associated with 976 products. The resource footprintsaccounted for >90% of the variation in the damage footprints. Human health damagewas primarily associated with the energy footprint, via emissions resulting from fossilfuel combustion. Biodiversity damage was mainly related to the energy and land footprints, the latter being mainly determined byagriculture and forestry. Our results indicate that relatively simple resource footprints are highly representative of damage tohuman health and biodiversity.
■ INTRODUCTION
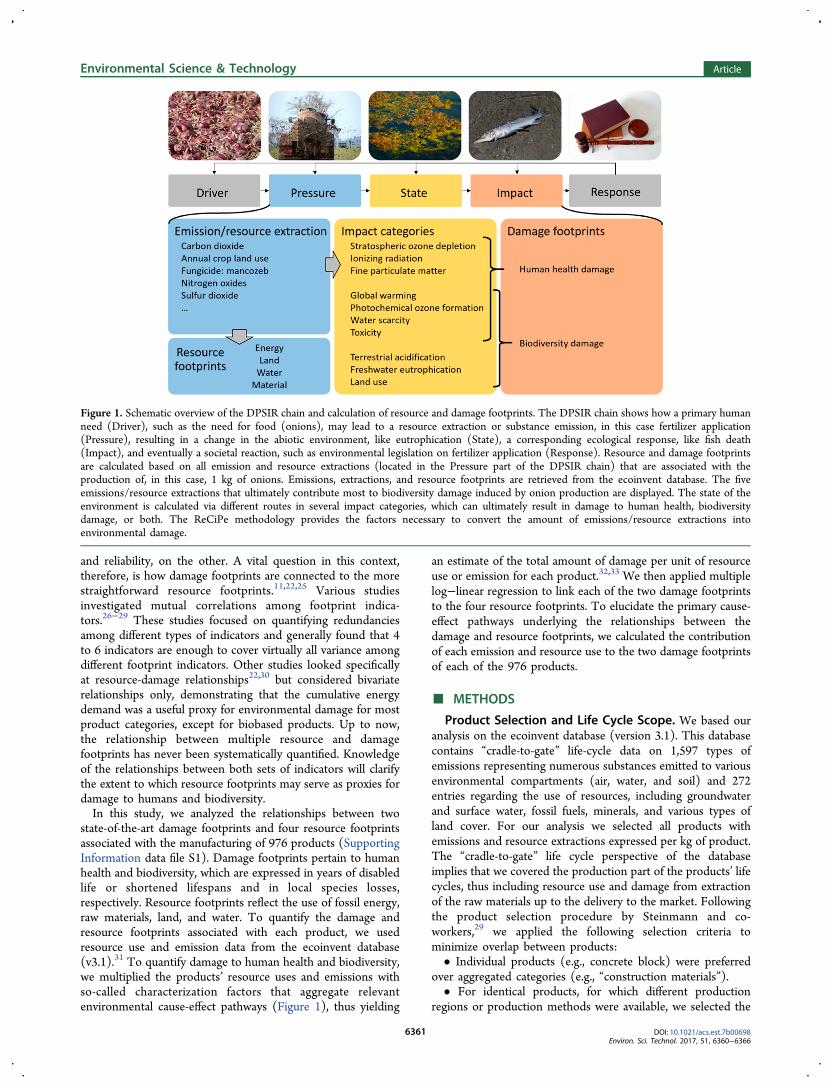
Apart from welfare and increased longevity, our modernindustrialized society has brought unintended environmentaland social impacts, for example on biodiversity and humanhealth. As illustrated by the so-called DPSIR framework(Driver, Pressure, State, Impact, and Response),1 humanneeds (e.g., need for food) result in environmental pressures(e.g., use of fertilizer) which change the state of theenvironment (e.g., polluted surface water). This in turn resultsin impacts (e.g., biodiversity decline) and eventually a societalresponse to these impacts (e.g., reduced fertilizer use) (Figure1). In line with this framework, biodiversity impacts areassessed by integrated assessment studies, such as theMillennium Ecosystem Assessment2 and the Global Biodiver-sity Outlooks,3 which quantify the influence of human driverson species decline. Similarly, in the Global Burden of Diseasestudies the damage to human health of a number of(environmental) factors, such as fine particulate dustconcentrations, is assessed in terms of Disability AdjustedLife Years.4
For purposes of environmental accountability and efficientdamage remediation, impacts on biodiversity or human healthcan be allocated to specific products, technologies, cities, ornations, resulting in so-called footprints. Different types offootprints have been developed. Damage footprints approx-imate the anthropogenic impact on human health andecosystems by encompassing as many relevant resourceextractions, substance emissions, and cause-effect pathways aspossible.5−8 The comprehensiveness of the damage footprints
comes, however, at a cost. Not only do damage footprintcalculations require large amounts of input data but also theiroutcomes are associated with large uncertainties because of theassumptions and simplifications made when quantifyingintricate environmental cause-effect chains.5 As an alternativeapproach, the pressure part of the DPSIR chain can be used toquantify so-called resource footprints.9,10 Examples of resourcefootprint indicators include land use, water consumption, rawmaterial extraction, and life cycle energy use.11−19 Because theyare situated early on in the DPSIR chain, such resourcefootprint indicators are relatively straightforward to calculateand communicate, yet they are unlikely to represent the totalenvironmental impact of a particular anthropogenic entity.20,21
For example, environmental impacts primarily due to emissionsof toxic substances are poorly represented by resourcefootprints.22,23 Moreover, certain footprints are consideredoverly simplistic for use in environmental assessments. Forexample, material footprints that merely sum the amounts of allraw materials needed fail to consider that the environmentalimpacts associated with their extraction and processing can behighly material-specific.24
In short, the different footprint approaches involve cleartrade-offs between comprehensiveness and representativeness,on the one hand, and data requirements, computational efforts,
Received: February 7, 2017Revised: May 8, 2017Accepted: May 16, 2017Published: May 26, 2017
Article
pubs.acs.org/est
© 2017 American Chemical Society 6360 DOI: 10.1021/acs.est.7b00698Environ. Sci. Technol. 2017, 51, 6360−6366
This is an open access article published under a Creative Commons Non-Commercial NoDerivative Works (CC-BY-NC-ND) Attribution License, which permits copying andredistribution of the article, and creation of adaptations, all for non-commercial purposes.
and reliability, on the other. A vital question in this context,therefore, is how damage footprints are connected to the morestraightforward resource footprints.11,22,25 Various studiesinvestigated mutual correlations among footprint indica-tors.26−29 These studies focused on quantifying redundanciesamong different types of indicators and generally found that 4to 6 indicators are enough to cover virtually all variance amongdifferent footprint indicators. Other studies looked specificallyat resource-damage relationships22,30 but considered bivariaterelationships only, demonstrating that the cumulative energydemand was a useful proxy for environmental damage for mostproduct categories, except for biobased products. Up to now,the relationship between multiple resource and damagefootprints has never been systematically quantified. Knowledgeof the relationships between both sets of indicators will clarifythe extent to which resource footprints may serve as proxies fordamage to humans and biodiversity.In this study, we analyzed the relationships between two
state-of-the-art damage footprints and four resource footprintsassociated with the manufacturing of 976 products (SupportingInformation data file S1). Damage footprints pertain to humanhealth and biodiversity, which are expressed in years of disabledlife or shortened lifespans and in local species losses,respectively. Resource footprints reflect the use of fossil energy,raw materials, land, and water. To quantify the damage andresource footprints associated with each product, we usedresource use and emission data from the ecoinvent database(v3.1).31 To quantify damage to human health and biodiversity,we multiplied the products’ resource uses and emissions withso-called characterization factors that aggregate relevantenvironmental cause-effect pathways (Figure 1), thus yielding
an estimate of the total amount of damage per unit of resourceuse or emission for each product.32,33 We then applied multiplelog−linear regression to link each of the two damage footprintsto the four resource footprints. To elucidate the primary cause-effect pathways underlying the relationships between thedamage and resource footprints, we calculated the contributionof each emission and resource use to the two damage footprintsof each of the 976 products.
■ METHODS
Product Selection and Life Cycle Scope. We based ouranalysis on the ecoinvent database (version 3.1). This databasecontains “cradle-to-gate” life-cycle data on 1,597 types ofemissions representing numerous substances emitted to variousenvironmental compartments (air, water, and soil) and 272entries regarding the use of resources, including groundwaterand surface water, fossil fuels, minerals, and various types ofland cover. For our analysis we selected all products withemissions and resource extractions expressed per kg of product.The “cradle-to-gate” life cycle perspective of the databaseimplies that we covered the production part of the products’ lifecycles, thus including resource use and damage from extractionof the raw materials up to the delivery to the market. Followingthe product selection procedure by Steinmann and co-workers,29 we applied the following selection criteria tominimize overlap between products:• Individual products (e.g., concrete block) were preferred
over aggregated categories (e.g., “construction materials”).• For identical products, for which different production
regions or production methods were available, we selected the
Figure 1. Schematic overview of the DPSIR chain and calculation of resource and damage footprints. The DPSIR chain shows how a primary humanneed (Driver), such as the need for food (onions), may lead to a resource extraction or substance emission, in this case fertilizer application(Pressure), resulting in a change in the abiotic environment, like eutrophication (State), a corresponding ecological response, like fish death(Impact), and eventually a societal reaction, such as environmental legislation on fertilizer application (Response). Resource and damage footprintsare calculated based on all emission and resource extractions (located in the Pressure part of the DPSIR chain) that are associated with theproduction of, in this case, 1 kg of onions. Emissions, extractions, and resource footprints are retrieved from the ecoinvent database. The fiveemissions/resource extractions that ultimately contribute most to biodiversity damage induced by onion production are displayed. The state of theenvironment is calculated via different routes in several impact categories, which can ultimately result in damage to human health, biodiversitydamage, or both. The ReCiPe methodology provides the factors necessary to convert the amount of emissions/resource extractions intoenvironmental damage.
Environmental Science & Technology Article
DOI: 10.1021/acs.est.7b00698Environ. Sci. Technol. 2017, 51, 6360−6366
6361
global or “rest-of-the-world” market mix instead of specificsubtypes based on particular production methods or regions.• Some products share (almost) identical production chains
(such as isobutanol and butanol). In these cases we selected theproducts with the largest overall amount of interventions.Similarity among the product chains was checked by dividing
all interventions related to the production of 1 kg of a productby all the interventions of all other products. In case of anidentical production chain, the ratios for all interventions arethe same. Two products were considered to come from thesame production chain if the coefficient of variation of theseratios was <0.01. Like in the paper by Steinmann and co-workers29 the final set contained 976 products, from sevencategories: Agricultural & forestry products (106), Buildingmaterials (72), Chemicals (435), Metal products & electronics(128), Ores, minerals & fuels (91), Plastics (64), and Processedbiobased products (80) (see data file S1 for the names of allproducts).Resource Footprints. We quantified four resource foot-
prints for each product: nonrenewable energy demand, rawmaterial use, land use, and freshwater consumption. Energydemand (MJ) was quantified as the total amount of fossilenergy required, including energy from oil, coal, gas, and peat.Raw material use (kg) was calculated as the total amount of allraw materials extracted from the earth, excluding fossil fuelsbecause these were already covered by the energy demandcalculations. Biotic resources were not included in the materialfootprint. Metal extractions as reported in ecoinvent wereconverted to ore extractions by dividing by the metal-specificore grades, as reported in ecoinvent.31 In case of multiplemetals derived from the same ore (e.g., silver and gold), weused the maximum ore extraction needed to obtain the requiredamount of any of the metals, in order to avoid double countingof ore produced. The land footprint (m2 · yr) was quantified asthe total area of land used over time, irrespective of the type ofland use, and not including land transformation. The employedblue water footprint covers the life cycle consumptive use ofwater. Freshwater consumption (m3) was defined as theamount of evaporated water plus the amount of water that isincorporated in the products. This consumption was calculatedas the difference between freshwater extracted from nature andthe amount of water returned. In 245 out 976 cases the waterevaporation (calculated by summing all emissions of water tothe air) exceeded the amount of extracted water minus theamount of returned water. In these cases the evaporation wasused as approximation of the total water consumption.Damage Footprints. We calculated the human health and
biodiversity damage footprints of each product by summing theresource uses and emissions multiplied with the correspondingcharacterization factors (CFs), i.e. factors representing theamount of damage per unit of resource use or emission, as
∑= ·IDF CFx pi
i p i x, , ,
where DFx,p is the damage footprint for category x (humanhealth or biodiversity) and product p, Ii,p is the amount ofresource use or emission i associated with product p, and CFi,xis the characterization factor for resource use or emission i anddamage category x (damage to human health or biodiversity).34
We calculated human health damage as disability-adjusted lifeyears (DALYs; yr) induced by climate change, stratosphericozone depletion, toxicant exposure, photochemical ozoneformation, particulate matter formation, water stress, and
ionizing radiation.32 Biodiversity loss was calculated as thetime-integrated local species loss (species · yr) due to climatechange, terrestrial acidification, photochemical ozone forma-tion, freshwater eutrophication, terrestrial ecotoxicity, fresh-water ecotoxicity, marine ecotoxicity, water stress, agriculturalland occupation, and urban land occupation.32 See SupportingInformation Table S1 for a more detailed description of theimpact pathways considered in these impact categories and thesources of the underlying data.To account for spatial variability in damage we used country-
specific CFs for acidification, freshwater eutrophication, andwater consumption and region-specific CFs for fine particulatematter formation and photochemical ozone formation. Therewere 156 countries for which acidification, freshwatereutrophication, and water consumption CFs were providedby the ReCiPe methodology.32 Each of these countries wasassigned to one of the 58 regions for fine particulate matterformation and photochemical ozone formation (SupportingInformation data file S2).To avoid artificial environmental benefits for human health
and biodiversity, net negative emissions of metals to agriculturalsoils due to metal uptake in crops, as reported in ecoinventv3.1, were not considered in our cradle-to-gate analysis.Furthermore, we neglected potential human health impacts ofpesticide uptake by crops, as we did not have informationwhether the crops were used for food, feed, or biofuels. Finally,only the off-target biodiversity impacts of chemical emissions toagricultural soil were considered. This was done to avoiddouble counting with the biodiversity impact caused byagricultural land occupation.
Regression Modeling. We used multiple linear regression(least-squares fitting) to relate the damage footprints to theresource footprints. To account for spatial variability in impacts,we performed the regression analysis for each of the 156countries separately, thereby implicitly assuming that allemissions and resource extractions required for each of the976 products occur in that specific country. Because thefootprints varied up to 10 orders of magnitude (based on allproducts), all footprints were log-transformed prior to modelfitting. In regression models, high correlations amongexplanatory variables (in our case, the resource footprints)lead to unstable regression coefficients. If this is the case, itbecomes impossible to determine which of the predictors isresponsible for which share of the variance.35,36 Therefore, wefitted all possible combinations of predictors and removed theregression models for which any of the predictors had aVariance Inflation Factor (VIF) larger than 5.35 We then rankedthe remaining models according to Akaike’s InformationCriterion (AIC)37 which enabled us to select the mostparsimonious model per country, damage footprint, andproduct group (Supporting Information Table S2). Wecalculated Cook’s distances for the full model set to assessthe influence of individual products on the regressioncoefficients.38 Cook’s distances were below the threshold of 1in all cases; therefore, all individual products were retained inthe analysis. All analyses were performed in the statisticalprogram R.39 Plotting of all figures except Figure 1 wasperformed with the package “Cairo”,40 and VIFs werecalculated with the package “HH”.41 Plots of the modelresiduals were created to analyze the accuracy of the predictionsas well as check for potential violations of regressionassumptions (Supporting Information Figures S7 and S8).
Environmental Science & Technology Article
DOI: 10.1021/acs.est.7b00698Environ. Sci. Technol. 2017, 51, 6360−6366
6362
The plots revealed that the errors in the prediction did notsystematically deviate from the expected normal distribution.Cause-Effect Pathways. To elucidate the relationships
between the damage and resource footprints, we first calculatedthe contribution of each individual resource extraction oremission to the damage to human health or biodiversity of eachproduct, as
=·
∑ ·I
IFF
CF
CFx i pi p i x
i i p i x, ,
, ,
, ,
where FFx,i,p is the fraction of the damage footprint of product pfor category x (human health or biodiversity) caused byresource extraction or emission i, Ii,p is the amount of resourceextraction or emission i associated with product p, and CFi,x isthe characterization factor for resource extraction or emission iand damage category x. Per damage footprint, we ranked themedian contributions FFx,i,p over all products and per productgroup. This analysis was performed only for the default ReCiPecharacterization factors, i.e. country-specific differences due tospatial variability were not included.Damage Scenarios. Damage footprint calculations require
particular assumptions and choices, for example with respect tothe time horizon considered, the cause-effect pathways to beincluded, and the expected ability of humans and ecosystems to
mitigate or adjust to future damage. In the ReCiPe method-ology, these assumptions and choices are aggregated in threescenarios that reflect differences in value choices based onCultural theory considerations.42−44 Each of these scenarios isrepresented by a coherent set of characterization factors. Toassess the influence of these different scenarios on our results,we performed the damage footprint calculations and sub-sequent regression analyses based not only on the character-izations of the default scenario but also according to the twoother scenarios. The “high resilience” scenario assumes thatongoing technological and economic developments enablemankind to mitigate future damage, therefore giving moreweight to present-day effects than future damage andaccounting only for well-established cause-effect relationships.The “low resilience” scenario reflects the view that nature isfragile, that all possible cause-effect paths need to be accountedfor (precautionary principle), and that a long time horizon ismost adequate.
■ RESULTS
Human Health Damage. Overall, the four resourcefootprints accounted for more than 90% of the variation inhuman health damage. Human health damage was primarilyassociated with fossil energy use, followed by the use of raw
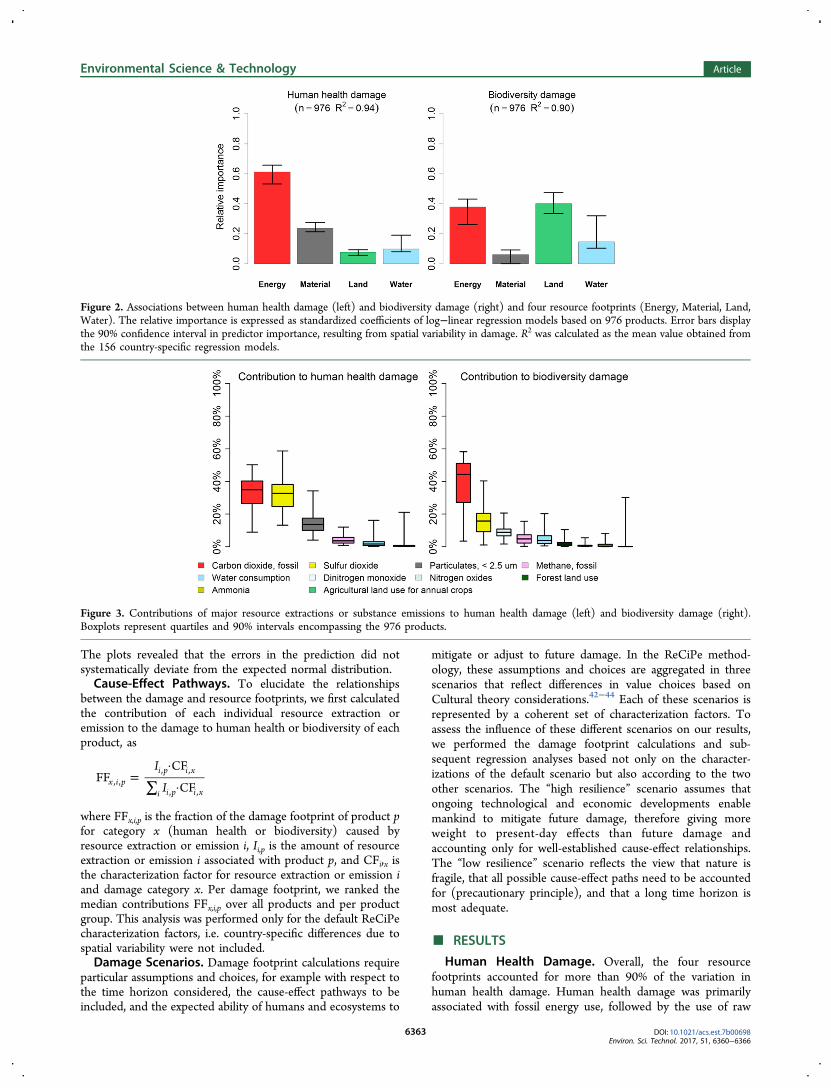
Figure 2. Associations between human health damage (left) and biodiversity damage (right) and four resource footprints (Energy, Material, Land,Water). The relative importance is expressed as standardized coefficients of log−linear regression models based on 976 products. Error bars displaythe 90% confidence interval in predictor importance, resulting from spatial variability in damage. R2 was calculated as the mean value obtained fromthe 156 country-specific regression models.
Figure 3. Contributions of major resource extractions or substance emissions to human health damage (left) and biodiversity damage (right).Boxplots represent quartiles and 90% intervals encompassing the 976 products.
Environmental Science & Technology Article
DOI: 10.1021/acs.est.7b00698Environ. Sci. Technol. 2017, 51, 6360−6366
6363
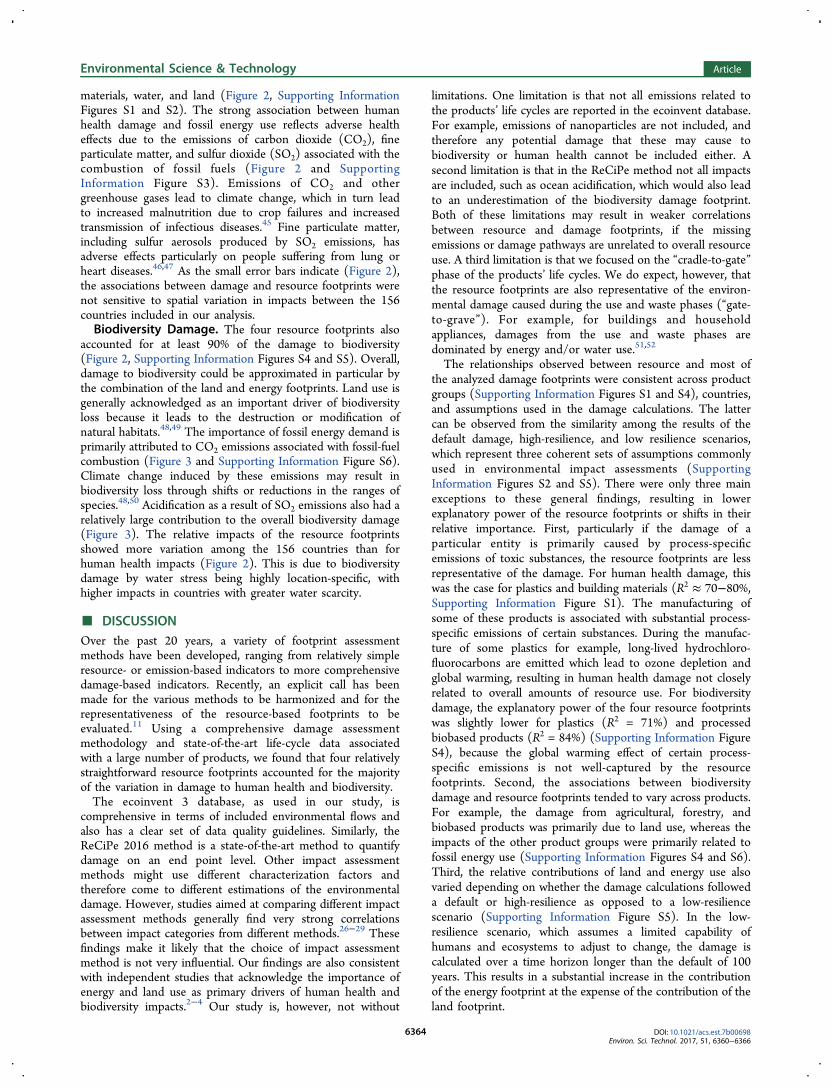
materials, water, and land (Figure 2, Supporting InformationFigures S1 and S2). The strong association between humanhealth damage and fossil energy use reflects adverse healtheffects due to the emissions of carbon dioxide (CO2), fineparticulate matter, and sulfur dioxide (SO2) associated with thecombustion of fossil fuels (Figure 2 and SupportingInformation Figure S3). Emissions of CO2 and othergreenhouse gases lead to climate change, which in turn leadto increased malnutrition due to crop failures and increasedtransmission of infectious diseases.45 Fine particulate matter,including sulfur aerosols produced by SO2 emissions, hasadverse effects particularly on people suffering from lung orheart diseases.46,47 As the small error bars indicate (Figure 2),the associations between damage and resource footprints werenot sensitive to spatial variation in impacts between the 156countries included in our analysis.Biodiversity Damage. The four resource footprints also
accounted for at least 90% of the damage to biodiversity(Figure 2, Supporting Information Figures S4 and S5). Overall,damage to biodiversity could be approximated in particular bythe combination of the land and energy footprints. Land use isgenerally acknowledged as an important driver of biodiversityloss because it leads to the destruction or modification ofnatural habitats.48,49 The importance of fossil energy demand isprimarily attributed to CO2 emissions associated with fossil-fuelcombustion (Figure 3 and Supporting Information Figure S6).Climate change induced by these emissions may result inbiodiversity loss through shifts or reductions in the ranges ofspecies.48,50 Acidification as a result of SO2 emissions also had arelatively large contribution to the overall biodiversity damage(Figure 3). The relative impacts of the resource footprintsshowed more variation among the 156 countries than forhuman health impacts (Figure 2). This is due to biodiversitydamage by water stress being highly location-specific, withhigher impacts in countries with greater water scarcity.
■ DISCUSSIONOver the past 20 years, a variety of footprint assessmentmethods have been developed, ranging from relatively simpleresource- or emission-based indicators to more comprehensivedamage-based indicators. Recently, an explicit call has beenmade for the various methods to be harmonized and for therepresentativeness of the resource-based footprints to beevaluated.11 Using a comprehensive damage assessmentmethodology and state-of-the-art life-cycle data associatedwith a large number of products, we found that four relativelystraightforward resource footprints accounted for the majorityof the variation in damage to human health and biodiversity.The ecoinvent 3 database, as used in our study, is
comprehensive in terms of included environmental flows andalso has a clear set of data quality guidelines. Similarly, theReCiPe 2016 method is a state-of-the-art method to quantifydamage on an end point level. Other impact assessmentmethods might use different characterization factors andtherefore come to different estimations of the environmentaldamage. However, studies aimed at comparing different impactassessment methods generally find very strong correlationsbetween impact categories from different methods.26−29 Thesefindings make it likely that the choice of impact assessmentmethod is not very influential. Our findings are also consistentwith independent studies that acknowledge the importance ofenergy and land use as primary drivers of human health andbiodiversity impacts.2−4 Our study is, however, not without
limitations. One limitation is that not all emissions related tothe products’ life cycles are reported in the ecoinvent database.For example, emissions of nanoparticles are not included, andtherefore any potential damage that these may cause tobiodiversity or human health cannot be included either. Asecond limitation is that in the ReCiPe method not all impactsare included, such as ocean acidification, which would also leadto an underestimation of the biodiversity damage footprint.Both of these limitations may result in weaker correlationsbetween resource and damage footprints, if the missingemissions or damage pathways are unrelated to overall resourceuse. A third limitation is that we focused on the “cradle-to-gate”phase of the products’ life cycles. We do expect, however, thatthe resource footprints are also representative of the environ-mental damage caused during the use and waste phases (“gate-to-grave”). For example, for buildings and householdappliances, damages from the use and waste phases aredominated by energy and/or water use.51,52
The relationships observed between resource and most ofthe analyzed damage footprints were consistent across productgroups (Supporting Information Figures S1 and S4), countries,and assumptions used in the damage calculations. The lattercan be observed from the similarity among the results of thedefault damage, high-resilience, and low resilience scenarios,which represent three coherent sets of assumptions commonlyused in environmental impact assessments (SupportingInformation Figures S2 and S5). There were only three mainexceptions to these general findings, resulting in lowerexplanatory power of the resource footprints or shifts in theirrelative importance. First, particularly if the damage of aparticular entity is primarily caused by process-specificemissions of toxic substances, the resource footprints are lessrepresentative of the damage. For human health damage, thiswas the case for plastics and building materials (R2 ≈ 70−80%,Supporting Information Figure S1). The manufacturing ofsome of these products is associated with substantial process-specific emissions of certain substances. During the manufac-ture of some plastics for example, long-lived hydrochloro-fluorocarbons are emitted which lead to ozone depletion andglobal warming, resulting in human health damage not closelyrelated to overall amounts of resource use. For biodiversitydamage, the explanatory power of the four resource footprintswas slightly lower for plastics (R2 = 71%) and processedbiobased products (R2 = 84%) (Supporting Information FigureS4), because the global warming effect of certain process-specific emissions is not well-captured by the resourcefootprints. Second, the associations between biodiversitydamage and resource footprints tended to vary across products.For example, the damage from agricultural, forestry, andbiobased products was primarily due to land use, whereas theimpacts of the other product groups were primarily related tofossil energy use (Supporting Information Figures S4 and S6).Third, the relative contributions of land and energy use alsovaried depending on whether the damage calculations followeda default or high-resilience as opposed to a low-resiliencescenario (Supporting Information Figure S5). In the low-resilience scenario, which assumes a limited capability ofhumans and ecosystems to adjust to change, the damage iscalculated over a time horizon longer than the default of 100years. This results in a substantial increase in the contributionof the energy footprint at the expense of the contribution of theland footprint.
Environmental Science & Technology Article
DOI: 10.1021/acs.est.7b00698Environ. Sci. Technol. 2017, 51, 6360−6366
6364
Critics of resource footprints argue that environmentalimpacts cannot be adequately captured by simple, one-dimensional indicators, whereas their advocates stress that thesimplifications involved are necessary to ensure that theindicators speak to policy makers and the general public.10,11,53
By relating two comprehensive damage indicators to fourstraightforward resource footprints, we have demonstrated thatresource footprints are representative screening indicators ofdamage to human health and biodiversity. Our analysis furtherrevealed that human health damage is primarily induced byfossil energy use, whereas biodiversity damage is primarilyrelated to both land and fossil energy use. Thus, we concludethat energy and land footprints provide valuable proxies for theoverall environmental damage produced by a particular entity.
■ ASSOCIATED CONTENT*S Supporting InformationThe Supporting Information is available free of charge on theACS Publications website at DOI: 10.1021/acs.est.7b00698.
Figure S1, associations between human health damageand four resource footprints per product group; FigureS2, associations between human health damage and fourresource footprints for two alternative sets of character-ization factors, based on high resilience and lowresilience; Figure S3, contributions to human healthdamage (per product group) of most importantcontributors; Figure S4, associations between biodiversitydamage and four resource footprints per product group;Figure S5, associations between biodiversity damage andfour resource footprints for two alternative sets ofcharacterization factors, based on high resilience and lowresilience; Figure S6, contributions biodiversity damage(per product group) of most important contributors;Figure S7, residuals of the regression models for humanhealth damage for all the products and per productcategory; Figure S8, residuals of the regression modelsfor biodiversity damage for all the products and perproduct category; Table S1, included impact categories inReCiPe, covered areas of protection, and damagepathways; Table S2, goodness of fit and coefficients oflog−linear regression models (PDF)Data file S1, list of included products; data file S2, list ofincluded countries and regions (XLSX)
■ AUTHOR INFORMATIONCorresponding Author*Phone: +31 24 365 2393. E-mail: [email protected].
ORCIDZoran J. N. Steinmann: 0000-0001-8606-917XPresent Addresses∥PBL Netherlands Environmental Assessment Agency, Bezui-denhoutseweg 30, 2594 AC, The Hague.⊥TNO Netherlands Institute for Applied Scientific Research,Princetonlaan 6, 3584 CB Utrecht, The Netherlands.
NotesThe authors declare no competing financial interest.
■ ACKNOWLEDGMENTSWe thank the European Commission for supporting thisresearch project (Desire project, number 308552).
■ REFERENCES(1) Smeets, E.; Wetering, R. Environmental Indicators:Typology andOverview; Technical report No 25/1999; European EnvironmentalAgency, 1999; https://www.eea.europa.eu/ds_resolveuid/ZATOEJRPDX (accessed May 23, 2017).(2) Ecosystems and Human Well-being: Synthesis; MillenniumEcosystem Assessment, Island Press: Washington, DC, 2005.(3) Global Biodiversity Outlook 4; Secretariat of the Convention onBiological Diversity: Montreal, Canada, 2014.(4) GBD 2013 Risk Factors Collaborators. GBD 2013 Risk FactorsCollaborators Global, regional, and national comparative risk assess-ment of 79 behavioural, environmental and occupational, andmetabolic risks or clusters of risks in 188 countries, 1990−2013: asystematic analysis for the Global Burden of Disease Study 2013.Lancet 2015, 386, 2287−2323.(5) Hellweg, S.; Mila i Canals, L. Emerging approaches, challengesand opportunities in life cycle assessment. Science 2014, 344 (6188),1109−1113.(6) Hauschild, M. Z. Assessing environmental impacts in a life-cycleperspective. Environ. Sci. Technol. 2005, 39 (4), 81A−88A.(7) Bjørn, A.; Diamond, M.; Birkved, M.; Hauschild, M. Z. ChemicalFootprint Method for Improved Communication of FreshwaterEcotoxicity Impacts in the Context of Ecological Limits. Environ. Sci.Technol. 2014, 48, 13253−13262.(8) Nordborg, M.; Arvidsson, R.; Finnveden, G.; Cederberg, C.;Sorme, L.; Palm, V.; Stamyr, K.; Molander, S. Updated indicators ofSwedish national human toxicity and ecotoxicity footprints usingUSEtox 2.01. Environ. Impact Assess. Rev. 2017, 62, 110−114.(9) Tukker, A.; Bulavskaya, T.; Giljum, S.; de Koning, A.; Lutter, S.;Simas, M.; Stadler, K.; Wood, R. Environmental and resourcefootprints in a global context: Europe’s structural deficit in resourceendowments. Glob Environ. Change 2016, 40, 171−181.(10) Giljum, S.; Burger, E.; Hinterberger, F.; Lutter, S.; Bruckner, M.A comprehensive set of resource use indicators from the micro to themacro level. Resour Conserv Recycl 2011, 55 (3), 300−308.(11) Hoekstra, A. Y.; Wiedmann, T. O. Humanity’s unsustainableenvironmental footprint. Science 2014, 344 (6188), 1114−1117.(12) Bruckner, M.; Giljum, S.; Lutz, C.; Wiebe, K. S. Materialsembodied in international trade - global material extraction andconsumption between 1995 and 2005. Glob Environ. Change 2012, 22(3), 568−576.(13) Feng, K.; Chapagain, A.; Suh, S.; Pfister, S.; Hubacek, K.Comparison of bottom-up and top-down approaches to calculating thewater footprints of nations. Econ Syst. Res. 2011, 23 (4), 371−385.(14) Giljum, S.; Bruckner, M.; Martinez, A. Material footprintassessment in a global input-output framework. J. Ind. Ecol. 2015, 19(5), 792−804.(15) Hoekstra, A. Y.; Mekonnen, M. M. The water footprint ofhumanity. Proc. Natl. Acad. Sci. U. S. A. 2012, 109 (9), 3232−3237.(16) Wiedmann, T. O.; Schandl, H.; Lenzen, M.; Moran, D.; Suh, S.;West, J.; Kanemoto, K. The material footprint of nations. Proc. Natl.Acad. Sci. U. S. A. 2015, 112 (20), 6271−6276.(17) Weinzettel, J.; Hertwich, E. G.; Peters, G. P.; Steen-Olsen, K.;Galli, A. Affluence drives the global displacement of land use. GlobEnviron. Change 2013, 23 (2), 433−438.(18) Yu, Y.; Feng, K.; Hubacek, K. Tele-connecting localconsumption to global land use. Glob Environ. Change 2013, 23 (5),1178−1186.(19) Arvidsson, R.; Svanstrom, M. A framework for energy useindicators and their reporting in life cycle assessment. Integr. Environ.Assess. Manage. 2016, 12, 429−436.(20) Galli, A.; Wiedmann, T.; Ercin, E.; Knoblauch, D.; Ewing, B.;Giljum, S. Integrating ecological; carbon and water footprint into a″footprint family″ of indicators: definition and role in tracking humanpressure on the planet. Ecol. Indic. 2012, 16, 100−112.(21) Fiala, N. Measuring sustainability: why the ecological footprintis bad economics and bad environmental science. Ecol Econ 2008, 67(4), 519−525.
Environmental Science & Technology Article
DOI: 10.1021/acs.est.7b00698Environ. Sci. Technol. 2017, 51, 6360−6366
6365
(22) Huijbregts, M. A. J.; Hellweg, S.; Frischknecht, R.; Hendriks, H.W.; Hungerbuhler, K.; Hendriks, A. J. Cumulative energy demand aspredictor for the environmental burden of commodity production.Environ. Sci. Technol. 2010, 44 (6), 2189−2196.(23) Laurent, A.; Olsen, S. I.; Hauschild, M. Z. Limitations of carbonfootprint as indicator of environmental sustainability. Environ. Sci.Technol. 2012, 46 (7), 4100−4108.(24) van der Voet, E.; van Oers, L.; Nikolic, I. Dematerialisation: notjust a matter of weight. J. Ind. Ecol 2005, 8 (4), 121−137.(25) Fang, K.; Heijungs, R.; de Snoo, G. R. Theoretical explorationfor the combination of the ecological; energy; carbon; and waterfootprints: overview of a footprint family. Ecol. Indic. 2014, 36, 508−518.(26) Roos, E.; Sundberg, C.; Tidaker, P.; Strid, I.; Hansson, P. A. Cancarbon footprint serve as an indicator of the environmental impact ofmeat production? Ecol. Indic. 2013, 24, 573−581.(27) Berger, M.; Finkbeiner, M. Correlation analysis of life cycleimpact assessment indicators measuring resource use. Int. J. Life CycleAssess. 2011, 16 (1), 74−81.(28) Lasvaux, S.; Achim, F.; Garat, P.; Peuportier, B.; Chevalier, J.;Habert, G. Correlations in Life Cycle Impact Assessment methods(LCIA) and indicators for construction materials: What matters? Ecol.Indic. 2016, 67, 174−182.(29) Steinmann, Z. J. N.; Schipper, A. M.; Hauck, M.; Huijbregts, M.A. J. How many environmental impact indicators are needed in theevaluation of product life cycles? Environ. Sci. Technol. 2016, 50 (7),3913−3919.(30) Kalbar, P. P.; Birkved, M.; Karmakar, S.; Nygaard, S. E.;Hauschild, M. Can carbon footprint serve as proxy of theenvironmental burden from urban consumption patterns? Ecol. Indic.2017, 74, 109−118.(31) Moreno Ruiz, E.; Weidema, B. P.; Bauer, C.; Nemecek, T.;Vadenbo, C. O.; Treyer, K.; Wernet, G. Documentation of changesimplemented in ecoinvent data 3.0; Ecoinvent Report 5; 2013; 3.(32) Huijbregts, M. A. J.; Steinmann, Z. J. N.; Elshout, P. M. F.;Stam, G.; Verones, F.; Vieira, M. D. M.; Hollander, A.; Zijp, M.; vanZelm, R. ReCiPe 2016: A harmonized life cycle impact assessmentmethod at midpoint and endpoint level. Report 1: Characterization;2016. http://www.ru.nl/environmentalscience/research/themes-0/life-cycle/projects/ (accessed September 27, 2016).(33) Goedkoop, M. J.; Heijungs, R.; Huijbregts, M.; De Schryver, A.;Struijs, J.; Van Zelm, R. ReCIPe 2008: A Life Cycle ImpactAssessment Method which Comprises Harmonised Category In-dicators at the Midpoint and the Endpoint Level. Report 1:Characterisation; 2009. http://www.lcia-recipe.net (accessed Septem-ber 27, 2016).(34) Hauschild, M. Z.; Huijbregts, M. A. J. Life cycle impactassessment; Springer: Dordrecht, The Netherlands, 2015; DOI:10.1007/978-94-017-9744-3.(35) Field, A. Discovering Statistics Using SPSS, 3rd ed.; SAGEPublications Ltd.: London, 2009.(36) Zuur, A. F.; Ieno, E. N.; Walker, N. J.; Saveliev, A. A.; Smith, G.M. Mixed Effect Models and Extensions in Ecology with R; SpringerVerlag: New York, 2009; DOI: 10.1007/978-0-387-87458-6.(37) Akaike, H. A new look at the statistical model identification.IEEE Trans. Autom. Control 1974, 19 (6), 716−723.(38) Cook, R. D.; Weisberg, S. Residuals and Influence in Regression;Chapman & Hall: New York, 1982.(39) R Core Team R: A Language and Environment for StatisticalComputing; R Foundation for Statistical Computing: Vienna, Austria,2012. http://www.R-project.org/ (accessed September 27, 2016).(40) Urbanek, S.; Horner, J. Cairo: R Graphics Device Using CairoGraphics Library For Creating High-Quality Bitmap (PNG; JPEG;TIFF); Vector (PDF; SVG; Postscript) and Display (X11 and Win32)Output; R package version 1.5-5; 2012. http://CRAN.R-project.org/package=Cairo (accessed September 27, 2016).(41) Heiberger, R. M. HH: Statistical Analysis and Data Display:Heiberger and Holland; R package version 2.3-42; 2013. http://CRAN.R-project.org/package=HH (accessed September 27, 2016).
(42) De Schryver, A. M.; van Zelm, R.; Humbert, S.; Pfister, S.;McKone, T. E.; Huijbregts, M. A. J. Value choices in life cycle impactassessment of stressors causing human health damage. J. Ind. Ecol.2011, 15 (5), 796−815.(43) Thompson, M.; Ellis, R.; Wildavsky, A. Cultural Theory;Westview Press: Boulder, CO, 1990.(44) Hofstetter, P.; Baumgartner, T.; Scholz, R. W. Modelling thevaluesphere and the ecosphere: integrating the decision makers’perspectives into LCA. Int. J. Life Cycle Assess. 2000, 5 (3), 161−175.(45) Watts, N.; et al. Health and climate change: policy responses toprotect human health. Lancet 2015, 386, 1861−1914.(46) Lelieveld, J.; Evans, J. S.; Fnais, M.; Giannadaki, D.; Pozzer, A.The contribution of outdoor air pollution sources to prematuremortality on a global scale. Nature 2015, 525, 367−371.(47) Brauer, M.; et al. Ambient air pollution exposure estimation forthe global burden of disease 2013. Environ. Sci. Technol. 2016, 50 (1),79−88.(48) Alkemade, R.; van Oorschot, M.; Miles, L.; Nellemann, C.;Bakkenes, M.; ten Brink, B. GLOBIO3: A framework to investigateoptions for reducing global terrestrial biodiversity loss. Ecosystems2009, 12 (3), 374−390.(49) Newbold, T.; et al. Global effects of land use on local terrestrialbiodiversity. Nature 2015, 520, 45−50.(50) Urban, M. C. Accelerating extinction risk from climate change.Science 2015, 348 (6234), 571−573.(51) Blengini, G. A.; Di Carlo, T. The changing role of life cyclephases; subsystems and materials in the LCA of low energy buildings.Energy Build 2010, 42 (6), 869−880.(52) Analysis of the Life Cycle Impacts and Potential for AvoidedImpacts Associated with Single Family Homes; EPA Publication 530-R-13-004; U.S. Environmental Protection Agency: 2013.(53) Lifset, R. Frontiers in footprinting. J. Ind. Ecol. 2014, 18 (1), 1−3.
Environmental Science & Technology Article
DOI: 10.1021/acs.est.7b00698Environ. Sci. Technol. 2017, 51, 6360−6366
6366