Embed Size (px)
Citation preview

ENVIRONMENTAL CORPORATION
R A M C O N BUILDING. 223 SCOTT STREET, MEMPHIS, TENNESSEE 38112 TELEPHONE 800/45&4567 IN TENNESSEE 901/4!58-7000 FAX 9016583868
ENVIRONMENTAL CORPORATION
SOURCE SAMPLING for
PARTICULATE EMISSIONS AP.A.C. - NORTH CAROUNA
BURUNGTON, NORTH CAROUNA April 10, 11 & 12, 1991
Pete Galloway A.P.A.C. - North Carolina
5-6 G. Sumner Buck, ill President
Billy Lock& Team Leader
RAMCON BUILDING, 223 SCOTT STREET, MEMPHIS. TENNESSEE 38112 TELEPHONE 800/458-4567 IN TENNESSEE 901/458-7000 FAX 901-45&3868
RECEIVED N.C. 5est. Q < X D
ENVIRONMENTAL CORPORATION
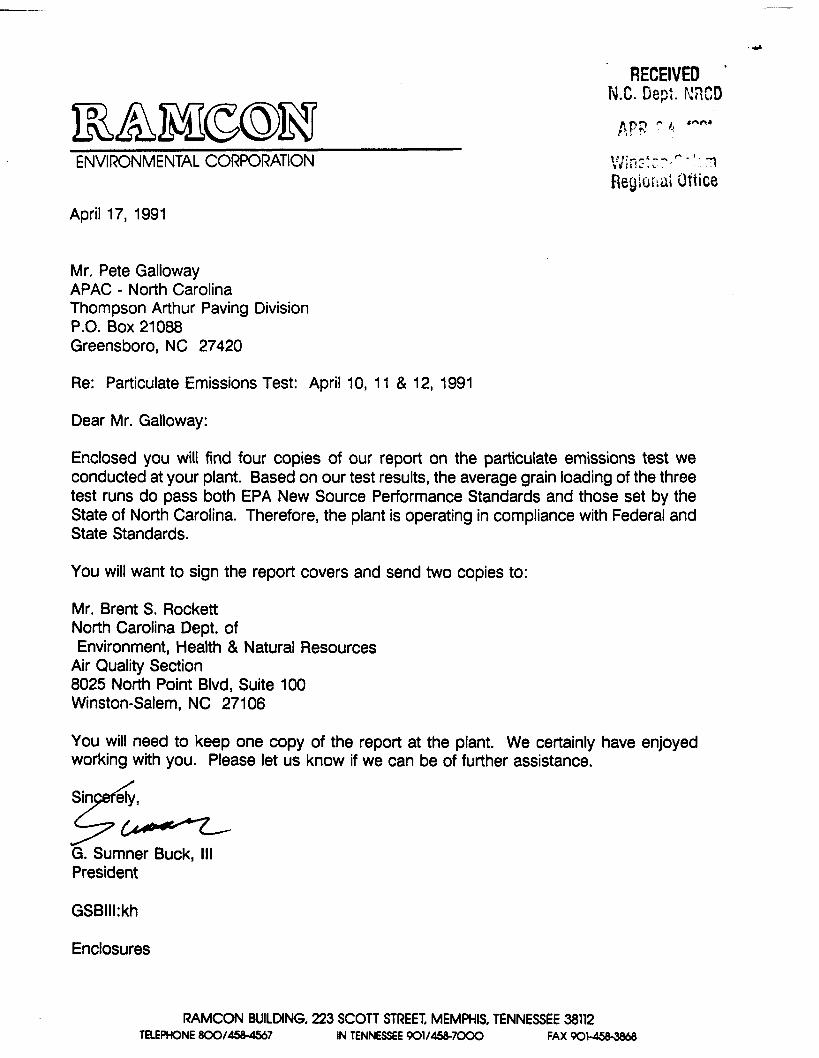
April 17, 1991
Mr. Pete Galloway APAC - North Carolina Thompson Arthur Paving Division P.O. Box 21088 Greensboro, NC 27420
Re: Particulate Emissions Test: April 10, 1 1 & 12, 1991
Dear Mr. Galloway:
Enclosed you will find four copies of our report on the particulate emissions test we conducted at your plant. Based on our test results, the average grain loading of the three test runs do pass both EPA New Source Performance Standards and those set by the State of North Carolina. Therefore, the plant is operating in compliance with Federal and State Standards.
You will want to sign the report covers and send two copies to:
Mr. Brent S. Rockett North Carolina Dept. of Environment, Health & Natural Resources
Air Quality Section 8025 North Point Blvd, Suite 100 Winston-Salem, NC 271 06
You will need to keep one copy of the report at the plant. We certainly have enjoyed working with you. Please let us know if we can be of further assistance.
- G. Sumner Buck, Ill President
Enclosures
RAMCON BUILDING, 223 SCOTT STREET, MEMPHIS, TENNESSEE 38112 TELEPHONE 800/&84%7 IN TENNESSEE 901/458-7000 FAX 001-p58.3868

TABLE OF CONTENTS
. . . . . . . . . . . . . . . . . . . . . . . . INTRODUCTION 1
. . . . . . . . . . . . . . . . . . . . . . . . . TESTRESULTS 1
. . . . . . . . . . . . . . . . . . . . . TEST PROCEDURES 2
THE SOURCE . . . . . . . . . . . . . . . . . . . . . . . . . . 4
EQUIPMENT USED . . . . . . . . . . . . . . . . . . . . . . 9
LABORATORY PROCEDURES & RESULTS . . . . . 10
CALCULATIONS . . . . . . . . . . . . . . . . . . . . . . . . 17
. . . . . . . . . . . . . . . . . . . . . . . . . . . FIELD DATA 29
CALIBRATIONS . . . . . . . . . . . . . . . . . . . . . . . . . 37
RAMCON PERSONNEL . . . . . . . . . . . . . . . . . . . 44

I. INTRODUCTION
On April 10, 1 1 & 12, 1991 personnel from RAMCON Environmental Corporation
conducted a sourc u ~ a ~ i o n s compliance at APAC-
North Carolina's AS^ drum mix asphalt plant loc ted in Burlington, North a Carolina. RAMCON Billy Lockett, Team
Leader, and Ray for the laboratory
analysis including taring the beakers and filters and recording final data in the
laboratory record books. Custody of the samples was limited to Mr. Lockett and
Ms. Baldick.
The purpose of the test was to determine if the rate of particulate emissions from
this plant's baghouse is below or equal to the allowable N.S.P.S. emissions limit
set by US EPA and the State of North Carolina.
II. TEST RESULTS
Table I summarizes the test results. The grain loading limitation for EPA is .04
gr/dscf as specified in 39 FR 931 4, March 8, 1974,60.92 Standards for Particulate
Matter (I), as amended. The allowable emissions for the State of North Carolina
are the same as those set by EPA.
Mr. Brent Rockett of North Carolina' Department Environment, Health and Natural
Resources observed the testing conducted by RAMCON Environmental.

TABLE I SUMMARY OF TEST RESULTS
April 10, 11 & 12, 1991
Test Grain Actual Run - Time Loading Emissions
1 1940 to 20:52 0.0269 gr/DSCF 5.0 Ibs/hr
2 20:40 to 21 :44 0.01 78 gr/DSCF 103.0% 3.4 Ibs/hr
3 00:04 to 01 :44 0.01 12 gr/DSCF 102.8% \
2.1 Ibs/hr
Average: 0.01 86 gr/DSCF 3.5 Ibs/hr
On the basis of these test results, the average grain loading of the three test
runs was below the .04 gr/DSCF allowable emissions limitation set by EPA and
the State of North Carolina. Therefore, the plant is operating in compliance
with State and Federal Standards.
Ill. TEST PROCEDURES
A. Method Used: Method 5 source sampling was conducted in
accordance with requirements of the U.S. Environmental Protection Agency as
set forth in 39 FR 9314, March 8, 1974, 60.93, as amended.
B. Problems Encountered: Test run #2 was voided and repeated when
the post-test leak check determined a leak rate of 0.135 m3/min. The testing
resumed after the detected leak was fixed. Therefore, runs 1, 3 & 4 are
submitted for demonstration of compliance with N.S.P.S. standards.

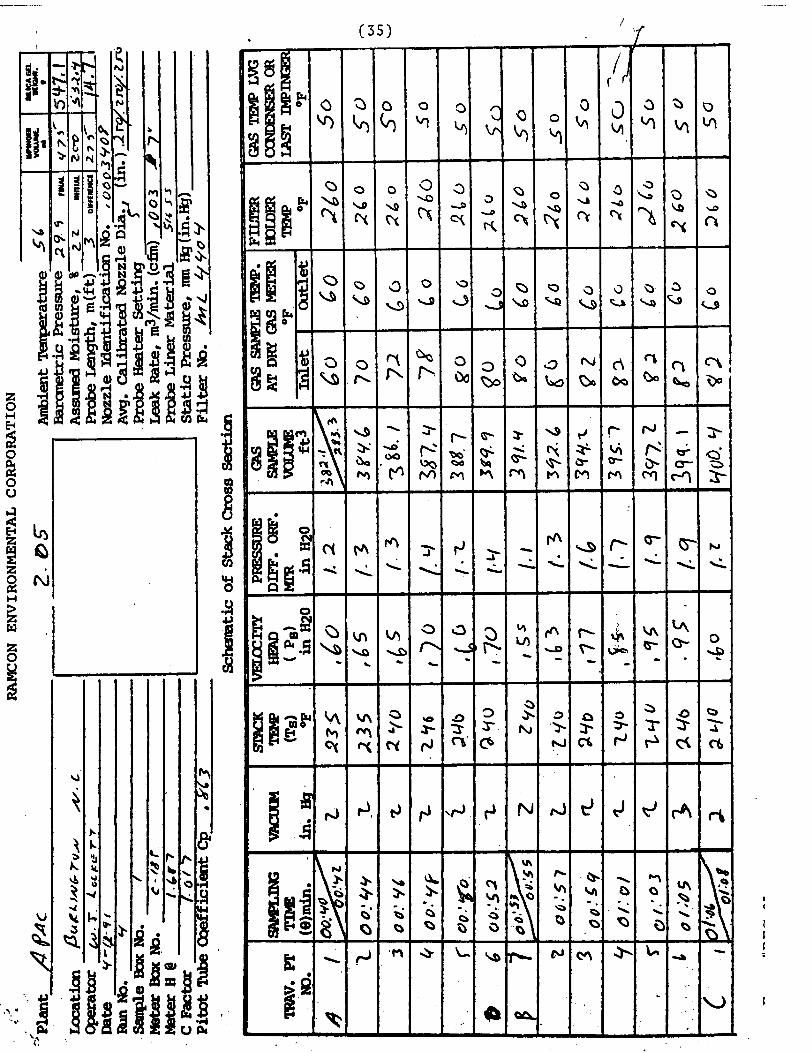
( 3 ) C. Sampling Site: The emissions test was conducted after a baghouse on a
rectangular stack measuring 30.0" x 45.0" with an equivalent diameter of 36.0'.
Five sampling ports were placed 23.5" down (0.7 diameters upstream) from the
top of the stack and 301" up (8.4 diameters downstream) from the last flow
disturbance. The ports were evenly spaced on 9.0" centers. The two outside
ports are 4.5' from the side walls of the stack. Thirty points were sampled, six
through each por: for two minutes each.
Points on a Probe
Diameter - Mark
*Measurements include a 8 standoff.

N. THE SOURCE

IV. THE SOURCE
APAC - North Carolin ix asphalt plant which is
used to manufacture recess consists of
blending prescribed po ravel, screenings,
chips, etc.) uniformly and addi o bind the mixture
together. After the hot asphalt mix is manufactured at the plant, it is transported
to the location where it is to be applied. The hot asphalt mix is spread evenly over
the surface with a paver then compacted with a heavy roller to produce the final
product.
The following to a general description of the plant's manufacturing process: The
cold feed materials (aggregate) are dumped into four separate bins which in turn
feed a common continuous conveyor. The aggregate is dispensed from the bins
in accordance with the desired formulation onto the cold feed system conveyor,
to an inclined weigh conveyor, then to a rotating drum for continuous mixing and
drying at temperature ranging from 300'~ to 1600'~. The hot and dried aggregate
moves to an outer shell around the rotating drum where the required amount of
hot asphalt oil is then injected onto and mixed into the dried aggregate. The now
newly formed hot asphalt mix is pulled to the top of a storage silo by a conveyor.
The hot asphalt mix is then discharged from the storage silo through a slide gate
into waiting dump trucks which transports the material to a final destination for
spreading. The rated capacity of the plant will vary with each aggregate mix and
moisture content with a 5% surface moisture removal.
The drum mixer uses a burner fired with natural gas to heat air to dry the
aggregate, and the motion of the rotating drum to blend the aggregate. The air
is drawn into the system via an exhaust fan. After passing through the gas burner
and the mixing drum, the air passes through a baghouse. The baghouse is
manufactured by Astec. The exhaust gasses are drawn through the baghouse and
discharged to the atmosphere through the stack. The design pressure drop
across the tube sheet is 2-6 inches of water. The particulate matter, which is
removed by the baghouse, is reinjected into the drum mixer.
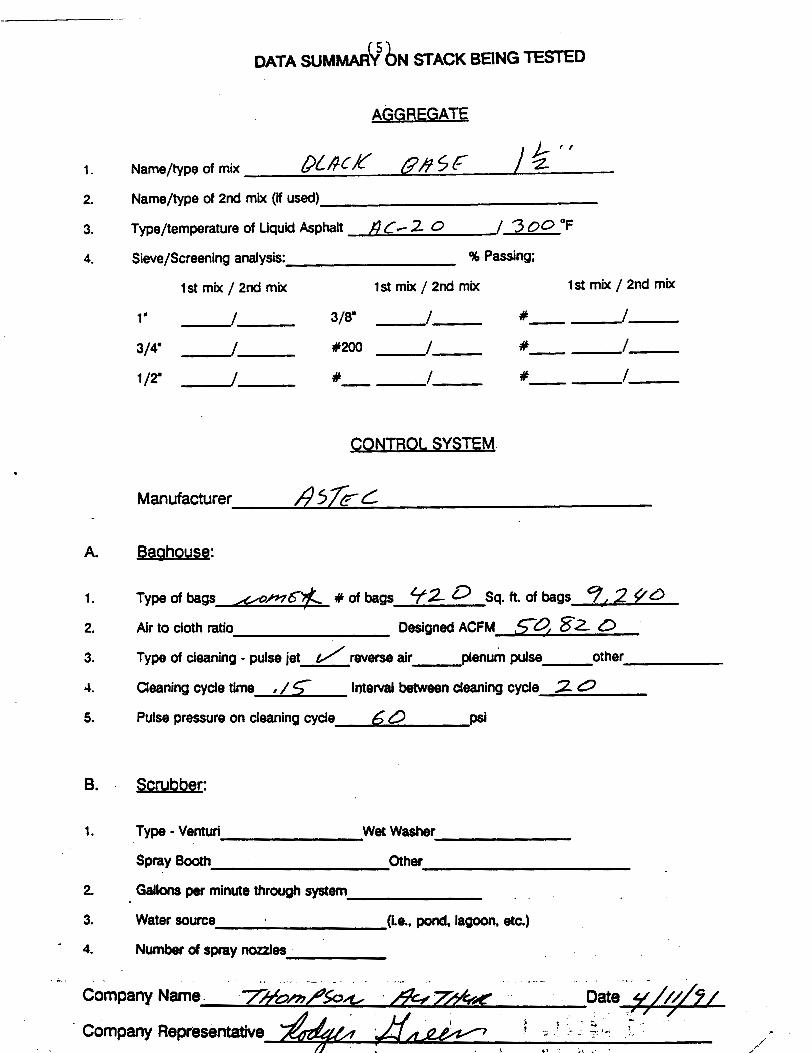
AGGREGATE
2. Name/type of 2nd mix (if used)
3. Type/temperature of Liquid Asphalt A C- 2 0 / 3 0 0 ° F
4. Sieve/Screening analysis: % Passing;
1st mix/ 2nd mix 1st mix/2nd mix 1 st mix / 2nd mix
CONTROL SYSTEM.
Manufactur er 4572-d
1. Type of bags -mb* # of bags 92 Sq. ft. of bags 9,2 2. Air to cloth ratio Designed ACFM 50, 0
3. Type of cleaning - pulse jet / reverse air plenum pulse other
4. Cleaning cyde time , / < Interval between deaning cycle % 0
5. Pulse pressure on cleaning cycle 6 ~ 9 psi
1. Type - Venturi Wet Washer
Spray Booth Other
2. Gallons per minute through system
3. water source (i.e., pond, lagoon. etc.1
4. Number of spray nozzles
--* - ..- - .. -
Company Name. 7Hom/%& . 7&~ Date ' ,</y/~/ - * : ; . _ L t , " Company Representative ,'
I . i 2 , - * ; \ 1,'


(8) Aggregate bins: Virgin aggregate is fed individually into each of four bins by type. It is metered onto a conveyor belt running under the bins to a shaker screen. The proportion to each aggregate type is determined by the job mix formula and pre-set to be metered out to meet these specifications.
Preliminary oversize screen: The aggregate is fed through a shaker screen where oversize rocks and foreign material is screened out of the mix.
Weigh conveyor belt: The aggregate is conveyed to the rotary drum dryer on a conveyor belt which weighs the material. The production rate is determined by this weight reading.
Rotary drumjdryer mixer: The aggregate is fed into the rotary drum dryer where it is tumbled by flighting into a veil in front of a flame which drives off the moisture. Further mixing is also accomplished in an outer shell of this drum. Hot liquid asphalt is injected in the outer shell of the drum where it is mixed with the aggregate.
Burner: The fuel fired burner is used to provide the flame which drys the aggregate.
Knock off baffling: A baffling plate is inserted in the 'dirty" side plenum as a knock out for heavy particles in the air stream. These particles fall to the bottom of the baghouse.
Baghouse: The hot gases are pulled through the bags into the clean air plenum. The solid particulate matter is trapped on the dust coat buildup on the bags. A bag cleaning cycle consisting of jet burst of air from the inside (or clean air side) of the bags sends a large bubble of air down the inside of the bags shaking loose buildup on the bag surface. This particulate matter is collected at the bottom of the baghouse and reinjected into the drum mixer where it is used as part of the finished product.
Liquid asphalt storage: The liquid asphalt is stored in this heated tank until it is needed in the mixer. The amount of asphalt content and its temperature are pre-set for each different type job.
Conveyor to surge/storage bin: The finished product of aggregate mixed with liquid asphalt is conveyed to a surge bin.
Surge/Storage bin: The asphaltic cement is dumped into this surge bin and metered out to dump trucks which pull underneath a slide gate at the bottom of the bin.
Control/operators house: The entire plant operation is controlled from this operator's house.
Truck loading scale: As the trucks receive the asphalt from the storage/surge bin, they are weighed on the lading scale which tells the plant operator the amount of asphalt that is being trucked on each individual load.
Fuel storage.
Stack
V. EQUIPMENT USED

EQUIPMENT USED
Equipment used on conducting t h e part iculate emissions t e s t
was:
A. The Lear Siegler PM-100 s tack sampler with appropriate
auxillary equipment and glassware. The train was set up
according t o t h e schemat ic on t h e nex page.
An Airguide Instruments Model 2 11-B (uncorrected) aneroid
barometer was used t o check t h e barometr ic pressure.
C. Weston dial the rmomete rs a r e used t o check mete r t e m -
peratures. An Analogic Model 2572 Digital Thermocouple is
used for s tack temperatures.
D. A Hays 621 Analyzer was used t o measure t h e oxygen, carbon
dioxide and carbon monoxide con ten t of t h e s t ack gases. For
non-combustion sources, A Bacharach Instrument Company
Fyr i te i s used for t h e g a s analysis.
E. ~ i l t e r s a r e mady by Schleicher and Schuell and a r e type 1-HV
with a porosity of .03 microns.
F. The acetone is reagent g rade o r ACS grade with a residue o f
L .001. -
Form #REC-07

VI. LABORATORY PROCEDURES & RESULTS
(10)
LABORATORY PROCEDURES FOR PARTICULATE SAMPUNG
1. Field Preparation
A. FILTERS: Fiberglass 4' sampling filters are prepared as follows:
Filters are removed from their box and numbered on the back side with a felt pen. The numbering system is continuous from job to job. The filters are placed in a desiccator to dry for at least 24 hours. Clean plastic petri dishes, also numbered, top and bottom, are placed in the desiccator with the filters. After desiccation, the filters are removed, one at a time, and weighed on the Sartorius analytical balance then placed in the correspondingly numbered petri dish. Weights are then recorded in the lab record books. Three filters are used for each complete particulate source emissions test and there should be several extra filters included as spares.
B. SILICA GEL: Silica Gel used for the test is prepared as follows:
Approximately 200 g of silica gel is placed in a wide mouth "Mason" type jar and dried in an oven at 17S°C for two hours. The open jars are removed and placed in a desiccator until cool for two hours and then tightly sealed. The jars are then numbered and weighed on the triple beam balance to the closest tenth of a gram. This weight is recorded for each sealed jar. The number of silica gel jars used is the same as the number of filters. Silica gel should be indicating type, 6-16 mesh.
II. Post - Testing Lab Analysis
A. FILTERS: The filters are returned to the lab in their sealed petri dishes. In the lab, the dishes are opened and placed into a desiccator for at least 24
hours. Then the filters are weighed continuously every six hours until a constant weight is achieved. All data is recorded on the laboratory forms that will be bound in the test report.
8. SILICA GEL: The silica gel used in the stack test is returned to the appropriate mason jar and sealed for transport to the laboratory where it is reweighed to a constant weight on a triple beam balance to the nearest tenth of a gram.
C. PROBE RINSINGS: In all tests where a probe washout analysis is
necessary, this is accomplished in accordance with procedures specified in "EPA Reference Method 5". These samples are returned to the lab in
sealed mason jars for analysis. The front half of the filter holder is washed in accordance with the same procedures and included with the probe wash. Reagent or ACS grade acetone is used as the solvent. The backhalf of the filter holder is washed with deionized water into the impinger catch for appropriate analysis.
D. IMPINGER CATCH: In some testing cases, the liquid collected in the impingers must be analyzed for solid content. This involves a similar
procedure to the probe wash solids determination, except that the liquid is deionized water.
E. ACFTONE: A blank analysis of acetone is conducted from the one gallon glass container used in the field preparation. This acetone was used in the field for rinsing the probe, nozzle, and top half of the filter holder. A blank analysis is performed prior to testing on all new containers of acetone received from the manufacturer to insure that the quality of the acetone used will be exceed the .001% residual purity standard.
SPECIAL NOTE
When sampling sources high in moisture content, (such as asphalt plants) the filter paper sometimes sticks to the filter holder. When removing the fitter, it may tear. In order to maintain control of any small pieces of fiiter paper which may be easily lost, they are washed with acetone into the probe washing. This makes the filter weight light (sometimes negative) and the probe wash correspondingly heavier. this laboratory procedure is taught by EPA in the "Quality Assurance for Source Emissions Workshopm at Research Triangle Park and is approved by EPA.

WEIGHING PROCEDURE - SARTORIUS ANALYnCAL BALANCE
The Sartorius balance is accurate to 0.1 mg and has a maximum capacity of 200 grams. The balance precision (standard deviation) is 0.05 mg. Before weighing an item, the balance should first be zeroed. This step should be taken before every series of weighings. To do this, the balance should have all weight adjustments at the "zero' position. The beam arrest lever (on the lower left hand side toward the rear of the balance) is then slowly pressed downward to the full release position. The lighted vernier scale on the front of the cabinet should align with the "zero" with the mark on the cabinet. If it is not so aligned, the adjustment knob on the right hand side (near the rear of the cabinet) should be turned carefully until the marks align. Now return the beam arrest to the horizontal arrest position. The balance is now "zeroed".
To weigh an item, it is first placed on the pan. And the sliding doors are closed to avoid air current disturbance. The weight adjustment knob on the right hand side must be at "zero". The beam arrest is then slowly turned upward. The lighted scale at the front of the cabinet will now indicate the weight of the item in grams. If the scale goes past the divided area, the item then exceeds 100 g weight (about 3 112 ounces) and it is necessary to arrest the balance (beam arrest lever) and move the lever for 100 g weight away from you. It is located on the left hand side of the cabinet near the front, and is the knob closest to the side of the cabinet. The balance will not weigh items greater than 200 grams in mass, and trying to do this might harm the balance. Remember, this is a delicate precision instrument.
After the beam is arrested in either weight range, the procedure is the same. When the weight of the item in grams is found, "dial in" that amount with the two knobs on the left hand side (near the 100 g lever) color coded yellow and green. As you dial the weight, the digits will appear on the front of the cabinet. When the proper amount is dialed, carefully move the arrest lever down with a slow, steady turn of the wrist. The lighted dial will appear, and the right hand side knob (front of cabinet) is turned to align the mark with the lower of the two lighted scale divisions which the mark appears between. when these marks are aligned, the two lighted digits along with the two indicated on the right hand window on the cabinet front are fractional weight in grams (the decimal would appear before the lighted digits) and the whole number of grams weight is the amount "dialed in" on the left.
in general, be sure that the beam is in "arrest" position before placing weight on or taking weight off of the pan. Don't "dial in" weight unless the beam is arrested. The balance is sensitive to even a hand on the table near the balance, so be careful and painstaking in every movement while weighing.
,4 FA c- - D k 1 2 c ~ d c 7 d ~ /t/C Company Name
RUN 1:
9 - f f l - q / Date
REFERENCE XETHOD 3: GAS ANA&YSIS BY PYRITE
FUEL
WOOD BARK ANTHRACITE BITUMINOUS LIGNITE OIL GAS PROPANE BUTANE
ot* = / . 20.9 - [F, X Cot*] /
RUN #2:
RUN #I:
RUN #3
'Z 2 AVG . 'L =02%
1 CO, a, t
02% 02% 02% AVG. 17.4 N2% N2% N2% AVG . 80. b
RUN 2: co2% 2 'L COn Z AVG . Z
-2%
02% 02% 02% AVO. /7,4 d&d . N2% N2% N2% AVG. , . ' 5: so. 1,
RUN -
AVG 17.3 s
. '*O.'b >: -. AVG.

c -BUR L , ~ 6 7d & #. Company Name
- / / - v / Date
REFERENCE I4E-D 3s GAS ~ y B I 8 BY PYRITE
WOOD BARK ANTHRACITE BITUMINOUS LIGNITE OIL GAS PROPANE
. BUTANE
RUN #2:
RUN #3 - I 20.9-[ X,-, 1
7 2 AVG . z coa a,
Po"/ Y O a .O2% O, AVG . 17. J . . N a Nzx Nzx A 8o.b
RUN 2: . - doa % *a AVG . O a - 02% AVG . _ . ---. ^ <.̂ 0.1 ..
* .
Nzx AVG, . . - Nzx Nzx - . !,
_. _..- _". ._ _. _ -..-_. .-,_ .. -..- . ..- . .. - ~.- ).. ..--. --- - . . -. a .., --- * - . . ,-.. --. .-... - . ,-.-..". . . I . . .I . $ . . - . _ , - - .. . . A .
RUN 3: cozx . co, c . . - . AVG.' ... ' . ,
-. ' Li.9. . , .
. .. .I* 02% , ;. 3 2 % 02% AVG . . , I ! . . ' I r _ I 1
i N n N2x i . N2% * , * . a AVG, ' . . n
i i f \ s 1 - , , , - , : " . - . ." . ----.-.-' '
* ,.

Form REC#8 (1 5 SAWLE ANALYTICAL DATA FORM
plant ~ocation APAC Relative humidity i n lab 9 %
Sample Location Density of Acetone (pa) .78Y_) m g / d
Blarlk V O ~ U W (Va) 3do m l
Date/Time w t . blankv-!&-?I 3;C10 ~ r o s s w t . 156 7 7 9Y m 9
Date/Time w t . blank ?-17-91 Z; lf Gross w t . /(g .'779r mq ~ o e . ~ r o s s w t . 1.5-6,779/ m g
Tare w t . K&. 7786 m q
Weight of blank (MI 0,0009 mg
Acetone blank residue concentration (Ca) (Ca) = / (Val (pa) = ( LJf - ingig)
Neight of residue in acetone m ~ h : Wa = Ca V a d a = ( 1 ( 1 ( = ( . / J o f l -
wn I j ~ u n 1 2 I ~ u n # j i ml I Acetone rinse volume (Vaw)
DateITime of
Date/Time of
Average Gross w t Tare w t g 3 . a173.1373 i173.37f'
Filter Numbers
Date/Time of w t Lf -1 ( , i ) / 3 ; 0 0 Gross w t Date/Ti~ne of wtv-17-ql 12 ;3f Gross w t
Average Gross w t Tare w t
Less acetone blank w t (Wa)
Weight of particulate on f i l t e r s ( s ) (mf) g 'G,oWY O f O I Y Y ibt019Y i Weight of particulate i n acetone rinse g (1637: 0,041d 'o8037d ,
b 0 8 ~ ~ / 1 :o,ool~ 1 ~ ~ o o ~ r
Total weight of particulate (5) 4
~t of particulate i n acetone rinse (ma) g 0,0617 10tOY/6 I 0 t037d:
Note: I n no case should a blank residue greater than 0.01
mg/g (or 0.001% of the blank weight) be subtracted fran
the sample weight.
Sigrldt,;lre of analyst Signature of reviewer -
Form R E C # 8 (16)
!WPLE ANALYTICAL DATA WRH
Plant Locat ion AP.H, f Relative humidity i n lab ,$?J %
Sample ~ o c a t ion Density of Acetone (pa) .78 mg/ml
Blank volume (Va) 30 0 m l
Date/Time w t . blank 8-1 4-31 3:0.;5 Gross w t . /<#1379 m9 Date/Time w t . blankL\-l7-01 i i l i; Gross w t . Kg, 779<* mg
Ave. Gross w t . / j d . 77ii( mg
Tare w t . \ ( 6 1 7 7 $ i mq Weight of blank (mab) O ; U V Q " mg
Acetone blank residue concentration (Ca) (Ca) = (Mab) / (Val (pa) = ( > , b f - C W/g) Weight of residue i n acetone wash: Wa = Ca Vaw pa = ( 1 ( 1 ( ) = (,.JoI~--
Filter Numbers Date/Time of w t q 1 1b 14 1 '300 Gross w t
Date/TiJne of w t Y -1 7' 9 1 ( i ' t ) / Gross w t
Average Gross w t
Acetone rinse volumi? (Vaw) ml
Tare w t
Run # I i
Note: I n no case should a blank residue graater than 0.01
mg/g (or 0.001% of the blank weight) be subtractd f ran the sample weight.
Date/Time of w t LJi) & 14 ) 3 : 00 Gross w t g ~ate/Time OE w t ~ - 1 7 - ' ~ / IJ;LJ Gross w t g
Average Gross w t g
Tare w t g
Less acetone blank w t (Wa)
~t of particulate i n acetone rinse (ma) 4
0'0 lSU WeLjl~t of particulate on f i l t e r s ($ ) ( m f ) g
Siot~dt:lre of analyst %&U Signature of reviewer
/ 7 5 23Ca ! I I
i 1 7 5 1 > 3 ~ ~ I J I
17J~13 0 1 I
I 7x4 I - M ~ . I --- I
O 4 a o n ; , 1
Gt030Y ! I
Weight of particulate i n acetone rinse 9 0,ohOY i
Total weight of particulate (&) 4 iO,03sY 1

VII. CALCULATlONS

A.P.A.C. - NORTH CAROLINA ( 1 7 )
BURLINGTON, NORTH CAROLINA SUMMARY OF TEST DATA
4-10-91
RUN #l SAMPLING TRAIN DATA
start 19:40
finish 20:52
1. Sampling time, minutes 8 60.0
\. Sampling nozzle diameter, in. Dn .2500 2 3. Sampling nozzle cross-sect. area, ft An .000341
\. Isokinetic variation I 102.2
. Sample gas volume - meter cond., cf. 'm 50.200
6. Average meter temperature, OR Tm 549
7. Avg. oriface pressure drop, in. H20 dH 2.20
8. Total particulate collected, mg. Mn 85.10
4-11-91
RUN 13
4-12-91
RUN #4
'\r VELOCITY TRAVERSE DATA
2 9. Stack area, ft. A 9.38 9.38 9.38
10. Absolute stack gas pressure, in. Hg. Ps 29.50 29.90 29.90
11. Barometric pressure, in. Hg. 'bar 29.50 29.90 29.90
12. Avg. absolute stack temperature, R0 Ts 712 702 700
13. Average W v e l . head, ( C~
= .86) 0.98 0.96 0.95
14. Average stack gas velocity, ft./sec. Vs 68.77 66.11 65.51
\I STACK MOISTURE CONTENT
15. Total water collected by train, ml. 'ic 306.20 275.00 289.70
16. Moisture in stack gas, % Bws 22.96 20.55 21.86
EMISSIONS DATA
17. Stack gas flow rate, dscf/hr.(OOO1s) QSd 1308 1333 1302
18. Stack gas flow rate, cfm acfm 38704 37207 36869
19. Particulate concentration, gr/dscf Cs 0.0269 0.0178 0.0112
20. Particulate concentration, lb/hr E 5.03 3.39 2.08
21. Particulate concentration, lb/mBtu E' 0.00000 0.00000 0.00000
ORSAT DATA
22. Percent C02 by volume
23. Percent O2 by volume
24. Percent CO by volume
25. Percent N2 by volume
Format : summryR3
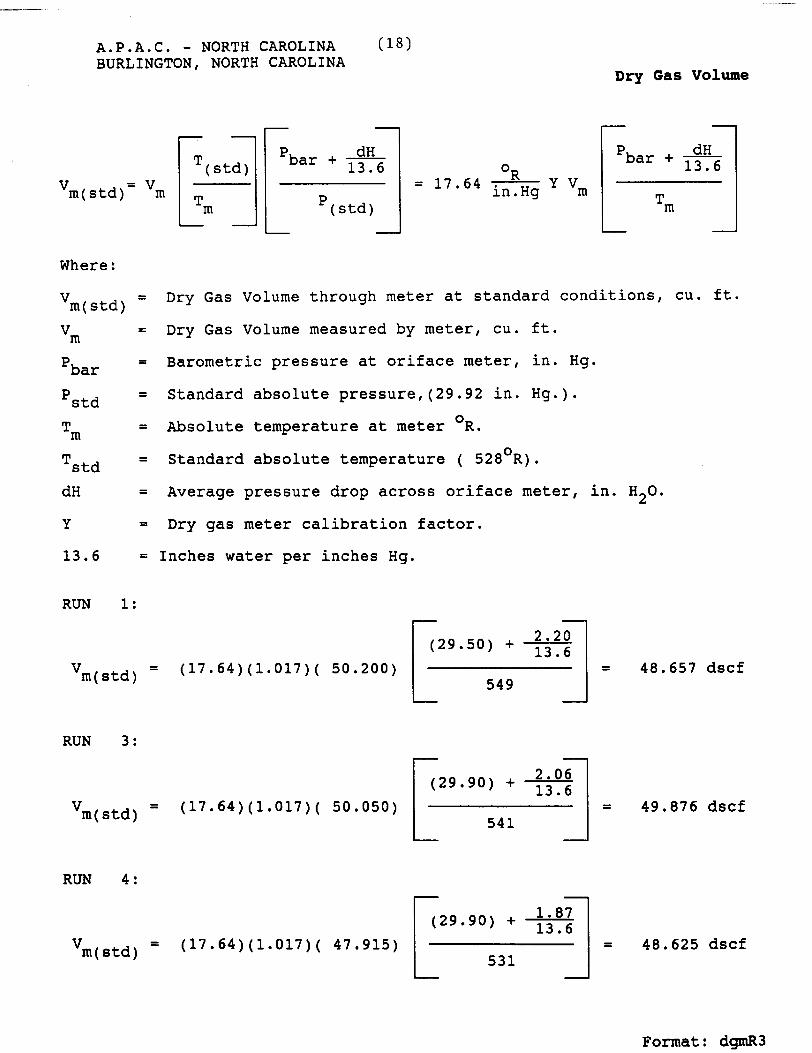
A.P.A.C. - NORTH CAROLINA (18) BURLINGTON, NORTH CAROLINA
Dry Gas Volume
Where :
'm(std) = Dry Gas Volume through meter at standard conditions, cu. ft.
'm = Dry Gas Volume measured by meter, cu. ft.
'bar = Barometric pressure at oriface meter, in. Hg.
'Std = Standard absolute press~re~(29.92 in. Hg.).
0 Tm = Absolute temperature at meter R.
Tstd = Standard absolute temperature ( 528'~).
dH = Average pressure drop across oriface meter, in. H20.
Y = Dry gas meter calibration factor.
13.6 = Inches water per inches Hg.
RUN 1:
RUN 3:
(29*90) + 13.6
'm(std) = (17.64)(1.017)( 50.050) r 2 ' o ~ = 49.876dscf
RUN 4:
Format: dgmR3
'm(std) = (17.64)(1.017)( 47.915) 531
= 48.625 dscf
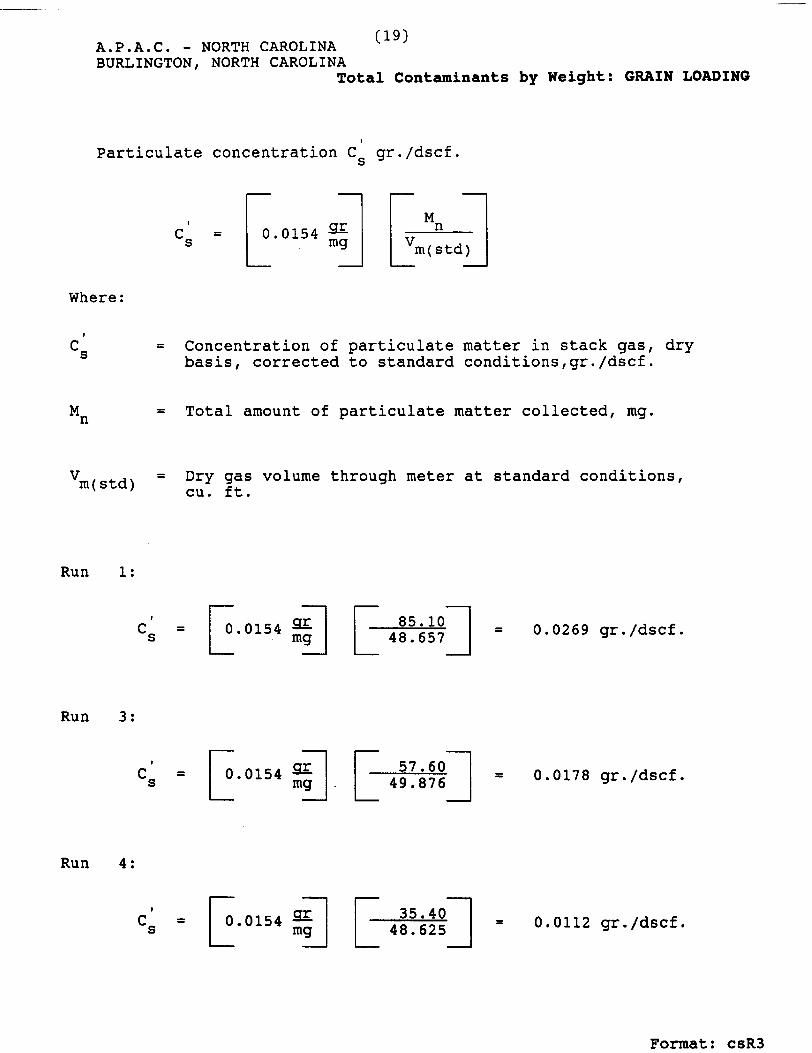
A.P.A.C. - NORTH CAROLINA (19)
BURLINGTON, NORTH CAROLINA Total Contaminants by Weight: GRAIN LOADING
I
Particulate concentration Cs gr./dscf.
Where :
= Concentration of particulate matter in stack gas, dry basis, corrected to standard conditions,gr./dscf.
= Total amount of particulate matter collected, mg.
'm(std) = Dry gas volume through meter at standard conditions, cu. ft.
Run 1:
Run 3:
Run 4 :
Format: c s R 3

A.P.A.C. - NORTH CAROLINA ( 2 0 ) BURLINGTON, NORTH CAROLINA
D r y Molecular Weight
Where :
Md = Dry molecular weight,lb./lb.-mole.
%C02 = Percent carbon dioxide by volume (dry basis).
%O2 = Percent oxygen by volume (dry basis).
%N2 = Percent nitrogen by volume (dry basis).
%CO = Percent carbon monoxide by volume (dry basis).
0.264 = Ratio of O2 to N2 in air, v/v.
0.28 = Molecular weight of N2 or CO, divided by 100.
0.32 = Molecular weight of O2 divided by 100.
0.44 = Molecular weight of C02 divided by 100.
Run 1:
Md = 0.44( 2.00%) + 0.32(17.40%) + 0.28( .00% + 80.60%) = 29.02 lb lb-mole
Run 3:
Md = 0.44( 2.00%) + 0.32(17.40%) + 0.28( .OO% + 80.60%) = 29.02 lb lb-mole
Run 4:
Md = 0.44( 2.00%) + 0.32(17.40%) + 0.28( .OO% + 80.60%) = 29.02 lb lb-mole
Format: mdR3

A.P.A.C. - NORTH CAROLINA ( 2 1 ) BURLINGTON, NORTH CAROLINA
Water Vapor Condensed
Where :
3 0.04707 = Conversion factor, ft. /ml.
3 0.04715 = Conversion factor, ft. /g.
vwc = Volume of water vapor condensed (standard conditions), scf. std
V = Volume of water vapor collected in silica gel (standard Wsgstd conditions), ml.
Vf- Vi = Final volume of impinger contents less initial volume, ml.
Wf- Wi = Final weight of silica gel less initial weight, g.
pw = Density of water, 0.002201 lb/ml.
R = Ideal gas constant, 21.85 in.Hg. (cu. ft. /lb. -mole) (OR).
Mw = Molecular weight of water vapor, 18.0 lb/lb-mole.
Tstd = Absolute temperature at standard conditions, 528'~.
Pstd = Absolute pressure at standard conditions, 29.92 inches Hg.
Run 1:
'wc(std) = (0.04707) ( 290.0) = 13.7 cu.ft
'wsg(std) = (0.04715) ( 16.2) = 0.8 cu.ft
Run 3:
'wc(std) = (0.04707) ( 260.0) = 12.2 cu.ft
'wsg( std) = (0.04715) ( 15.0) = 0.7 cu.ft
Run 4:
'wc (std) = (0.04707) ( 275.0) = 12.9 cu.ft
'wsg(std) = (0.04715) ( 14.7) = 0.7 cu.ft

A.P.A.C. - NORTH CAROLINA BURLINGTON, NORTH CAROLINA ( 2 2 )
Moisture Content of Stack Gases
.WC .I
- - std WSgstd Y I nn Bws + v a- A " "
vwc std WSgstd + Vmstd
Where :
Bws = Proportion of water vapor, by volume, in the gas stream.
'm = Dry gas volume measured by dry gas meter,(dcf).
vwc = Volume of water vapor condensed corrected to standard std conditions (scf).
V = Volume of water vapor collected in silica gel corrected to Wsgstd standard conditions (scf).
Run 1:
Run 3 :
Run 4:
- - 12.9 + 0.7 Bws 12.9 + 0.7 + 4 8 . 6 2 5 X 100 = 21.86%
Format: bwsR3

A.P.A.C. - NORTH CAROLINA ( * 3 ) BURLINGTON, NORTH CAROLINA
Molecular Weight of Stack Gases
Where :
Ms = Molecular weight of stack gas, wet basis, (lb./lb.-mole).
Md = Molecular weight of stack gas, dry basis, (lb./lb.-mole).
Run 1:
Ms = 29.02 ( 1 - 22.96 ) + 18 ( 22.96 ) = 26.49 (lb./lb.-mole)
Run 3:
Ms = 29.02 ( 1 - 20.55 ) + 18 ( 20.55 ) = 26.76 (lb./lb.-mole)
Run 4:
Ms = 29.02 ( 1 - 21.86 ) + 18 ( 21.86 ) = 26.61 (lb./lb.-mole)
Format: msR3
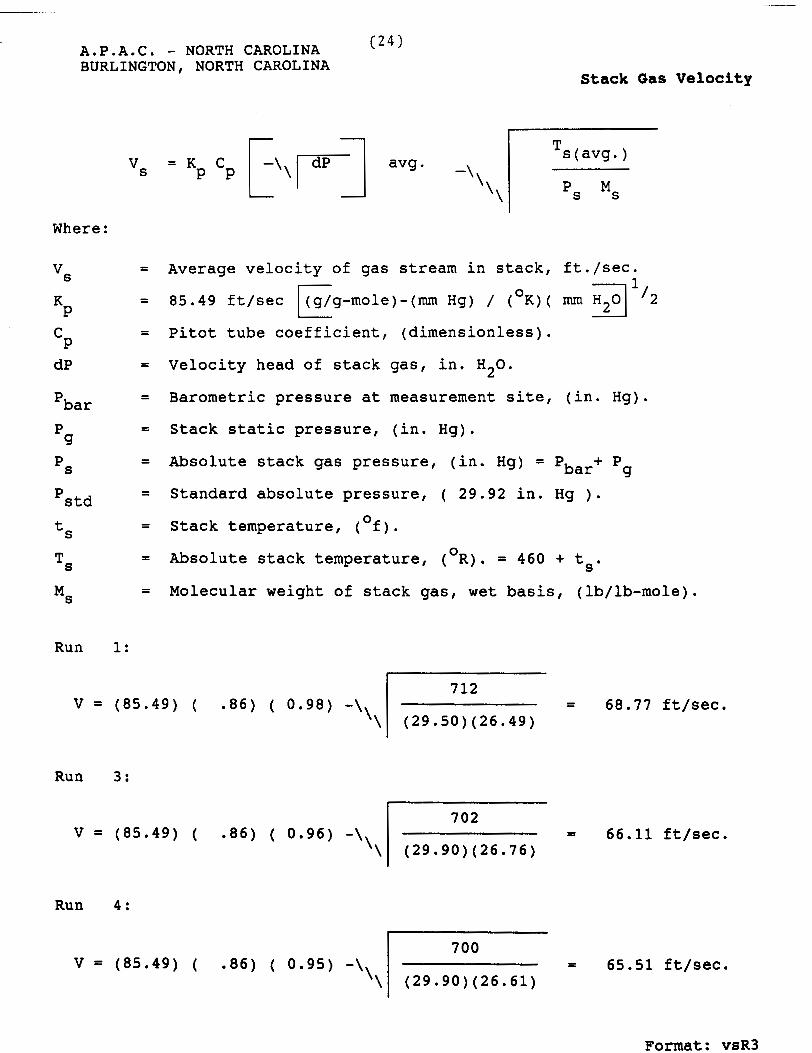
A.P.A.C. - NORTH CAROLINA ( 2 4 ) BURLINGTON, NORTH CAROLINA
Stack Gas Velocity
Where :
vs = Average velocity of gas stream in stack, ft./sec. 1
K P
= 85.49 ft/sec i(g/g-mole)-(mm Hg) / (OK) ( mm 'GI '2 C P
= Pitot tube coefficient, (dimensionless).
dP = Velocity head of stack gas, in. HZO.
'bar = Barometric pressure at measurement site, (in. Hg).
P 9
= Stack static pressure, (in. Hg).
Ps = Absolute stack gas pressure, (in. Hg) = Pbar+ P g
'std = Standard absolute pressure, ( 29.92 in. Hg ) .
ts = Stack temperature, (Of).
Ts = Absolute stack temperature, (OR). = 460 + ts.
Ms = Molecular weight of stack gas, wet basis, (lb/lb-mole).
Run 1:
Run 3:
Format: vsR3
V = (85.49) ( .86) ( 0.96) -\ \ \
702 = 66.11 ft/sec.
(29.90) (26.76)
Run 4:

A.P.A.C. - NORTH CAROLINA BURLINGTON, NORTH CAROLINA
1 2 5 )
Stack Gas Flow R a t e
Where:
Qsd = Dry volumetric stack gas flow rate corrected to standard conditions, (dscf/hr).
A 2 = Cross sectional area of stack, (ft. ) .
3600 = Conversion factor, (sec./hr.).
ts = Stack temperature, (Of).
Ts = Absolute stack temperature, (OR).
Tstd = Standard absolute temperature, (528'~).
'bar = Barometric pressure at measurement site, (in.Hg.).
P 9
= Stack static pressure, (in.Hg.).
's = Absolute stack gas pressure, (in.Hg.); - - 'bar + P g
'std = Standard absolute pressure, (29.92 in.Hg.).
Run 1:
Qsd=3600(1- .2296 ) ( 68.77)( 9.38) 1 ::: 1 1 ~~:~~ 1308082.1 ?;;- dscf
Run 3:
Qsd=3600(1- .2055 ) ( 66.11) ( 9.38) 528 dscf 29*90 = 1333130.9 1 702 2 9 . 9 2 I Run 4:
Qsd=3600(1- .2186 ) ( 65.51)( 9.38) 1 = 1302962.2 ?;;- dscf
Format: qR3

A.P.A.C. - NORTH CAROLINA BURLINGTON, NORTH CAROLINA
( 2 6 )
Emissions Rate from Stack
- ( Cs) ( Qsd) E - = lb. /hr.
Where :
E = Emissions rate, lb/hr.
Cs = Concentration of particulate matter in stack gas, dry basis, corrected to standard conditions, gr/dscf.
Qsd = Dry volumetric stack gas flow rate corrected to standard conditions, dscf/hr.
Run 1:
Run 3:
Run 4:
5.03 lb. / hr.
3 . 3 9 l b . / hr.
2.08 lb. / hr.
A.P.A.C. - NORTH CAROLINA BURLINGTON, NORTH CAROLINA
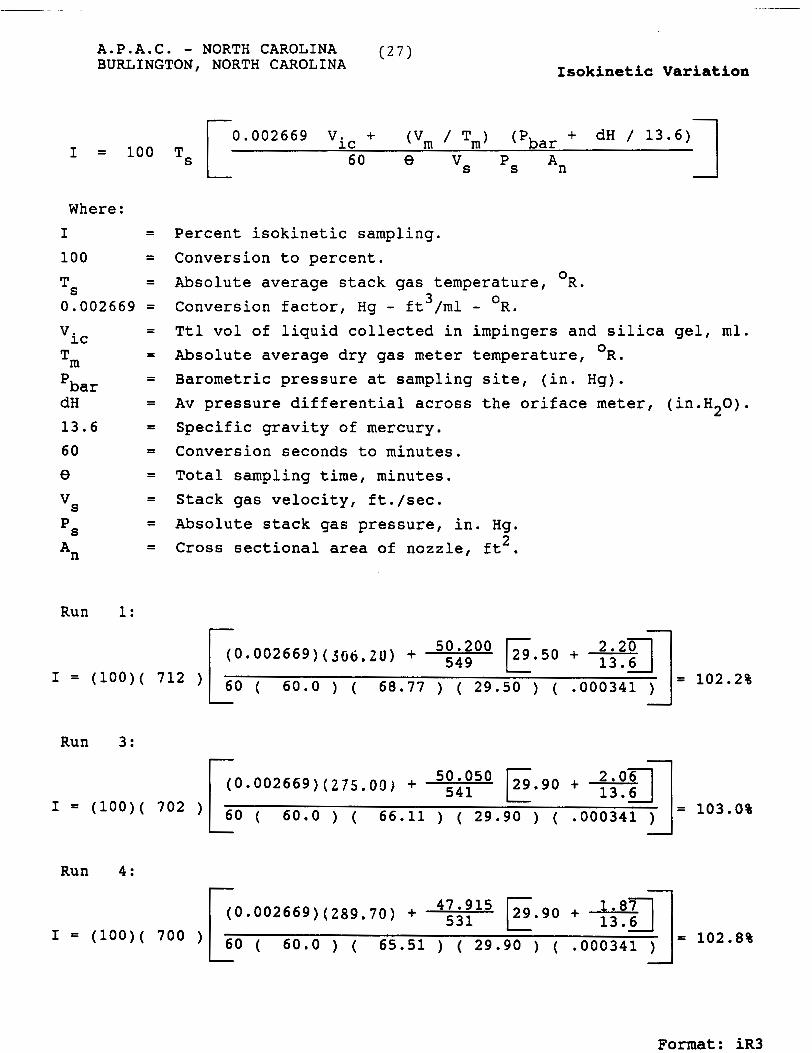
( 2 7 1 Isokinetic Variation
Where :
I = Percent isokinetic sampling.
100 = Conversion to percent. 0
Ts = Absolute average stack gas temperature, R. 3 0.002669 = Conversion factor, Hg - ft /ml - OR.
'ic = Ttl vol of liquid collected in impingers and silica gel, ml.
Tm = Absolute average dry gas meter temperature, OR.
'bar = Barometric pressure at sampling site, (in. Hg). dH = Av pressure differential across the oriface meter, (in.H20).
13.6 = Specific gravity of mercury.
60 = Conversion seconds to minutes.
8 = Total sampling time, minutes.
's = Stack gas velocity, ft./sec.
Ps = Absolute stack gas pressure, in. Hg. 2
*n = Cross sectional area of nozzle, ft .
Run 1: -
Run 3: -
Run 4:
Format: i R 3
A.P.A.C. - NORTH CAROLINA BURLINGTON, NORTH CAROLINA
( 2 8 1 4-10-91 PERCENT EXCESS AIR
Where: %Ea = Percent excess air.
$02 = Percent oxygen by volume, dry basis.
%CO = Percent carbon monoxide by volume, dry basis.
%C02 = Percent carbon dioxide by volume, dry basis.
%N2 = Percent nitrogen by volume, dry basis.
Run # 1: 100 x ( % 17.40 ) - .05 ( % .OO ) = 448.6%
0.264 ( % 80.60) - ( % 17.40) + 0.5 ( % -00)
Run # 3: 100 x ( % 17.40 ) - .05 ( % .OO ) = 448.6%
Run # 4: 100 X ( % 17.40 ) - .05 ( % .OO ) = 448.6%

VIII. FIELD DATA
Form #REC-06 -- _ _ - -----_ _-.- - -. --- --------- ---.--
6 -
I fi - J, I RAMCON ernissiuns test log shcct , cont . [)ATE Y- f O + ' ~ L ~ T I C N f i u f i ~ " u 6 - 1 EST NO. I
SAMPLE lYPlWCfll BOX TEMP. TEMP
('F ) ( 'f 1 - 2 6 Y 50
TRIVERSE POI 111
2 3
' I
5 t
D 7
1
LI r
1
3
'
VACUUM Hg
(in. Hg)
f' t?' 8
6 9 G l? S g 9 6 6 k 6 5 s
I
S~MPLINC TIM[
0 (mial
2d.'l2
d P : / L (
S O . ~ / C
~ o : / P
ao:a u
I , - / @!3 3
0 :
a6:2C
$ 1 ~ 2 9
a0:3o
90:32
ao:39 7 u:'f* /-A% Q ~ ; Y C /
2 0 : ~ s
a b : h l ~
8 0 ; 5 b
a0:$2
I
sThcn TEMP
1% ( ' f1 3SG
z ~ - 6
2%
2 l-0
2 5 0
3ro
2 s o
aso asu 2 6 0
" S O
~6~ 2s 0 a s 0 2 SO
a Q S b
250
I
V E LOCITV H EAD I P S (tn.llfl1
ORTIC[ DIT~. PRESSURE
AH (in.H20) I. 2 I d '7
/< 0 '2 . 3
f.0 I 3.3
-8's I 1.9 .73 1 /. 1 . 0 I 3 - 3 / - t 2 - 5
I
I d f I 2.
1 . 0 2. 3 96 - 13.0
. C / O 1 2.. 6
7s I E 1
08s I / a ct / - o I 2- 3 t 1 / . a , L O 1 r - ‘ / , ss 1 1 . 3
I I 1 I
GAS V O L U M E
~ r n (it!)
2 ~ . 2
2 5 / - 8
as3 35-5. z
236- 7
asr. 9
2 6 0 . 3
262. I
2 6 3 . Q 2 b S , 6
26 7 2 2 68. d 70.2
2 72. a73 L
3 75. 1
a7~ . ' ( a4
I
GAS SAMPLE
in
TEMP .('f I
out /QO
/W
[@
f W
(m
1 0 3
/m
/ a ~
(ou
1 0 2
[ o r / o t
0 2
/o 2 / o a
f o 7
-78'
' 7 f - ? ~
78
7 K
79
r f 7 8
7 2
7 8
7r
76 7~7
7~
78
7$-
7 6;
I


POSTTEST DRY GAS METER CALIBRATION DATA FORM (~nglish units)
] y z . 9 8 Y / . 6 3 7 n
a If t h e r e is only one thermometer on t h e dry gas meter, record t h e temperature under td W
4 V
Tes t number Date Y- /S t l e t e r b o x n u m b e r c ' / P s Plan t
Barometric pressure , Pb
= 30.02 i n . Hg Dry gas meter number L 38 8 6 9 P r e t e s t Y
where
O r i f i c e manometer s e t t i n g ,
(MI , i n . H20
,s 1
38
3 V = Gas volume pas s ing through t h e wet t e s t meter, f t . W
3 Vd = Gas volume pas s ing through t h e d ry gas meter, f t . tw = Temperature of t h e gas i n t h e wet t e s t meter , OF.
td Temperature o f t h e i n l e t gas of t h e dry gas meter , OF.
i
td = Temperature of t h e o u t l e t gas of t h e d r y gas meter, OF. 0
td Average temperature of t h e gas i n t h e d ry gas meter , obtained by t h e average of td and td , OF. i o
AH = Pressure d i f f e r e n t i a l a c r o s s o r i f i c e , i n . H20.
Gas volume
Yi = Rat io of accuracy o f w e t test meter t o d ry gee meter f o r each run.
Y = Average r a t i o of accuracy of wet test meter t o d r y gas meter f o r a l l t h r e e runs; t o l e r ance = p r e t e s t Y - +0.05Y.
Wet test meter (V 1,
W3 f t
10
10
P,, = Barometric p r e s s u r e , i n . llg.
Dry gas meter (V 1,
d3 f t - - - ~ 0 . 1
Sq9
Temperature
8 = Time of c a l i b r a t i o n run, min.
m e (O), min
/ A 96f 1 7 . 2 ~ ~
10 qs+b
Wet test meter
( t w ) , O F
71-6
71.6
Quality Assurance Handbook M4-2.4A
12.16
Va~uUJn s e t t i n g ,
i n . ~g
1
I -1 71. C
Dry gas meter
1
I n l e t
i OF
&'
i
9 7 5 7
. p8k A. 9~ g, 7 1
'i
Vw Pb (td + 460)
tw + 460)
/.s?S ~ 6 3 ~
, 7 8 7 8 .
O u t l e t ( t d ) , ( t d ) ,
o OF
, c
1-68 1
Averagf (td),
OF
7 6 6 3

138)
METER BOX CALIBRATION DATA AND CALCULATION FORM
(English units)
Date q- f - 7 / Meter box number - . a
Barometric pressure, Pb = 27-87 in . Hg Calibrated by &&&,s/H f
Quality Assurance Handbook M4-2.3A (front side)
Orifice manometer
se t t ing (AH),
in . H20
0.5
1.0
2 . 0 - 3.0 H
Y O m
/.S e
0.5
1.0
1.5
2.0
3.0
4.0
I
0.0368
0.0737
0.110
0.147
0.221
0.294
a If there i s only one thermometer on the dry gas meter, record the temperature under t,.
Gas volume Wet t e s t meter (Vw),
f t 3
Dry gas meter (Vd),
f t3
Temperature
5 / . 64 7
5 ~ L Y 1 7 ~ . 3 0 ' 75.2 7 4 .rc ' 7 2 I 61: d6G /.olr / , & 6 5 10 / 7 Y 83 ,2,~1i /adz6 /- 6 7 '1
Time (01,
min
Wet t e s t meter
( t w ) ,
O F
10 752 //L 9 5 74 (If 7
10 7 s - I $ 8 A<%f'~~ 10 e --
,t3 6
'i
Dry gas meter
f 3 5
g f
mei i n . H20
I n l e t ( t d 1,
i O F
/ c , j r
8.74 /v?o
Outlet ( t d 1,
o O F
~ v g " ( t d ) ,
O F
l . 0 2 ~ 1
t.013
1 . 0 , ~
/.75y
1 . 7 0 4
I.-6 )ti

(39)
STACK TEMPERATURE SENSOR CALIBRATION DATA FORM
5- - sc\ I ' ~u&#/ Date Thermocouple number hu, /& ..
-! - -4 Ambient temperature -ri U OC Barometric pressure .: ' 1 1 Yf i n . H g - Calibrator ',I, ,+-- Reference : mercury-in-glass /
other
' ~ y p e o f ca l ibrat ion system used.
Reference point
number
L
-
f P OC + 273) - ( t e s t thsrrnom temp, OC + 2 7 3 q 10011.5X. ref temp, O C + 273
Quality Assurance Handbook M5-2.5
sourcea ( s p e c i f y )
- .?-
8 . . - , - f : ,
\
: 1 I:#-& .-
. ... I!-:? -
E - .&r-. L
,/
Reference thermome t e r temperature,
OC
7 a, - &
* \ ? C ' *
- 3 A w \ - L
Thermocouple potentiometer temperature,
OC
3 - ., r-
a , -'
* -. 8 .
-7 : . ' $ : G
Temperature d i f ference , b
%
0
C
3

( 4 0 )
STACK TEMPERATURE SENSOR CALIBRATION DATA FORM
,I - 5- 3 - 6' '; , %
Date ~hermocouple number H 2 5 k 5 " '
*. ., 7 * . :
Ambient temperature :.!- OC ~ a r o m e t r i c pressure P- t . I-:, i n . H g
Calibrator 7, ~.,\,-.AA Reference : mercury-in-glass y
other
a~ype of c a l i b r a t i o n system used. b[(ref temp, OC + 273) - ( t e s t thermon temp, OC + 273)] 10011.5X.
ref temp, *C + 273
Reference p o i n t
number
8 , -, I+
\
L:
r
i
Q u a l i t y Assurance Handbook M5-2.5
sourcea ( s p e c i f y )
- 9
i t * . -1 2 /<<b
I k I., - . i. :-' - .
L \=L'* C; J-
, . -5 ' b i: .Y- "
1
4 L.
Reference thermometer temperature,
OC
- - 6 * ;* , Y
a12
7 ' 1 k
Thermocouple potentiometer temperature,
O C
- . - Y
=r
:. , P v
-2 " * *
Temperature d i f f e r e n c e , b
%
'7 -
- -!
-? ....
orm No.
(41)
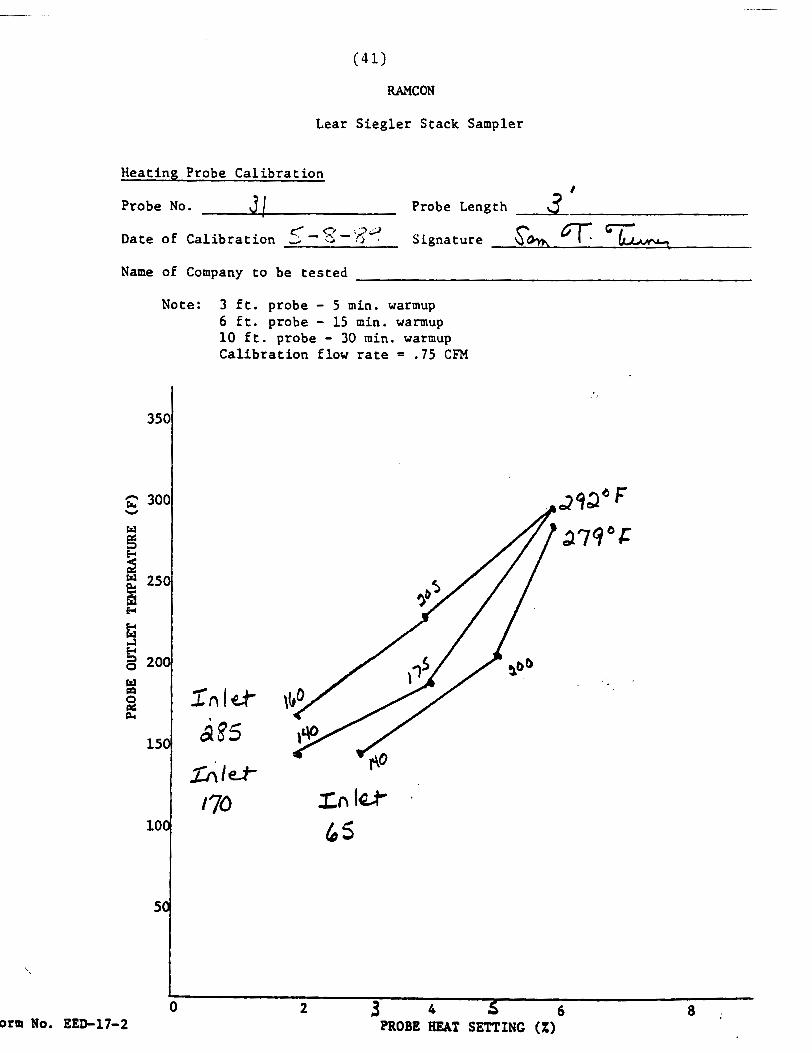
RAMCON
Lear Siegler Stack Sampler
Heating Probe Calibration 8
Probe No. 3 Probe Length 3 c-z-.z< Date of Calibration , Signature $.Om -L+,
Name of Company to be tested
Note: 3 ft. probe - 5 min. warmup 6 ft. probe - 15 min. warmup 10 ft. probe - 30 min. warmup Calibration flow rate = .75 CFM

( 4 2 1
STACK TEMPERATURE SENSOR CALIBRATION DATA FORM
Q u a l i t y Assurance Handbook M2-2.10
Date 7 \ \\41 Thermocouple number 3 \ \
Ambient temperature 73 O C Barometric pressure 5 3 1 < i n . Hg
Cal ib ra to r + Reference : mercury-in-glass
Reference poin ta
number
A-
.'- u
Cd
0
' ~ v e r ~ 30°C (50'1) f o r each reference poin t . b ~ y p e of c a l i b r a t i o n system used.
( r e f temp, OC + 273) - ( t e s t thennom temp, OC + 273) r e f temp, O C + 273
source ( s p e c i f y ) - . C , ~ c r \Ic
b<.'- " C
o>< ' --''--L
y-la-?/
Temperaturec d i f fe rence ,
%
C,
G
(9
0
Reference thermometer temperature,
O C
32
2 1 2
53'
? ? O F
o the r
Thermocouple potentiometer temperature,
O C
' 5 1
2 t 2
3 " '
79@F

Pitot Tube Calibration fS Tvpe]
Pitot Tube Identification No. 3 \ Date: - '\ - 4 \
- Calibrated by: \-,- \, -\ ,-.
' :\ (..
3 r 1 C, (s)-cp (A OR 6) I
AVERAGE DEVlATlON = o (A OR 8) = 1 +MUST BE 10.01
*
'A' SIDE CALlBRATlON
'B' SIDE CALIBRATION
k c p (SIDE A)-ep (SIDE B) 1 -MUST BE 50.01
DEVIATION c.(s)-cD(A)
. cc,?
, ~ : n \
.33u - C, (SIDE A)
i
DEVIATION cO(s)-c,(B)
. COT
, q ~ 2
C,(s)
. 91f9 , q b \
,ci-f,
C,(s)
C' <-q
A P ( ~ ) cm H,O (in H20)
- 1.19
.7 0
1.L
RUN NO.
1
2
3 *
A P ( ~ > cm H20 (in H2O)
\ . I - - RUN NO.
1
ap std cm H20 (in H20)
, G $3- '5
\ 1 %
~p std cm H20 (in H,O)
, T?

X. RAMCON PERSONNEL

RAMCON Environmental Stack Test Team
Sumner Buck - President
Sumner Buck is the President of RAMCON Environmental Corporation. He is a
graduate of the EPA 450 "Source Sampling for Particulate Pollutant's" course and
the 474 "Continuous Emissions Monitoring" course all given at RTP. Mr. Buck is
a certified V.E. reader with current certification. Mr. Buck has personally sampled
over 400 stacks including over 300 asphalt plants. He is 47 years old and a
graduate of the University of Mississippi with graduate studies at Memphis State
University and State Technical institute of Memphis.
Billy Lodcett - Team Leader
Billy Lockett has undergone extensive training in Methods 1 through 9. He is
qualified as a team leader and is currently certified as a V.E. reader.