Embed Size (px)
Citation preview
Entorhinal Grid Cells May Facilitate Pattern Separationin the Hippocampus
Jochen Kerdels and Gabriele PetersUniversity of Hagen, Universitatsstrasse 1, D-58097 Hagen, Germany
Keywords: Pattern Separation, Grid Cells, Entorhinal Cortex, Dentate Gyrus, Hippocampus.
Abstract: The dentate gyrus (DG) in the hippocampus of the mammalian brain is known to exhibit strong pattern sepa-ration. However, how this pattern separation arises in the DG is not well understood. Here we offer a novelhypothesis regarding this problem by demonstrating that pattern separation can already be performed by en-torhinal grid cells, which are located just one synapse upstream of the DG. For our simulations we utilize arecently introduced grid cell model that interprets the behavior of grid cells as just one instance of a generalinformation processing scheme. The obtained results challenge the established view that pattern separationoccurs primarily in the DG, and they uncover a common misconception regarding the specificity of ensembleactivity in grid cells.
1 INTRODUCTION
The parahippocampal region (PHR) and the hip-pocampal formation (HF) in the mammalian brainare vital for storing and retrieving episodic memories,i.e., memories of specific events experienced by theorganism (Tulving and Markowitsch, 1998; Burgesset al., 2002; Rolls, 2013). A key requirement for thiskind of memory is the ability to distinguish betweensimilar events that may differ only in minute details.To accomplish such differentiation it is commonly as-sumed that parts of the hippocampus carry out someform of pattern separation that orthogonalizes the in-put signals before they are stored in an autoassociativememory (Leutgeb et al., 2007; Yassa and Stark, 2011;Rolls, 2013). As a result of this pattern separation,similar input signals cause divergent sets of neuronsto become active and thus reduce confusion of theseinputs in subsequent processing steps. Within the hip-pocampus such divergent activation of neurons in re-sponse to similar inputs was primarily observed inthe dentate gyrus (DG) (Leutgeb et al., 2007; Berronet al., 2016). However, how this observed pattern sep-aration in the DG arises is not well understood (Rolls,2013).
In this paper we offer a novel hypothesis regardingthis problem. Based on our recently introduced com-putational model of entorhinal grid cells (Kerdels andPeters, 2015; Kerdels, 2016) we will show that the be-havior of grid cells – if it is interpreted as an instance
of a general information processing scheme – alreadyresults in strong pattern separation within the entorhi-nal cortex (EC). As the latter provides the main inputto the dentate gyrus (van Strien et al., 2009) we hy-pothesize that the pattern separation observed in DGis facilitated by output signals from the EC that arealready well separated and that the DG itself just im-proves this separation by sparsification.
The next two sections provide a brief overviewof the parahippocampal-hippocampal network (PHR-HF) and our computational model of entorhinal gridcells. Section 4 outlines the experimental setup andcharacterizes the input signal used in the simulations.In sections 5 and 6 we present and discuss the simu-lation results.
2 PHR-HF OVERVIEW
The parahippocampal-hippocampal region of themammalian brain is part of the limbic system. Ithas a long evolutionary history and putative homo-logues can be found in most vertebrate species (But-ler and Hodos, 2005). Functionally, the region is nec-essary for short term and declarative memory, whichincludes factual knowledge as well as episodic mem-ories (Squire et al., 2008).
The parahippocampal region (PHR) consists offive main areas designated as perirhinal cortex (PER),postrhinal cortex (POR), presubiculum (PrS), para-
Kerdels J. and Peters G.Entorhinal Grid Cells May Facilitate Pattern Separation in the Hippocampus.DOI: 10.5220/0006514601410148In Proceedings of the 9th International Joint Conference on Computational Intelligence (IJCCI 2017), pages 141-148ISBN: 978-989-758-274-5Copyright c© 2017 by SCITEPRESS – Science and Technology Publications, Lda. All rights reserved

Figure 1: The standard view of the parahippocampal-hippocampal network based on the review by (van Strienet al., 2009).
subiculum (PaS), and entorhinal cortex (EC). The lat-ter being further subdivided into a lateral (LEA) anda medial (MEA) part. The areas of the PHR have sixlayers similar to the neocortex with layers II/III andlayers V/VI being the principal cell layers that containthe majority of neuronal cell bodies. The hippocam-pal formation (HF) consists of four main areas desig-nated as dentate gyrus (DG), cornu ammonis 3 (CA3),cornu ammonis 1 (CA1), and subiculum (Sub). Incontrast to the PHR and the neocortex the areas of theHF have only three layers, with the central layer con-taining the majority of cell bodies (Witter et al., 2000;Squire et al., 2008; van Strien et al., 2009; Somogyi,2010).
Figure 1 outlines the basic PHR-HF network. Itshows that the PHR acts as a gateway that mediatesboth the input from the neocortex to the HF, as wellas the output from the HF to the neocortex. Two ma-jor, bidirectional projection streams facilitate this ex-change of signals. The PER connects predominantlywith the LEA, while the POR connects to the MEA.From the upper layers II/III of the EC the so calledperforant pathway projects then to all areas of the HF.Signals from the second layer reach the DG and CA1,whereas signals from the third layer go to CA1 and thesubiculum. The output from the HF projects from ar-eas CA1 and the subiculum to deep layers V/VI of theEC (van Strien et al., 2009). As a rough approxima-tion the hippocampus can be interpreted as a sequenceof processing modules, starting with the DG and end-ing with the subiculum, that receives inputs from theupper layers of the EC and feeds its results back tothe lower layers of the EC. As such, the EC can beinterpreted as the main interface to the hippocampus.
A major advance in the understanding of EC func-tion resulted from the discovery of grid cells and theirsubsequent investigation (Fyhn et al., 2004; Haftinget al., 2005; Rowland et al., 2016). The activity ofgrid cells correlates strongly with the animal’s loca-tion creating a hexagonal pattern of firing fields that
spans the entire environment of the animal. Thisstrong spatial correlation provides a rare opportunityto experimentally observe and interpret the behav-ior of neurons in this part of the brain. Commonhypothesis regarding the function of grid cells viewthese cells as specialized components in a system fa-cilitating orientation and navigation (Rowland et al.,2016). However, recent observations of grid like fir-ing patterns in contexts other than locomotion (Kil-lian et al., 2012; Constantinescu et al., 2016; Aronovet al., 2017; Diehl et al., 2017) may indicate that thebehavior of grid cells reflects a more general, underly-ing processing scheme. To investigate this hypothesiswe developed a computational model of grid cells thatimplements such a general processing scheme allow-ing us to apply our model outside of the typical con-text of navigation and orientation (Kerdels and Peters,2015; Kerdels, 2016; Kerdels and Peters, 2016). Webriefly outline the model in the next section.
3 GRID CELL MODEL
We developed our grid cell model based on the ideathat the behavior observed in grid cells is just oneinstance of a more general information processingscheme. We hypothesize that grid cells form a simple,piecewise representation of their entire input space bylearning a limited number of input patterns or proto-types that reflect the input space structure. Simultane-ously, competition among cells within a local grid cellgroup ensures that the simple representations learnedby the individual cells are pairwise distinct and inter-leave in such a way that a complex representation ofthe input space emerges that is distributed over theentire group of neurons.
On the neurobiological level such a prototype-based representation could be stored within the den-dritic tree of a neuron with individual prototypesbeing stored in local dendritic subsections. In ourmodel we utilize the core ideas of the growing neuralgas (GNG) algorithm to describe this learning pro-cess. The GNG is an unsupervised learning algorithmthat uses biologically plausible competitive Hebbianlearning to approximate the input space structure witha network of prototypes (Martinetz and Schulten,1994; Fritzke, 1995). We extended the regular GNGalgorithm into a recursive version (RGNG) that al-lows us to simultaneously describe both the learningprocesses of individual neurons as well as the com-petition among a group of neurons by the same GNGdynamics. For a formal description and an in-depthcharacterization of the model we refer to (Kerdels andPeters, 2016; Kerdels, 2016).

Figure 2: Typical samples of the digit 8 in the MNISTdatabase of handwritten digits (Lecun et al., 1998).
Regarding this work, the most important property ofthe RGNG-based grid cell model is its ability to oper-ate on arbitrary input spaces. Regardless of the par-ticular input space, e.g., the modality or dimension ofthe input signals, the modeled group of neurons willtry to learn the structure of that input space as wellas possible. In addition, as each neuron tries to learnthe structure of the entire input space the learned rep-resentations of different neurons will be self-similarand no individual neuron will “specialize” on a par-ticular region of input space. As a consequence, smallshifts of the input signal are likely to cause a signif-icant change in the set of active cells in the modeledneuron group, hence effectively implementing a formof pattern separation.
4 EXPERIMENTAL SETUP
To investigate the potential pattern separation capa-bilities of grid cells we simulated multiple groups ofgrid cells using the RGNG-based grid cell model andexposed these groups to a sequence of input samplesfrom a given input space. For each input sample theresulting activity of each simulated grid cell was de-termined and the individual activities within a gridcell group were then summarized in an activity vec-tor. This vector can be interpreted as the grid cellgroup’s encoding of the respective input sample. Tocompare this encoding with the original encoding ofthe input signal in terms of orthogonality we decidedto use the cosine similarity measure, as it is a directmeasure of the (non-)orthogonality of two vectors.
As input space we chose the well-known MNISTdatabase of handwritten digits (Lecun et al., 1998),which provides a total of 60000 samples of hand-written digits in the resolution of 28× 28 = 784 pix-els. Since the intra-class samples in this database ex-hibit a high degree of similarity (Fig. 2) it is espe-cially suited to investigate the pattern separation ca-pabilities of an encoding scheme. Figure 3 shows theintra- and inter-class cosine similarity distributions inthe MNIST dataset. Cosine similarity values close to0 indicate orthogonal vectors, while values close to1 indicate a high degree of similarity. For any en-coding that performs pattern separation it is expectedthat corresponding distributions of the encoded sig-
Figure 3: Box plot of the intra-class (orange, left columns)and inter-class (blue, right columns) cosine similarity distri-butions occurring in the MNIST dataset. Bottom and top ofdashed lines represent minimum and maximum values, bot-tom and top of each box represent lower and upper quartiles,thick lines represent medians, and circles represent meanvalues of the distributions.
nals will be skewed towards 0.A total of 15 grid cell groups were simulated. Eachgroup consisted of 100 neurons and received 2.88 mil-lion (partial) input samples from the MNIST inputspace, i.e., 48 repetitions of 60000 samples. Thus, theactivity vectors derived from each group were 100-dimensional. The grid cell groups differed by thenumber {20,40,80} of prototypes each neuron wasallowed to use for its input space representation, andby processing either entire input samples or just thetop, bottom, left, or right half of the samples. Thenumber of prototypes per cell influences the “reso-lution” with which the cell can form an input spacerepresentation. A lower number of prototypes resultsin a more coarse representation, i.e., grid cells witha low number of prototypes have larger grid spacingthan grid cells with a high number of prototypes. Thenumbers of prototypes used here were chosen froma range that is biologically plausible (Kerdels, 2016).The processing of partial input samples was used asa proxy for simulating multimodal input, i.e., as inputthat usually occurs together but that is represented andencoded by independent groups of neurons. All otherparameters of the RGNG-based grid cell model wereheld constant and are provided in the appendix.
5 RESULTS
Figure 4 shows the intra- and inter-class cosine sim-ilarity distributions occurring in the activity vectorsof grid cell groups that processed 2.88 million in-put samples from the MNIST input space and usedeither 20, 40, or 80 prototypes per cell for their in-put space representation. The activity vectors were
(a) 20 prototypes per cell
(b) 40 prototypes per cell
(c) 80 prototypes per cell
Figure 4: Box plots as in figure 3 of the intra- and inter-class cosine similarity distributions occurring in the activityvectors of grid cell groups using 20 (a), 40 (b), or 80 (c)prototypes per cell for their input space representation.
sampled during the 48th input repetition of the 60000MNIST training samples. For most classes the dis-tributions show a significant decrease in the cosinesimilarities when compared with the cosine similar-ities measured in the MNIST set (Fig. 3). Mean val-ues for both intra- and inter-class similarities droppedfrom about 0.5 and 0.4, respectively, to about 0.2. Inaddition, the clear difference of similarity values be-tween intra- and inter-class distributions visible in theMNIST set was equalized in the grid cell group activ-ity vectors. Notably, the intra-class distribution of
(a) combined groups 20 and 40 prot.
(b) combined groups 40 and 80 prot.
(c) combined groups 20, 40, and 80 prot.
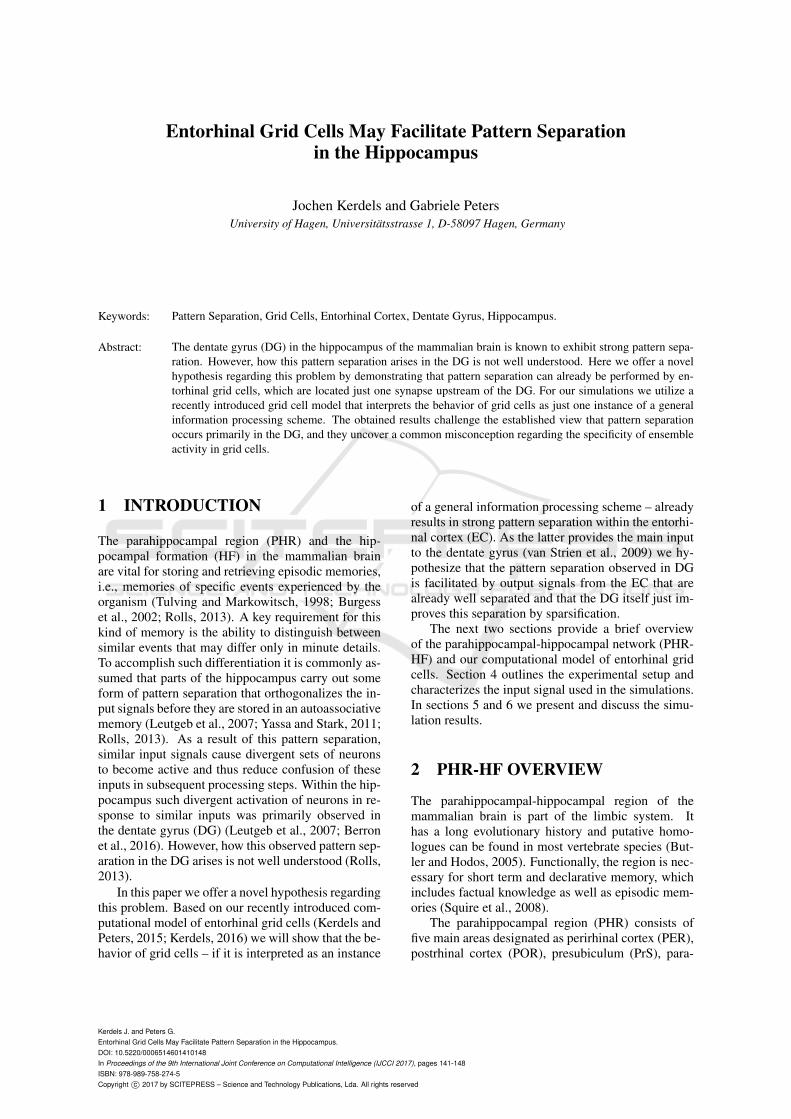
Figure 5: Box plots as in figure 3 of the intra- and inter-classcosine similarity distributions occurring in combined activ-ity vectors of grid cell groups. (a) Two grid cell groups us-ing 20 and 40 prototypes per cell. (b) Two grid cell groupsusing 40 and 80 prototypes per cell. (c) Three grid cellgroups using 20, 40, and 80 prototypes per cell.
class 1 deviates from these observations. It is broaderand retains a relatively high median similarity value.In the case of the grid cell group that only uses 20 pro-totypes per cell the median value has even increasedrather than decreased when compared to the MNISTset median value of class 1. These deviations of theclass 1 distributions can be attributed to the fact thatthe digit one is typically drawn as just a vertical strokewith little variation.

It is a common notion within the grid cell literaturethat the output signals of entorhinal grid cell groupsthat exhibit different grid spacings combine in the hip-pocampus to uniquely encode specific places in ananimal’s environment (Solstad et al., 2006). To in-vestigate the orthogonality of such combined outputsignals we concatenated the activity vectors of twoor more simulated grid cell groups that use differ-ent numbers of prototypes per cell and analysed theresulting intra- and inter-class cosine similarity dis-tributions. Figure 5 shows the distributions occur-ring in the combined activity vectors of groups us-ing 20 and 40 prototypes (Fig. 5a), 40 and 80 proto-types (Fig. 5b), as well as 20, 40, and 80 prototypes(Fig. 5c). In general, the results are qualitatively simi-lar to that from the non-combined, individual grid cellgroups (Fig. 4), though the widths of the distributionsas well as the mean similarity values have slightly de-creased.
A different source of combined output signals canbe multimodal input. The entorhinal cortex receivesprojections from various areas of the neocortex andthe limbic system. This multimodal input is thenprocessed and forwarded to the hippocampus. Tosimulate input from multiple modalities we split theMNIST input samples into top, bottom, left, and righthalves and let these partial samples be processed byfour separate grid cell groups. The activity vectors ofthese four groups were then concatenated and anal-ysed. Figure 6 shows the intra- and inter-class cosinesimilarity distributions occurring in combined activityvectors of groups that used 20 (Fig. 6a), 40 (Fig. 6b),and 80 (Fig. 6c) prototypes per cell. In all three casesthere is a much more pronounced reduction in thewidths of the distributions and the mean similarityvalues as compared to the distributions occurring inthe combined activity vectors of grid cell groups withdifferent grid spacings (Fig. 5). The lowest mean sim-ilarity values of about 0.05 are achieved by the fourgrid cell groups that use 80 prototypes per cell fortheir input space representation. Remarkably, eventhe mean similarity value of the intra-class distribu-tion of class 1 decreases in this multimodal settingdown to a value of about 0.25 from about 0.6 mea-sured in the MNIST set.
6 DISCUSSION
The results presented in the previous section indicatethat – under the given hypothesis – entorhinal gridcells perform pattern separation on their input signalsand provide already orthogonalized output signals tothe hippocampus. This result provides a novel per-
(a) multi modal / 20 prototypes
(b) multi modal / 40 prototypes
(c) multi modal / 80 prototypes
Figure 6: Box plots as in figure 3 of the intra- and inter-class cosine similarity distributions occurring in simulatedmultimodal activity vectors of grid cell groups encodingthe top, bottom, left, or right halves of the MNIST inputsamples using 20 (a), 40 (b), or 80 (c) prototypes per cell.
spective on the possible genesis of the pattern separa-tion that can be observed in the dentate gyrus (Leut-geb et al., 2007; Berron et al., 2016). From this per-spective, the input signals to the DG may already bewell separated and the pattern separation observed inthe DG may just be a result of further sparsification,e.g., due to the neurogenesis occurring in this region.Furthermore, shifting the “functionality” of patternseparation from DG to EC would provide orthogonal-ized inputs not only to the DG but also to all otherparts of the hippocampus (Fig. 1). This shift would

improve the support of hippocampal memory modelsthat assume that memory retrieval can operate with-out the involvement of the DG (Tulving and Markow-itsch, 1998).
Another important aspect is the observation thatpattern separation does not require the collaborationof multiple grid cell groups (Fig. 4). A typical gridcell fires if the animal is at one of multiple locations.In terms of the RGNG-based grid cell model the gridcell fires if the input to the cell matches one of itsmultiple prototypes. Thus, from the activity of a sin-gle grid cell it is not possible to derive which of theprototypes caused the cell to fire. The input patterncould be similar to any of the multiple patterns en-coded in the prototypes (Fig. 7). Within a grid cellgroup the prototypes of grid cells are typically shiftedagainst each other. In most grid cell models found inthe literature this property is described in an idealizedway such that the relative locations of firing fields,i.e., the prototypes of all grid cells in the group areprecisely aligned. In this idealized case the joint ac-tivity of the grid cell group remains ambiguous withrespect to the actual input pattern. However, in real-ity the alignment of firing patterns in a grid cell groupis less precise and can exhibit local permutations ofthe cell’s firing fields. As a consequence, these per-mutations make the joint activity of a grid cell groupmuch more specific and less ambiguous than is com-monly thought. The RGNG-based grid cell model al-lows for such natural variation in the alignment, andthe resulting specificity of the grid cell group activityis reflected by the high degree of pattern separationpresent in the inter-class distributions shown in fig-ure 4.
A third important result is the observation that thejoint activity of grid cell groups that process differ-ent modalities (Fig. 6) shows a much stronger patternseparation than the joint activity of grid cell groupsthat have different grid spacings (Fig. 5). Yet, the gridcell literature focuses much more on the latter (Rollset al., 2006; Solstad et al., 2006; Franzius et al., 2007;de Almeida et al., 2009; Savelli and Knierim, 2010),while aspects of multimodality appear to be underrep-resented (Aronov et al., 2017; Diehl et al., 2017).
7 CONCLUSION
We investigated the degree to which entorhinal gridcells perform pattern separation and thus may facil-itate the subsequent pattern separation observed inareas of the hippocampus. Based on the hypothe-sis that the behavior of entorhinal grid cells is justone instance of a more general information process-
(a) cell #1
(b) cell #10
(c) cell #20
Figure 7: Three examples of 80 prototypes that werelearned by three grid cells {#1,#10,#20} to form an inputspace representation. The prototypes typically cover the en-tire input space in each grid cell and are slightly shifted inthe input space across different cells. The last rows in theprototype overviews show examples of “unused” prototypesthat the cells haven’t utilized so far.

ing scheme we used our recently introduced RGNG-based grid cell model (Kerdels and Peters, 2015;Kerdels, 2016; Kerdels and Peters, 2016) to simulateseveral groups of grid cells that processed visual in-puts derived from the MNIST database of handwrittendigits. The results indicate that entorhinal grid cellsmay indeed perform pattern separation on their inputsignals and thus may provide already orthogonalizedoutput signals to the hippocampus.
These results challenge established views on theparahippocampal-hippocampal region and provide anovel explanation for the origin of the pattern sepa-ration that is observed in the dentate gyrus. Further-more, they uncover a common misconception aboutthe assumed lack of specificity in the activity of gridcell groups. Finally, the results encourage the furtherinvestigation of the influence of multimodal input onthe processing within the entorhinal cortex.
REFERENCES
Aronov, D., Nevers, R., and Tank, D. W. (2017). Map-ping of a non-spatial dimension by the hippocampa-lentorhinal circuit. Nature, 543(7647):719–722.
Berron, D., Schutze, H., Maass, A., Cardenas-Blanco, A.,Kuijf, H. J., Kumaran, D., and Duzel, E. (2016).Strong evidence for pattern separation in human den-tate gyrus. Journal of Neuroscience, 36(29):7569–7579.
Burgess, N., Maguire, E. A., and O’Keefe, J. (2002). Thehuman hippocampus and spatial and episodic mem-ory. Neuron, 35(4):625 – 641.
Butler, A. and Hodos, W. (2005). Comparative VertebrateNeuroanatomy: Evolution and Adaptation. Wiley.
Constantinescu, A. O., O’Reilly, J. X., and Behrens, T.E. J. (2016). Organizing conceptual knowledge in hu-mans with a grid-like code. Science (New York, N.Y.),352(6292):1464–1468.
de Almeida, L., Idiart, M., and Lisman, J. E. (2009). Theinputoutput transformation of the hippocampal gran-ule cells: From grid cells to place fields. The Journalof Neuroscience, 29(23):7504–7512.
Diehl, G. W., Hon, O. J., Leutgeb, S., and Leutgeb, J. K.(2017). Grid and nongrid cells in medial entorhinalcortex represent spatial location and environmentalfeatures with complementary coding schemes. Neu-ron, 94(1):83 – 92.e6.
Franzius, M., Vollgraf, R., and Wiskott, L. (2007). Fromgrids to places. Journal of Computational Neuro-science, 22(3):297–299.
Fritzke, B. (1995). A growing neural gas network learnstopologies. In Advances in Neural Information Pro-cessing Systems 7, pages 625–632. MIT Press.
Fyhn, M., Molden, S., Witter, M. P., Moser, E. I., andMoser, M.-B. (2004). Spatial representation in the en-torhinal cortex. Science, 305(5688):1258–1264.
Hafting, T., Fyhn, M., Molden, S., Moser, M.-B., andMoser, E. I. (2005). Microstructure of a spatial mapin the entorhinal cortex. Nature, 436(7052):801–806.
Kerdels, J. (2016). A Computational Model of Grid Cellsbased on a Recursive Growing Neural Gas. PhD the-sis, FernUniversitat in Hagen, Hagen.
Kerdels, J. and Peters, G. (2015). A new view on grid cellsbeyond the cognitive map hypothesis. In 8th Confer-ence on Artificial General Intelligence (AGI 2015).
Kerdels, J. and Peters, G. (2016). Modelling the grid-likeencoding of visual space in primates. In Proceedingsof the 8th International Joint Conference on Compu-tational Intelligence, IJCCI 2016, Volume 3: NCTA,Porto, Portugal, November 9-11, 2016., pages 42–49.
Killian, N. J., Jutras, M. J., and Buffalo, E. A. (2012). Amap of visual space in the primate entorhinal cortex.Nature, 491(7426):761–764.
Lecun, Y., Bottou, L., Bengio, Y., and Haffner, P. (1998).Gradient-based learning applied to document recogni-tion. Proceedings of the IEEE, 86(11):2278–2324.
Leutgeb, J. K., Leutgeb, S., Moser, M.-B., and Moser, E. I.(2007). Pattern separation in the dentate gyrus and ca3of the hippocampus. Science, 315(5814):961–966.
Martinetz, T. M. and Schulten, K. (1994). Topology repre-senting networks. Neural Networks, 7:507–522.
Rolls, E. (2013). The mechanisms for pattern completionand pattern separation in the hippocampus. Frontiersin Systems Neuroscience, 7(74).
Rolls, E. T., Stringer, S. M., and Elliot, T. (2006). Entorhi-nal cortex grid cells can map to hippocampal placecells by competitive learning. Network: Computationin Neural Systems, 17(4):447–465. PMID: 17162463.
Rowland, D. C., Roudi, Y., Moser, M.-B., and Moser, E. I.(2016). Ten years of grid cells. Annual Review ofNeuroscience, 39(1):19–40. PMID: 27023731.
Savelli, F. and Knierim, J. J. (2010). Hebbian analysis of thetransformation of medial entorhinal grid-cell inputs tohippocampal place fields. Journal of Neurophysiol-ogy, 103(6):3167–3183.
Solstad, T., Moser, E. I., and Einevoll, G. T. (2006). Fromgrid cells to place cells: A mathematical model. Hip-pocampus, 16(12):1026–1031.
Somogyi, P. (2010). Hippocampus: Intrinsic organization.In Shepherd, G. M. and Grillner, S., editors, Hand-book of Brain Microcircuits, pages 148–164. OxfordUniversity Press.
Squire, L., Bloom, F., Spitzer, N., Squire, L., Berg, D.,du Lac, S., and Ghosh, A. (2008). Fundamental Neu-roscience. Fundamental Neuroscience Series. ElsevierScience.
Tulving, E. and Markowitsch, H. J. (1998). Episodic anddeclarative memory: Role of the hippocampus. Hip-pocampus, 8(3):198–204.
van Strien, N. M., Cappaert, N. L. M., and Witter, M. P.(2009). The anatomy of memory: an interactiveoverview of the parahippocampal-hippocampal net-work. Nat Rev Neurosci, 10(4):272–282.
Witter, M. P., Wouterlood, F. G., Naber, P. A., and vanHaeften, T. (2000). Anatomical organization of the

parahippocampal-hippocampal network. Annals of theNew York Academy of Sciences, 911(1):1–24.
Yassa, M. A. and Stark, C. E. L. (2011). Pattern sepa-ration in the hippocampus. Trends in neurosciences,34(10):515–525.
APPENDIX
Parameterization
Each layer of an RGNG requires its own set of pa-rameters. In case of our two-layered grid cell modelwe use the sets of parameters θ1 and θ2, respec-tively. Parameter set θ1 controls the main top layerRGNG while parameter set θ2 controls all bottomlayer RGNGs. Table 1 summarizes the parameter val-ues used for the simulation runs presented in this pa-per. For a detailed characterization of these parame-ters we refer to Kerdels (Kerdels, 2016).
Table 1: Parameters of the RGNG-based model usedthroughout all simulation runs. Parameters θ1 control thetop layer RGNG while parameters θ2 control all bottomlayer RGNGs of the model.
θ1 θ2
εb = 0.004 εb = 0.001εn = 0.004 εn = 0.00001εr = 0.01 εr = 0.01λ = 1000 λ = 1000τ = 300 τ = 300α = 0.5 α = 0.5β = 0.0005 β = 0.0005
M = 100 M = {20,40,80}