Embed Size (px)
Citation preview

Enterprise GIS - Designing, Testing and Monitoring
Andrew Sakowicz, [email protected], Professional Services
Martin Hamann [email protected], Professional Services

Agenda
• ArcGIS Enterprise overview
• Design and Configuration
• Scaling and Workload separation
• Sizing, testing and monitoring: process and tools
• Infrastructure Capacity Planning
• Performance Testing
• System Monitoring
• Use Cases
• How to get the tools discussed

ArcGIS
Enterprise

Desktop Web Device
Server Online Content
and Services
Portal
What is ArcGIS Enterprise?

On-premises Public Cloud Hybrid
On-Premises, Online or hybrid

ArcGIS Server roles and extensions
• ArcGIS GIS Server
• ArcGIS Image Server
• ArcGIS GeoAnalytics Server
• ArcGIS GeoEvent Server
• Esri Business Analyst Server

Design and
configuration

What are the core components of ArcGIS Enterprise?http://server.arcgis.com/en/portal/latest/administer/windows/ha-scenarios-web-gis.htm
• ArcGIS Web Adaptor
• Portal for ArcGIS
• ArcGIS Server
• ArcGIS Data Store

Cluster A Cluster B
Silo Siterecommended
ClusterTo be deprecated
Configuration Stores Configuration Store
(shared)
Configuration Store
(shared)
LB LB LB
Site
Site
Silos, Sites & Clusters
Use silos or small sites

Site design considerationMulti-node, high number of services
• Ensure require infrastructure resources
- Network stability
- NAS stability for ArcGIS Server and Portal config stores
- RAM
- CPU
• Avoid during the working hrs:
- Publishing high number services
- Adding/removing nodes
• Distribute recycle times

Site management consideration
• Identify unused services and reduce min (to 0 if possible)
• Tune slow services
• Provide best practices to the publishers
• Monitor resources:
- RAM and committed memory
- CPU
- Network latency
All available as part of System Monitor, https://systemmonitoring-emcs.esri.com/ (esridemo/esridemo)
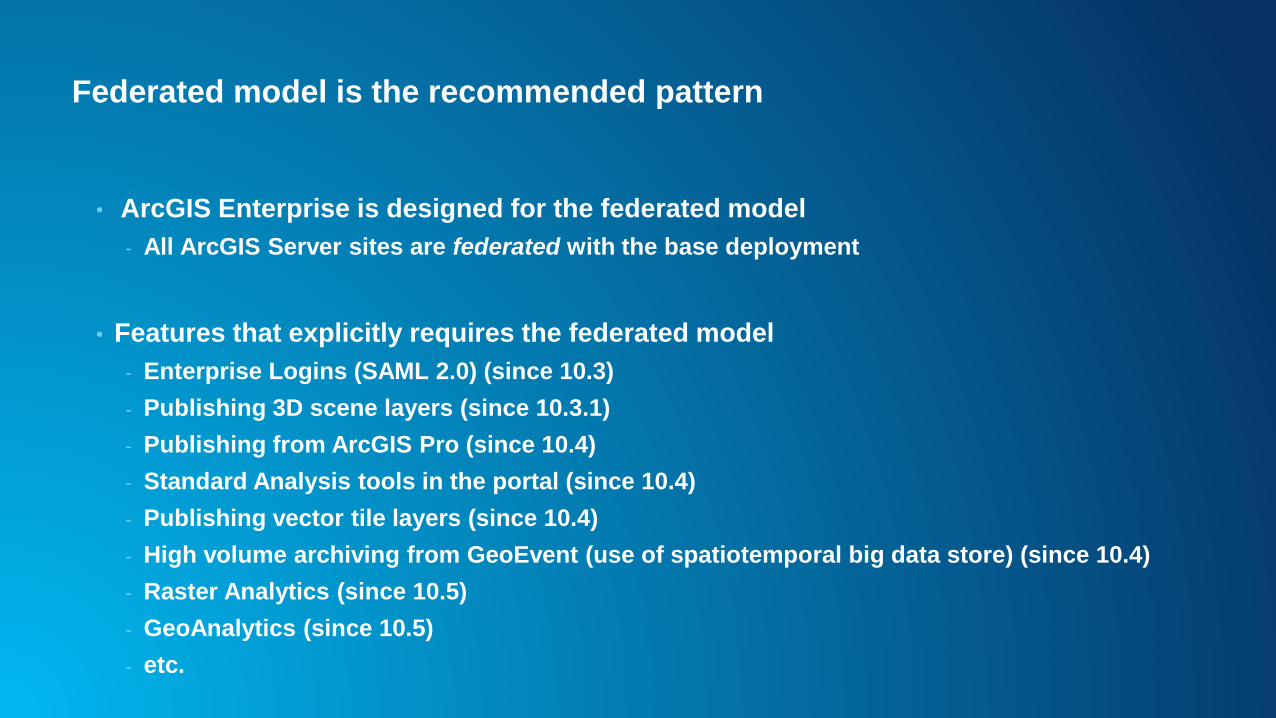
Federated model is the recommended pattern
• ArcGIS Enterprise is designed for the federated model
- All ArcGIS Server sites are federated with the base deployment
• Features that explicitly requires the federated model
- Enterprise Logins (SAML 2.0) (since 10.3)
- Publishing 3D scene layers (since 10.3.1)
- Publishing from ArcGIS Pro (since 10.4)
- Standard Analysis tools in the portal (since 10.4)
- Publishing vector tile layers (since 10.4)
- High volume archiving from GeoEvent (use of spatiotemporal big data store) (since 10.4)
- Raster Analytics (since 10.5)
- GeoAnalytics (since 10.5)
- etc.
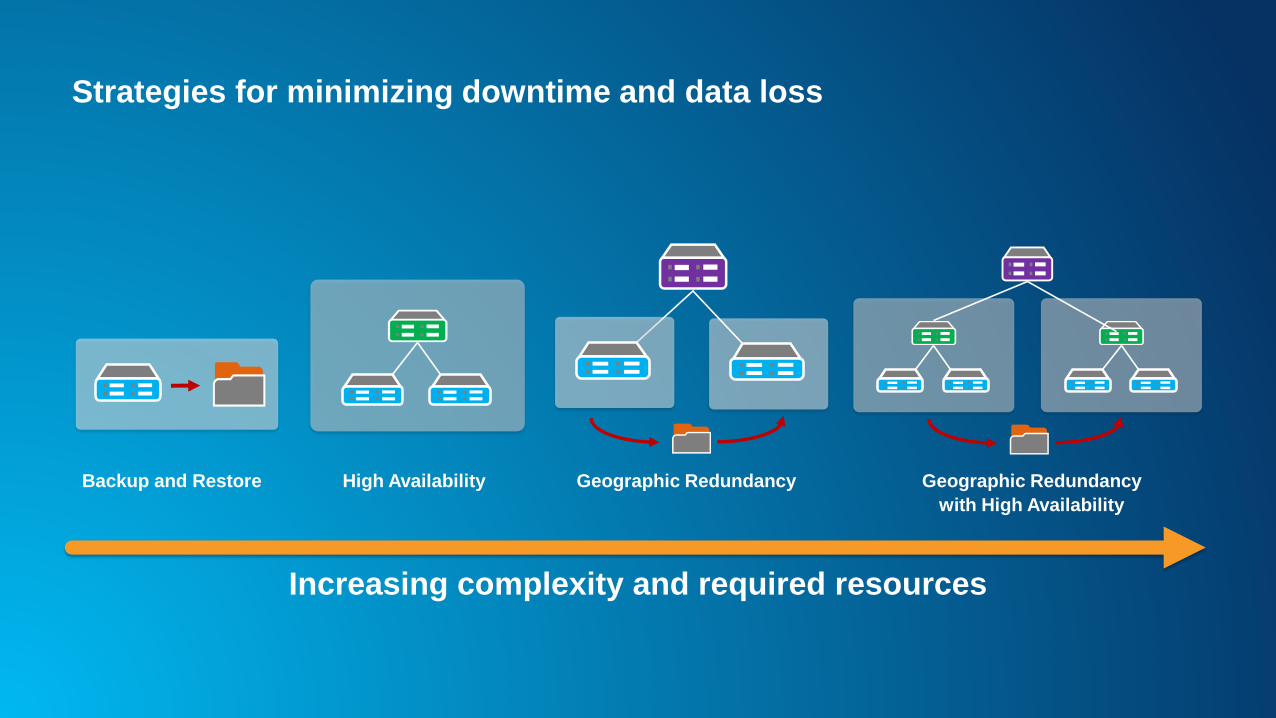
Strategies for minimizing downtime and data loss
Backup and Restore High Availability Geographic Redundancy Geographic Redundancy
with High Availability
Increasing complexity and required resources

Scaling and
workload
separation

Visualization Analysis &
Data Management
Imagery
LBLBLB
ArcGIS Server ArcGIS Server ArcGIS Server
Visualization &
Imagery
LB
ArcGIS Server
Initial Deployment Complete GIS
Workload Separation

Server Roles
• Follow best practices on workload separation and assign only one server role per
ArcGIS Server site
• If small site and consider combining multiple server roles in a single site:
- Be careful combining GIS Server role with other server roles
- Be careful combining Image Server role with other server roles
- Avoid combining GeoEvent Server role with other server roles
- Never combine GeoAnalytics Server role with any other server role

Scaling the base ArcGIS Enterprise deployment
• Conduct capacity planning and testing
• Add machine to hosting server as needed, especially when using:
• Spatial analysis tools
- http://server.arcgis.com/en/portal/latest/administer/windows/configure-the-portal-to-
perform-analysis.htm
• Insights for ArcGIS
- http://server.arcgis.com/en/insights/latest/administer/windows/configure-the-portal-to-
support-insights-for-arcgis.htm

Sizing, testing
and monitoring:
process and
tools
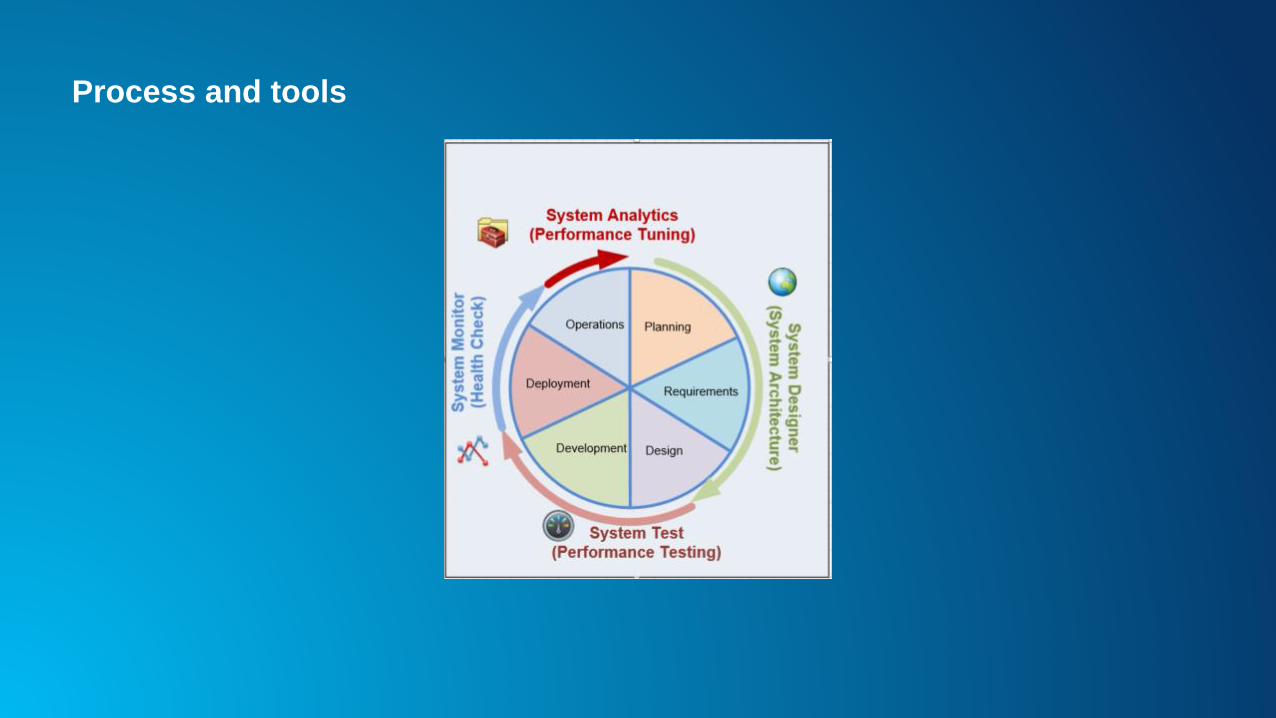
Process and tools

Relationship between System Tools
User Load
CPU%
Capacity
models
Performance Tests

Infrastructure
Capacity Planning

Provide sufficient hardware resources
GIS Systems are bound by:
1. CPU - typically
2. Memory – when large number of services
3. Disk – Image Service, Synchronization
4. Network – low bandwidth deployment
5. Poorly configured virtualization can result in 30% or higher performance degradation
Most systems are CPU bound
Most well-configured and tuned GIS systems are CPU bound.

CPU capacity
1. User load: Concurrent users or throughput
2. Operation CPU service time (model)—performance
3. CPU SpecRate
subscript t = target
subscript b = benchmark
ST = CPU service time
TH = throughput
%CPU = percent CPU

• Required bandwidth
- Response size
- Number of transactions
• Network transport time
• Response size
• Effective bandwidth
Network capacityNetwork transport time
All Built into System Designer
3600
/ reqMbitsTHMbps
usedMbpsMbps
reqMbitsTransport
/(sec)

System DesignerSolution Architecture design methodology
• Gathering requirements
• Designing
• Capacity: CPU, Network, Memory
• Reporting

Quick Capacity Report
• High-level summary for Rough Order of Magnitude

Performance Testing

Testing process
Application
GIS Services
Infrastructure: Hardware and Software

Test tools feature comparison
Tool Cost Learning
Curve
OS Metrics GIS Data
Generation
GIS Test
Automation
Load Runner High High Windows/Linux No No
Visual Studio Medium High Windows No No
JMeter Free High Requires additional
plugin
No No
System Test Free Low Windows/Linux Yes Yes
Tech Support by Esri PS as part of consulting support

System Test Tool features

Performance testingValue
• Identify bottlenecks
• Determine system capacity
• Demonstrate performance SLA

System Monitoring

Monitoring Enterprise GISChallenges
• Multiple administrators
• Multiple disparate monitoring/diagnostic tools
• Data collected in a reactive fashion: on demand and for limited time
• Correlation of data with different timestamp is difficult
• ArcGIS administrators do not have access to all tools, data and reports
• Challenging to quickly identify the root cause and take appropriate measures

• Many excellent monitoring tools on the market
• Few provide GIS dashboards
• System Monitor can be used as reference implementation
Standards for effective GIS monitoring

Enterprise GIS effective monitoring“PIECE” of mind with System Monitor
• Proactive
• Integrated
- Dashboards across all tiers
• End-to-End
- All tier monitoring
• Continuous
- %Coverage provided
• Extendable
- Custom queries
Network
Hardware
Web Server
ArcGIS Server
Geodatabase
RDBMS

Use cases

Impact of maintenance window
folder Service Avg(sec) Max(sec) Date Hour Weekday Comments
CENSUS_EXT CD_ACS_5Y13 81.68 326.73 2016-04-23 03:00:00-07:00 3 Saturday Investigate slow response times.
CENSUS_EXT UCUV_DC_2010 80.77 323.08 2016-04-23 03:00:00-07:00 3 Saturday Investigate slow response times.
CENSUS_EXT UVDA_ACS_5Y13 80.25 320.8 2016-04-23 03:00:00-07:00 3 Saturday Investigate slow response times.
CBO SP_CBO_LOCATOR 75.61 302.43 2016-04-23 03:00:00-07:00 3 Saturday Investigate slow response times.
COP WM_COPEditLayersSDOT 75.45 301.8 2016-04-23 03:00:00-07:00 3 Saturday Investigate slow response times.
DEEL_EXT SP_PreK 74.06 296.23 2016-04-23 03:00:00-07:00 3 Saturday Investigate slow response times.
COP WM_COPEditLayersWTR 72.48 289.93 2016-04-23 03:00:00-07:00 3 Saturday Investigate slow response times.
DPD_EXT WM_CouncilDistricts 72.47 289.9 2016-04-23 03:00:00-07:00 3 Saturday Investigate slow response times.
System Monitor Excel Report
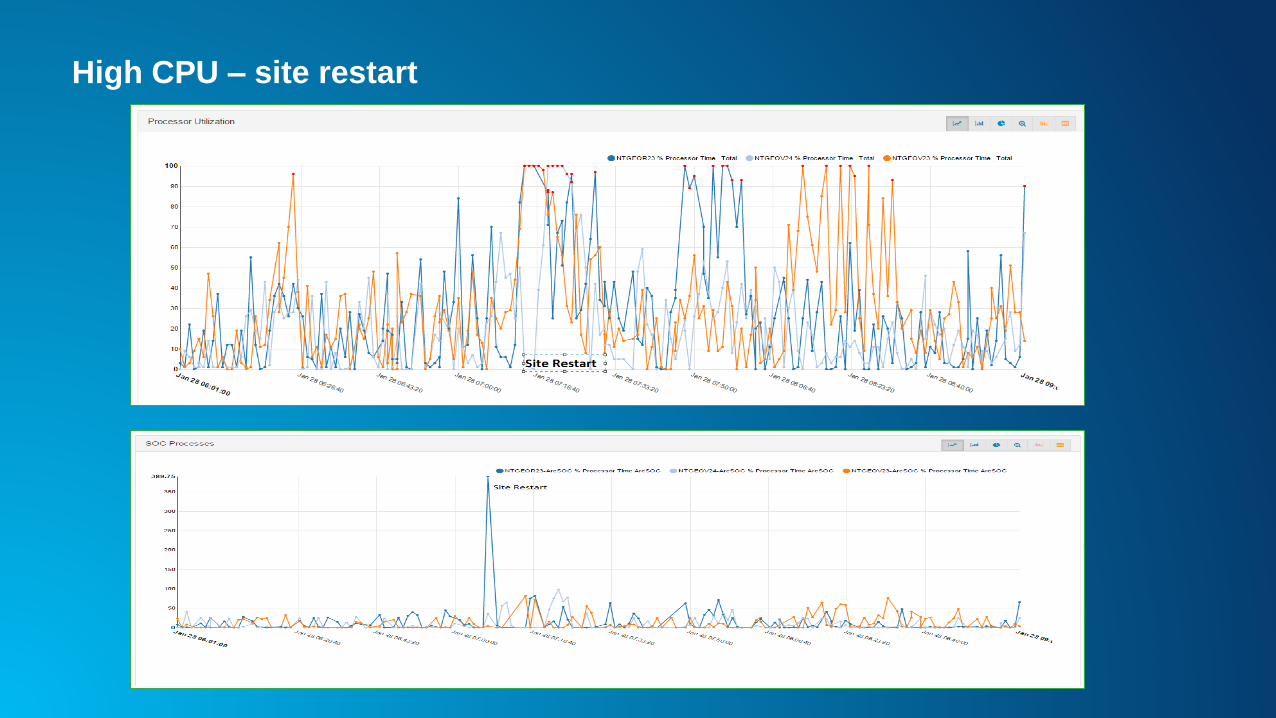
High CPU – site restart

Monitor memory and ArcGIS Server instances
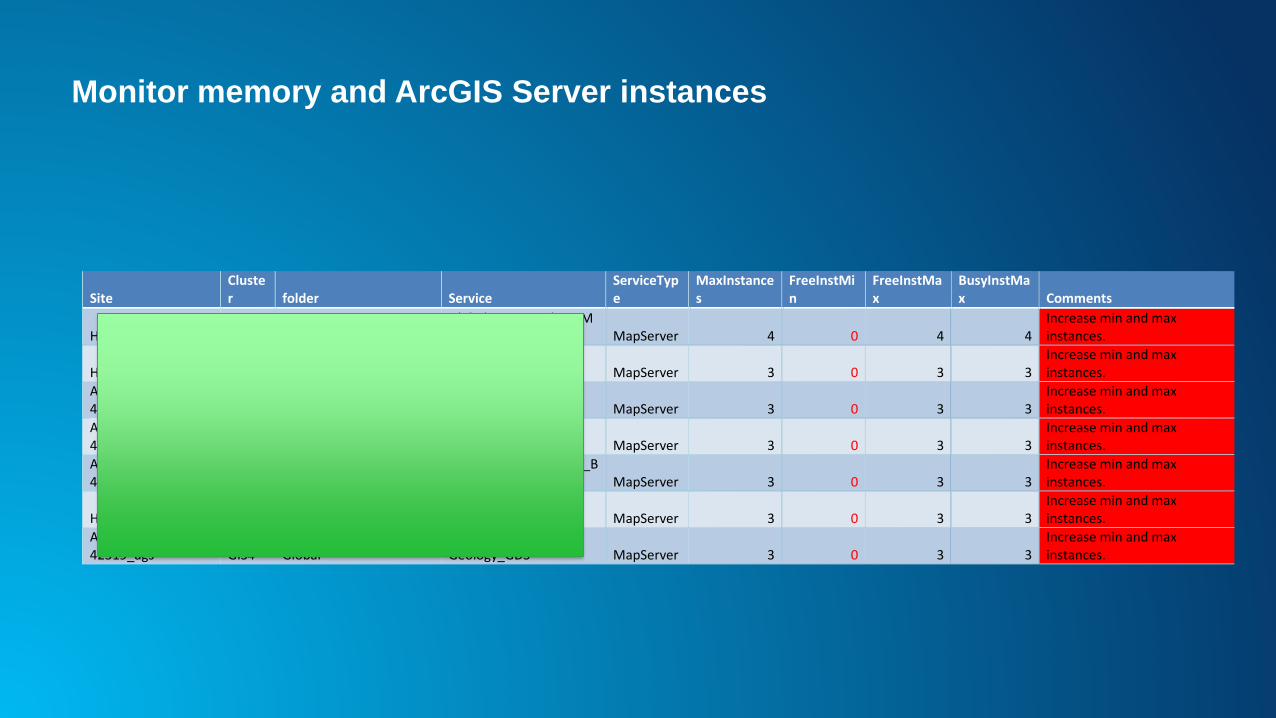
Monitor memory and ArcGIS Server instances
Site Cluster folder Service
ServiceType
MaxInstances
FreeInstMin
FreeInstMax
BusyInstMax Comments
HOUIC-S-10495_ags GIS1 Apps Global_PortsBerths_GMAS MapServer 4 0 4 4
Increase min and max instances.
HOUIC-S-10495_ags GIS1 Alaska AssetTracking_Shell MapServer 3 0 3 3 Increase min and max instances.
AMSDC1-S-42319_ags GIS3 Global 2D_Portal_Wells_CDS MapServer 3 0 3 3
Increase min and max instances.
AMSDC1-S-42319_ags GIS3 Global 2D_Portal_Wells_IHS MapServer 3 0 3 3
Increase min and max instances.
AMSDC1-S-42319_ags GIS5 UIE_BUSINESS
UIE_ENVIRONMENTAL_BIZ MapServer 3 0 3 3
Increase min and max instances.
HOUIC-S-10495_ags GIS1 Administrative_Boundaries USA_LandGrid_TOBIN MapServer 3 0 3 3
Increase min and max instances.
AMSDC1-S-42319_ags GIS4 Global Geology_GDS MapServer 3 0 3 3
Increase min and max instances.

Monitor memory and ArcGIS Server instances
• Resource(s) limiting the performance or capacity
No bottleneck bottleneckThink of :
Lanes -as CPU processor
Toll -as ArcGIS Server instances
Cars -as map requests
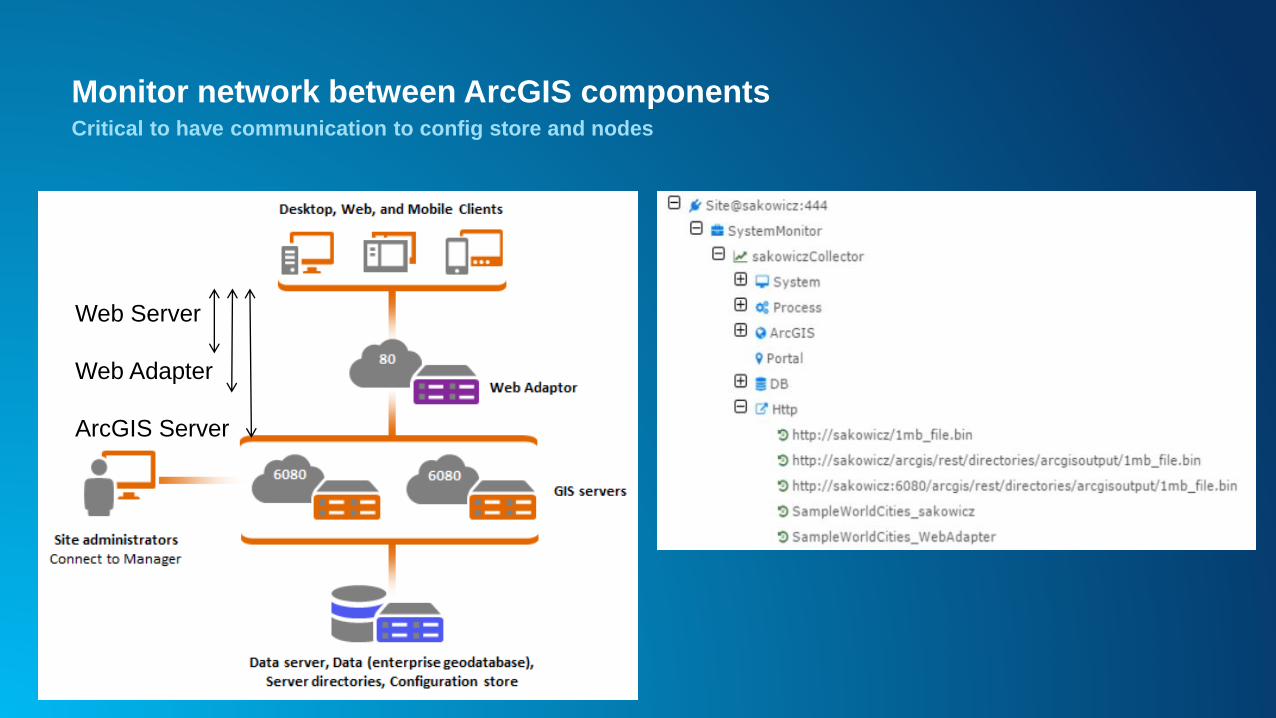
Monitor network between ArcGIS componentsCritical to have communication to config store and nodes
Web Server
Web Adapter
ArcGIS Server

Network fluctuationThis site experienced periodical instability

Monitor virtual resource in ArcGIS EnterpriseAvoid over allocation and live migration of running virtual machines during work hours

Enterprise Implementation Maturity Model
Level Architectural
Design and
Capacity Planning
Performance and
Scalability Testing
Monitoring Trend Analysis
and
Quantification
0 No No No No
1 Yes No No No
2 Yes Yes No No
3 Yes Yes Yes No
4 Yes Yes Yes Yes

How to get these tools
• https://systemmonitoring-emcs.esri.com/apps
System Monitor 3.0 available through Professional Services engagement. Contact your or account management

NOAA National Weather Service IDP GIS Program
• Disseminate NOAA geospatial data and products in industry-standard formats on
appropriate infrastructure
• Platform as a Service (Paas) available to NOAA Data Stewards
• 24 x 7 High Availability (HA) infrastructure for critical weather and decision
support datasets
• Service Level Agreement (SLA)
• Dedicated staffing and resources with tiered support model across GIS, IT, and
weather information\forecasting domains

Requirements and Challenges
• FISMA High
• High availability
• Fault Tolerance
• Scalability in a context of event driven traffic spikes
• Performance
• Security (NIST)
• Interoperability
• Continuously updating data feeds
• Hosted content

Technical and Organizational Complexity
• Hybrid architectures integrating COTS and Open Source technologies
• RHEL virtualized data center managed using Puppet Labs software
• Domain expertise, system accesses, and roles are split between multiple
organizations and multiple domains (IT, GIS, Weather)
• GIS content often developed externally and provided to the IDP GIS Technical Team for
reconfiguration and implementation on IDP infrastructure
• Translate numerical models in scientific data formats into GIS data/services
• Multiple data centers

Live Data
Service Update Frequency Performance
Workflow
Nominal Map/Image requests (Est) Peak
Map/Image requests (Est)
Watches\Warnings and
Advisories
1 minute \
10 minutes
Light Vector 10K Hr 100K Hr
Daily Global Precipitation Daily Light Raster 1K Hr 10K Hr
Radar (1x1 km base reflectivity) 5 minutes Light Raster 20K Hr 200K Hr
NDFD Temperature 15 minutes
1 hour
Heavy Raster 1K Hr 20K Hr
Hurricane Tracks/Wind/Surge 10 minutes or less Light Vector 1K Hr 100K Hr
AHPS gauges 15 minutes Light Vector 1K Hr 10K Hr
Flood Outlook Product Daily Light Vector 1K Hr 10K Hr
CPC Weather Hazards Daily Light Vector 10K Hr 100K Hr
Quantitative Precipitation
Forecast (QPF)
15 minutes Light Vector 1K Hr 10K Hr
Weather Features Daily Light Raster 1K Hr 10K Hr
Sea Surface Temp Daily Light Raster 1K Hr 10K Hr
NDFD Wind Velocity Forecasts 1 hour Light Raster 1K Hr 10K Hr

Best Practice: Leverage System Tools
… As a Practice
SystemDesigner
SystemTest
SystemMonitor

Lots of Moving Parts

Why We need Testing and Monitoring
Tools
• Build confidence that our system design can meet our functional and operational
requirements. Develop metrics using Key Performance Indicators (KPI).
• Demonstrate achievement of operational requirements and/or SLA’s.
• Enable effective response to unplanned outages, scale for event driven traffic spikes, and
ensure that support tickets get directed to the proper technical domain.
• Incorporate new content without breaking existing services.
• Metrics driven continuous improvement.
• Enforce best practices on sponsored content.
• Isolate and correct poorly performing services.
• Allocate resources and funds optimally.
• Reduce risk.

Testing and Monitoring
• Onboarding QA of new services provided by external sponsors
• System architecture and capacity planning
- Service level unit testing
- Site/System level load testing
- Scenario / failover testing
• Monitoring KPI to inform system configuration tuning and capacity planning decisions
• Monitoring alerts to identify, prevent, and quickly resolve outages on critical decision
support services
- Computing Infrastructure
- GIS web services
- Live data feeds – must ensure data currency
• Continuous monitoring provides shared awareness that allows for effective
communication and coordination between different stakeholders

Tools
• Big Brother (NOAA internal system of record)
• Nagios Check MK (SA’s system of ‘preference’)
• System Monitor
• System Test
• JMeter
• mxdperfstat
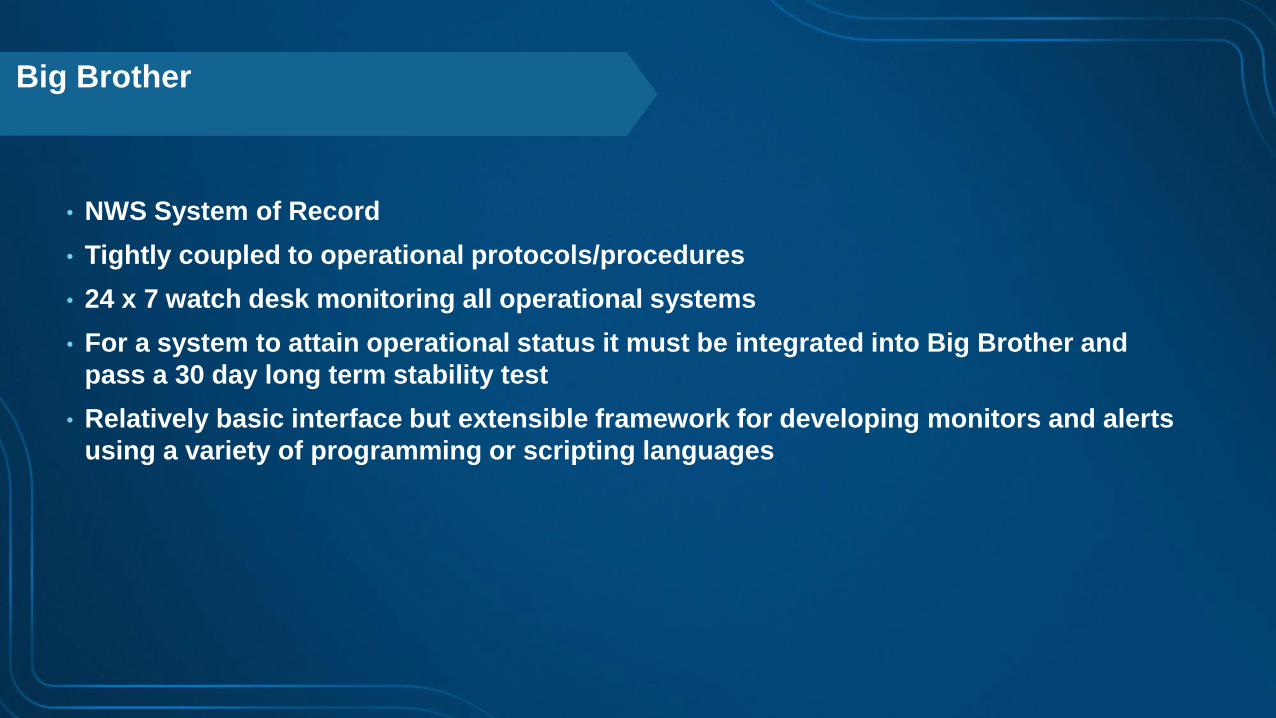
Big Brother
• NWS System of Record
• Tightly coupled to operational protocols/procedures
• 24 x 7 watch desk monitoring all operational systems
• For a system to attain operational status it must be integrated into Big Brother and
pass a 30 day long term stability test
• Relatively basic interface but extensible framework for developing monitors and alerts
using a variety of programming or scripting languages

Big Brother

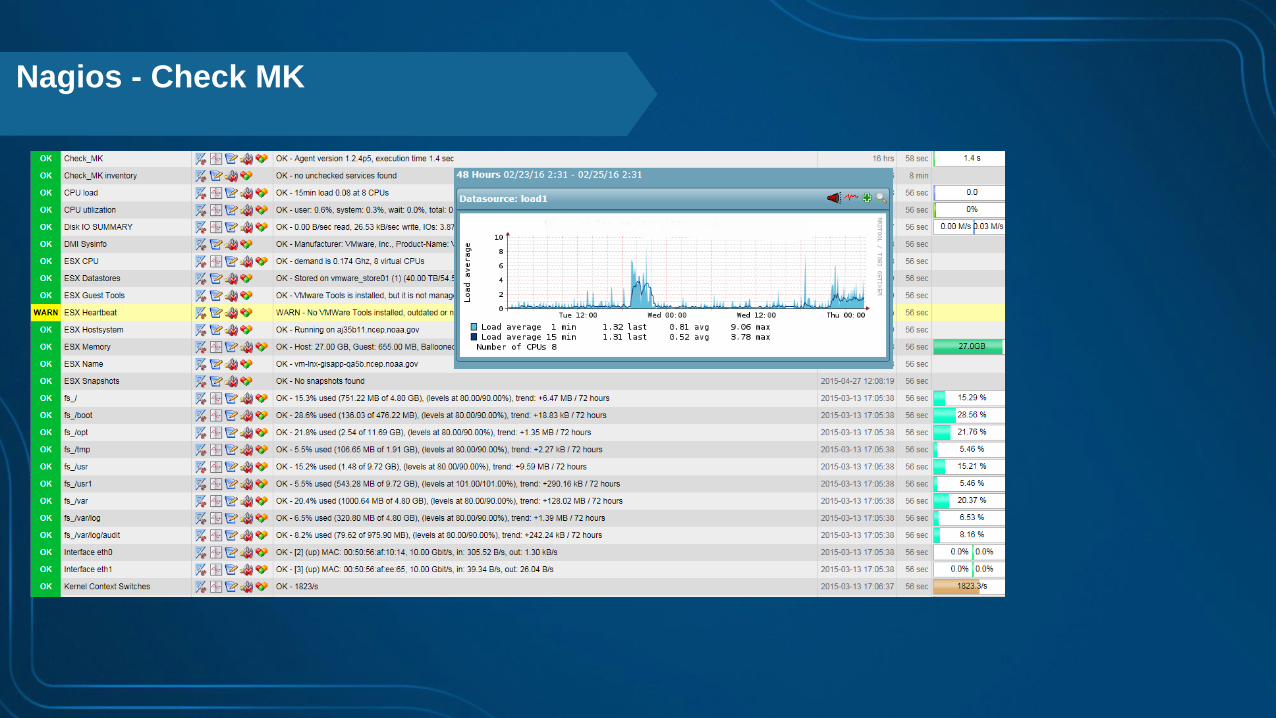
Nagios - Check MK
• The data center SA’s system of choice for infrastructure monitoring
• Some alerting/reporting configured but primarily an ad-hoc information source for
investigating issues
• Enabled by default on most servers
• Views tied to ldap role/group membership based on ‘least privilege’ access
• Rich set of default collectors for server and file system metrics but API for developing
custom collectors has a learning curve and was only accessible to small group

Nagios - Check MK
• The data center SA’s system of choice for infrastructure monitoring
• Some alerting/reporting configured but primarily an ad-hoc information source for
investigating issues
• Enabled by default on most servers
• Views tied to ldap role/group membership based on ‘least privilege’
• Rich set of default collectors for server and file system metrics but API for developing
custom collectors has a learning curve
Nagios - Check MK

System Monitor
• Includes preconfigured GIS with domain specific Key
Performance Indicators (KPI)
• Is usually more accessible and configurable for GIS technical
teams
• Configurable reports that allow side by side viewing of system
metrics alongside GIS metrics

System Monitor
GIS Server/Service Key Performance Indicators (KPI)

System Monitor (Reports)
• Tr/Sec
• Free

System Monitor (Reports)
• CPU
• Mem

System Test
• Individually test services that we expect to receive high traffic to define a service
throughput baseline given a certain min/max instance configuration
• Load test groups of servers and services to establish a system baseline to given a
specific set of services and servers (e.g. a ‘half stack’ test of max throughput for a set
of services associated with a scenario such as a tropical storm or major snowfall)
• Investigate/analyze performance for services that have been alerting as slow or non-
responsive in Big Brother
• Develop test extents/parameter files to be exported using custom python scripts so
that they can be configured in long running system wide load tests performed by the
SA’s using JMeter

System Test

System Test

System Test

System Test

System Test

System Test

System Test

System Test

System Test

JMeter
• NWS data center is primarily a linux environment
• SA’s ultimately responsible for system wide load testing were more comfortable with
Linux tools
• Limited access to Windows systems
• Conducted system wide load testing using JMeter (with parameter input generated in
System Test) and cross referenced results to System Test

JMeter

mxdperfstat
• Been around for a while and still very useful
• Easy to batch script
• All service sponsor provided map documents were tested using mxdperfstat to
identify cases where poor configuration could impact server performance

mxdperfstat
• 1.6 seconds may not seem horrible but this service is
expected to see very heavy traffic and accounts for 6
instances on 8 servers.
• Improvements to the cartography could make a noticeable
difference in overall server performance and/or free
resources for other services

Q & A

Please Take Our Survey on the Esri Events App!
Select the session
you attended
Scroll down to find
the survey
Complete Answers
and Select “Submit”
Download the Esri Events
app and find your event

Print Your Certificate of Attendance
Print stations located in the 140 Concourse
Monday
12:30 PM – 6:30 PM
GIS Solutions Expo,
Hall B
5:15 PM– 6:30 PM
Expo Social,
Hall B
Tuesday
10:45 AM– 5:15 PM
GIS Solutions Expo,
Hall B
6:30 PM– 9:30 PM
Networking Reception,
Smithsonian National Air
and Space Museum