Embed Size (px)
Citation preview
©LSE, 2009 1
Patrik Kärrberg Jonathan Liebenau
London School of Economics November, 2009
First Interim Report on
LSE-Dell Research
Enterprise Efficiency in the Use of ICT in China, France, Germany, Great Britain, India, Japan & the USA
1. Introduction ..................................................................................................................................1 Overview of the study ..................................................................................................................2 Features of this research and problems ........................................................................................2
2. Methodology ................................................................................................................................3 Introduction ..................................................................................................................................3 Hypotheses ...................................................................................................................................4 Data ..............................................................................................................................................6 The survey ....................................................................................................................................6 Cases.............................................................................................................................................6
3. Interpretation of statistical results ................................................................................................7 Further statistical analyses .........................................................................................................15
4. Qualitative analyses of interviews.............................................................................................19 Interview evidence .....................................................................................................................19
5. Conclusions and Discussion......................................................................................................24 Main initial findings ...................................................................................................................24
Appendices:....................................................................................................................................26
1. Introduction Information and communication technologies continue to make businesses more efficient in the conduct of key tasks as well as more productive overall. When aggregated, we can see that this effect is apparent over the past fifteen years, but even before that the boosts to enterprise efficiency have taken place more in the manner of punctuated equilibrium, rather than smooth growth. Under the current conditions of economic downturn, enterprises consider cutting back on capital expenditure and delay systems upgrades. They also consider the balance between allocating resources for IT department expenditures internally versus utilizing outsourcing. In this corporate search for efficiency, regional demand interplays with global economic trends in shaping the future environment for IT tools.
©LSE, 2009 2
The ultimate goals of this research project, which will be reported on in the final papers next year, include an analysis of the relationships among the efficient utilization of ICT, the perceptions of respondents, and the identifiable business results of efforts to improve efficiency. We anticipate that this will provide new, and surprising, evidence of what goes in to making enterprises efficient in many sectors, worldwide. In the course of this research we will look to identify the key factors, or innovations, or areas of technology application within large enterprises that are propelling efficiency. We will endeavor to put these factors into the context of trends over time and economy-related insights. In this first of three preliminary reports we describe the state of our research at this early stage and indicative results, we present data from the initial survey, and we discuss how we intend to conduct the follow-up studies and future activities with subsequent questionnaires and analyses. As the present data analyses are based on only the data collected to date (the first survey), we do not regard the reported statistical findings to be definitive. Their accuracy will improve only after further data are collected and we anticipate that many results of this initial analysis, even where apparently statistically significant, will alter. For example, rankings of preferences in the use of ICT, international comparisons and league tables, priorities relating to sources of efficiency, etc. are all likely to change as data from the subsequent two planned studies are accumulated. We anticipate this to be the case not withstanding the effect of longitudinal tracking of changing opinions. In addition to the initial survey results and interviews, we draw on experiences from past management surveys. This provides us with the first points in an analysis of how innovation in technology affects organizational forms and behaviors, managerial dilemmas when driving efficiency, the interaction with technical architectures, sources of “IT waste”, and how these factors shape management decisions in leading corporations around the world.
Overview of the study This initial stage of the research has been comprised of four elements:
1. Scholarly consideration of the components of enterprise efficiency, taking into account applied economics, management theory, and especially the research literature pertinent to organizational utilization of ICT, including our own studies.
2. A series of interviews with executives responsible for ICT implementation, management, procurement, etc. in enterprises across each of the seven countries under study. We have followed up on some of these interviews to take into consideration the relationship between claimed commercial results and reported firm performance.
3. A survey of responsible executives (see Appendix I). 4. The analysis of the survey results, including statistical analysis where sampling data are
sufficient. As this is the first of three planned iterations of these four elements, we have designed the research such that it benefits from the cumulative results, especially with regard to the accumulation of further survey data and additional interviews.
Features of this research and problems Some features of information and communication technology lend themselves to scale economies and network externalities while others do not. There are also a variety of contextual features that
©LSE, 2009 3
affect opportunities to exploit scale in the search for efficiency. For example, features of labor markets including the availability of sufficiently skilled employees, incentives structures and mobility, can encourage or constrain ambitions to expand scale. Similarly, the overall size of the economy and the willingness of people and companies to spend on new ICT can constrain growth (clearly evidenced during times of economic downturn and resultant unemployment). The ever-present tensions between the need for systems to operate with standards, norms and stable conventions, and the need to innovate create a further set of problems that the ICT industry has always to negotiate. This will grow as a problem as more elements of the ICT industry become commoditized during the process of extending the reach and ubiquity of digital technologies. As innovations shift between those based on mechanisms and those based on services and applications, we will see more, and more non-standard, business models and efforts to exploit changing opportunities. It is these aspects of ICT use in enterprises that we are in the process of uncovering. We present the evidence here in four categories, addressing questions of efficiency, scale, innovation and waste. The new era of ICT is most often assessed in terms of the technologies, their costs and the willingness of organizations to adopt them. We see this in the form of a dynamic set of relationships among social and economic forces in the context of government practices and business interests. Using tools of data analysis and econometrics along with policy analysis and studies of business strategy, we approach this topic from a variety of points of view to take into account the behavior of networks and systems, and the unique features of IT as a core element of economic and social infrastructure.
2. Methodology
Introduction In this overview of the statistical characteristics of the survey we will be undertaking, we present the broad outline of the study, a rough description of the survey instrument, a comment on how that relates to the key hypotheses, and a note about how the statistical material might be used in conjunction with descriptive evidence and case analyses. At the outset we have had to recognize that people have highly varying views about their own efficiency, and indeed that where measures are used, they differ dramatically. For this reason we approach questions of efficiency indirectly, building a construct based on self-perceptions, comparisons with peers, behaviors directly and indirectly associated with efficiency, and proxies of various kinds.
©LSE, 2009 4
Hypotheses We have constructed the survey to explore a series of interlinked hypotheses about how ICT affects the efficiency of large enterprises. These hypotheses include:
• Some specific enterprise applications of ICT are perceived to affect efficiency • Countries matter; productivity is affected by the national context and enterprises can be
judged as to their achievable efficiency in relation to their national as well as industry peers
• Companies can learn over time how to use ICT more efficiently • Efficiency is related to innovative capabilities • Efficiency is related to enterprise scale • Flexibility is more possible with efficient use of ICT
Each of these hypotheses is further broken down into testable statements such that they are related to all of the data collected. However, we remain flexible as to whether more hypotheses should be added—and indeed whether the questionnaire should be modified for future applications. Each response is scored in a manner that will allow for proper testing of one or more testable statements. We also hope to be able to retain sufficient “raw” data such that we might recognize unanticipated findings, including interaction effects or surprising null hypotheses. The results described below were generated from a range of standard statistical tests on the data output, including descriptive analyses, test of significance, scale reliability, and inter-variable correlations. As the survey is to be repeated over the coming months trend analyses will be conducted at subsequent data collections to investigate learning effects, altered responses due to changes in the economic climate, and available technologies, to name a few. A graphical overview of how the hypotheses are connected to the concepts of research, the sub-concepts (representing the sections in the survey) and respective indicators (representing the survey questions) are given below:

©LSE, 2009 5
CONCEPT TO RESEARCH RELATED SUB-CONCEPTS IN THE MODEL Perceived Efficiency in the Large Enterprise due to IT Efficiency relating to IT organization and strategy Efficiency relating to innovation efforts Efficiency relating to scale and flexibility efforts Efficiency relating to efforts limiting IT waste
Table: Overview of the sub-concepts and its indicators SUB-CONCEPT (SECTIONS IN THE SURVEY) INDICATOR (QUESTIONS IN THE SURVEY) Efficiency relating to IT organization & strategy Main goals of IT organization strategy Basic performance compared to competitor Value the firm gets from IT How close the firm is to efficient spending on IT How does the firm measure ROI on IT From whom is increased support expected How important are certain efficiency efforts Efficiency relating to innovation efforts Technology areas promoting enterprise innovation What affiliations the firm drafts for innovation efforts Role of suppliers in promoting innovation Role of clients in promoting innovation Efficiency relating to scale and flexibility efforts General role of IT for scale and flexibility Available excess capacity in business & IT How is this excess capacity valued Approach of firm when expanding technology use Role of IT for strategic scale decisions Limitations to the firm’s growth Efficiency relating to efforts limiting IT waste How problematic is IT waste in certain areas Potential savings from IT waste reduction Within what functional areas is IT waste abundant What factors encourage effective IT usage
Innovation efforts Scale and flexibility Limiting IT waste
Conceptual structure of “efficiency” in the firm
Efficiency
in large firms
due to IT
IT organisation and strategy Innovation efforts Scale and flexibility Limiting IT waste
Conceptual structure of “efficiency” in the firm
Efficiency
in large firms
due to IT
IT organisation and strategy
INDICATORS
SUB-CONCEPTS
CONCEPT TO RESEARCH
©LSE, 2009 6
Data The first stage of research conducted over the course of two months, takes into account over 250 completed surveys and 15 in-depth telephone interviews.
• Population: we sought out respondents and interviewees from among senior executives and other responsible managers within some of the largest enterprises in each of the seven countries.
• Response rates: response rates have differed dramatically between responses to requests for interviews and completion of questionnaires. In some countries, larger numbers of requests to respond to the survey were needed to generate the sought-after sample-size than for others. In contrast, firms in most countries that were contacted for telephone interviews responded very well, with the exception of Germany.
• Data quality: For the sake of data integrity we report only on completed surveys (total completed surveys = 209). Future surveys will allow us to cross-check in various ways indicators of the veracity of groups of answers
The survey The survey is designed to address a small number of hypotheses concerning the relationships between enterprise use of ICT and efficiency, as described above. The corollaries to these hypotheses include issues about the character of scale and the effect upon innovative capabilities. These hypotheses will also be investigated in relation to other primary and secondary material, including the scholarly literature on ICT use in large enterprises. They will also contribute to our investigation of a small number of case studies. The survey has been administered to large enterprises in seven countries and we construct a sample of around 30 respondents for each country in each data collection. Most of these company responses will be anonymous but we hope to have a small number, up to 10 for each country, where we will be able to identify the companies in order to conduct greater in-depth analysis of firm-level activities. The questionnaire is divided into four sections, including an introductory section on demographics. Each section contains 7-12 questions the majority with multiple sub-questions. Question formats include binary responses, rankings of lists, choices from drop-down menus, judgments presented in the form of a Lickert scale, and a small number of free-text responses. Each question yields roughly 5 data points, for a total over 200 data points.
Cases Although not reported in this interim report, we are in the process of supplementing the statistical material with some non-anonymized studies so that we can compare with the other data. A small number of these will be used for detailed case studies so that we can come to understand better the use of ICT, the rest will be studied on the following criteria of changing indicators taken from public sources:
• Share price/market capitalization • Number of employees • Declared profits • Turnover/productivity
©LSE, 2009 7
• Market share • Notes about new products; acquisitions; announced strategic changes, etc.
The purpose of these cases is to allow us to understand better the context of our findings, especially in regard to managerial practices and changing strategic directions.
3. Interpretation of statistical results Here we highlight some indicative findings from the research so far. The full graphical representation for each question is appended.
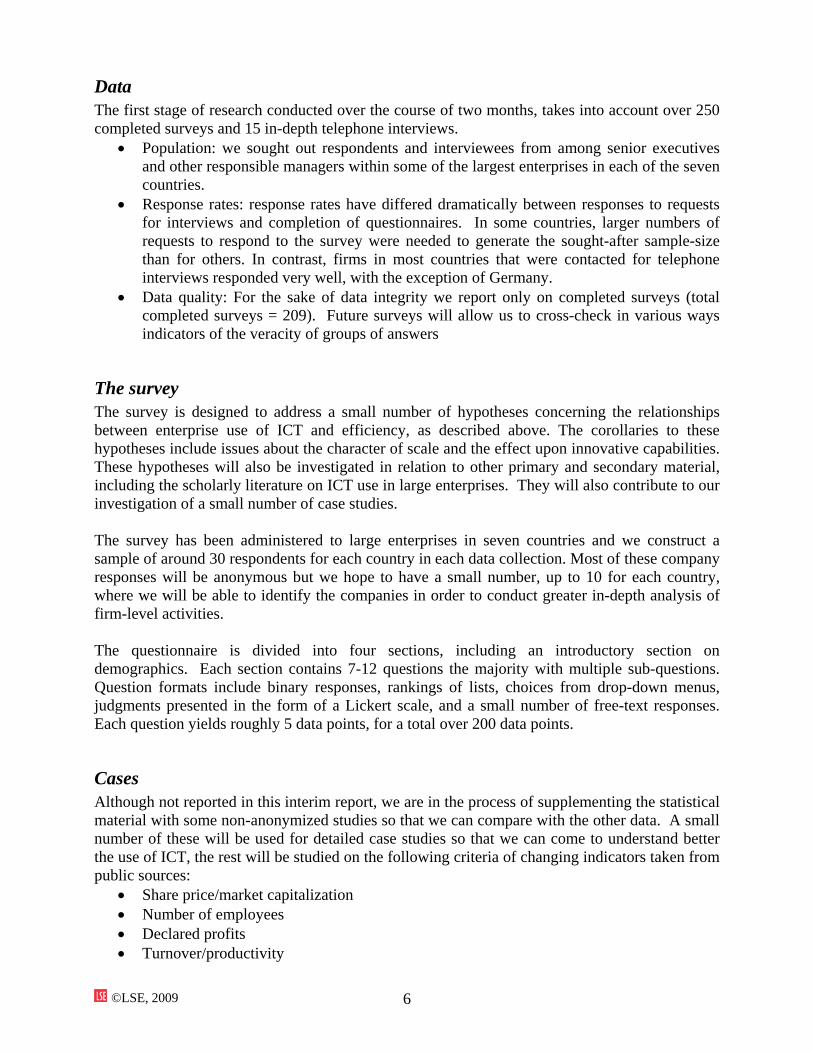
Our Sample Demographics Respondents’ country of work and residence:
• Leading economies worldwide were studied • India was included to capture its significance as
an emerging economy with heavy ICT usage • 30 complete responses were sought from each
country (one is missing from the USA)
Best description of title:
Main functional roles (up to three options):

©LSE, 2009 8
Two thirds of the executives consider their main functional roles to be in:
• IT • General management • Strategy
All others were responsible for allocating IT spending through positions in finance, procurement or operations
Organization's primary industry
• Executives surveyed work in IT intensive firms • Most work in IT intensive sectors • “Others” included process industries and
companies in primary sectors
Efficiency Questions Main goals driving your organization’s IT strategy:
• After over ten years of
seemingly fruitless emphasis, information security finally emerges as a main strategy goal
• Reducing costs and improving quality follow
• Raising individuals’ productivity is high and stands in sharp contrast to “reducing headcount”, indicating that firms are not intending to raise productivity in order to save on labor expenses
©LSE, 2009 9
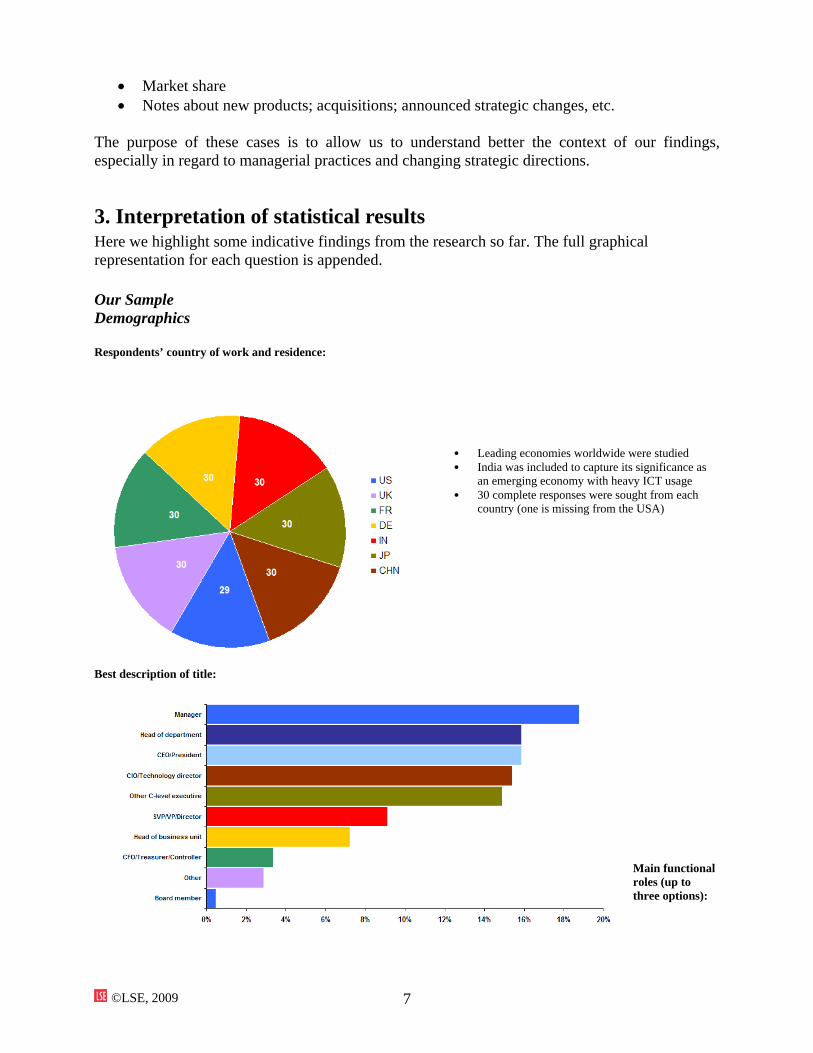
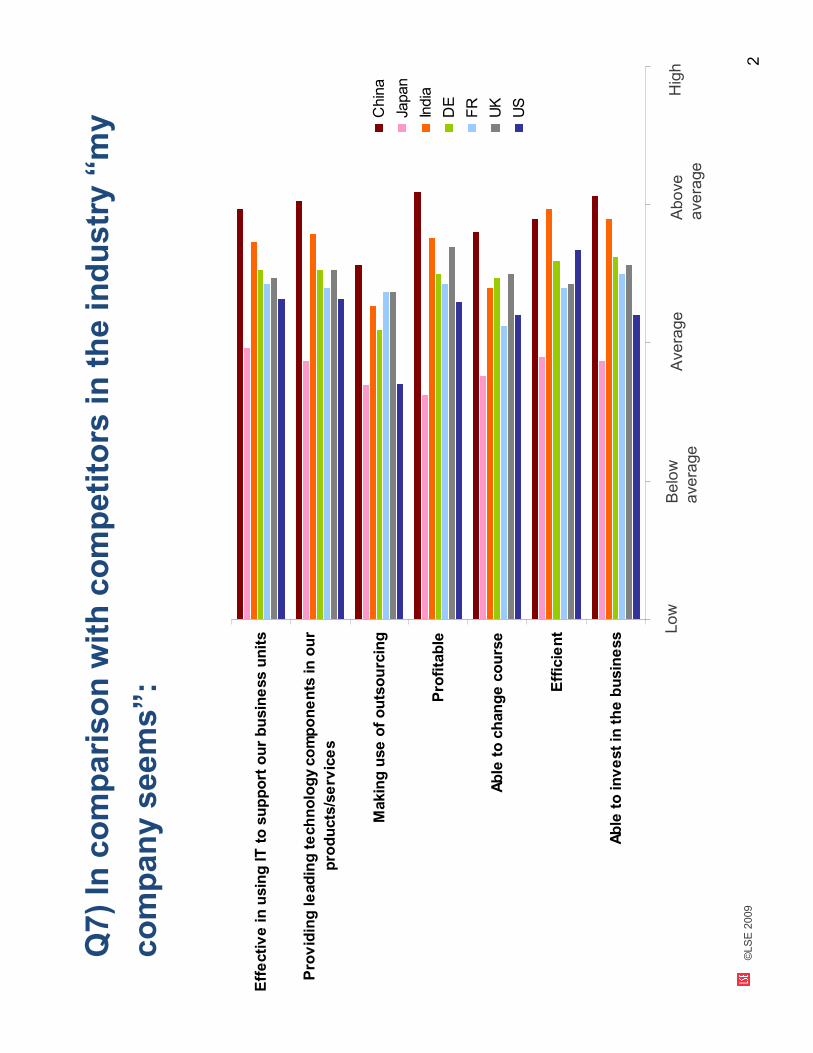
“In comparison with competitors in the industry ‘my company seems’”
• Just as is the case
when people are asked whether they are above or below average as drivers or as polite individuals, most executives rate their companies to be above average
• Evidence of insecurity is apparent with the ability “to change course”
• Less than 15% themselves to be very inefficient
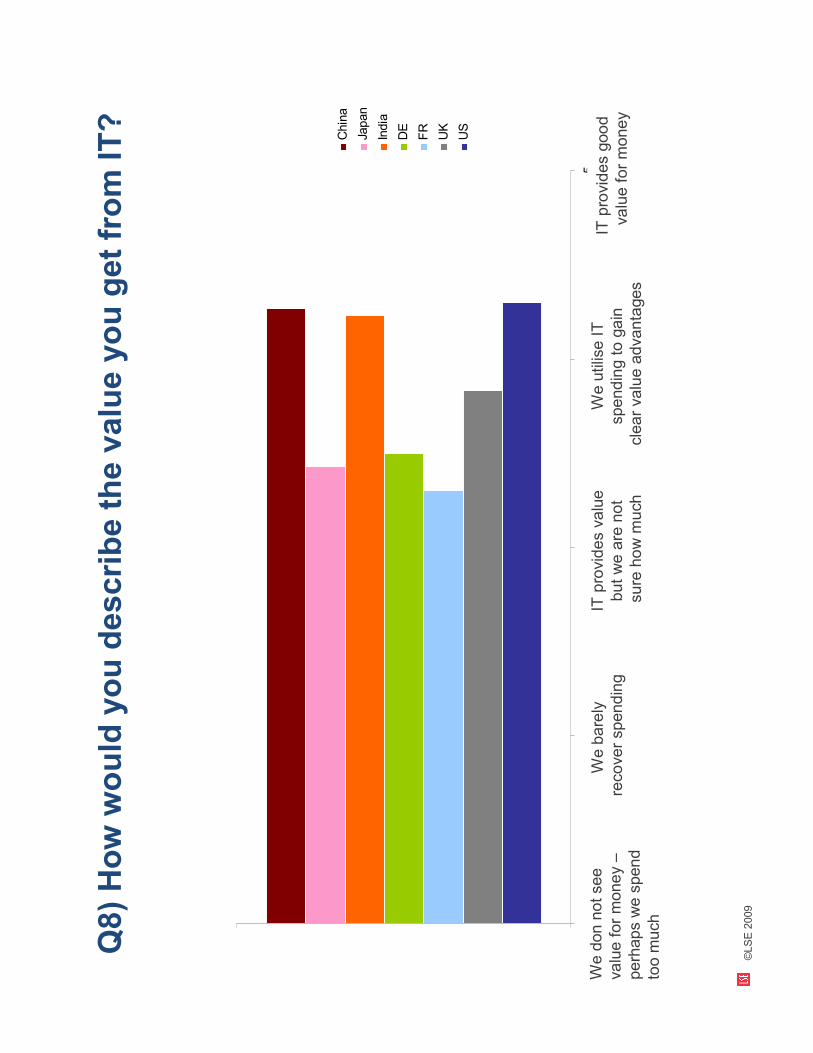
Describe the value you get from IT:
• Executives are unsure of the value they get from IT
• Only around 25% see clear value advantages
• A high proportion either do not know what the value is, or doubt that they get much out of it
Despite the variety of metrics available, it seems that most respondents neither measure nor believe in the value associated with IT.
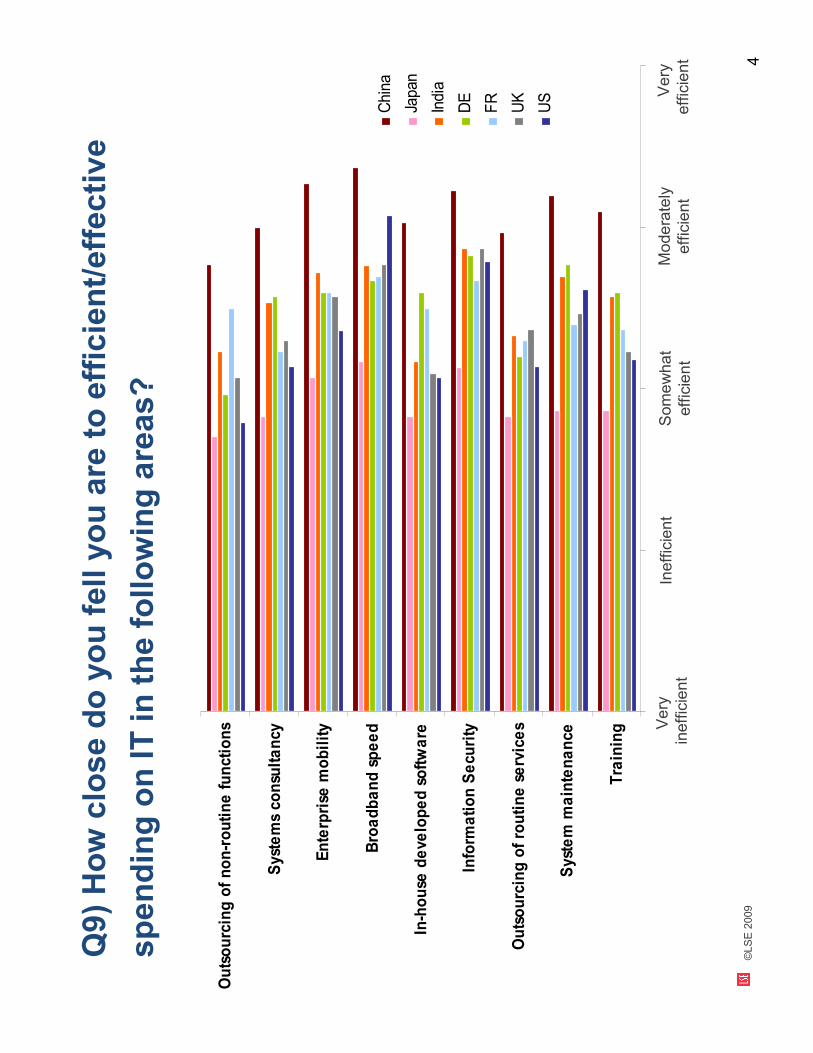
“How close do you feel you are to efficient/effective spending on IT in the following areas?”:
• High confidence in
effective spending is only shown in systems consulting
• Firms seem uncertain what broadband spending contributes to efficiency
• Outsourcing is seen to be more efficient now than in the past, and only around 10% see it as inefficient
©LSE, 2009 10
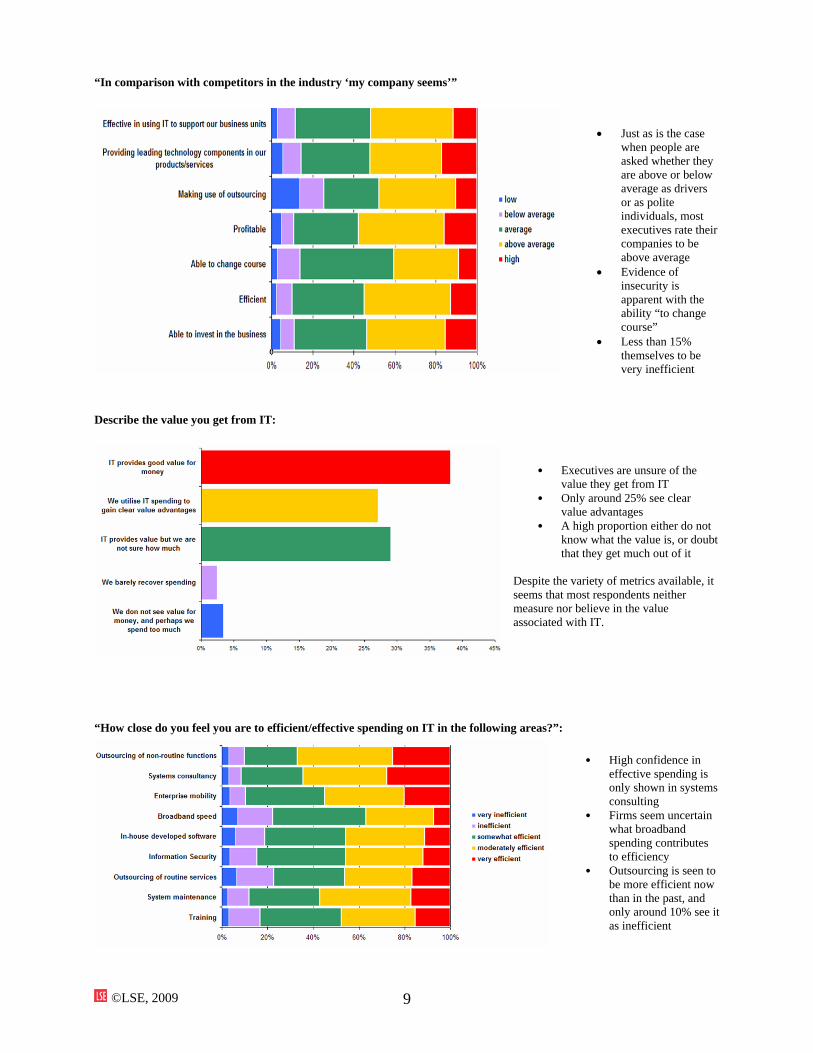
“How does your company measure returns on IT investments?”:
• Increased security as
well as reduction of costs are both seen as important measures, despite their great differences in metrics
• Raising quality seems to be commonly measured and regarded as a benefit from IT investments
• Productivity advantages are once again seen to be disassociated from any ambition to reduce the number of employees
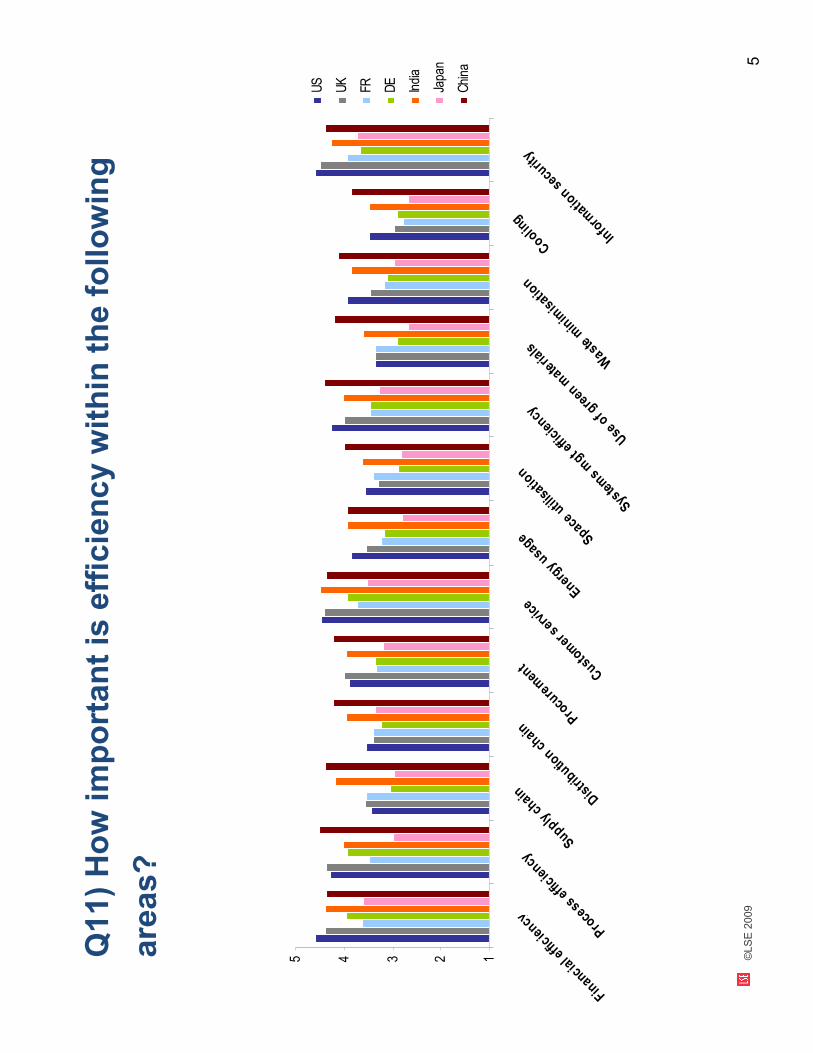
“How important are the following factors?”:
The top three efficiency factors are seen in:
1. Information security 2. Customer services 3. Financial efficiency
Innovation Questions: The most important initiatives seen to promoting enterprise innovation:
• Security and mobility are connected and both appear at the top of the list for promoting opportunities to innovate, and data centers are highly valued
• Both emphasize the
need for the correct tools to ensure that enterprises implement the right processes,
©LSE, 2009 11
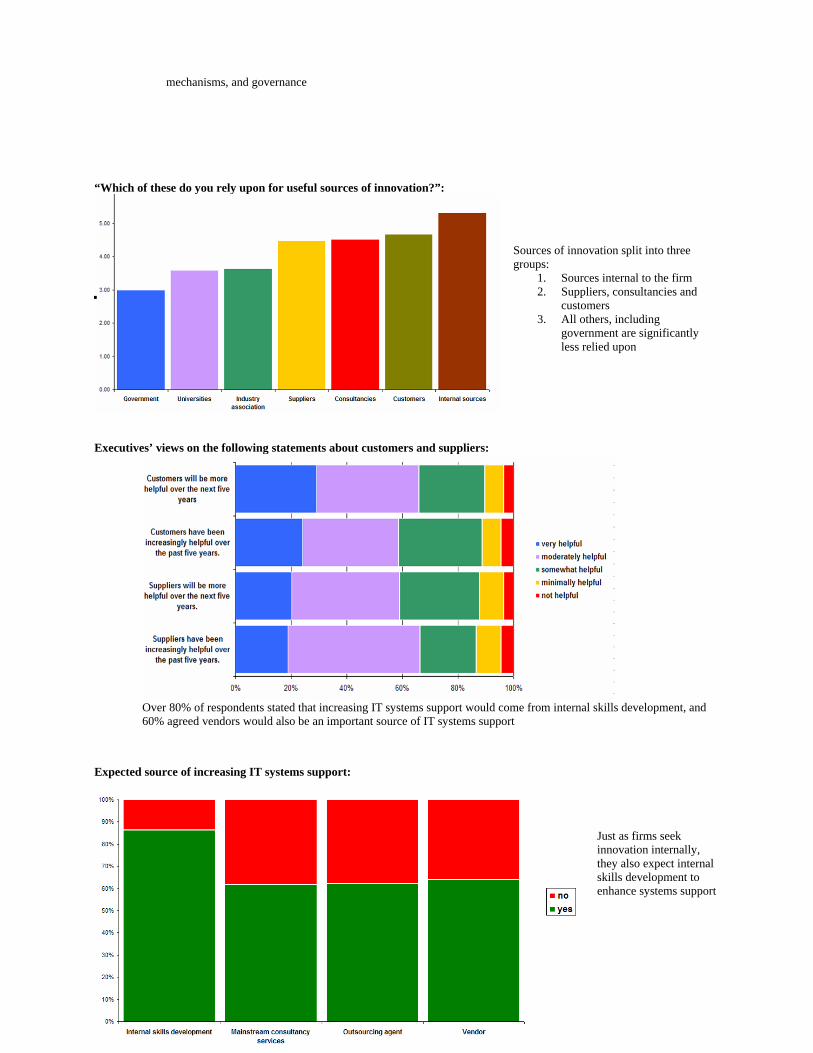
mechanisms, and governance “Which of these do you rely upon for useful sources of innovation?”:
Sources of innovation split into three groups:
1. Sources internal to the firm 2. Suppliers, consultancies and
customers 3. All others, including
government are significantly less relied upon
Executives’ views on the following statements about customers and suppliers:
Over 80% of respondents stated that increasing IT systems support would come from internal skills development, and 60% agreed vendors would also be an important source of IT systems support
Expected source of increasing IT systems support:
Just as firms seek innovation internally, they also expect internal skills development to enhance systems support
©LSE, 2009 12
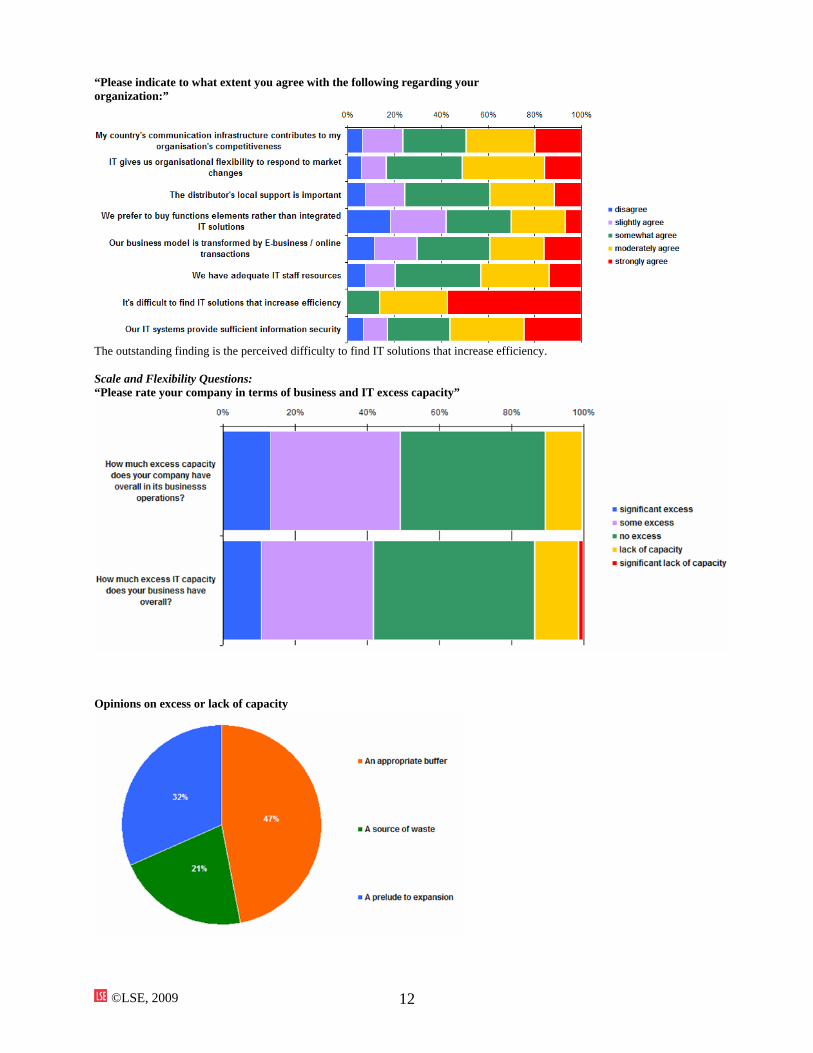
“Please indicate to what extent you agree with the following regarding your organization:”
The outstanding finding is the perceived difficulty to find IT solutions that increase efficiency. Scale and Flexibility Questions: “Please rate your company in terms of business and IT excess capacity”
Opinions on excess or lack of capacity
©LSE, 2009 13
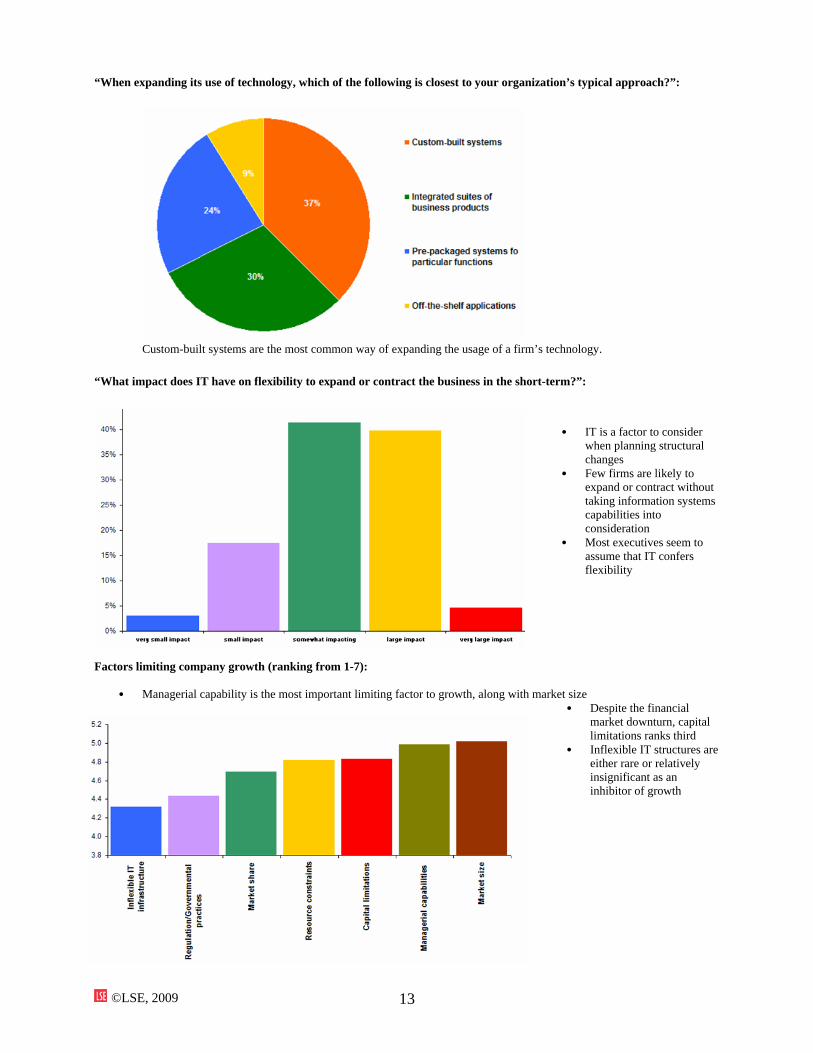
“When expanding its use of technology, which of the following is closest to your organization’s typical approach?”:
Custom-built systems are the most common way of expanding the usage of a firm’s technology.
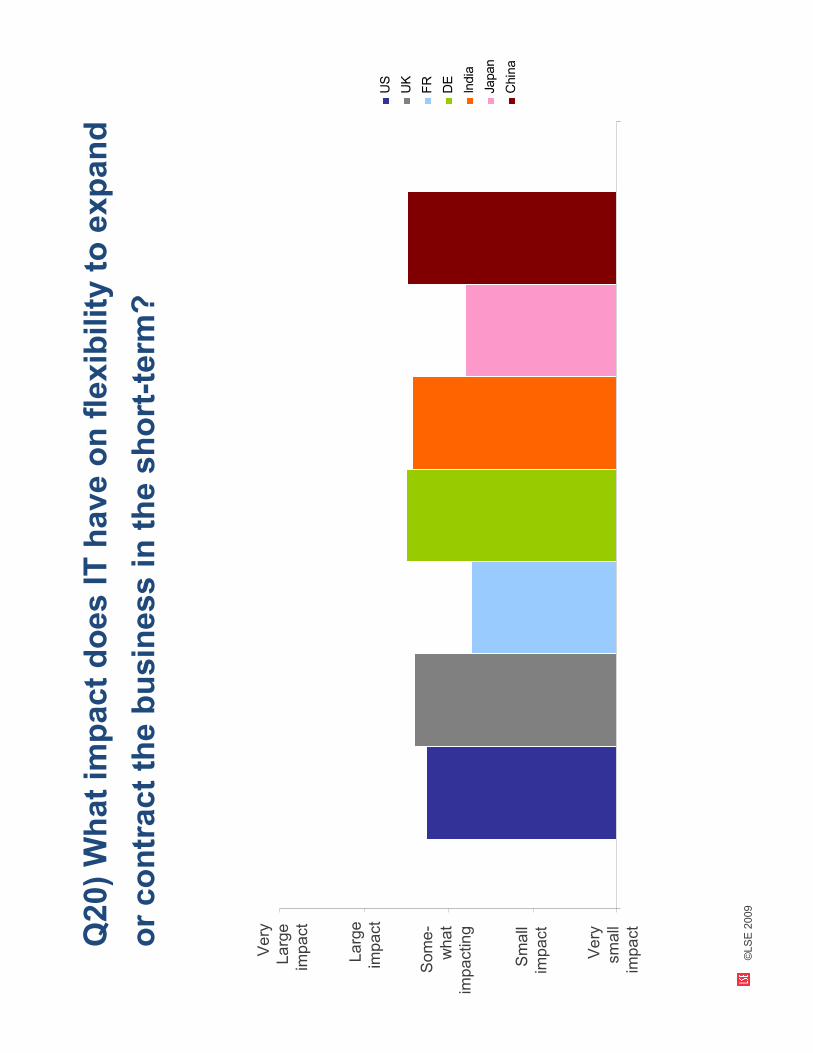
“What impact does IT have on flexibility to expand or contract the business in the short-term?”:
• IT is a factor to consider
when planning structural changes
• Few firms are likely to expand or contract without taking information systems capabilities into consideration
• Most executives seem to assume that IT confers flexibility
Factors limiting company growth (ranking from 1-7): • Managerial capability is the most important limiting factor to growth, along with market size
• Despite the financial market downturn, capital limitations ranks third
• Inflexible IT structures are either rare or relatively insignificant as an inhibitor of growth

©LSE, 2009 14
Wasteful IT Investments Questions: “How problematic is wasteful IT and communications technology investments in the following areas:”
• Executives find wasteful investments problematic but seem to accept that it will occur • Waste is expected where it cannot be measured • Where waste occurs in information security it seems problematic
Savings from wasteful IT investments would affect spending in the following areas:
“What would you estimate as the potential savings (by percentage) of your IT budget from improvements in IT efficiency and reduction in waste:”
• Most respondents seem
pessimistic that savings would amount to >5%
• Almost all the rest expected to save < 20%
• Very few were optimistic enough to expect > 20% savings
©LSE, 2009 15
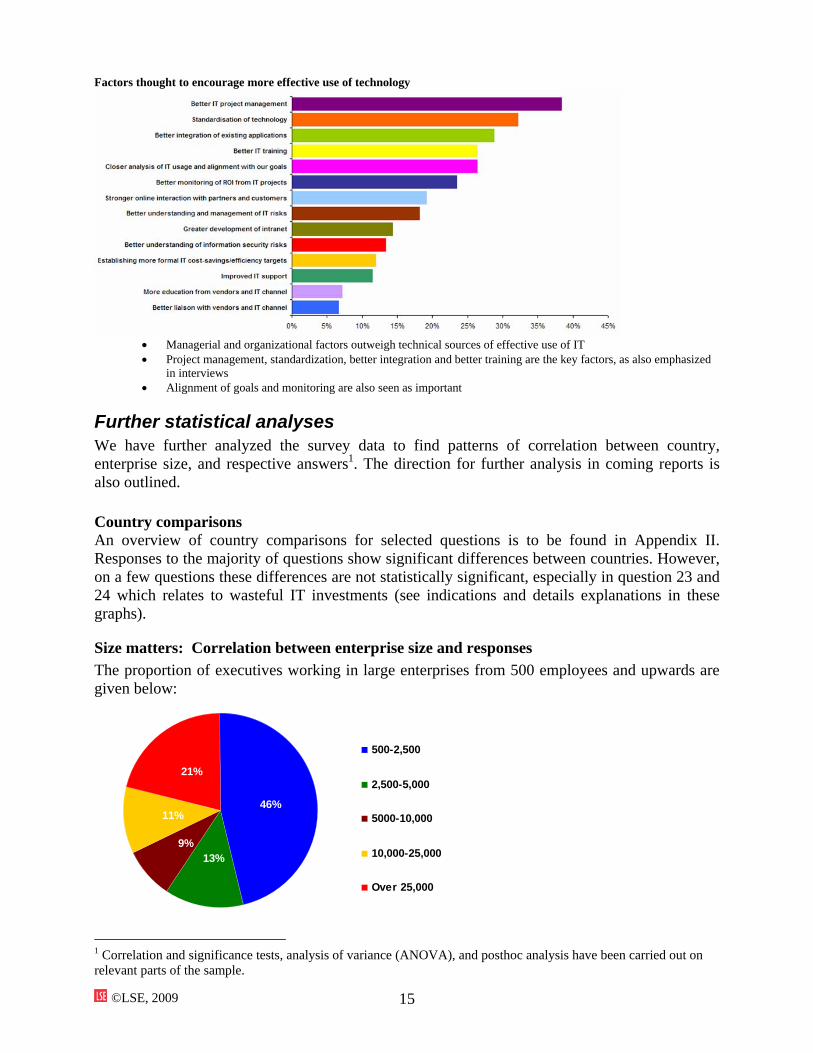
Factors thought to encourage more effective use of technology
• Managerial and organizational factors outweigh technical sources of effective use of IT • Project management, standardization, better integration and better training are the key factors, as also emphasized
in interviews • Alignment of goals and monitoring are also seen as important
Further statistical analyses We have further analyzed the survey data to find patterns of correlation between country, enterprise size, and respective answers1. The direction for further analysis in coming reports is also outlined.
Country comparisons An overview of country comparisons for selected questions is to be found in Appendix II. Responses to the majority of questions show significant differences between countries. However, on a few questions these differences are not statistically significant, especially in question 23 and 24 which relates to wasteful IT investments (see indications and details explanations in these graphs).
Size matters: Correlation between enterprise size and responses The proportion of executives working in large enterprises from 500 employees and upwards are given below:
46%
13%9%
11%
21%
500-2,500
2,500-5,000
5000-10,000
10,000-25,000
Over 25,000
1 Correlation and significance tests, analysis of variance (ANOVA), and posthoc analysis have been carried out on relevant parts of the sample.

©LSE, 2009 16
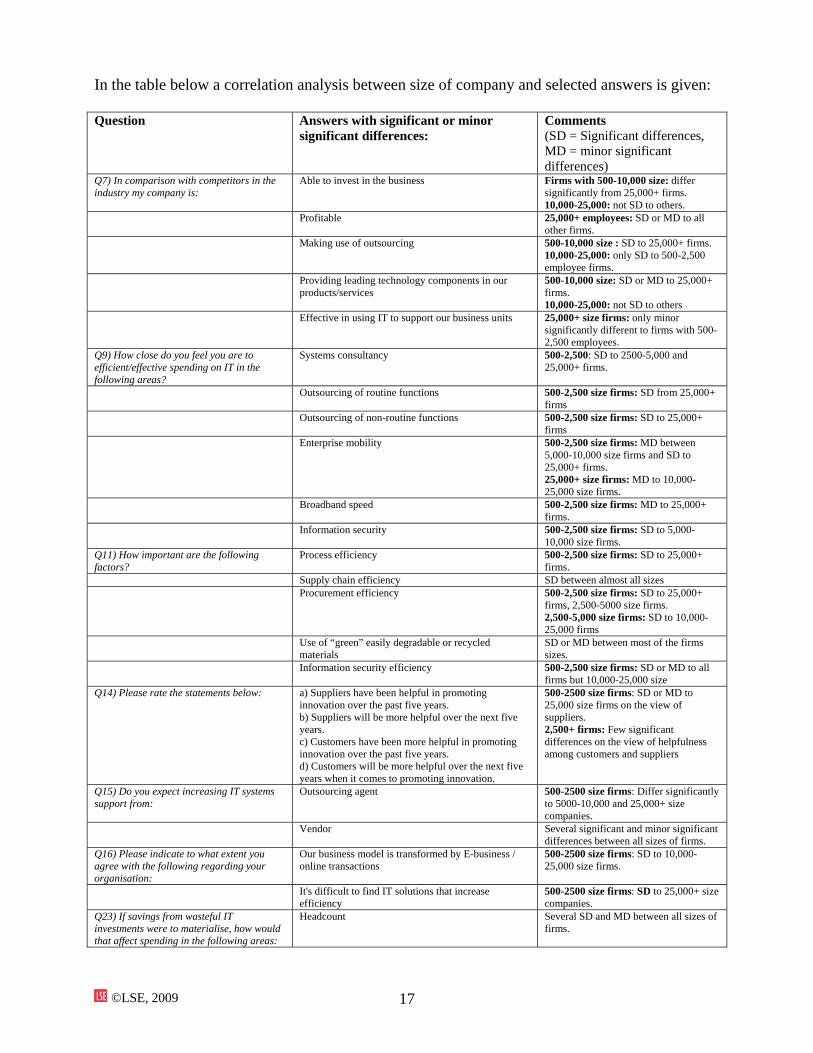
As can be expected, 500-2,500 employee firms differ significantly from very large enterprises with 25,000 or more employees on several of the survey questions; however, most answers from executives in enterprises larger than 2,500 employees are not significantly different. In a few questions we note significant differences between several types of enterprise size, such as in question 11 (“How important are the following factors?”) on option “Use of ‘green’ easily degradable or recycled materials”, and option “headcount”, as well as on question 23: “If savings from wasteful IT investments were to materialise, how would that affect spending in the following areas?”.
©LSE, 2009 17
In the table below a correlation analysis between size of company and selected answers is given: Question Answers with significant or minor
significant differences:
Comments (SD = Significant differences, MD = minor significant differences)
Q7) In comparison with competitors in the industry my company is:
Able to invest in the business Firms with 500-10,000 size: differ significantly from 25,000+ firms. 10,000-25,000: not SD to others.
Profitable 25,000+ employees: SD or MD to all other firms.
Making use of outsourcing 500-10,000 size : SD to 25,000+ firms. 10,000-25,000: only SD to 500-2,500 employee firms.
Providing leading technology components in our products/services
500-10,000 size: SD or MD to 25,000+ firms. 10,000-25,000: not SD to others
Effective in using IT to support our business units 25,000+ size firms: only minor significantly different to firms with 500-2,500 employees.
Q9) How close do you feel you are to efficient/effective spending on IT in the following areas?
Systems consultancy 500-2,500: SD to 2500-5,000 and 25,000+ firms.
Outsourcing of routine functions 500-2,500 size firms: SD from 25,000+ firms
Outsourcing of non-routine functions 500-2,500 size firms: SD to 25,000+ firms
Enterprise mobility 500-2,500 size firms: MD between 5,000-10,000 size firms and SD to 25,000+ firms. 25,000+ size firms: MD to 10,000-25,000 size firms.
Broadband speed 500-2,500 size firms: MD to 25,000+ firms.
Information security 500-2,500 size firms: SD to 5,000-10,000 size firms.
Q11) How important are the following factors?
Process efficiency 500-2,500 size firms: SD to 25,000+ firms.
Supply chain efficiency SD between almost all sizes Procurement efficiency 500-2,500 size firms: SD to 25,000+
firms, 2,500-5000 size firms. 2,500-5,000 size firms: SD to 10,000-25,000 firms
Use of “green” easily degradable or recycled materials
SD or MD between most of the firms sizes.
Information security efficiency 500-2,500 size firms: SD or MD to all firms but 10,000-25,000 size
Q14) Please rate the statements below: a) Suppliers have been helpful in promoting innovation over the past five years. b) Suppliers will be more helpful over the next five years. c) Customers have been more helpful in promoting innovation over the past five years. d) Customers will be more helpful over the next five years when it comes to promoting innovation.
500-2500 size firms: SD or MD to 25,000 size firms on the view of suppliers. 2,500+ firms: Few significant differences on the view of helpfulness among customers and suppliers
Q15) Do you expect increasing IT systems support from:
Outsourcing agent 500-2500 size firms: Differ significantly to 5000-10,000 and 25,000+ size companies.
Vendor Several significant and minor significant differences between all sizes of firms.
Q16) Please indicate to what extent you agree with the following regarding your organisation:
Our business model is transformed by E-business / online transactions
500-2500 size firms: SD to 10,000-25,000 size firms.
It's difficult to find IT solutions that increase efficiency
500-2500 size firms: SD to 25,000+ size companies.
Q23) If savings from wasteful IT investments were to materialise, how would that affect spending in the following areas:
Headcount Several SD and MD between all sizes of firms.

©LSE, 2009 18
Further country comparisons As we collect more data during the project, we will provide increasingly deeper and detailed analyses of between-country differences and additional correlates. Below is a visualisation chart of country differences in terms of how enterprises perceive themselves compared to competitors in question 7 of the survey (“In comparison with competitors in the industry my company is”): Competitive factor as variable:
2.52.72.93.13.33.53.73.9
Able to invest in the business
Efficient
Able to change course
ProfitableMaking use of outsourcing
Providing leading technologycomponents in our products/services
Effective in using IT to support ourbusiness units
USUKFRDEIndiaJapanChina
Country as variable:
2.52.72.93.13.33.53.73.9
US
UK
FR
DEIndia
Japan
China
Able to invest in the business
Efficient
Able to change course
Profitable
Making use of outsourcing
Providing leading technologycomponents in ourproducts/servicesEffective in using IT to support ourbusiness units
©LSE, 2009 19
4. Qualitative analyses of interviews The majority of informed interviewees express that large technology vendors seem to increasingly look to compete outside their core business and expand into new service areas. This seems to happen due to 1) maturing businesses 2) recent consolidation by information technology sub-sector leaders; and 3) new technology developments such as cloud computing, software as a service, and device convergence that blur the borders between previously distinct markets such as hardware, software, and services. Data center convergence is a key driver for cross sub-sector consolidation among vendors and this will most probably continue to provide an incentive for large technology firms to further expand in the enterprise segment. Already in 2003, 85% of American CIOs (as reported in a survey conducted by Deloitte: “Cutting fat, adding muscle”) rated sharing systems and applications as a valuable strategy, and this trend will be analyzed further from our survey findings. We sense from our interviewees (all of whom took the survey first) that very few executives are capable of answering all questions consistently. This points to the complexity of getting IT efficiently integrated in the firm, as it calls for significant coordination across corporate functions. The history of IT coordination problems has been noted in the scholarly literature and in cases dating from the 1960s. In spite of globalization and the internet revolution, the basic managerial problems seem, somewhat surprisingly, similar to those of 40 years ago.
Interview evidence We have interviewed so far a total of 15 senior executives responsible for ICT in large firms. These include:
• The CIO of a firm in the Indian construction sector • The executive responsible for database administration, software, all implementation and
associated research within a French financial services firm • The IT Director of a highly prestigious UK legal firm • The Global Controller for a leading US based international financial services firm • The CIO of a major Indian commodity producer • The President of an American finance enterprise
Others, described below, include executives from China, Germany, and Japan. We highlight especially meaningful opinions and insights offered by some of these informants. An Indian CIO in a very large manufacturing firm who also has extensive IT industry experience emphasized the importance of IT systems as a core element of business that cannot be measured through ROI. IT systems, that person has found, are a business necessity and ensuring that they function well is as important as ensuring that other elements of the “hygiene” of the business work properly. This CIO was optimistic about their ability to apply efficiency measurements but not so satisfied that they get to the core of the business problems at hand when it comes to the utilization of ICT. Nevertheless, they saw an important generational change and stated that they were sure that:
“The children of today will be more efficient than this generation because of their familiarity with routine uses of ICT.”
©LSE, 2009 20
This person’s opinion was that high-level executives should not be burdened with the need to coordinate information because such tasks are now commonly done and could be more thoroughly routinized:
“High level executives … spend too much time on this… It’s low value-add and should be done more via IT tools”
India is not distinct in their view; corporate ambitions are similar and although skilled personnel are more scarce, their standard is high. The CFO of a leading US multinational’s operation in China offered the view that training for and high quality routines to use ICT are of utmost importance. Based on experiences in US and UK companies, that CFO showed insight into the difference this makes in the BRICs:
“In big organizations people often move jobs, and this is especially so in developing economies like China. So, IT user training needs to be done constantly and repeatedly. With mobility comes a certain loss of in-place know-how.”
Despite the high level of standards and quality corporate infrastructure that this multinational is well known for, this interviewee claimed that:
“If made more robust, better implementations could easily bring about a 10%-plus improvement in business expenditure. Currently systems are adequately used and there is not much wastage, partly because the company tends to under- rather than over-spend.”
ICT efficiency, they claim, is more the concern of those with financial concerns within the corporation than those implementing information systems. The limiting factor seemed to be that high enough expectations were not common; old methods persist longer than they might otherwise. For that reason it is especially important to have benchmarks and broadly understood standards of efficiency to apply. A senior partner of a blue-chip American IT services firm emphasized the shift of responsibilities for CIOs from the essentially “blue-collar” concerns of the past, i.e. building and maintaining the ICT machine, to new “white-collar” responsibilities to ensure that systems contribute to the strategic mission of the organization and can be judged to be highly efficient. He also claimed that:
“IT departments have failed in the past to create collaboration within the firm. IT organisations need strong communicators to facilitate this collaboration”
This might explain, that person believes, why so much of the attention and spending is lavished on merely keeping systems running, as opposed to focusing on the more ambitious, innovative activities that might ensue. This emphasis on the systems is distorting the balance between mundane applications and imaginative business solutions.
“White collar IT understands the business to be proactive rather than reactive, and means business specialists are embedded in the tech organization.”
One consequence of this “blue-collar” approach has been the creation of isolated, craft-based and individualistic solutions to local problems. A consequence of that is both incompatibility and isolation, reducing innovation and costing money:
“Until recently 170 state agencies in the US had 170 data silos – technology standardization is a key driver for efficiency.”
A further advantage of coordination is that a greater variety of products and processes can be supported. Without that, service management would be a mess:
©LSE, 2009 21
“A client of mine has 28 change management processes behind the scene… Its processes that clients don’t see, but such service management means companies must ‘drive IT departments as a business’ to correspond to increasing quality pressure. Technology standardization is important for this.”
The procedures that drive these decisions are related to contractual arrangements and so to the cost of doing business. The exemplification of this is in the Service Level Agreements and the metrics that they imply:
“We use SLAs and how clearly they correspond to real client needs as measurement of our IT ROI…real up-time is nowadays monitored also by clients, so aligning the IT capacity we offer to clients with their needs should be reflected in SLAs.”
This senior executive also emphasized the difficulties of applying return-on-investment calculations to ICT spending and likened it to other intangibles of business activity. They were unconvinced about some recent trends, or at least the deeper significance of them beyond repackaging of longstanding ways of organizing ICT and related services. In this they included “thin clients” and “software as a service”. Capacity management, they emphasized, is done within the firm. Waste is created by creating silos, duplicating investment, and where integrated systems architecture is lacking. A senior facilities manager in a UK real estate management organization felt that many suppliers in the construction sector were reluctant to change to implement new IT solutions. This manager thought most IT waste stems from creating silos, duplicating investments, and having no enterprise architecture in place. IT has failed in the past to create collaboration, so he supported the view that IT organisations need strong communicators: communication brings collaboration. They hadn’t seen any big changes in his industry the last 4 years due to IT, but the sustainability trend in construction and facility management is changing this. Information security problems were one possible explanation of what was seen as an inhibitor to better systems utilization, and consequently greater efficiency.
“Information security policies are crucial to our business, but sometimes cause confusion around what data we can share within the organization”
Other sources of savings seemed worth pursuing, even if they are not likely to provide both that edge to business and cost cutting at the same time:
“IT as a tool to measure and visualize energy efficiency provides ‘no-brainers’ in terms of easy savings.”
In any case, the construction industry was in need of significant changes to their practices, supported by ICT, in order to ensure that it can benefit broadly from the opportunities that are so optimistically promised. The president of a large American financial services firm finds that it is the human side is falling behind, not the technology, in driving enterprise efficiency.
“Technology advantages are available also to small firms – so far most of our deals have not been made due to technology, but our people”
Elaborating on the question, “What impact does IT have on flexibility to expand or contract the business in the short-term?” this president stated:
“It’s easier to get to a transaction that is workable, since the client can see the implications right away from financial models... In the past it might have failed, as it takes time to schedule people together, so you need to make adjustments quickly”.
©LSE, 2009 22
When addressing the question, “which factors do you think would encourage more effective use of technology in your organization?” they offered the following comment:
“In near term, we have a lot of technology available, we work with staff to make them understand the ability [of IT], and even our chairman has become crazily addicted to the information we have available. Technology standardization, and better liaison with IT vendors, would encourage more effective use.”
While few of those interviewed offered statements as direct as this about the relationship between standardization and efficiency, this view is indeed consistent with a large proportion of respondents to the questionnaire. An executive controller in a very large American financial services firm finds that waste among IT services is not an agenda item as they tend to switch off rarely used applications.
“Benchmarking of efficiency towards competitors is difficult as nobody discloses information that can be traced to transactions due to secrecy.”
That executive also saw that web services were indeed changing practices, in contrast to some others interviewed who regarded it as a minor alteration to their practices:
“A generation shift is that proprietary install-solutions are giving way to web service systems…As buyer of our storage I see how pricing correlates less with physical location (location fees) of the data center, as we don’t care where the data is stored”
Relation to vendors is driven by spaces where mutuality is a benefit to both. Important for vendors to know where the industry is trending, since vendors can only increase price when providing a solution to a new need. Further, most of data supplied by financial data providers is valuable only because his firm uses it, so IT investments ultimately depend on the value of the information being transferred. This executive saw efficiency as a function of their firm’s ability to shift locations of activities where the market best looks after customers; where the best SLA is available. Their ability to do so routinely is largely a function of ICT. An executive, until recently CIO, in a large UK financial services firm elaborates on efficiency in the 90s and beginning of the 2000s and how some things haven’t changed:
“[Efficiency] was often achieved through automation and usually involved more technology and fewer staff. Where this happened, efficiency was relatively easy to measure… However, such opportunities, although not few, were limited.”
These days the opportunities are less limited and we are both technically able, and have the resources and needs to automate more widely. That facility, however was not enough:
“Information systems were increasingly used to execute activities that were not hitherto feasible…. Nearest to efficiency were such tasks as credit scoring, then in-flight credit-scoring but we then noted that what mattered most was not a continued focus on efficiency but rather on opportunity as new products and services were launched on the basis of some technological engine.”
These opportunities were rarely accounted for in the normal business manner. On the problems of measuring ROI, this CIO cautions:
“So we have the ludicrous situation of projects being put forward for acceptance on the basis of COST = £X Millions; Savings = £X Thousands + intangibles… as you can imagine, there was no attempt at evaluation.”
On power and politics in the organization he comments:
©LSE, 2009 23
“In addition to the desire to avoid measurement/assessment because it was difficult, there were other reasons management wished to avoid such a regime: any new information might reduce the asserted magnificence of what they wanted to do… and senior managers tend not to be keen on having their latest proposals turned down. So the nature of politics and power plays a role [in how IT is being implemented and used].”
This represents a subtle, but not very constructive view of the roles ICT play in companies. On the one hand, they are expected to be costly, on the other hand they are an unavoidable business expenditure and so cannot be easily compared to other kinds of investments. The senior internal advisor to the Japanese branch of one of the largest US ICT companies regards training as the greatest problem. Despite the world-leading character of the firm, its internal uses of information systems are poor:
“Staff is incapable of using IT systems effectively, even though we are an IT company. Training is not well prepared.”
Efficiency is hampered by traditional practices, such as the Japanese “hanko” system, which generates a great deal of paper. Similarly, mobility is not used in an efficient manner, hampered, among other things, by a strict security policy that makes working outside the office infeasible.
“We suffered from severe security problems in the past and are now more risk averse. This is an inhibitor on adopting some efficient solutions.”
The current economic situation is a major additional difficulty, with many large companies losing their interest in IT investments. While the government and universities continue to purchase new IT systems, business is beginning to fall behind. This mismatch is likely to persist for a while longer and Japanese companies are losing comparative efficiency in the meantime. An executive in a very large French defense industry firm confirms that standardization of technology is the main driver of IT utilization in their experience. With a focus on maintaining routine functioning, there is little sense of excess capacity. That perception is fostered by certain labor market problems including relatively low workforce mobility and high costs associated with hiring and firing. Unlike most countries, information security is not seen as a major issue in France, and perhaps the feeling that authorities have difficulties in coordinating information generally enhances this view. Similarly, the prevailing opinion in the defense sector is that:
“IT should have a short pay-back time and innovation effects are not important when investing.”
This cost-focus is seen as an inhibitor of more imaginative, effective uses of IT and tends to encourage firms to stick to earlier styles of automating routine paper-based functions. Such firms do later recognize the advantages of changing those routines, but the attitude towards IT still remains cost-focused. There was no consensus among these people interviewed about the “causes” of efficiency. Nevertheless, their opinions provide us with great insights into the statistical evidence available from our survey.
©LSE, 2009 24
5. Conclusions and Discussion
Main initial findings Although our findings are preliminary, many of them indicate differences in perception or intention from previous studies, or address questions that have not been systematically researched ever before. We find, for example, that while IT strategies are driven by reducing costs and improving service quality, information security is seen not only as a business necessity and an insurance against reputational damage, but also as a driver of efficiency. These factors seem even more prominent than raising the quality of products and services, and raising the productivity of individuals. Nevertheless, all executives find to various degrees IT supporting a flexible response by their companies to market changes. We would like to highlight the following indicative findings:
• Greater efficiency is sought in high level, expert-based tasks This seems to be especially the case for those that drive customer interaction. Routines tasks are regarded as necessary for the sake of ensuring the “hygiene” of the business and many executives recognize the distinction between craft-based, “blue collar” tasks and strategic, “white collar” opportunities.
• Enterprises want to improve productivity but not for the sake of reducing workforce size.
We are interested to find that, despite the difficult economic period in which this research is being conducted, there are no indications that the intention of companies in pursuing their ICT improvement practices is to reduce jobs. It comes as the last priority among many options.
• Security risks endanger efficiency.
Information security solutions are connected with enterprise innovation. Although it is not entirely apparent how executives think of this, we interpret this to mean that only with good information security can enterprises feel that they have the space to innovate. After years of emphasis, we can now see this coming through in the common perceptions of security.
• Both customers and suppliers are similarly regarded as sources of innovation. This is a finding that has long been anticipated in the academic literature, but which has hitherto mainly been seen in specialized niches of high technology business, here we find it overall, across countries and sectors.
• Country difference does matter.
Despite globalization and the general feeling that ICT transcends barriers, national context remains significant for almost all of the factors investigated here. This is not only true of locally-based firms, but interview evidence indicates that it also holds for large divisions of multinational corporations.

©LSE, 2009 25
• The size of firms affects perceptions of efficiency Size guides the choices and opportunities available to improve efficiency. Even in times of financial constraint, investing now for future efficiency savings is a viable option for the largest firms.
• Efficiency gains are sought as a means of addressing legacy IT problems
A very high proportion of spending is on legacy systems and few see overall spending increasing, cost-cutting is important in companies where they recognize that they can do more with the small proportion of overall IT spending not dedicated to maintaining older established ways of doing business.
In the next stage of the research we expect to be able to use these findings as the starting points for more qualitative investigations of firm behavior in improving efficiency. We will continue to interview executives and to make improvements in data gathering techniques. Although we do not have specific indications that individual questions in our survey instrument need changing, we remain open to the possibility that the overall questionnaire might be shortened. Most significantly, we will become more confident of the quality of our data and especially of the differences in quality apparent among countries and sectors.
©LSE, 2009 26
Appendices:
Appendix I: The survey (please see attached)
Appendix II: Comparative graphs per country including significance tests (please see attached)
Appendix III: Interview template (please see below)

©LSE, 2009 27
Appendix III: Interview template
For each interview we encouraged informants to speak generally about their level of satisfaction with their use of ICT and to reflect on how their experiences might compare with those in similar firms in other countries. We begin each interview with an overview of our study and of the questionnaire, which most of our interviewees have already filled out. This usually provides us with some questions following up from their answers, often ones that reveal their preferences for particular technical approaches. Before turning to the topic of IT-based efficiency gains, we ask for an overview of the efficiency profile of their firm, i.e. how efficient they regard it to be, how they compare themselves with others in their sector nationally and internationally, etc. We ask about which IT tools enhance their business, and how they learn about those tools and their advantages. We ask their views on the role of vendors, consultants, research bodies in universities and government, and the likelihood that customers might contribute to innovation in their sector. We are especially interested in the relationship between ICT and non-ICT-driven factors in improving efficiency. For those who have a clear idea of what they might expect from efficient operations, we ask them what they believe the “key drivers” are.
Page 1
Enterprise EfficiencyEnterprise EfficiencyEnterprise EfficiencyEnterprise Efficiency
(Please note: the survey starts on the next page)
Dear respondent,
Thank you for contributing to the 'Efficient Enterprise' research project of the London School of Economics [LSE]. The survey is multiple-choice and takes approximately 15 minutes to fill out.
The focus of this research is the effect of information and communications technologies on enterprise efficiency. Please note that all references to "IT" in the questionnaire relates to the wider meaning of "information and communications technologies".
LSE "Efficient Enterprise" research project

Page 2
Enterprise EfficiencyEnterprise EfficiencyEnterprise EfficiencyEnterprise Efficiency
Please provide the following information aboutyourself and your organisation:
(please note that the survey continues on the next page)
1. What country do you live and work in?
2. Which of the following best describes your title?
3. What are your main functional roles (please choose no more than three options)?
4. What is your organisation's primary industry?
5. How large is your company (number of employees)?
About yourself
*
*
*
*
Other (please specify)
Other (please specify)
General management
gfedc
Strategy and business
developmentgfedc
IT
gfedc
Finance
gfedc
Operations and production
gfedc
Marketing and sales
gfedc
Information and research
gfedc
Customer service
gfedc
Risk
gfedc
Human resources
gfedc
R&D
gfedc
Procurement
gfedc
Legal
gfedc
Supply-chain management
gfedc
Page 3
Enterprise EfficiencyEnterprise EfficiencyEnterprise EfficiencyEnterprise Efficiency
(please note that the survey continues on the next page)
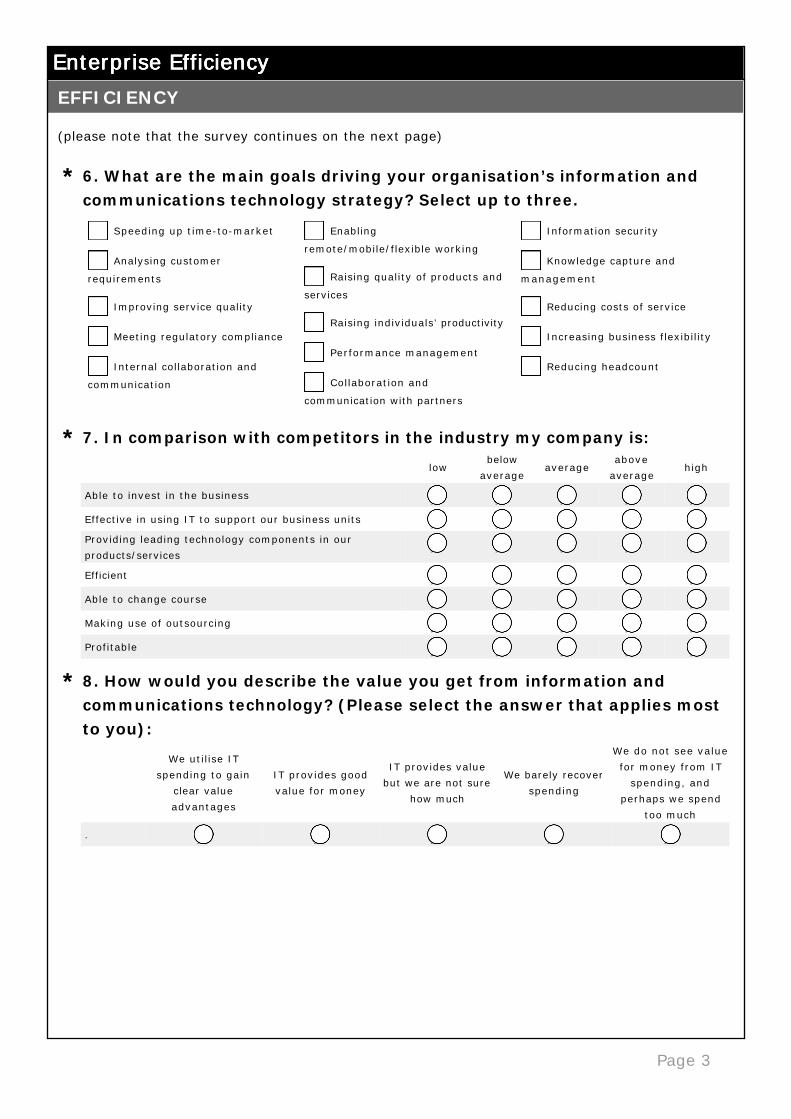
6. What are the main goals driving your organisation’s information and communications technology strategy? Select up to three.
7. In comparison with competitors in the industry my company is:
8. How would you describe the value you get from information and communications technology? (Please select the answer that applies most to you):
EFFICIENCY
*
* low
below
averageaverage
above
averagehigh
Able to invest in the business nmlkj nmlkj nmlkj nmlkj nmlkj
Effective in using IT to support our business units nmlkj nmlkj nmlkj nmlkj nmlkj
Providing leading technology components in our
products/servicesnmlkj nmlkj nmlkj nmlkj nmlkj
Efficient nmlkj nmlkj nmlkj nmlkj nmlkj
Able to change course nmlkj nmlkj nmlkj nmlkj nmlkj
Making use of outsourcing nmlkj nmlkj nmlkj nmlkj nmlkj
Profitable nmlkj nmlkj nmlkj nmlkj nmlkj
*
We utilise IT
spending to gain
clear value
advantages
IT provides good
value for money
IT provides value
but we are not sure
how much
We barely recover
spending
We do not see value
for money from IT
spending, and
perhaps we spend
too much
. nmlkj nmlkj nmlkj nmlkj nmlkj
Speeding up time-to-market
gfedc
Analysing customer
requirementsgfedc
Improving service quality
gfedc
Meeting regulatory compliance
gfedc
Internal collaboration and
communicationgfedc
Enabling
remote/mobile/flexible workinggfedc
Raising quality of products and
servicesgfedc
Raising individuals’ productivity
gfedc
Performance management
gfedc
Collaboration and
communication with partnersgfedc
Information security
gfedc
Knowledge capture and
managementgfedc
Reducing costs of service
gfedc
Increasing business flexibility
gfedc
Reducing headcount
gfedc

Page 4
Enterprise EfficiencyEnterprise EfficiencyEnterprise EfficiencyEnterprise Efficiency9. How close do you feel you are to efficient/effective spending on IT in the following areas? (Please select one of the following 5 options for each item):
10. How does your company measure returns on IT investments? (Please select all that apply)
11. How important are the following factors?
*
very inefficient inefficientsomewhat
efficient
moderately
efficientvery efficient
Outsourcing of non-routine
functionsnmlkj nmlkj nmlkj nmlkj nmlkj
Information security nmlkj nmlkj nmlkj nmlkj nmlkj
In-house developed software nmlkj nmlkj nmlkj nmlkj nmlkj
Enterprise mobility nmlkj nmlkj nmlkj nmlkj nmlkj
Outsourcing of routine services nmlkj nmlkj nmlkj nmlkj nmlkj
Training nmlkj nmlkj nmlkj nmlkj nmlkj
Systems consultancy nmlkj nmlkj nmlkj nmlkj nmlkj
System maintenance nmlkj nmlkj nmlkj nmlkj nmlkj
Broadband speed nmlkj nmlkj nmlkj nmlkj nmlkj
*
* very important
moderately
important
somewhat
important
minimally
importantnot important
Space efficiency nmlkj nmlkj nmlkj nmlkj nmlkj
Information security efficiency nmlkj nmlkj nmlkj nmlkj nmlkj
Use of “green” easily degradable
or recycled materialsnmlkj nmlkj nmlkj nmlkj nmlkj
Customer service efficiency nmlkj nmlkj nmlkj nmlkj nmlkj
Cooling efficiency nmlkj nmlkj nmlkj nmlkj nmlkj
Process efficiency nmlkj nmlkj nmlkj nmlkj nmlkj
Procurement efficiency nmlkj nmlkj nmlkj nmlkj nmlkj
Distribution chain efficiency nmlkj nmlkj nmlkj nmlkj nmlkj
Energy efficiency nmlkj nmlkj nmlkj nmlkj nmlkj
Systems management efficiency nmlkj nmlkj nmlkj nmlkj nmlkj
Waste minimisation nmlkj nmlkj nmlkj nmlkj nmlkj
Supply chain efficiency nmlkj nmlkj nmlkj nmlkj nmlkj
Financial efficiency nmlkj nmlkj nmlkj nmlkj nmlkj
Cost avoidance
gfedc
Change in corporate valuation
gfedc
Headcount reduction
gfedc
Staff productivity
gfedc
Time to market
gfedc
Cash savings
gfedc
Product or service quality
gfedc
Process/product quality
improvementgfedc
Revenue growth
gfedc
Earnings per share growth
gfedc
Improvements in process speed
gfedc
Extra Revenue generated
gfedc
Market share change
gfedc

Page 5
Enterprise EfficiencyEnterprise EfficiencyEnterprise EfficiencyEnterprise Efficiency
Page 6
Enterprise EfficiencyEnterprise EfficiencyEnterprise EfficiencyEnterprise Efficiency
(please note that the survey continues on the next page)
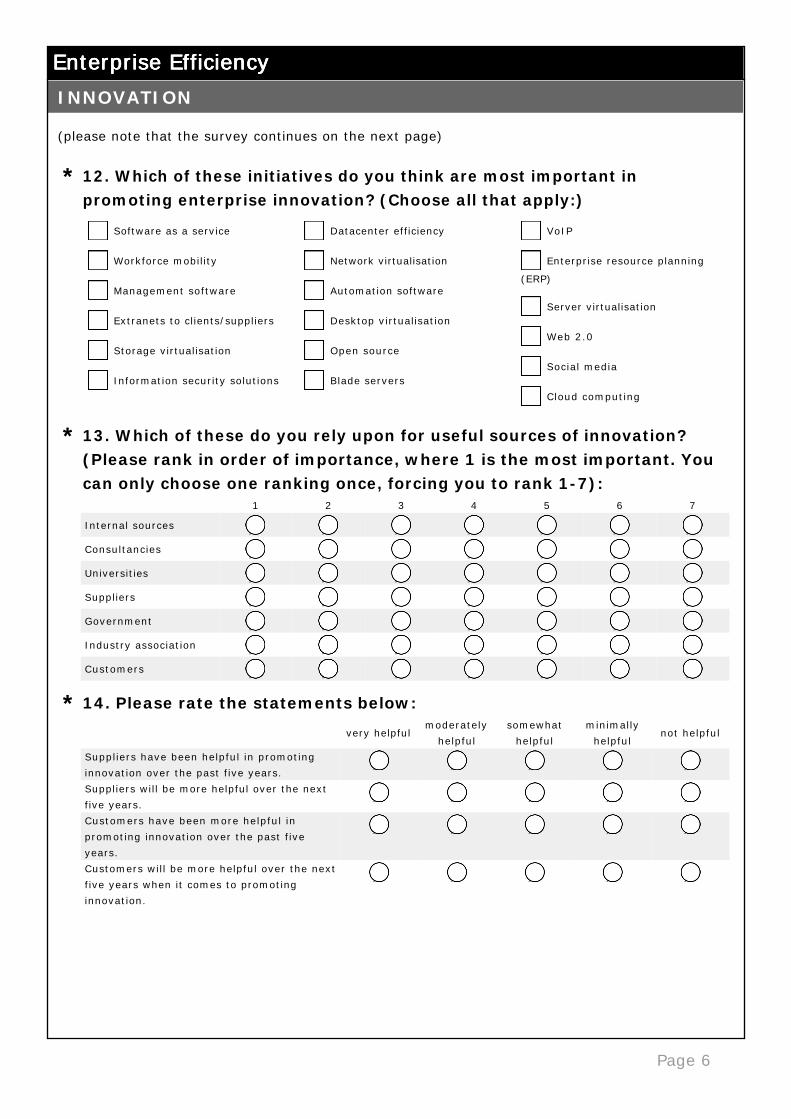
12. Which of these initiatives do you think are most important in promoting enterprise innovation? (Choose all that apply:)
13. Which of these do you rely upon for useful sources of innovation? (Please rank in order of importance, where 1 is the most important. You can only choose one ranking once, forcing you to rank 1-7):
14. Please rate the statements below:
INNOVATION
*
*
1 2 3 4 5 6 7
Internal sources nmlkj nmlkj nmlkj nmlkj nmlkj nmlkj nmlkj
Consultancies nmlkj nmlkj nmlkj nmlkj nmlkj nmlkj nmlkj
Universities nmlkj nmlkj nmlkj nmlkj nmlkj nmlkj nmlkj
Suppliers nmlkj nmlkj nmlkj nmlkj nmlkj nmlkj nmlkj
Government nmlkj nmlkj nmlkj nmlkj nmlkj nmlkj nmlkj
Industry association nmlkj nmlkj nmlkj nmlkj nmlkj nmlkj nmlkj
Customers nmlkj nmlkj nmlkj nmlkj nmlkj nmlkj nmlkj
* very helpful
moderately
helpful
somewhat
helpful
minimally
helpfulnot helpful
Suppliers have been helpful in promoting
innovation over the past five years.nmlkj nmlkj nmlkj nmlkj nmlkj
Suppliers will be more helpful over the next
five years.nmlkj nmlkj nmlkj nmlkj nmlkj
Customers have been more helpful in
promoting innovation over the past five
years.
nmlkj nmlkj nmlkj nmlkj nmlkj
Customers will be more helpful over the next
five years when it comes to promoting
innovation.
nmlkj nmlkj nmlkj nmlkj nmlkj
Software as a service
gfedc
Workforce mobility
gfedc
Management software
gfedc
Extranets to clients/suppliers
gfedc
Storage virtualisation
gfedc
Information security solutions
gfedc
Datacenter efficiency
gfedc
Network virtualisation
gfedc
Automation software
gfedc
Desktop virtualisation
gfedc
Open source
gfedc
Blade servers
gfedc
VoIP
gfedc
Enterprise resource planning
(ERP)gfedc
Server virtualisation
gfedc
Web 2.0
gfedc
Social media
gfedc
Cloud computing
gfedc
Page 7
Enterprise EfficiencyEnterprise EfficiencyEnterprise EfficiencyEnterprise Efficiency15. Do you expect increasing IT systems support from:*
Yes No
Internal skills development nmlkj nmlkj
Mainstream consultancy services nmlkj nmlkj
Outsourcing agent nmlkj nmlkj
Vendor nmlkj nmlkj
Page 8
Enterprise EfficiencyEnterprise EfficiencyEnterprise EfficiencyEnterprise Efficiency
(please note that the survey continues on the next page)
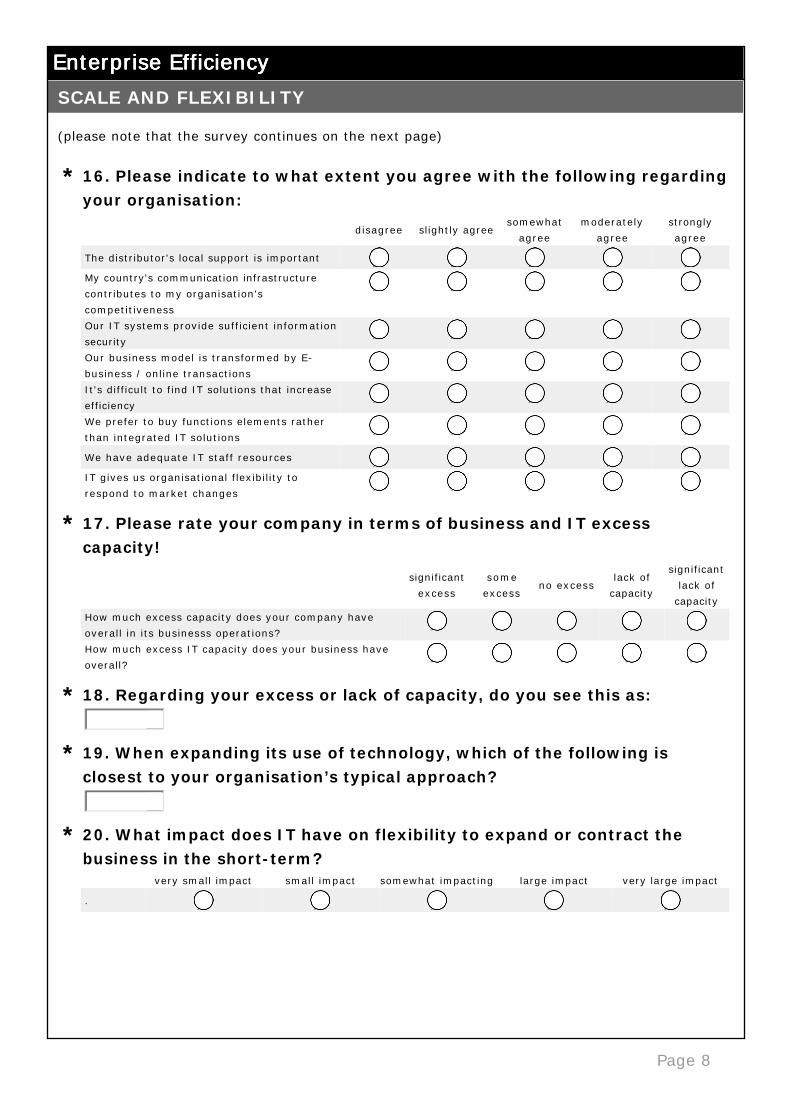
16. Please indicate to what extent you agree with the following regarding your organisation:
17. Please rate your company in terms of business and IT excess capacity!
18. Regarding your excess or lack of capacity, do you see this as:
19. When expanding its use of technology, which of the following is closest to your organisation’s typical approach?
20. What impact does IT have on flexibility to expand or contract the business in the short-term?
SCALE AND FLEXIBILITY
*
disagree slightly agree somewhat
agree
moderately
agree
strongly
agree
The distributor's local support is important nmlkj nmlkj nmlkj nmlkj nmlkj
My country's communication infrastructure
contributes to my organisation's
competitiveness
nmlkj nmlkj nmlkj nmlkj nmlkj
Our IT systems provide sufficient information
securitynmlkj nmlkj nmlkj nmlkj nmlkj
Our business model is transformed by E-
business / online transactionsnmlkj nmlkj nmlkj nmlkj nmlkj
It's difficult to find IT solutions that increase
efficiencynmlkj nmlkj nmlkj nmlkj nmlkj
We prefer to buy functions elements rather
than integrated IT solutionsnmlkj nmlkj nmlkj nmlkj nmlkj
We have adequate IT staff resources nmlkj nmlkj nmlkj nmlkj nmlkj
IT gives us organisational flexibility to
respond to market changesnmlkj nmlkj nmlkj nmlkj nmlkj
*
significant
excess
some
excess no excess
lack of
capacity
significant
lack of
capacity
How much excess capacity does your company have
overall in its businesss operations?nmlkj nmlkj nmlkj nmlkj nmlkj
How much excess IT capacity does your business have
overall?nmlkj nmlkj nmlkj nmlkj nmlkj
*
*
*
very small impact small impact somewhat impacting large impact very large impact
. nmlkj nmlkj nmlkj nmlkj nmlkj
Page 9
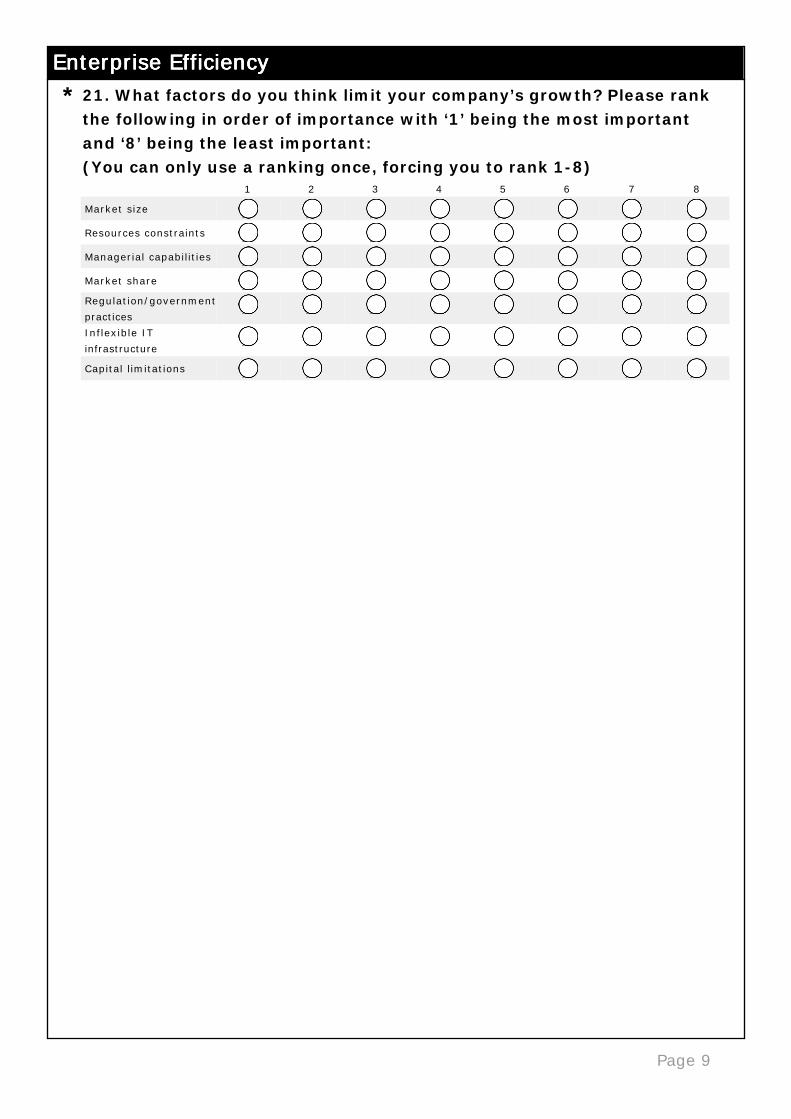
Enterprise EfficiencyEnterprise EfficiencyEnterprise EfficiencyEnterprise Efficiency21. What factors do you think limit your company’s growth? Please rank the following in order of importance with ‘1’ being the most important and ‘8’ being the least important: (You can only use a ranking once, forcing you to rank 1-8)
*
1 2 3 4 5 6 7 8
Market size nmlkj nmlkj nmlkj nmlkj nmlkj nmlkj nmlkj nmlkj
Resources constraints nmlkj nmlkj nmlkj nmlkj nmlkj nmlkj nmlkj nmlkj
Managerial capabilities nmlkj nmlkj nmlkj nmlkj nmlkj nmlkj nmlkj nmlkj
Market share nmlkj nmlkj nmlkj nmlkj nmlkj nmlkj nmlkj nmlkj
Regulation/government
practicesnmlkj nmlkj nmlkj nmlkj nmlkj nmlkj nmlkj nmlkj
Inflexible IT
infrastructurenmlkj nmlkj nmlkj nmlkj nmlkj nmlkj nmlkj nmlkj
Capital limitations nmlkj nmlkj nmlkj nmlkj nmlkj nmlkj nmlkj nmlkj

Page 10
Enterprise EfficiencyEnterprise EfficiencyEnterprise EfficiencyEnterprise Efficiency
(on the next page follows invitation to both the LSE "Efficient Enterprise" event and the follow-up questionnaire)
22. How problematic is wasteful IT and communications technology investments in the following areas:
23. If savings from wasteful IT investments were to materialise, how would that affect spending in the following areas:
24. What would you estimate as the potential savings (by percentage) of your IT budget from improvements in IT efficiency and reduction in waste:
WASTEFUL IT INVESTMENTS
*
not a problem small problemsomewhat
problematic
moderately
problematic
very
problematic
Hardware nmlkj nmlkj nmlkj nmlkj nmlkj
Software nmlkj nmlkj nmlkj nmlkj nmlkj
Consulting nmlkj nmlkj nmlkj nmlkj nmlkj
Connectivity (bandwidth) nmlkj nmlkj nmlkj nmlkj nmlkj
Information security nmlkj nmlkj nmlkj nmlkj nmlkj
Enterprise mobility nmlkj nmlkj nmlkj nmlkj nmlkj
*
increasing
costsno savings some savings
significant
savings
very large
savings
Energy use nmlkj nmlkj nmlkj nmlkj nmlkj
Paper use nmlkj nmlkj nmlkj nmlkj nmlkj
Space use nmlkj nmlkj nmlkj nmlkj nmlkj
Headcount nmlkj nmlkj nmlkj nmlkj nmlkj
Waste disposal costs nmlkj nmlkj nmlkj nmlkj nmlkj
Reduced environmental compliance costs nmlkj nmlkj nmlkj nmlkj nmlkj
Information security costs nmlkj nmlkj nmlkj nmlkj nmlkj
Telephone/broadband costs nmlkj nmlkj nmlkj nmlkj nmlkj
*
Page 11
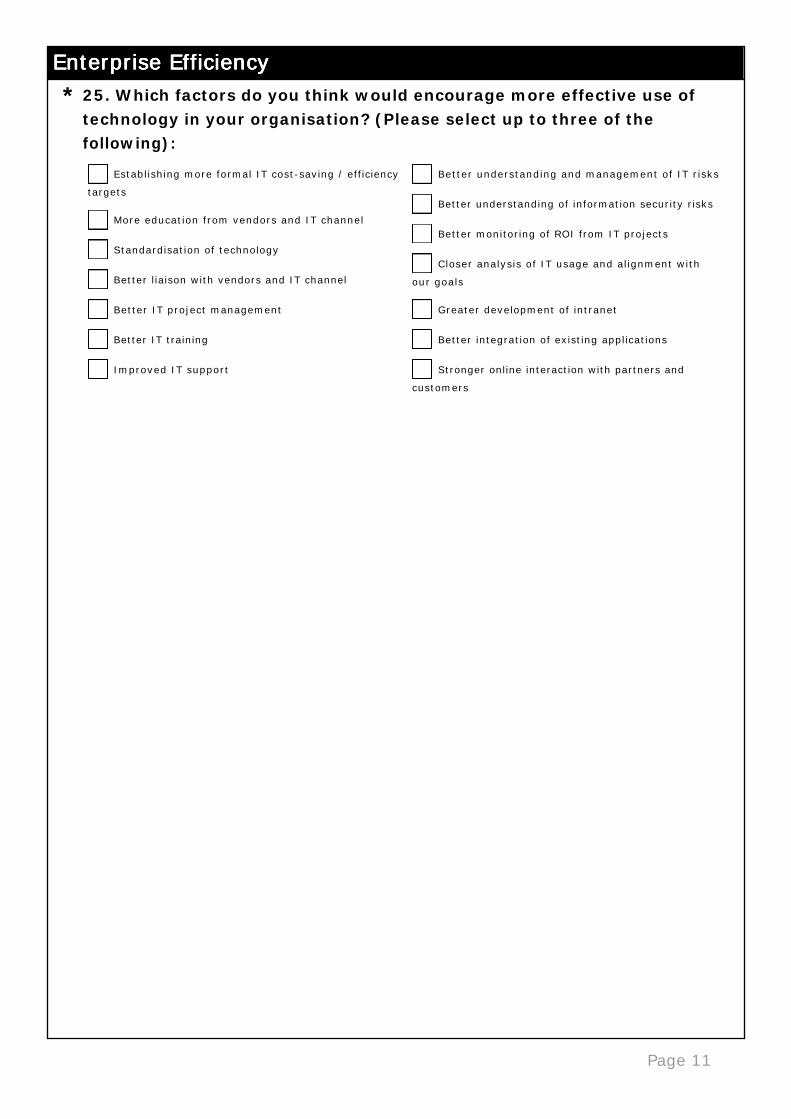
Enterprise EfficiencyEnterprise EfficiencyEnterprise EfficiencyEnterprise Efficiency25. Which factors do you think would encourage more effective use of technology in your organisation? (Please select up to three of the following):
*
Establishing more formal IT cost-saving / efficiency
targetsgfedc
More education from vendors and IT channel
gfedc
Standardisation of technology
gfedc
Better liaison with vendors and IT channel
gfedc
Better IT project management
gfedc
Better IT training
gfedc
Improved IT support
gfedc
Better understanding and management of IT risks
gfedc
Better understanding of information security risks
gfedc
Better monitoring of ROI from IT projects
gfedc
Closer analysis of IT usage and alignment with
our goalsgfedc
Greater development of intranet
gfedc
Better integration of existing applications
gfedc
Stronger online interaction with partners and
customersgfedc

Page 12
Enterprise EfficiencyEnterprise EfficiencyEnterprise EfficiencyEnterprise Efficiency
Time of event: Last week Nov (TBC)Place: London School of Economics
26. To attend the "LSE Efficient Enterprise" event, please share your contact details below so we can inform you of the date and place.
27. If you are willing to take part in the follow-up questionnaire (planned for Spring and Autumn 2010), please tick the box below. We will also send you further findings from the LSE "Efficient Enterprise" study.
28. Optional question: What are your IT procurement responsibilities (in USD)? (If you have no such responsibility, please choose 0-25k)
Invitation to launch event and follow-up questionnaire
Name:
Email:
Organisation:
Thank you for contributing and we hope to see you soon at an event at London School of Economics!
Yes, I am willing to take part (please fill out your details above)
nmlkj
Appendix II:
Country comparatives
First Interim Report on LSE-Dell Research
PatrikKärrberg
Jonathan Liebenau
London School of Economics, October 2009
©LSE 2009
Q7) In comparison with competitors in the industry “my
company seems”:
2
12
34
5
Able to invest in the business
Efficient
Able to change course
Profitable
Making use of outsourcing
Providing leading technology components in our
products/services
Effective in using IT to support our business units
China
Japan
India
DE
FR
UK
US
©LSE 2009
Low
Below
average
Average
Above
average
High
Q8) How would you describe the value you get from IT?
12
34
5
1
China
Japan
India
DE
FR
UK
US
IT provides good
value for money
We utiliseIT
spending to gain
clear value advantages
IT provides value
but we are not
sure how m
uch
We barely
recover spending
We don not see
value for money –
perhaps we spend
too m
uch
©LSE 2009
Q9) How close do you fell you are to efficient/effective
spending on IT in the following areas?
4
12
34
5
Training
System m
aintenance
Outsourcing of routine services
Inform
ation Security
In-house developed software
Broadband speed
Enterprise m
obility
Systems consultancy
Outsourcing of non-routine functions
China
Japan
India
DE
FR
UK
US
©LSE 2009
Very
inefficient
Inefficient
Somewhat
efficient
Moderately
efficient
Very
efficient
Q11) How important is efficiency within the following
areas?
5
12345
Fina
ncia
l effi
cien
cyPr
oces
s ef
ficie
ncy
Supp
ly c
hain Di
strib
utio
n ch
ain
Proc
urem
ent
Cust
omer
ser
vice
Ener
gy u
sage Sp
ace
utili
satio
n
Syst
ems
mgt
effi
cien
cy
Use
of g
reen
mat
eria
lsW
aste
min
imis
atio
n
Cool
ing
Info
rmat
ion
secu
rity
US
UK
FR DE
India
Japa
n
China
©LSE 2009
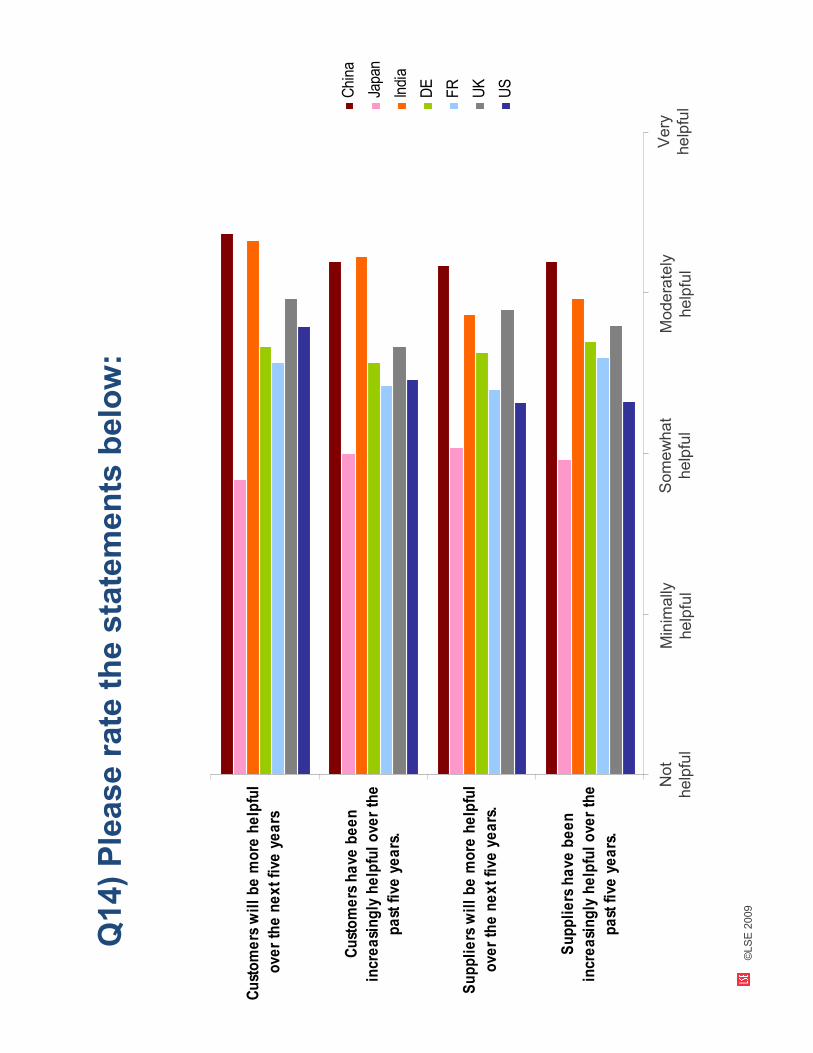
Q14) Please rate the statements below:
12
34
5
Suppliers have been
increasingly helpful ove
r the
past five years.
Suppliers w
ill be m
ore helpful
over the next five years.
Customers have
been
increasingly helpful ove
r the
past five years.
Customers w
ill be m
ore helpful
over the next five
years
China
Japan
India
DE
FR
UK
US
©LSE 2009
Very
helpful
Moderately
helpful
Somewhat
helpful
Minim
ally
helpful
Not
helpful
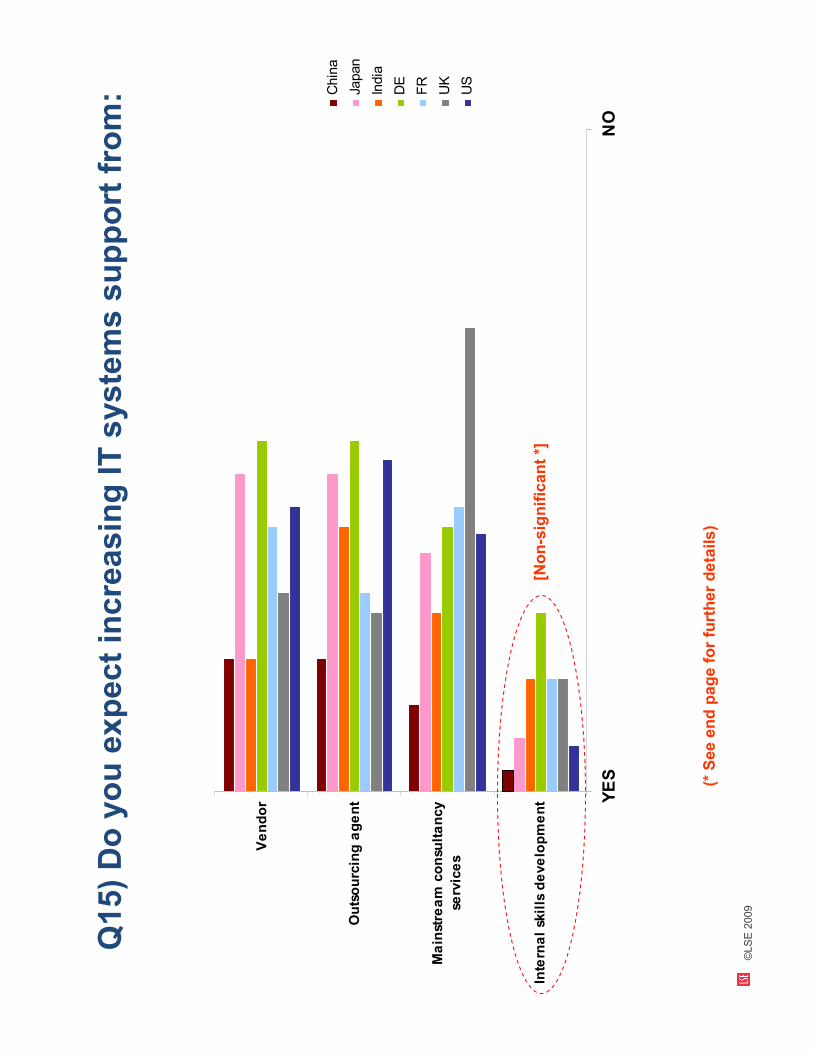
Q15) Do you expect increasing IT systems support from:
12
Internal skills development
Mainstream consultancy
services
Outsourcing agent
Vendor
China
Japan
India
DE
FR
UK
US
YES
NO
[Non-significant *]
©LSE 2009
(* See end page for further details)
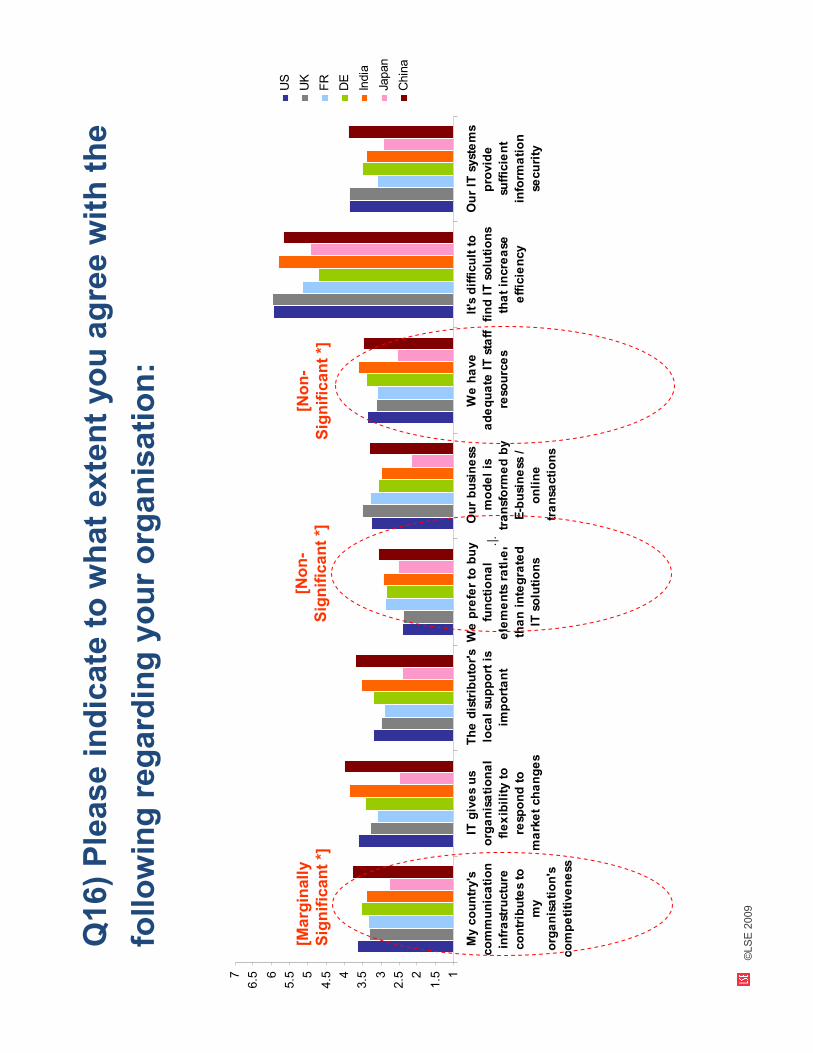
Q16) Please indicate to what extent you agree with the
following regarding your organisation:
1
1.52
2.53
3.54
4.55
5.56
6.57
My country's
communication
infrastructure
contributes to
my
organisation's
competitiveness
IT gives us
organisational
flexibility to
respond to
market changes
The distributor's
local support is
important
We prefer to buy
functional
elements rather
than integrated
IT solutions
Our business
model is
transform
ed by
E-business /
online
transactions
We have
adequate IT staff
resources
It's difficult to
find IT solutions
that increase
efficiency
Our IT systems
provide
sufficient
inform
ation
security
US
UK
FR
DE
India
Japan
China
.|.
[Marginally
Significant *]
[Non-
Significant *]
[Non-
Significant *]
©LSE 2009
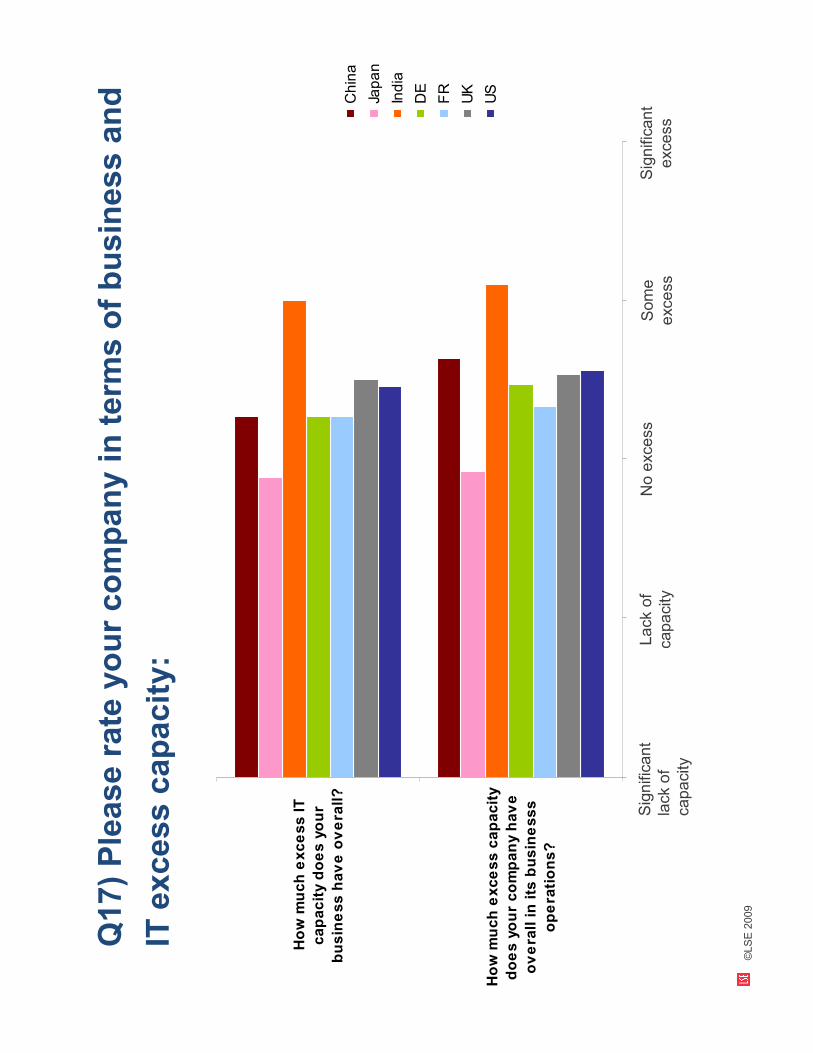
Q17) Please rate your company in term
s of business and
IT excess capacity:
12
34
5
How m
uch excess capacity
does your company have
overall in its businesss
operations?
How m
uch excess IT
capacity does your
business have overall?
China
Japan
India
DE
FR
UK
US
.|.
©LSE 2009
Significant
lack of
capacity
Lack of
capacity
No excess
Some
excess
Significant
excess
12345
1
US
UK
FR
DE
India
Japan
China
Q20) What im
pact does IT have on flexibility to expand
or contract the business in the short-term
?
©LSE 2009
Very
small
impact
Small
impact
Some-
what
impacting
Large
impact
Very
Large
impact
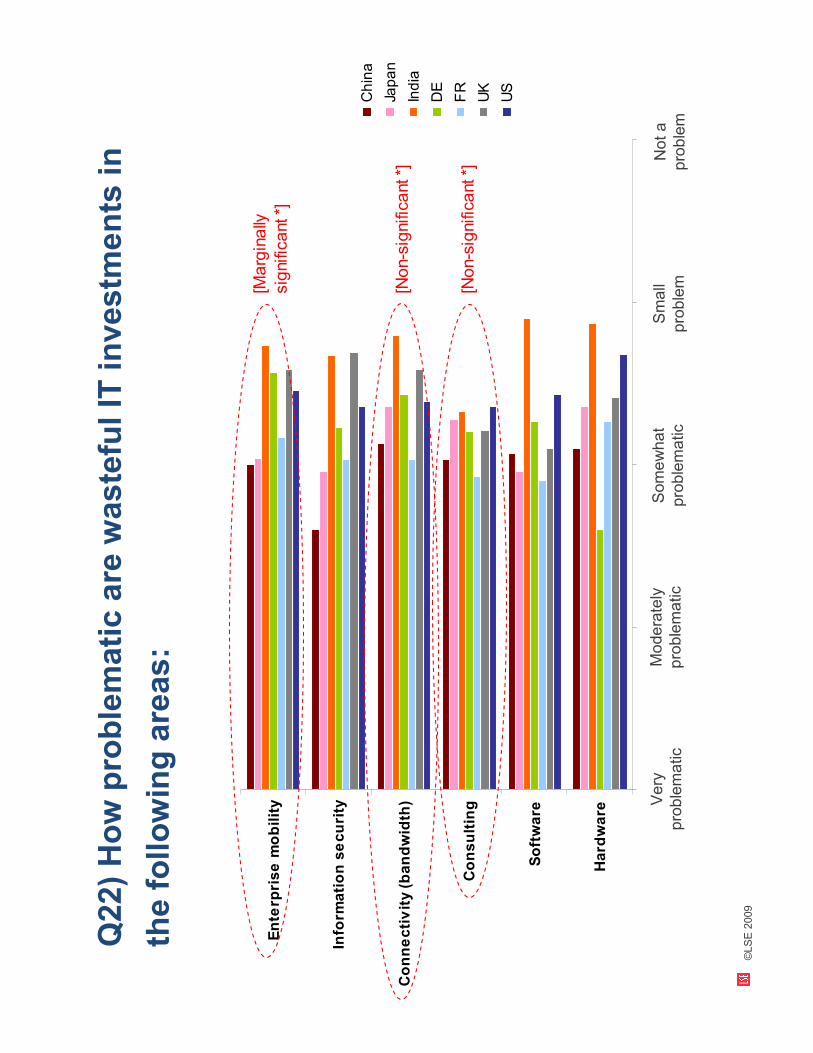
Q22) How problematic are wasteful IT investm
ents in
the following areas:
12
34
5
Hardware
Software
Consulting
Connectivity (bandwidth)
Inform
ation security
Enterprise m
obility
China
Japan
India
DE
FR
UK
US
[Non-significant *]
[Non-significant *]
[Marginally
significant *]
©LSE 2009
Very
problematic
Moderately
problematic
Somewhat
problematic
Small
problem
Not a
problem
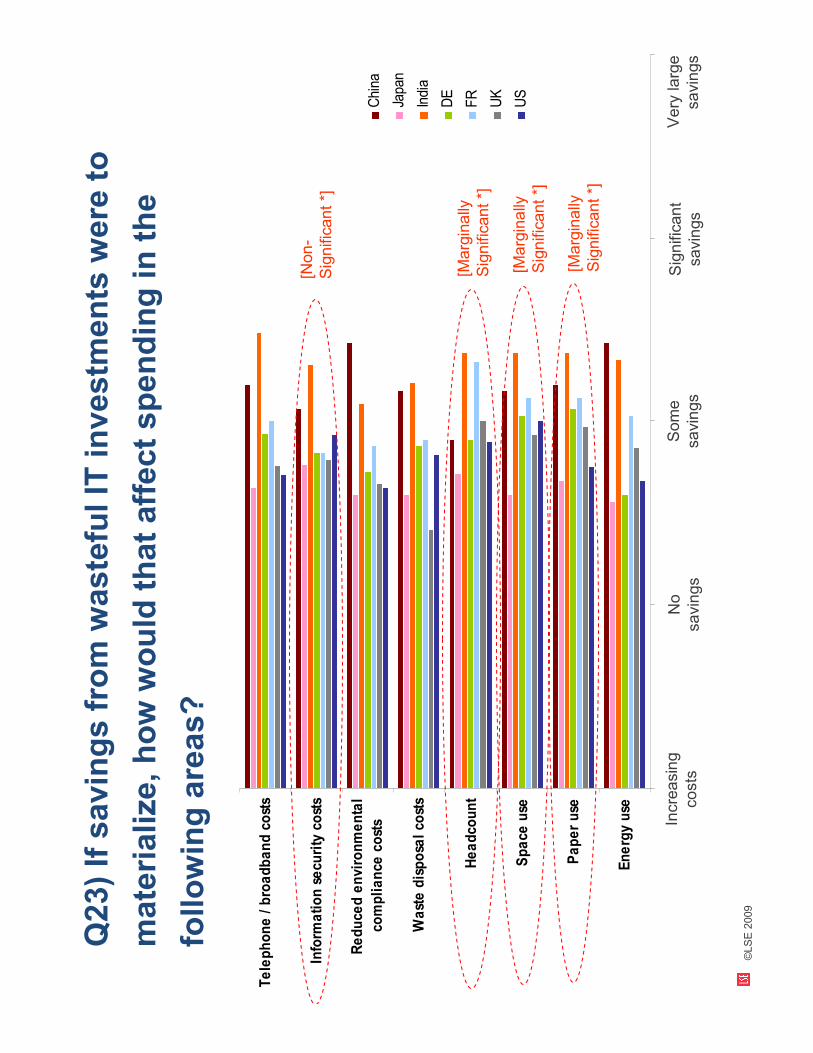
Q23) If savings from wasteful IT investm
ents were to
materialize, how would that affect spending in the
following areas?
12
34
5
Energy use
Paper use
Space use
Headcount
Waste disposal costs
Reduced environmental
compliance costs
Inform
ation security costs
Telephone / broadband costs
China
Japan
India
DE
FR
UK
US
.|.
[Non-
Significant *]
[Marginally
Significant *]
[Marginally
Significant *]
[Marginally
Significant *]
©LSE 2009
Increasing
costs
No
savings
Some
savings
Significant
savings
Very large
savings
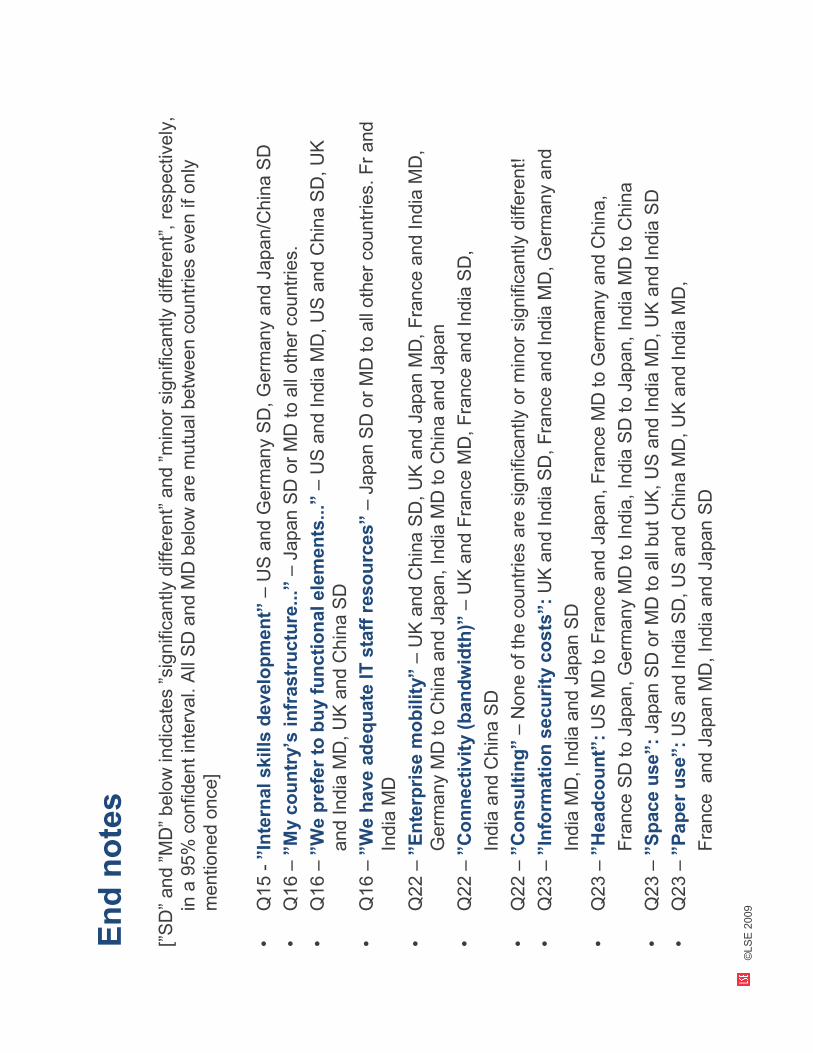
End notes
[”SD”and ”MD”below indicates”significantly different”and ”minor significantly different”, respectively,
in a 95% confident interval. All SD and M
D below are m
utual between countries even if only
mentioned once]
•Q15 -”Internal skills development”
–US and G
erm
any SD, Germ
any and Japan/China SD
•Q16 –”My country’s infrastructure...”
–Japan SD or MD to all other countries.
•Q16 –”We prefer to buy functional elements...”
–US and India M
D, US and China SD, UK
and India M
D, UK and China SD
•Q16 –”We have adequate IT staff resources”–Japan SD or MD to all other countries. Fr and
India M
D
•Q22 –”Enterprise m
obility”–UK and China SD, UK and Japan M
D, France and India M
D,
Germ
any M
D to China and Japan, India M
D to China and Japan
•Q22 –”Connectivity (bandwidth)”
–UK and France M
D, France and India SD,
India and China SD
•Q22 –”Consulting”–None of the countries are significantly or minor significantly different!
•Q23 –”Inform
ation security costs”: UK and India SD, France and India M
D, Germ
any and
India M
D, India and Japan SD
•Q23 –”Headcount”:US M
D to France and Japan, France M
D to G
erm
any and China,
France SD to Japan, Germ
any M
D to India, India SD to Japan, India M
D to China
•Q23 –”Space use”: Japan SD or MD to all but UK, US and India M
D, UK and India SD
•Q23 –”Paper use”: US and India SD, US and China M
D, UK and India M
D,
France and Japan M
D, India and Japan SD
©LSE 2009