Embed Size (px)
Citation preview
Chapter 1
Introduction, Basic Theory andPrinciples
1.1 INTRODUCTION
The main spectroscopies employed to detect vibrations in molecules are basedon the processes of infrared absorption and Raman scattering. They are widelyused to provide information on chemical structures and physical forms, toidentify substances from the characteristic spectral patterns (‘fingerprinting’),and to determine quantitatively or semi-quantitatively the amount of a sub-stance in a sample. Samples can be examined in a whole range of physicalstates; for example, as solids, liquids or vapours, in hot or cold states, in bulk,as microscopic particles, or as surface layers. The techniques are very wideranging and provide solutions to a host of interesting and challenging analyticalproblems. Raman scattering is less widely used than infrared absorption,largely due to problems with sample degradation and fluorescence. However,recent advances in instrument technology have simplified the equipment andreduced the problems substantially. These advances, together with the ability ofRaman spectroscopy to examine aqueous solutions, samples inside glass con-tainers and samples without any preparation, have led to a rapid growth in theapplication of the technique.
In practice, modern Raman spectroscopy is simple. Variable instrumentparameters are few, spectral manipulation is minimal and a simple interpret-ation of the data may be sufficient. This chapter and Chapter 2 aim to set outthe basic principles and experimental methods to give the reader a firm under-standing of the basic theory and practical considerations so that the technique
Modern Raman Spectroscopy – A Practical Approach W.E. Smith and G. Dent
� 2005 John Wiley & Sons, Ltd ISBNs: 0-471-49668-5 (HB); 0-471-49794-0 (PB)
can be applied at the level often required for current applications. However,Raman scattering is an underdeveloped technique, with much importantinformation often not used or recognized. Later chapters will develop theminimum theory required to give a more in-depth understanding of the dataobtained and to enable comprehension of some of the many more advancedtechniques which have specific advantages for some applications.
1.1.1 History
The phenomenon of inelastic scattering of light was first postulated bySmekal in 1923 [1] and first observed experimentally in 1928 by Raman andKrishnan [2]. Since then, the phenomenon has been referred to as Ramanspectroscopy. In the original experiment sunlight was focussed by a telescopeonto a sample which was either a purified liquid or a dust-free vapour.A second lens was placed by the sample to collect the scattered radiation.A system of optical filters was used to show the existence of scattered radi-ation with an altered frequency from the incident light – the basic characteristicof Raman spectroscopy.
1.2 BASIC THEORY
When light interacts with matter, the photons which make up the light may beabsorbed or scattered, or may not interact with the material and may passstraight through it. If the energy of an incident photon corresponds to theenergy gap between the ground state of a molecule and an excited state, thephoton may be absorbed and the molecule promoted to the higher energyexcited state. It is this change which is measured in absorption spectroscopyby the detection of the loss of that energy of radiation from the light. However,it is also possible for the photon to interact with the molecule and scatter from it.In this case there is no need for the photon to have an energy which matches thedifference between two energy levels of the molecule. The scattered photons canbe observed by collecting light at an angle to the incident light beam, andprovided there is no absorption from any electronic transitions which havesimilar energies to that of the incident light, the efficiency increases as thefourth power of the frequency of the incident light.
Scattering is a commonly used technique. For example, it is widely used formeasuring particle size and size distribution down to sizes less than 1 mm. Oneeveryday illustration of this is that the sky is blue because the higher energyblue light is scattered from molecules and particles in the atmosphere moreefficiently than the lower energy red light. However, the main scattering tech-nique used for molecular identification is Raman scattering.
2 Modern Raman Spectroscopy
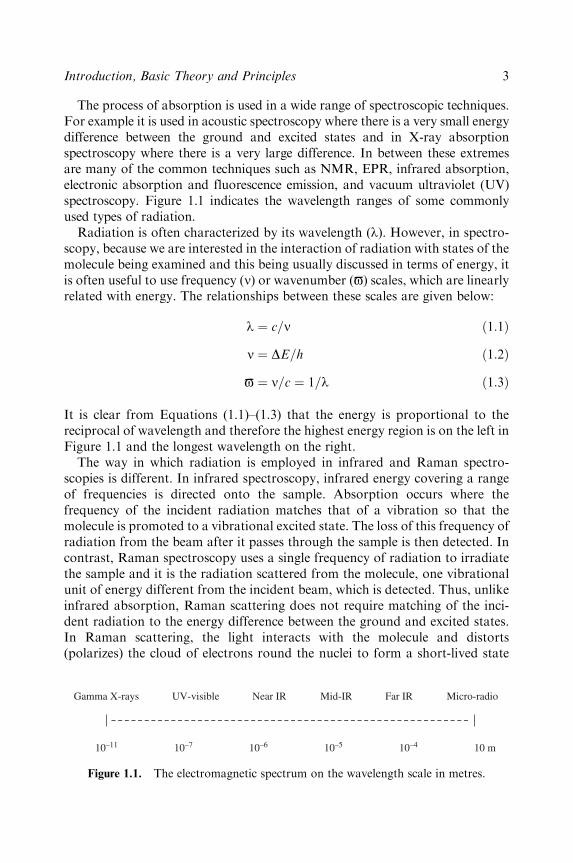
The process of absorption is used in a wide range of spectroscopic techniques.For example it is used in acoustic spectroscopy where there is a very small energydifference between the ground and excited states and in X-ray absorptionspectroscopy where there is a very large difference. In between these extremesare many of the common techniques such as NMR, EPR, infrared absorption,electronic absorption and fluorescence emission, and vacuum ultraviolet (UV)spectroscopy. Figure 1.1 indicates the wavelength ranges of some commonlyused types of radiation.
Radiation is often characterized by its wavelength (l). However, in spectro-scopy, because we are interested in the interaction of radiation with states of themolecule being examined and this being usually discussed in terms of energy, itis often useful to use frequency (n) or wavenumber (v) scales, which are linearlyrelated with energy. The relationships between these scales are given below:
l ¼ c=n ð1:1Þn ¼ DE=h ð1:2Þv ¼ n=c ¼ 1=l ð1:3Þ
It is clear from Equations (1.1)–(1.3) that the energy is proportional to thereciprocal of wavelength and therefore the highest energy region is on the left inFigure 1.1 and the longest wavelength on the right.
The way in which radiation is employed in infrared and Raman spectro-scopies is different. In infrared spectroscopy, infrared energy covering a rangeof frequencies is directed onto the sample. Absorption occurs where thefrequency of the incident radiation matches that of a vibration so that themolecule is promoted to a vibrational excited state. The loss of this frequency ofradiation from the beam after it passes through the sample is then detected. Incontrast, Raman spectroscopy uses a single frequency of radiation to irradiatethe sample and it is the radiation scattered from the molecule, one vibrationalunit of energy different from the incident beam, which is detected. Thus, unlikeinfrared absorption, Raman scattering does not require matching of the inci-dent radiation to the energy difference between the ground and excited states.In Raman scattering, the light interacts with the molecule and distorts(polarizes) the cloud of electrons round the nuclei to form a short-lived state
Gamma X-rays UV-visible Near IR Mid-IR Far IR Micro-radio
10–11 10–7 10–6 10–5 10–4 10 m
Figure 1.1. The electromagnetic spectrum on the wavelength scale in metres.
Introduction, Basic Theory and Principles 3

called a ‘virtual state’, which is discussed in Chapter 3. This state is not stableand the photon is quickly re-radiated.
The energy changes we detect in vibrational spectroscopy are those required tocause nuclearmotion. If only electron cloud distortion is involved in scattering, thephotons will be scattered with very small frequency changes, as the electrons arecomparatively light. This scattering process is regarded as elastic scattering and isthe dominant process. For molecules it is called Rayleigh scattering. However, ifnuclear motion is induced during the scattering process, energy will be transferredeither from the incident photon to the molecule or from the molecule to thescattered photon. In these cases the process is inelastic and the energy of thescattered photon is different from that of the incident photon by one vibrationalunit. This is Raman scattering. It is inherently a weak process in that only one inevery 106–108 photons which scatter is Raman scattered. In itself this does notmake the process insensitive since with modern lasers and microscopes, very highpower densities can be delivered to very small samples but it is does follow thatother processes such as sample degradation and fluorescence can readily occur.
Figure 1.2 shows the basic processes which occur for one vibration. At roomtemperature, most molecules, but not all, are present in the lowest energyvibrational level. Since the virtual states are not real states of the moleculebut are created when the laser interacts with the electrons and causes polariza-tion, the energy of these states is determined by the frequency of the light sourceused. The Rayleigh process will be the most intense process since most photonsscatter this way. It does not involve any energy change and consequently thelight returns to the same energy state. The Raman scattering process from theground vibrational statem leads to absorption of energy by the molecule and itspromotion to a higher energy excited vibrational state (n). This is called Stokes
Virtualstates
Stokes
Vibrationalstates
Rayleigh anti-Stokesm
n
Figure 1.2. Diagram of the Rayleigh and Raman scattering processes. The lowestenergy vibrational state m is shown at the foot with states of increasing energy aboveit. Both the low energy (upward arrows) and the scattered energy (downward arrows)have much larger energies than the energy of a vibration.
4 Modern Raman Spectroscopy

scattering. However, due to thermal energy, some molecules may be present inan excited state such as n in Figure 1.2. Scattering from these states to theground statem is called anti-Stokes scattering and involves transfer of energy tothe scattered photon. The relative intensities of the two processes depend on thepopulation of the various states of the molecule. The populations can be workedout from the Boltzmann equation (Chapter 3) but at room temperature, thenumber of molecules expected to be in an excited vibrational state other than anyreally low-energy ones will be small.
Thus, compared to Stokes scattering, anti-Stokes scattering will be weak andwill become weaker as the frequency of the vibration increases, due todecreased population of the excited vibrational states. Further, anti-Stokesscattering will increase relative to Stokes scattering as the temperature rises.Figure 1.3 shows a typical spectrum of Stokes and anti-Stokes scattering fromcyclohexane separated by the intense Rayleigh scattering which should be off-scale close to the point where there is no energy shift. However there ispractically no signal close to the frequency of the exciting line along the x-axis.This is because filters in front of the spectrometer remove almost all light withinabout 200 cm�1 of the exciting line. Some breakthrough of the laser light can beseen where there is no energy shift at all.
Usually, Raman scattering is recorded only on the low-energy side to giveStokes scattering but occasionally anti-Stokes scattering is preferred. Forexample, where there is fluorescence interference, this will occur at a lowerenergy than the excitation frequency and consequently anti-Stokes scatteringcan be used to avoid interference. The difference in intensities of Raman bandsin Stokes and anti-Stokes scattering can also be used to measure temperature.
0
20000
40000
60000
80000
100000
–1700 –1200 –700 –200 300 800 1300Raman shift (cm–1)
Inte
nsity
80
10 126 144
13115
420
100
200
300
400
500
–2000 –1800 –1600 –1400 –1200 –1000 –800 –600 –400 –200 0
Raman shift (cm–1)
Inte
nsity
–
–
–
600
Figure 1.3. Stokes and anti-Stokes scattering for cyclohexane. To show the weak anti-Stokes spectrum, the y-axis has been extended in the inset.
Introduction, Basic Theory and Principles 5

Figure 1.2 illustrates one key difference between infrared absorption andRaman scattering. As described above, infrared absorption would involvedirect excitation of the molecule from state m to state n by a photon of exactlythe energy difference between them. In contrast, Raman scattering uses muchhigher energy radiation and measures the difference in energy between n and mby subtracting the energy of the scattered photon from that of the incidentbeam (the two vertical arrows in each case).
The cyclohexane spectrum in Figure 1.3 shows that there is more than onevibration which gives effective Raman scattering (i.e. is Raman active); thenature of these vibrations will be discussed in Section 1.3. However, there is abasic selection rule which is required to understand this pattern. Intense Ramanscattering occurs from vibrations which cause a change in the polarizability ofthe electron cloud round the molecule. Usually, symmetric vibrations cause thelargest changes and give the greatest scattering. This contrasts with infraredabsorption where the most intense absorption is caused by a change in dipoleand hence asymmetric vibrations which cause this are the most intense. As willbe seen later, not all vibrations of a molecule need, or in some cases can, beboth infrared and Raman active and the two techniques usually give quitedifferent intensity patterns. As a result the two are often complementary and,used together, give a better view of the vibrational structure of a molecule.
One specific class of molecule provides an additional selection rule. In acentrosymmetric molecule, no band can be active in both Raman scattering andinfrared absorption. This is sometimes called the mutual exclusion rule. In acentrosymmetric molecule, reflection of any point through the centre will reachan identical point on the other side (C2H4 is centrosymmetric, CH4 is not). Thisdistinction is useful particularly for small molecules where a comparison of thespectra obtained from infrared absorption and Raman scattering can be used todifferentiate cis and trans forms of a molecule in molecules such as a simple azodye or a transition metal complex.
Figure 1.4 shows a comparison of the infrared and Raman spectra forbenzoic acid. The x-axis is given in wavenumbers for which the unit is cm�1.Wavenumbers are not recommended SI units but the practice of spectroscopy isuniversally carried out using these and this is unlikely to change. For infraredabsorption each peak represents an energy of radiation absorbed by the mole-cule. The y-axis gives the amount of the light absorbed and is usually shownwith the maximum absorbance as the lowest point on the trace. Raman scatter-ing is presented only as the Stokes spectrum and is given as a shift in energyfrom the energy of the laser beam. This is obtained by subtracting the scatteredenergy from the laser energy. In this way the difference in energy correspondingto the ground and excited vibrational states (n and m in Figure 1.2) is obtained.This energy difference is what is measured directly by infrared. The scattering ismeasured as light detected by the spectrometer and the maximum amount oflight detected is the highest point on the trace.
6 Modern Raman Spectroscopy

Strictly speaking, Raman scattering should be expressed as a shift inenergy from that of the exciting radiation and should be referred to asD cm�1 but it is often expressed simply as cm�1. This practice is followedin this book for simplicity. Although different energy ranges are possible, theinformation of interest to most users is in the 3600�400 cm�1 (2.8–12micron) range in infrared spectroscopy and down to 200 cm�1 in Ramanspectroscopy since this includes most modes which are characteristic of amolecule. In some applications, much larger or smaller energy changes arestudied and modern Raman equipment can cope with much wider ranges.One specific advantage of Raman scattering is that shifts from the laser lineof 50 cm�1 or lower can easily be recorded with the correct equipment. Manymodern machines for reasons of cost and simplicity are not configured in asuitable way to measure shifts below 100�200 cm�1. The intensities of thebands in the Raman spectrum are dependent on the nature of the vibration beingstudied and on instrumentation and sampling factors. Modern instruments shouldbe calibrated to remove the instrument factors but this is not always the case; thesefactors are dealt with in the next chapter. Sampling has a large effect on theabsolute intensities, bandwidths observed and band positions. Again these willbe dealt with later. This chapter will concentrate on the effect on Raman scatteringof the set of vibrations present in a molecule and set out a step-by-step approach tointerpretation based on simple selection rules.
4000 3000 2000 1500 1000 500 105
cm–1
%T
Figure 1.4. Infrared and Raman spectra of benzoic acid. The top trace is infraredabsorption given in % transmission (%T) so that the lower the transmission value thegreater the absorption. The lower trace is Raman scattering and the higher the peak thegreater the scattering.
Introduction, Basic Theory and Principles 7
1.3 MOLECULAR VIBRATIONS
Provided that there is no change in electronic energy, for example, by theabsorption of a photon and the promotion of an electron to an excited elec-tronic state, the energy of a molecule can be divided into a number of differentparts or ‘degrees of freedom’. Three of these degrees of freedom are taken up todescribe the translation of the molecule in space and three to describe rotationalmovement except for linear molecules where only two types of rotation arepossible. Thus, if N is the number of atoms in a molecule, the number ofvibrational degrees of freedom and therefore the number of vibrations possibleis 3N � 6 for all molecules except linear ones where it is 3N � 5. For a diatomicmolecule, this means there will be only one vibration. In a molecule such asoxygen, this is a simple stretch of the O–O bond. This will change the polariz-ability of the molecule but will not induce any dipole change since there is nodipole in the molecule and the vibration is symmetric about the centre. Thus theselection rules already discussed would predict, and it is true, that oxygen gaswill give a band in the Raman spectrum and no band in the infrared spectrum.However in a molecule such as nitric oxide, NO, there will be only one bandbut, since there is both a dipole change and a polarizability change, it willappear in both the infrared and Raman spectrum.
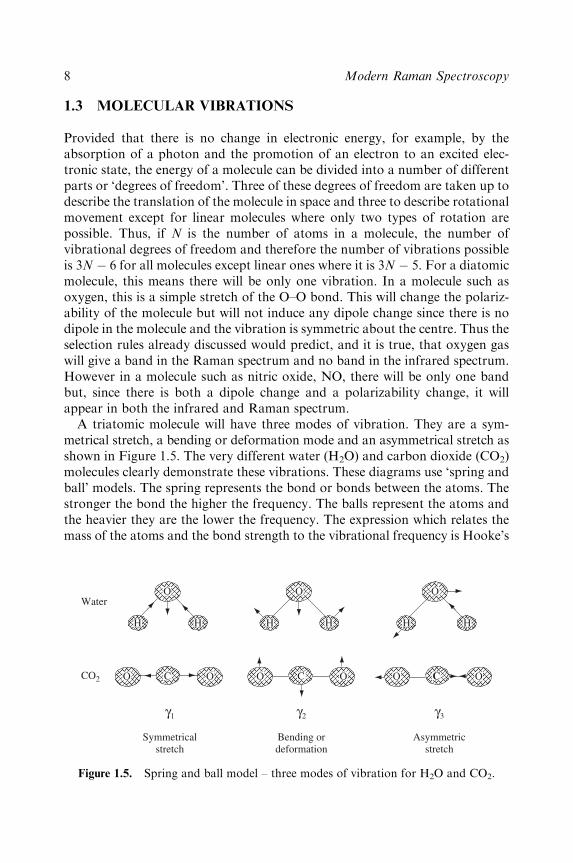
A triatomic molecule will have three modes of vibration. They are a sym-metrical stretch, a bending or deformation mode and an asymmetrical stretch asshown in Figure 1.5. The very different water (H2O) and carbon dioxide (CO2)molecules clearly demonstrate these vibrations. These diagrams use ‘spring andball’ models. The spring represents the bond or bonds between the atoms. Thestronger the bond the higher the frequency. The balls represent the atoms andthe heavier they are the lower the frequency. The expression which relates themass of the atoms and the bond strength to the vibrational frequency is Hooke’s
Water
CO2
Symmetricalstretch
Bending ordeformation
Asymmetricstretch
γ1 γ2 γ3
H
O
H H
O
H H
O
H
OCOOCOOCO
Figure 1.5. Spring and ball model – three modes of vibration for H2O and CO2.
8 Modern Raman Spectroscopy

law which is dealt with in Chapter 3, but for the present, it is clear that strongbonds and light atoms will give higher frequencies of vibration and heavyatoms and weak bonds will give lower ones.
This simple model is widely used to interpret vibrational spectra. However,the molecule actually exists as a three-dimensional structure with a pattern ofvarying electron density covering the whole molecule. A simple depiction of thisfor carbon dioxide is shown in Figure 1.6. If either molecule vibrates, theelectron cloud will alter as the positive nuclei change position and dependingon the nature of the change, this can cause a change of dipole moment orpolarization. In these triatomic molecules, the symmetrical stretch causes largepolarization changes and hence strong Raman scattering with weak or nodipole change and hence weak or no infrared absorption. The deformationmode causes a dipole change but little polarization change and hence stronginfrared absorption and weak or non-existent Raman scattering.
As an example of this, Figure 1.7 illustrates the vibrations possible forcarbon disulphide along with the corresponding infrared absorption andRaman scattering spectra.
Although this type of analysis is suitable for small molecules, it is more difficultto apply in a more complex molecule. Figure 1.8 shows one vibration from a dyein which a large number of atoms are involved. This is obtained from a theoreticalcalculation using density functional theory (DFT) which is discussed brieflylater. It probably gives a depiction of the vibration which is close to the truth.However, even if it were possible to calculate the spectrum of every moleculequickly in the laboratory, which at present it is not, this type of diagram is only oflimited utility to the spectroscopist. A comparison between molecules of similartype is difficult unless a full calculation is available for them all and each subtlechange in the nuclear displacements is drawn out or accurately described foreach one. This limits the ability to compare large numbers of molecules or tounderstand the nature of vibrations inmolecules for which there is no calculation.
The usual approach to describing vibrations is to simplify the problem andbreak the displacements down into a number of characteristic features, which
O C Oδ– δ–δ+
O C Oδ– δ–δ+
IR active
Raman active
Figure 1.6. Electron cloud model of water and carbon dioxide showing an IR and aRaman active vibrations.
Introduction, Basic Theory and Principles 9

can relate to more than one molecule. In the vibration in Figure 1.8 whichcomes from a calculation to predict the energies of vibrations each azo dye, thebiggest displacements of the heavier atoms is on one of the ring systems.The vibration would almost certainly be labelled vaguely as a ‘ring stretch’.In another vibration not shown the situation was much simpler. Largedisplacements were found on the two nitrogen atoms which form the azo bondbetween the rings, and the direction indicated bond lengthening and contractingduring the vibrational cycle. Thus this vibration is called the azo stretch, andthere is a change in polarizability just as there was for oxygen; so it should be aRaman-active vibration. We can search for these vibrations in the actualspectrum and hopefully match a peak to the vibration. This is called assigningthe vibration. Thus, it is possible to describe a vibration in a few helpful words.In some cases this is fairly accurate as for the azo stretch, but in some cases, thedescription is not adequate to describe the actual movement. However, com-mon bands can be assigned and reasonably described in many molecules.
Vibration
Dipolemoment
Polariz-ability
IRspectrum
Ramanspectrum
000 cm–1 3000 2000 1000 ν
Va Vas δs
∂µ /∂Q ≠ 0∂µ /∂Q ≠ 0∂µ /∂Q = 0
∂α/∂Q ≠ 0 ∂α/∂Q = 0 ∂α/∂Q = 0
Figure 1.7. Dipole and polarization changes in carbon disulphide, with resultantinfrared and Raman spectra. (Reprinted from A. Fadini and F.-M. Schnepel, Vibra-tional Spectroscopy: Methods and Applications, Ellis Horwood Ltd, Chichester, 1989.)
10 Modern Raman Spectroscopy

1.3.1 Group Vibrations
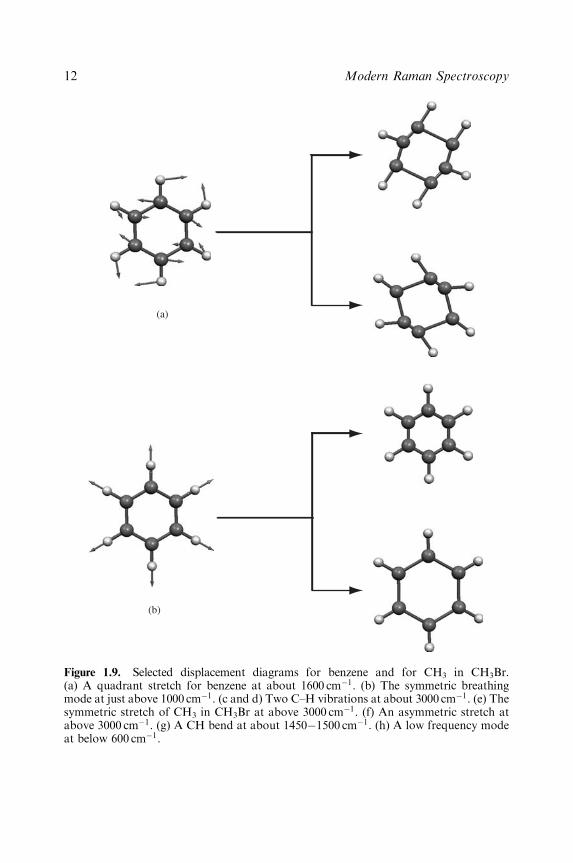
To assign vibrations to spectral peaks it is necessary to realize that two or morebonds which are close together in a molecule and are of similar energies caninteract and it is the vibration of the group of atoms linked by these bondswhich is observed in the spectrum. For example, the CH2 group is said to have asymmetric and an anti-symmetric stretch rather than two separate CH stretches(Figure 1.9). It follows from this and from the geometry of the molecule thatdifferent types of vibrations are possible for different groups. Selected examplesof a few of these for CH3 and C6H6 are shown in Figure 1.9.
In contrast, where there is a large difference in energy between the vibrationsin different bonds or if the atoms are well separated in the molecule, they can betreated separately. Thus, for CH3Br, the C–H bonds in CH3 must be treated asa group but the C–Br vibration is treated separately. In Figure 1.9, the selectedvibrations of benzene are shown in two different ways. Firstly they are shownwith the molecule in the equilibrium position with arrows showing the directionof the vibrational displacement. To illustrate what this means, they are alsoshown with the vibration at the extremes of the vibrational movement. To show
Figure 1.8. A displacement diagram for a vibration at about 1200 cm�1 in a dyeindicating the involvement of a number of atoms. The arrows show the direction ofthe displacement. Since the equilibrium position of the atoms is shown, during acomplete vibration the arrows will reverse in direction.
Introduction, Basic Theory and Principles 11
(a)
(b)
Figure 1.9. Selected displacement diagrams for benzene and for CH3 in CH3Br.(a) A quadrant stretch for benzene at about 1600 cm�1. (b) The symmetric breathingmode at just above 1000 cm�1. (c and d) Two C–H vibrations at about 3000 cm�1. (e) Thesymmetric stretch of CH3 in CH3Br at above 3000 cm�1. (f) An asymmetric stretch atabove 3000 cm�1. (g) A CH bend at about 1450�1500 cm�1. (h) A low frequency modeat below 600 cm�1.
12 Modern Raman Spectroscopy

(c)
(d)
(e)
Figure 1.9. Continued.
Introduction, Basic Theory and Principles 13

(h)
(g)
(f)
Figure 1.9. Continued.
14 Modern Raman Spectroscopy

the selected CH3 group vibrations, the molecule is completed using a bromine.As discussed, the C–Br bond vibrates at a much lower frequency and does notinteract appreciably with the high CH3 displacements shown.
1.3.2 An Approach to Interpretation
It is possible to give energy ranges in which the characteristic frequencies of themost common groups which are strong in either infrared or Raman scatteringcan occur. The relative intensities of specific peaks help to confirm that thecorrect vibration has been picked out.
For example, carbonyl groups >C¼¼O which are both asymmetric and ionicwill have a dipole moment which will change when the group stretches in amanner analogous to oxygen. They have strong bands in the infrared spectrum
Table 1.1. Single vibration and group frequencies and possible intensities of peakscommonly identified in Raman scattering. The length of the vertical line represents thewavenumber range in cm�1 in which each type of vibration is normally found and theline thickness gives an indication of intensity with thick lines being the most intense.
3600
3500
3400
3300
3200
3100
3000
2900
2800
2700
2600
OH
PhenolAlcohol
CH = CHAromaticC–H
= CH2
C–CH3 CH2
O–CH3N–CH3Aldehyde
Thiols(SH)
Amine, AmideAlkyne
Introduction, Basic Theory and Principles 15

but are weaker in the Raman spectrum. They are usually present at�1700 cm�1.Symmetrical groups such as unsaturated bonds (–C¼¼C–) and disulphide bonds(–S–S–) are weak infrared absorbers, but strong Raman scatterers. The stretchingmodes for these vibrations are �1640 and 500 cm�1 respectively. There are manymore examples. It is the combination of the knowledge of approximateenergy and likely relative intensity of particular vibrations which form the basisof the assignment mode used by most spectroscopists. For example,the 4000�2500 cm�1 is the region where single bonds (X–H) absorb. The2500�2000 cm�1 is referred to as the multiple bond (–N¼¼C¼¼O) region. The2000�1500 cm�1 region is where double bonds (–C¼¼O, –C¼¼N, –C¼¼C–) occur.Below 1500 cm�1, some groups, e.g. nitro (O¼¼N¼¼O) do have specific bands butmany molecules have complex patterns of Carbon–Carbon and Carbon–Nitro-gen vibrations. The region is generally referred to as the Fingerprint region.Significant bands below 650 cm�1 usually arise from inorganic groups, metal-organic groups or lattice vibrations. Tables 1.1–1.5 show the frequency ranges of
Table 1.2. Single vibration and group frequencies and an indication of possibleintensities of peaks commonly identified in Raman scattering
2600
2500
2400
2300
2200
2100
2000
1900
1800
1750
1700
Thiols(SH)
P–H
Isocyanate NitrileAromatic nitrile
Diazonium salt
Thiocyanate Isonitrile Si–HAzide
Isothiocyanate
Anhydride LactoneAcid chloride
KetoneCarboxylic acid
AldehydeEster
Alkyne
16 Modern Raman Spectroscopy
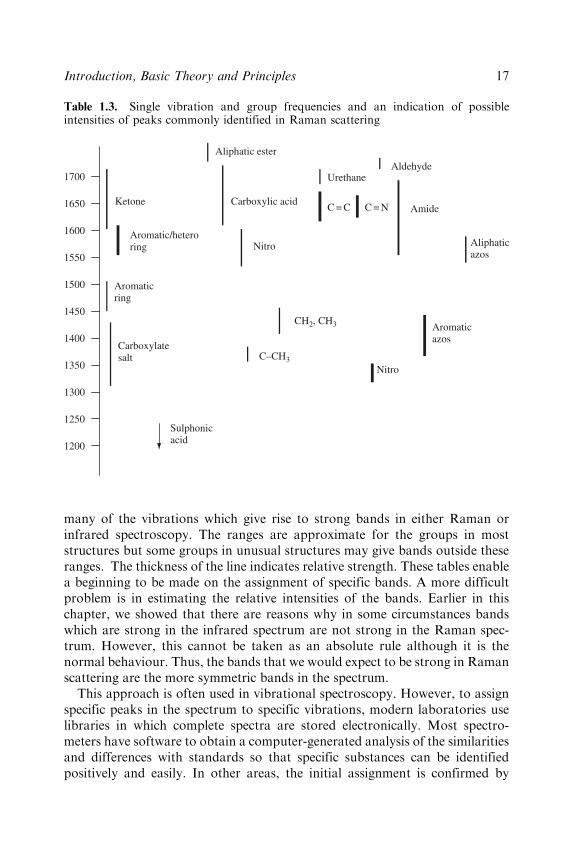
many of the vibrations which give rise to strong bands in either Raman orinfrared spectroscopy. The ranges are approximate for the groups in moststructures but some groups in unusual structures may give bands outside theseranges. The thickness of the line indicates relative strength. These tables enablea beginning to be made on the assignment of specific bands. A more difficultproblem is in estimating the relative intensities of the bands. Earlier in thischapter, we showed that there are reasons why in some circumstances bandswhich are strong in the infrared spectrum are not strong in the Raman spec-trum. However, this cannot be taken as an absolute rule although it is thenormal behaviour. Thus, the bands that we would expect to be strong in Ramanscattering are the more symmetric bands in the spectrum.
This approach is often used in vibrational spectroscopy. However, to assignspecific peaks in the spectrum to specific vibrations, modern laboratories uselibraries in which complete spectra are stored electronically. Most spectro-meters have software to obtain a computer-generated analysis of the similaritiesand differences with standards so that specific substances can be identifiedpositively and easily. In other areas, the initial assignment is confirmed by
Table 1.3. Single vibration and group frequencies and an indication of possibleintensities of peaks commonly identified in Raman scattering
1700
1650
1600
1550
1500
1450
1400
1350
1300
1250
1200
Ketone Carboxylic acid
Aldehyde
Aliphatic ester
Urethane
C = C C = N
Aromatic/heteroring
Amide
Aromaticring
Carboxylatesalt
CH2, CH3 Aromaticazos
C–CH3Nitro
Sulphonicacid
Aliphaticazos
Nitro
Introduction, Basic Theory and Principles 17

DFT calculations, where the great advantages are a more accurate assessmentof the nature of the vibrations and hence of molecular structure.
Predicting the principal infrared absorption bands for small molecules isrelatively simple as shown above, but for large molecules, the number of bandspossible is very large. Fortunately, many of these bands overlap and what isobserved at room temperature are broad envelopes with recognizable shapesin some energy regions and sharp bands due to specific bonds such as –C¼¼Oin some others. Since some vibrations arise from groups of atoms such as theatoms in a carbon chain or from rings linked by bonds of approximately thesame energy, the number of peaks and their energies are linked to the overallshape of the molecule. These are called fingerprint bands and the pattern ofthese bands can help identify a specific molecule in situ in a sample. However,for more complex systems, much time can be spent in the assignment of thesebands to the bending, stretching or deformation modes but unless the mole-cule studied is one of a well-understood set such as an alkane chain of aspecific length, this more in-depth analysis does not provide much additionalhelp in the majority of first attempts to identify specific materials from thespectrum.
Table 1.4. Single vibration and group frequencies and an indication of possibleintensities of peaks commonly identified in Raman scattering
1200
1150
1100
1050
1000
950
900
850
800
750
700
Sulphonicacid
C–O–CEthers
Sulphonesulphonamide Si–O –C
C = S
Si–O –Si
Si–O–CSulphonic acid
Carboxylicaciddimer
CHX = CYZ
C–Cl C–S
ν C–C aliphatic chains
Aromatic rings
C–F
18 Modern Raman Spectroscopy

Raman spectra are usually somewhat simpler. The most environmentallysensitive bands, e.g. OH and NH, are broad and weak and the backbonestructural bands are strong and sharp. The extent of this difference can beillustrated from the fact that water can be used as a solvent to obtain theRaman spectra of organic molecules. This indicates the relative strength ofbands in the organic molecule compared to the weakness of hydrogen bondedspecies such as the OH bands in water. It is this greater selectivity which leadsto the simplicity of Raman spectra compared to infrared spectra. Thus, theRaman spectra of quite large molecules show clear bands. In Figure 1.4 theinfrared spectrum is complex and has a strong band just above 1600 cm�1 fromthe carbonyl group due to the C¼¼O vibration. The strong bands in the Ramanspectrum are largely due to the aromatic group. The band at 2900 cm�1 due tothe CH2 group is hidden under the strong OH bands in the infrared spectrumbut can be clearly seen in the Raman spectrum.
The above information makes it possible to start assigning and interpretingRaman spectra. If possible it is always good to run an infrared spectrum for
Table 1.5. Single vibration and group frequencies and an indication of possibleintensities of peaks commonly identified in Raman scattering
700
650
600
550
500
450
400
350
300
250
200
C–Cl C–Saliphatic
C–Br
C = S
Si–O–SiS–S
C–I
Xmetal–OSe–Seδ C–C aliphatic
chains
0
Lattice vibrations
ν C–C aliphaticchains
Introduction, Basic Theory and Principles 19

comparison. The phrase ‘interpretation of Raman spectra’ is used in manydifferent ways. The spectrum of a molecule can be the subject of a full math-ematical interpretation in which every band is carefully assigned or of a cursorylook to produce the interpretation ‘Yes that is toluene’. However, to be able tocarry out a complete, correct and relevant interpretation, the total Ramanexperiment must be considered. Raman spectroscopists have to make a numberof choices in deciding how to examine a sample and the type of answer requiredmay ultimately determine these choices. The simplicity and flexibility of Ramanscattering are considerable advantages but if care is not taken in making thecorrect choices, poor or spurious results can be obtained. Chapter 2 describesthe choices and provides the background information to enable the recordingand interpretation of Raman scattering in a reliable and secure manner.
1.4 SUMMARY
In this chapter we have attempted to introduce the reader to the basic principlesof Raman spectroscopy without going into the theory and details of practicetoo deeply, with a view to encouraging further interest. Chapter 2 outlines thepractical choices to be made in carrying out the Raman experiment in full.Later chapters give the theoretical background required for full analysis ofspectra, a guide to ways in which Raman spectroscopy has been successfullyemployed, and lead to the more sophisticated but less common techniquesavailable to the Raman spectroscopist.
REFERENCES
1. A. Smekal, Naturwissenschaften, 43, 873 (1923).
2. C.V. Raman and K.S. Krishnan, Nature, 121, 501 (1928).
BIBLIOGRAPHY
We have provided a general bibliography. Listed here are a number of publications
which the authors have found useful for reference, for theoretical aspects of the spectros-
copy and for aids in interpretation.
J.R. Ferraro and K. Nakamoto, Introductory Raman Spectroscopy, Academic Press,
San Diego, 1994.
P. Hendra, C. Jones and G. Warnes, FT Raman Spectroscopy, Ellis Horwood Ltd,
Chichester, 1991.
A. Fadini and F.-M. Schnepel, Vibrational Spectroscopy: Methods and Applications, Ellis
Horwood Ltd, Chichester, 1989.
20 Modern Raman Spectroscopy

N.B. Colthrup, L.H. Daly and S.E. Wiberley, Introduction to Infrared and Raman
Spectroscopy. 3rd Edition, Academic Press, San Diego, 1990.
D. Lin-Vien, N.B. Colthrup, W.G. Fateley and J.G. Grasselli, The Handbook of Infrared
and Raman Characteristic Frequencies of Organic Molecules, John Wiley & Sons,
New York, 1991.
I.A. Degen, Tables of Characteristic Group frequencies for the Interpretation of Infrared
and Raman Spectra, Acolyte Publications, Harrow, UK, 1997.
D.M. Adams, Metal – Ligands and Related Vibrations, Edward Arnold Ltd, London,
1967.
Introduction, Basic Theory and Principles 21