Embed Size (px)
Citation preview
DENSITY OF STATES MEASUREMENTS OF THIN FILM SEMICONDUCTOR MATERIALS
USING PHOTOCURRENT METHODS
NASTITI PUSPITOSARI
DIRECTEUR DE THÈSE : CHRISTOPHE LONGEAUD
1
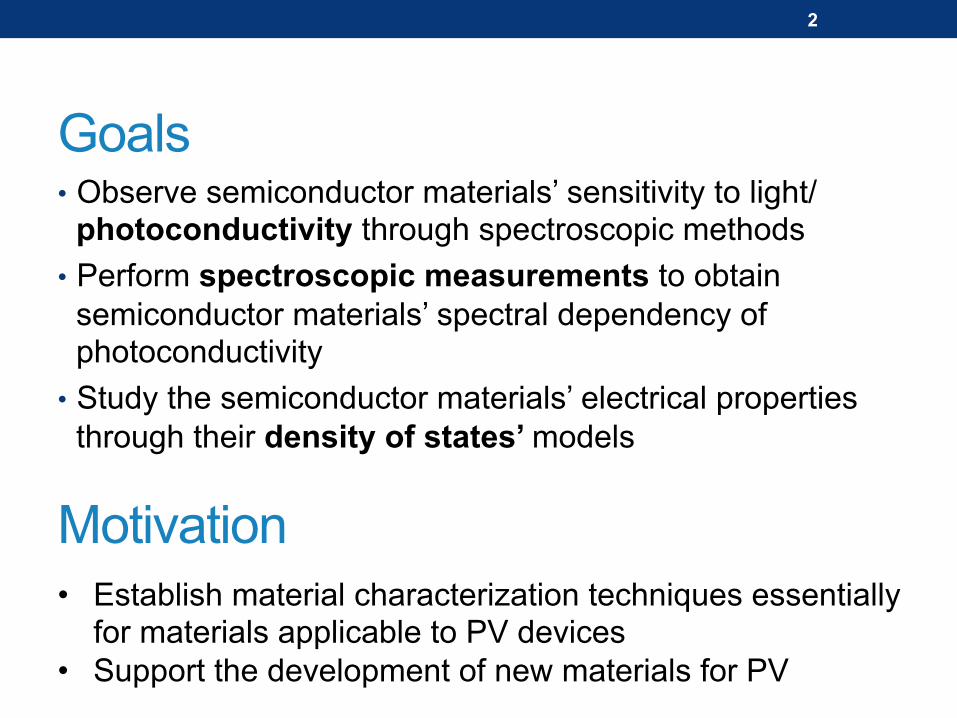
• Observe semiconductor materials’ sensitivity to light/ photoconductivity through spectroscopic methods
• Perform spectroscopic measurements to obtain semiconductor materials’ spectral dependency of photoconductivity
• Study the semiconductor materials’ electrical properties through their density of states’ models
Goals
• Establish material characterization techniques essentially for materials applicable to PV devices
• Support the development of new materials for PV
2
Motivation
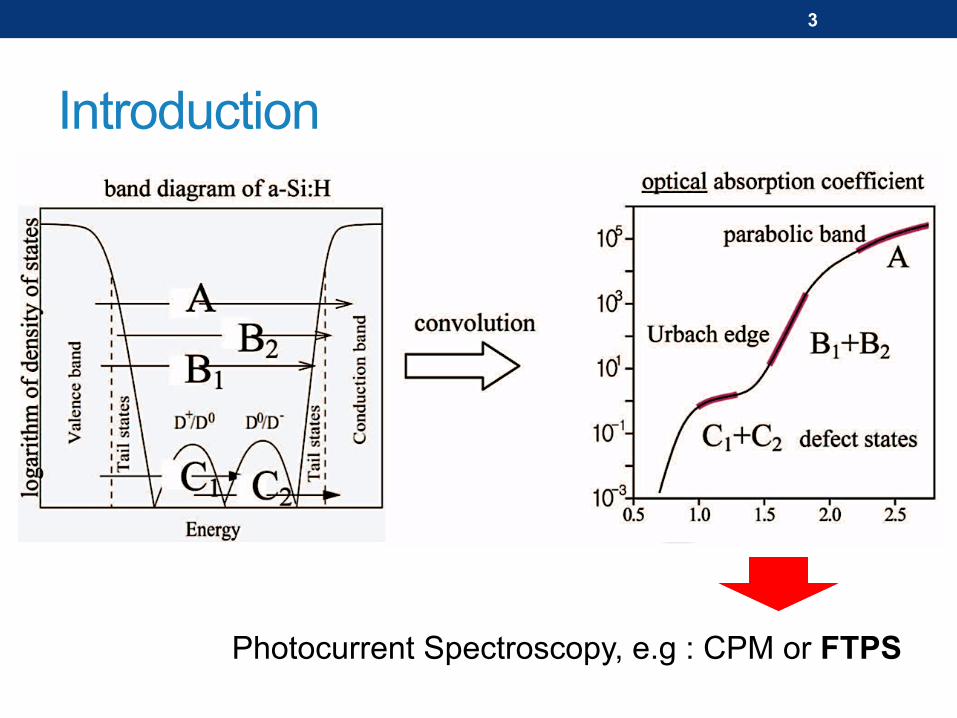
Introduction
Photocurrent Spectroscopy, e.g : CPM or FTPS
3
CPM VS. FTPS
4
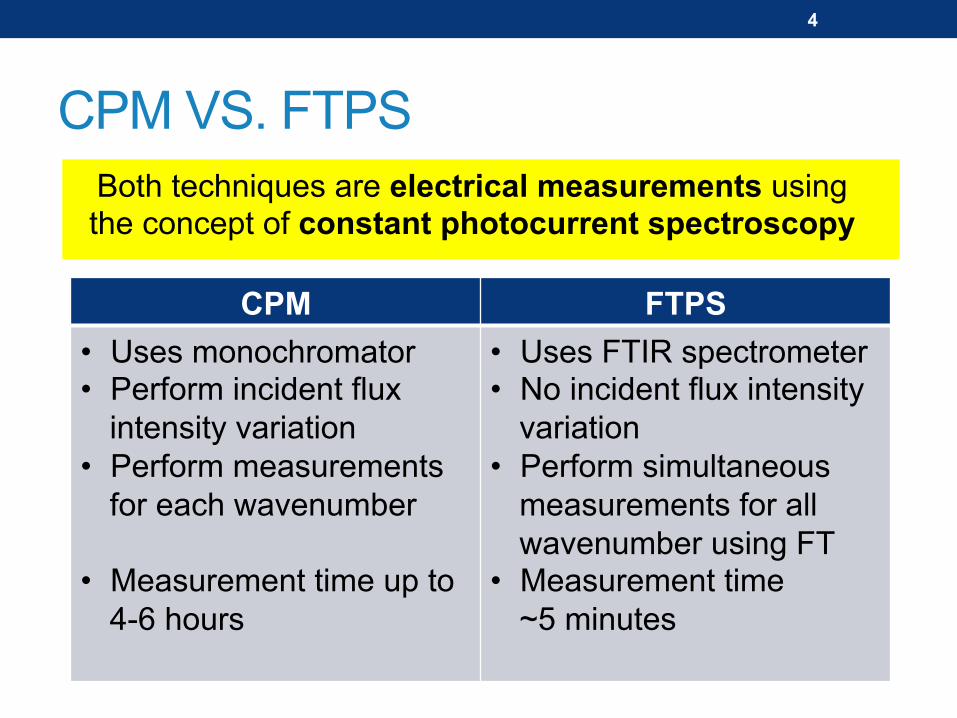
Both techniques are electrical measurements using the concept of constant photocurrent spectroscopy
CPM FTPS
• Uses monochromator • Perform incident flux
intensity variation • Perform measurements
for each wavenumber • Measurement time up to
4-6 hours
• Uses FTIR spectrometer • No incident flux intensity
variation • Perform simultaneous
measurements for all wavenumber using FT
• Measurement time ~5 minutes
FTPS Principles
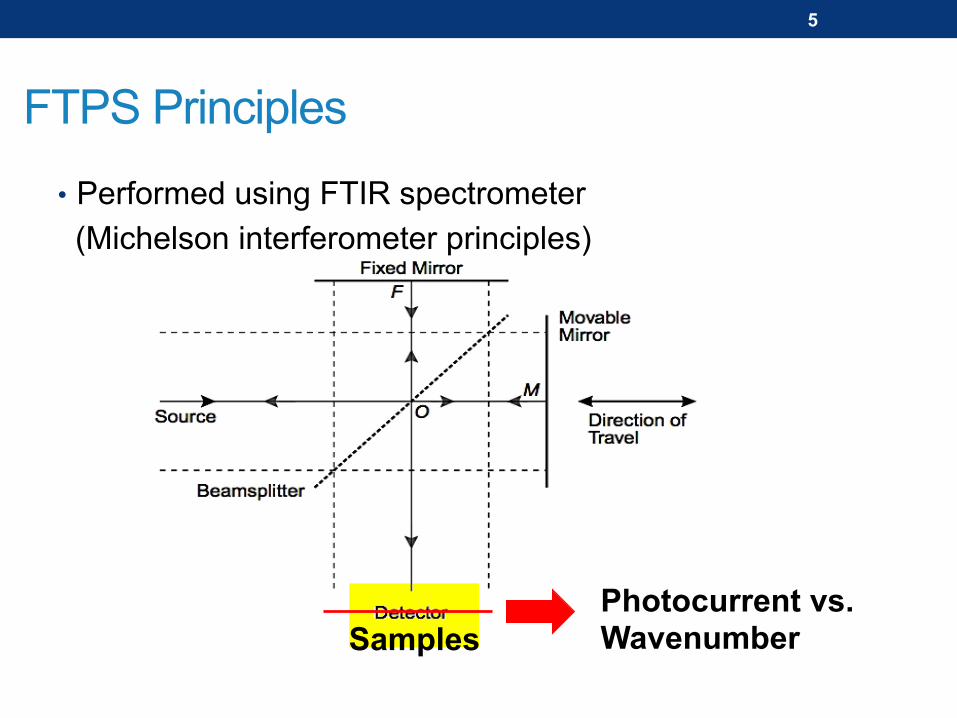
• Performed using FTIR spectrometer (Michelson interferometer principles)
Samples Photocurrent vs. Wavenumber
5
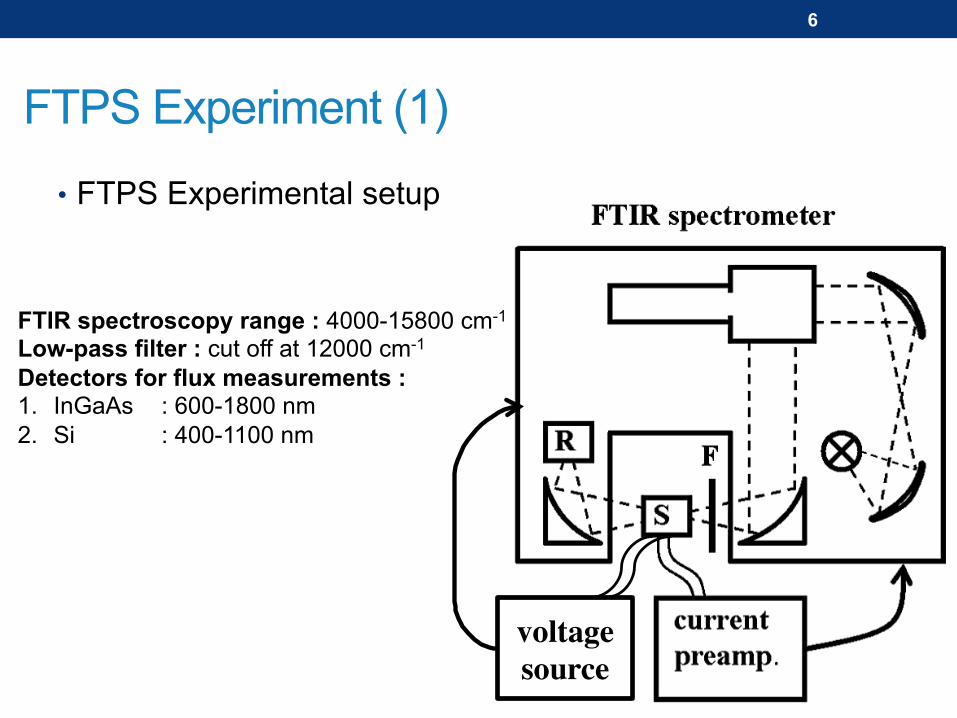
• FTPS Experimental setup
FTPS Experiment (1)
FTIR spectroscopy range : 4000-15800 cm-1
Low-pass filter : cut off at 12000 cm-1 Detectors for flux measurements : 1. InGaAs : 600-1800 nm 2. Si : 400-1100 nm
6
voltage source
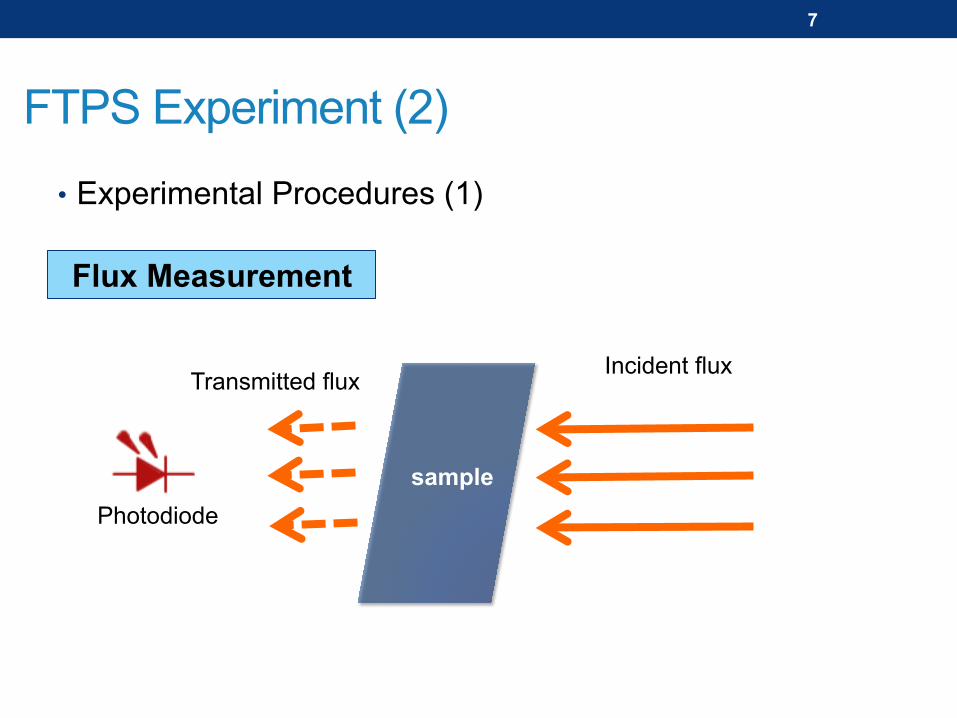
• Experimental Procedures (1)
FTPS Experiment (2)
Flux Measurement
sample
Incident flux Transmitted flux
Photodiode
7
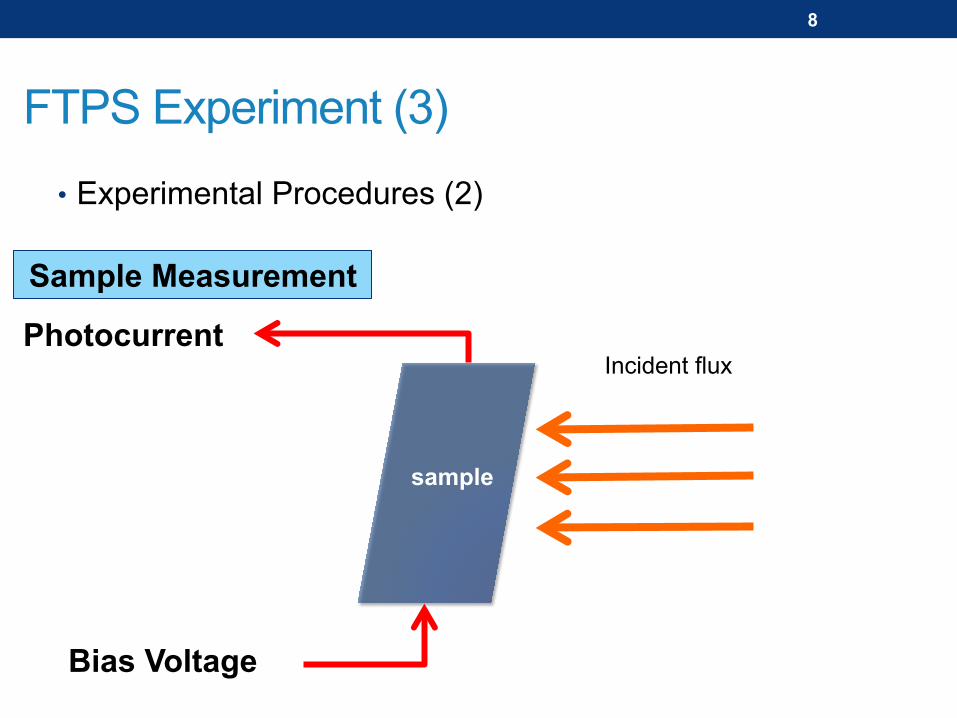
• Experimental Procedures (2)
FTPS Experiment (3)
Sample Measurement
sample
Incident flux
Bias Voltage
Photocurrent
8
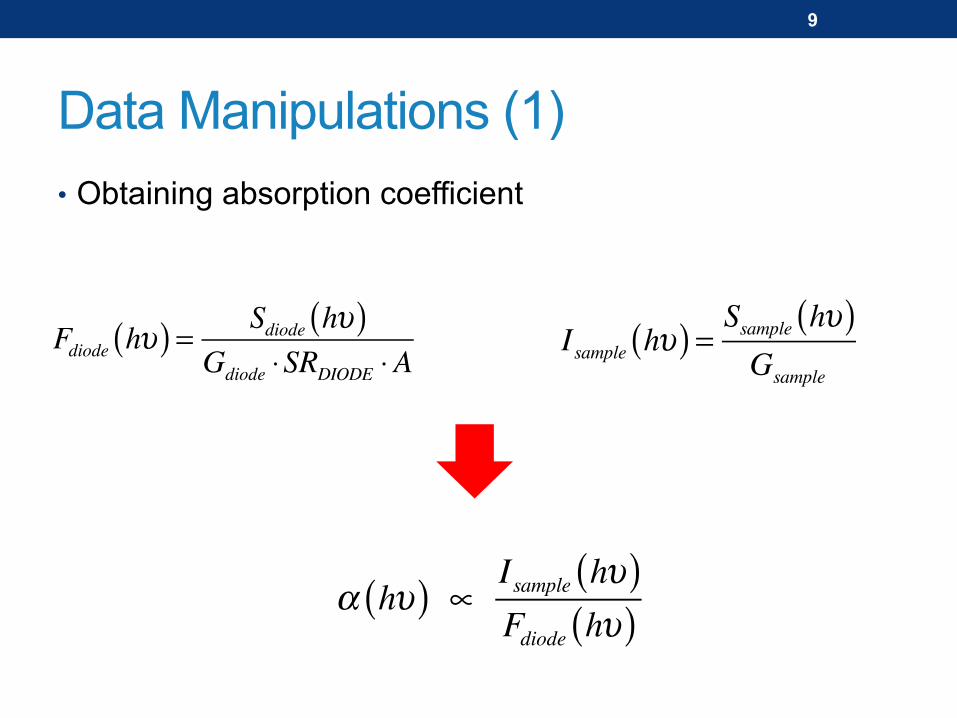
Data Manipulations (1) • Obtaining absorption coefficient
Fdiode hυ( ) = Sdiode hυ( )Gdiode ⋅SRDIODE ⋅A
Isample hυ( ) = Ssample hυ( )Gsample
α hυ( ) ∝Isample hυ( )Fdiode hυ( )
9
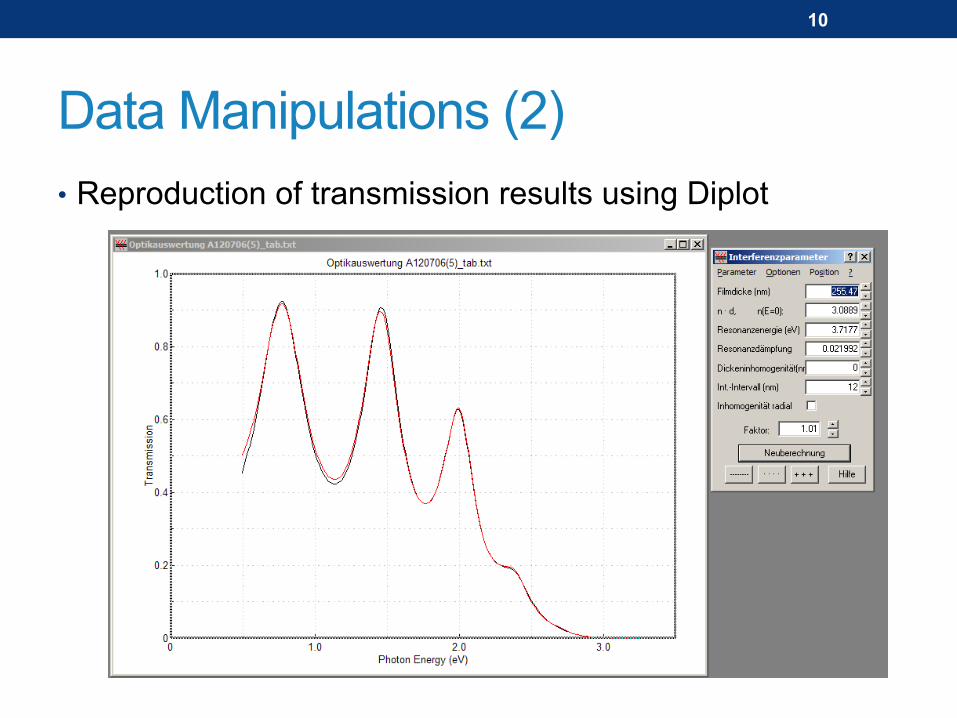
• Reproduction of transmission results using Diplot
Data Manipulations (2)
10
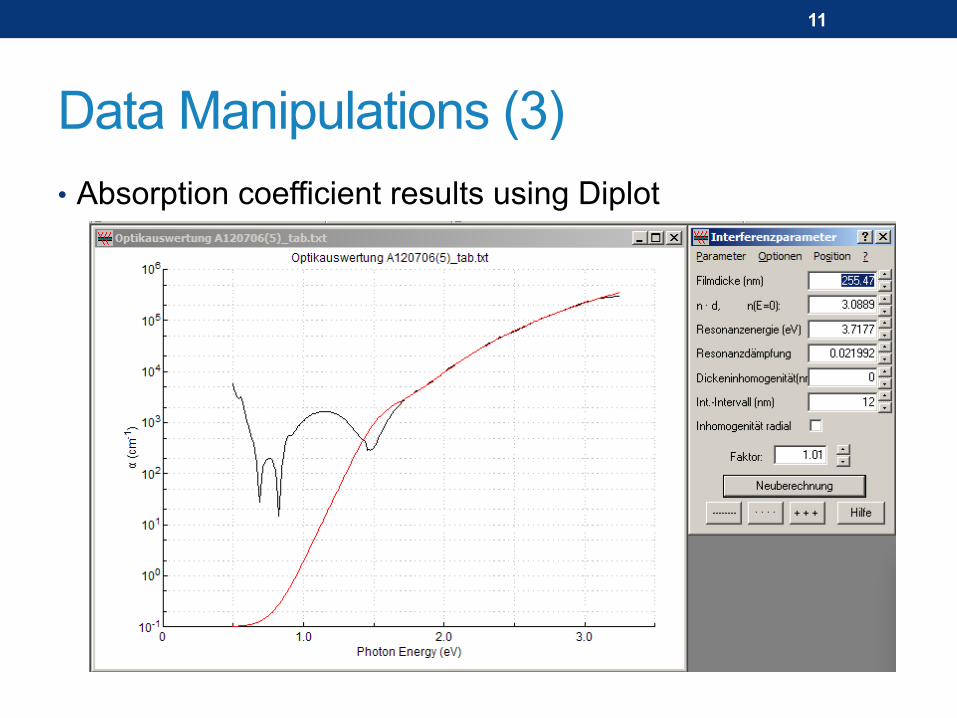
• Absorption coefficient results using Diplot
Data Manipulations (3)
11
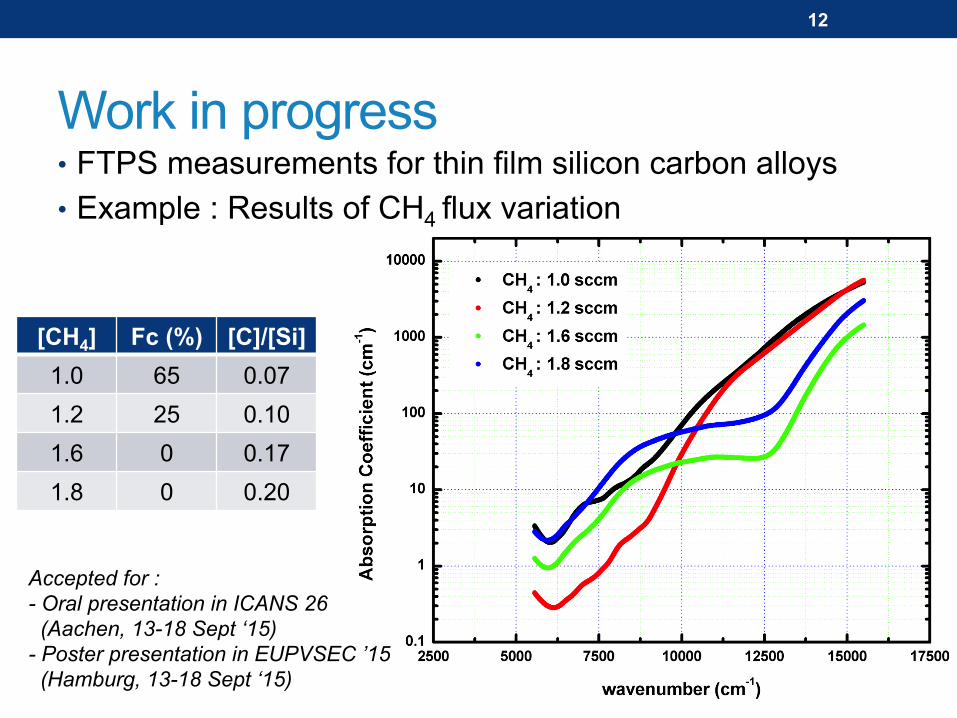
Work in progress • FTPS measurements for thin film silicon carbon alloys • Example : Results of CH4 flux variation
[CH4] Fc (%) [C]/[Si] 1.0 65 0.07 1.2 25 0.10 1.6 0 0.17 1.8 0 0.20
12
Accepted for : - Oral presentation in ICANS 26 (Aachen, 13-18 Sept ‘15) - Poster presentation in EUPVSEC ’15 (Hamburg, 13-18 Sept ‘15)
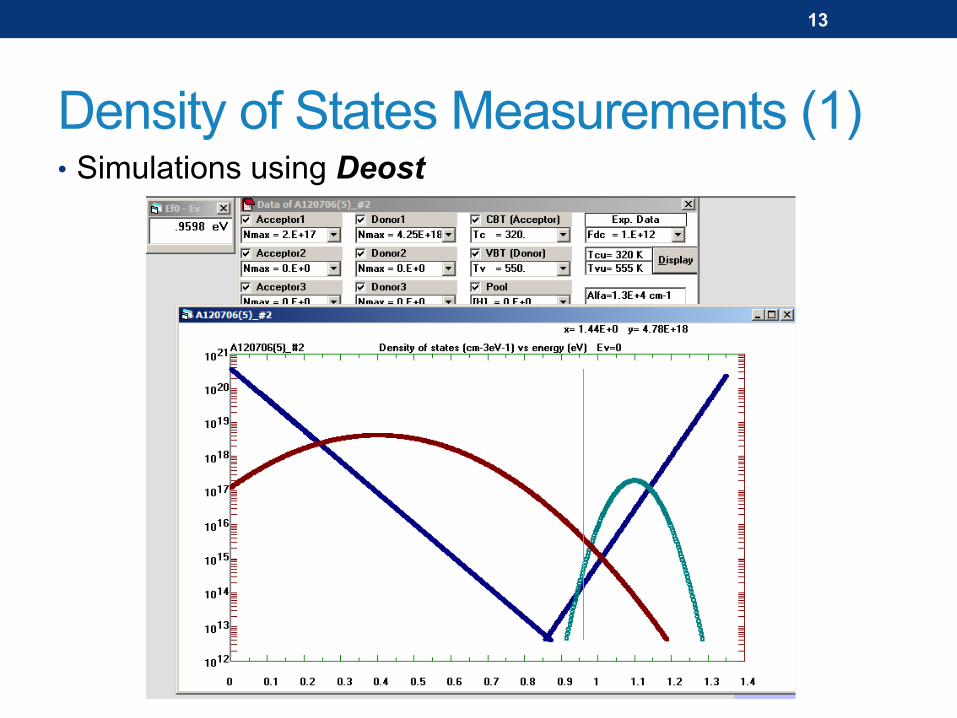
Density of States Measurements (1) • Simulations using Deost
13
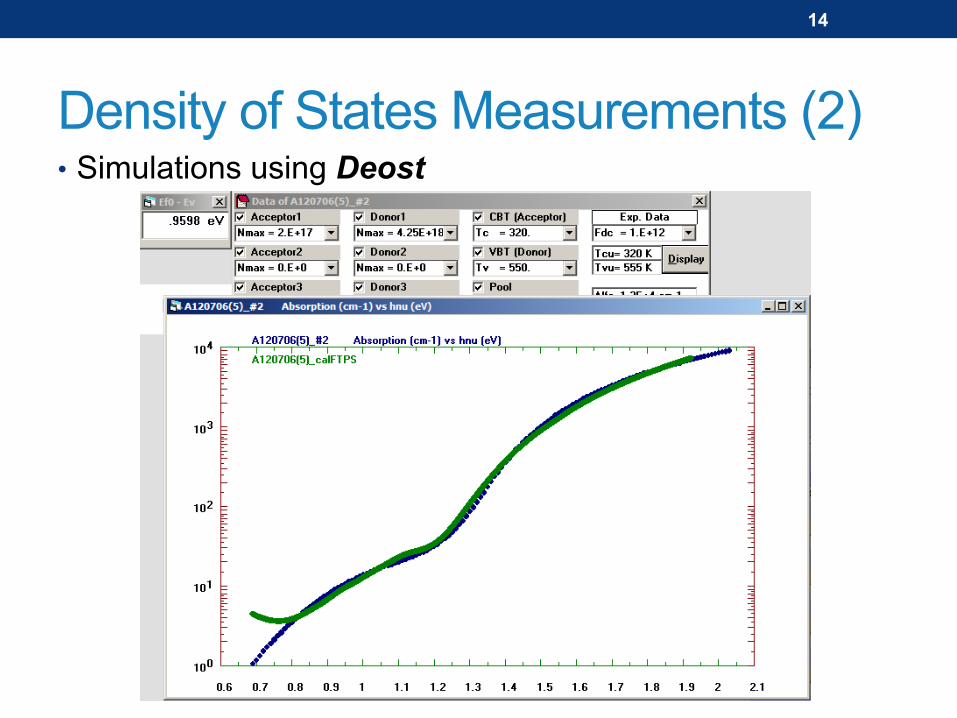
Density of States Measurements (2) • Simulations using Deost
14
Future works • FTPS measurements using a FTIR spectrometer with
sensitivity up to visible light range (>15800 cm-1) to directly obtain the absolute value of absorption coefficient (without performing transmission spectroscopy)
• FTPS measurements for PV devices/ solar cells to study the devices’ spectral response/EQE
15

THANK YOU!
16


![Cancun, Mexico, April 27 - May 1, 2011 D ensity-based H ardw are …C][2011... · 2019-05-30 · D ensity-based H ardw are-oriented C lassi ca tion for S pike S orting M icrosystem](https://img.pdfslide.us/doc/110x75/5f43ab6a181b221c057757b3/cancun-mexico-april-27-may-1-2011-d-ensity-based-h-ardw-are-c2011-2019-05-30.jpg)


![[MS-FTPS]: File Transfer Protocol over Secure Sockets](https://img.pdfslide.us/doc/110x75/6257bb73ee0b20724431bdd0/ms-ftps-file-transfer-protocol-over-secure-sockets-.jpg)