Embed Size (px)
Citation preview

Enrollment
Analysis Report
2016-2017 to 2021-2022
November 2016
Newton Public Schools 100 Walnut Street Newton, MA 02460

David Fleishman Superintendent
Liam Hurley
Assistant Superintendent/Chief Financial & Administrative Officer
Acknowledgements:
Susan Dzikowski, Director of Finance Sean Mannion, Senior Budget Analyst
Julie Kirrane, Long-Range Planning Manager Katy Hogue, District Student Data Manager
Janelle Roth, Administrative Assistant

TABLE OF CONTENTS SECTION PAGE
Executive Summary i-iv
I. Enrollment Trends
System-wide Projections Elementary Projections
Secondary Projections National, State and Local Trends Rental Housing Complexes Housing Trends in Newton Trends in Housing Patterns of District Families Real Estate Sales
1-17
II. Enrollment Projection Method Kindergarten Projection Methodology NESDEC Comparison Accuracy of Projections Frequently Asked Questions
18-28
III. Enrollment History Grade-by-Grade Analysis A Comparison to Peak Enrollment Years 29-37
IV. Individual School Reports 38-80
V. Student Exits and Entrances V1. Non-Public/Private School Students
Appendices
A. Student Population Detail B. City of Newton Population C. Residential Property Data D. NESDEC’s Enrollment Projections vs. Newton’s E. School Districts and Buffer Zones F. Residential Development
81-89
90-95
96-117

LIST OF TABLES
TABLE PAGE 1. Projected Enrollments by School 2017-2018 to 2021-22 7
2. Enrollment History and Projections by School 1975-76 to 2021-22 8-9
3. Projected Enrollments by Grade 2017-2018 to 2021-22 10
4. Enrollment History and Projections by Grade 1975-76 to 2021-22 11-12
5. Comparison of Actual and Projected Five-Year Enrollment Change 13
6. Percent of Change by Grade Span 2010-2011 to 2021-22 14
7. Actual System Enrollment Change 1977-78 to 2016-17 15
8. Actual Elementary School Enrollment Change 1981-82 to 2016-17 16
9. Actual Secondary School Enrollment Change 1984-85 to 2016-17 17
10. Resident Births to Kindergarten Ratios 19
11. Projection History for 2016-2017 20
12. Comparison of Projected with Actual 2015-16 and 2016-17 Enrollment 22
13. Actual and Projected Enrollments by School 2016-2017 23-24
14. Actual and Projected K-12 Enrollments 2010-11 to 2021-22 25
15. Enrollments by Grade 2015-16 and 2016-17 30
16. Historical Cohort Survival Ratios by Grade 31
17. Percent of Change by Elementary School 2010-11 to 2021-22 32-35
18. Percent of Change by Middle School 2010-11 to 2021-22 36
19. Percent of Change by High School 2010-11 to 2021-22 37
20. Exiting Elementary School Students 2015-16 83
21. Exiting Middle School Students 2015-16 84
22. Exiting High School Students 2015-16 84
23. Total Student Exits 2013-14 through 2015-16 85
24. History of Exits to Non-Public Schools 2009-10 to 2015-16 86
25. Entering Elementary School Students 2015-16 and 2016-17 as of October 1, 2016 88
26. Entering Middle School Students 2015-16 and 2016-17 as of October 1, 2016 88
27. Entering High School Students 2015-16 and 2016-17 as of October 1, 2016 89
28. Non-Public/Private School Students by Grade (2016 Census) 93
29. Non-Public/Private School by School (2016 Census) 94
30. Special Educations Students Tuitioned-out (2016 Census) 95

Appendix A – Student Population Detail PAGE
1. Student Demographics 96-99
2. Preschool Students 100
3. METCO Enrollment by School and Grade 101
4. English Language Learners Enrollment 102
5. English Language Learners Enrollment by Language 103
6. Students Receiving Special Education Services 104-105
7. Number of Non-resident Students 106
Appendix B – City of Newton Population
8. City of Newton Population Growth 107
Appendix C – Residential Property Data
9. Residential Property Sales by Elementary District 108
10. Properties Listed for Sale in Newton by Elementary District 109
Appendix D – NESDEC Enrollment Projections
11. NESDEC’s Enrollment Projections vs. Newton’s 110
Appendix E – School Districts and Buffer Zones
12. Elementary Students by District with Buffer Zones 111-112
13. Total Enrollment by High School Feeder Patterns 113
14. Current Elementary, Middle and High School District Maps 114-116
Appendix F – Residential Development
15. Residential Development Scenarios for Enrollment in Newton Public Schools 117


EXECUTIVE SUMMARY


2016-17 ENROLLMENT ANALYSIS
EXECUTIVE SUMMARY
The Newton Public Schools system-wide K-12 enrollment has increased this year marking its twelfth year in a trend of rising enrollments with 1,389 students (12%) added from 2004 to 2016. The initial years of growth from 2004 – 2009 brought 339 students to the system. The next four years, up to 2014, added another 834 students to the district, the period of steepest growth in this twelve year trend. The 2015-16 year had enrollment that held steady. Last year’s small increase in enrollment of 5 students from the previous year is not repeated this year. Current 2016-17 enrollment has increased by 149 students since last year, with growth at all levels and the highest growth at the high school level. The district is projected to increase by an additional 320 students (3%) over the next five years, with growth at the secondary schools and a leveling of enrollment at the elementary schools.
Robust kindergarten enrollment levels near or above 900 students from 2010 to 2014 were followed by lower enrollment in 2015 of 877 students. The current 2016 kindergarten population of 885, together with strong cohort growth in first, second and third grade, resulted an increase to the elementary population of 5,801 students. On average this year, grades within elementary schools have an enrollment of 967 students, with two grades over 1,000 students. Second grade, with 1,042 students, is the largest elementary school class since 1978. By 2019, this class is expected to grow to 1,076 students. In 2020, when this above average sized class moves to sixth grade, the elementary level decreases before growing again to 5,762 students in 2021. These primary growth factors – the size of the incoming class, the size of the outgoing class, and cohort growth – all are expected to play a role in elementary enrollment trends in the next five years.
The middle schools have grown by 407 students (17%) from 2007 to the present; classes were on average 817 students in 2007 and today classes average 953 students. The overall growth trend remains strong, with growth as high as 4% expected in 2020 and an additional 155 middle school students expected over the next five years. The high school growth trend that began in 2012 has resulted in an additional 428 students. With accumulated growth now at 12%, this is the first year there is a high school grade of more than 1,000 students (grade 11) since 1983. The current grade 12 is the smallest high school grade, with 925 students. Strong growth at the secondary level is the result of movement through the system of the earlier elementary growth; three grade levels are expected to have more than 1,000 students in 2019 and 2021. Over the next five years, high school growth of 204 students (5%) is expected.
This school year has seen an increase in enrollment for students currently enrolled as English Language Learners (ELL); there has been growth in the program of 306 students (55%) over ten years. There are 859 ELL students in 2016-17; 611 elementary students are English Learners (11% of the elementary population). The percentage of students receiving special education services is stable at 19.1% this year compared to 19.2% in 2015.
Improved, expanded and unified space for Newton Early Childhood Program (NECP) has been achieved this year at 150 Jackson Road, the former Aquinas College building acquired by Newton in 2015. In the near-term, NECP is located in the main building while plans for a permanent location in the north wing are underway. At the present time, 195 preschool children are served by NECP in early childhood classrooms, or receive therapeutic services
- i -

only; enrollment typically increases during the course of the year. Additional information on the preschool population is now included in this report.
When including preschool enrollment and students attending out-of-district special education schools under the auspices of Newton Public Schools, the district’s full enrollment totals 12,997 students. Section V on Student Exits and Entrances and Appendix A on Student Population Detail contain additional information on these student populations.
The K-12 district school current enrollment of 12,657 that is the subject of this report is above the projection of 12,580 students made in November 2015, a system-wide variance from projection of 77 students, or 0.6%. With the exception of the 2015-16 school year, system-wide variances from projection have been under 1% in recent years. In the past 16 years, Newton has had six negative variances when actual enrollment has been lower than projected and ten positive variances when the actual enrollment has been higher than the projection. All three levels are enrolled at higher than anticipated numbers, with 14, 22, and 41 more students than projected at the elementary, middle and high schools, respectively. Substantial cohort growth was evident at all three levels: grades 1 and 2 at the elementary level, grades 7 and 8 at middle school and grades 9, 10 and 11 at high school. In contrast, last year, only grade 1 and grade 9 had robust cohort growth while all other grades were flat.
This report details changes in enrollments by school since last year. It reviews current enrollments as compared with the November 2015 projections, and projects enrollments using five-year historical data considered in the context of local trends in real estate sales, new developments, student mobility, birth data, census data, housing trends and other factors. There is now a full year of experience built into the projection model from changes to Newton Public Schools elementary student assignment policies, approved in September 2015. Actual 2016-17 enrollments presented in this report have changed slightly from the Preliminary Enrollment Report of October 24, 2016, with a net decrease of one student.
Future Enrollment The traditional cohort survival method of enrollment projections using five-year historical data yields the projections for grades 1 through 12 on the following chart. The 2016-17 kindergarten projection has been calculated using an adjusted straight four-year average of previous kindergarten enrollments. This is the same basic methodology that has been used since 2013 with a slightly more conservative approach for projecting kindergarten. Using a 4-year average instead of a 5-year average omits one of the three peak kindergarten enrollment years, which lowers the projection. The prior methodology, which used city census data on four year olds as part of the projection, yields kindergarten projections of below 800 students. See Section II entitled Enrollment Projection Method for more information and discussion of the full methodology used in this year’s forecast.
ActualLevel 2016-17 2017-18 2018-19 2019-20 2020-21 2021-22
Elementary 5,801 5,845 5,853 5,822 5,738 5,762 Middle 2,860 2,872 2,855 2,888 3,014 3,015 High School 3,996 4,070 4,116 4,173 4,166 4,200 Total 12,657 12,787 12,824 12,883 12,918 12,977
* The projections include a separate forecast for kindergarten based on an adjusted straight four-year average of previous kindergarten enrollments.
Projections Using 5 Year Ratios*
- ii -

The folloPublic Scgraph illustability, additiona
The Enroconductsneeds forThis repoin upcomprojectiocurrentlyare embebetter knThe annuhelps to s
owing graph chools, fromustrates the tfollowed by
al years.
ollment Anal enrollment r elementaryort also guid
ming years anns are also u
y engaged exedded in the own over th
ual enrollmensupport the m
is a represenm 1988 to 201
trend of susty the growth
lysis Report planning thr
y buffer zonedes planning nd helps to idused to inforxtending throbudget prope course of tnt analysis rmost effectiv
ntation of m16, as well atained increah trend of twe
serves as throughout thees to balancefor any chandentify short
rm the long-rough 2033. Eposals for eacthe year, plareport thus suve and respo
more than 30 as projectionases during thelve years an
he basis upone year, include enrollment nges in the ut-term facilitrange facilityEnrollment pch upcoming
anning assumupports distr
onsive decisi
years of enrns from 2017he 1990’s, thnd the projec
n which Newding the idenat schools o
use of facilitities’ needs. y planning inprojections fg year. As a
mptions are rrict planningions possible
rollment in th7 through 20hen a six-yected growth
wton Public Sntification ofor to alleviateies that may The enrollm
n which Newfor the next actual enrollmre-evaluated g throughoute.
he Newton 21. The ar period of trend for fiv
Schools f potential e crowding. be necessar
ment wton is school year ments becomand adjusted
t the year, an
ve
ry
me d. nd
- iii -

The Report
Each section of the report provides detail on current enrollment and projections as follows:
I. Enrollment Trends for the System, Elementary and Secondary - an in-depth look at system-wide and grade distribution projections.
II. Enrollment Projection Method, Accuracy of Projections and Frequently Asked Questions - an overview that provides answers to commonly asked questions regarding the enrollment projection method.
III. Enrollment History - a discussion of past enrollment trends for the district and for the elementary, middle, and high school grade configurations.
IV. Individual School Reports - include information on current and projected enrollments by school and by grade and/or program.
V. Student Exits and Entrances – provide data on student mobility in the 2015-16 school year, as well as preliminary information on the 2016-17 year.
VI. Non-Public School/Private School Enrollments – provide data on the 18.8% of Newton school age children who are eligible to attend Newton’s schools but are enrolled outside the district and at private schools.
Appendices A through F Appendix A has been expanded with additional details on student populations including:
Basic demographic information Data on preschool students Students in the METCO program English Language Learners and students receiving special education services City of Newton population growth by age group Current residential properties for sale in Newton by elementary school district and
historical residential property sales New England School Development Council’s (NESDEC) enrollment projections for
Newton, discussed in detail in Section II Elementary school students by district with buffer zones and total enrollment by high
school feeder patterns Current elementary, middle and high school district maps Scenarios for enrollment from permitted residential developments
- iv -

I. ENROLLMENT TRENDS
System-wide Projections
Elementary Projections
Secondary Projections
National, State and Local Trends
Rental Housing Complexes
Housing Trends in Newton
Trends in Housing Patterns of District Families
Real Estate Sales


System-w
Enrollmenext fiveover seveyears, thapopulatio
Tables 1 projectiofrom 197changes bof 2017-from the
The charshown byprojected
wide Projec
ent for all sch years, after enteen yearsan the earlieron grew by o
and 3 displans for the ne
75-76 to 202by school an18 through 2past several
rt below provy grade leveld to have net
I. E
ctions
hools is projgrowing 12 through 202r period of g
over 2,000 to
ay the currenext five year1-22, by sch
nd by grade l2021-22. Tal decades as
vides an ovel. Over the nt increases in
ENROLLM
jected to incr% since 20021. This trengrowth from o 11,248 stud
nt enrollmenrs. Tables 2hool and by glevel over va
ables 7, 8 andwell as proje
rview of fivenext five yean student enr
MENT TR
rease by a ne04-05, for totnd is compar1989 to 199
dents (23% g
t for 2016-1and 4 providgrade. Tablearious time pd 9 provide gected enrollm
e decades ofars, enrollmerollment.
RENDS
et of 320 stutal growth of
arable in num99 (eleven yegrowth).
7 by school de enrollmene 5 and Tablperiods, inclgrade level hments for 20
f enrollment ent at all thre
udents, or 3%f 1,709 stude
mber, thoughears) when t
and by gradnt history anle 6 show enluding the prhistories of e017-18 to 20
trends with ee grade lev
%, during theents (15%)
h longer in the district’s
de as well as nd projectionnrollment rojected yearenrollments
021-22.
differences vels is
e
ns
rs
- 1 -

Elementary Projections
Elementary enrollment is expected to increase from 5,801 students to 5,845 students next year, an increase of 44 students, with a peak of 5,853 students in 2018. Within a more stable growth trend in general, elementary enrollments are expected to fall to a lower level below 5,800 students in 2020 and 2021 when the two classes with more than 1,000 students move on to middle school. Since 2003-04, the population has grown by a total of 863 students, or 17%. Enrollment projections are dependent on current student counts and trends from past years. Today’s kindergarten enrollment of 885 students is among two classes of fewer than 900 students in the past five years, which also included two of the highest kindergarten classes on record in forty years. The average size of the kindergarten classes over the prior five years is 918 students (down from 920 students last year); the four year average of kindergarten classes is 915 students and the three year average is 900 students. Projections for the 2017-18 school year factor in an increase in the 2012 birth data; a similar but larger increase in the birth data was significant in predicting a larger kindergarten class of 958 students in 2013. Please refer to Section II for the kindergarten projection methodology which explains the use of birth data and city census data for children aged 3 to 5 years to understand kindergarten projections.
Refer to Section IV, Individual School Reports, for the elementary school projections by grade and by school and other enrollment details. Several schools continue to see the impact of the student assignment changes approved in September 2015. Angier and Zervas are projected to have increased enrollments as the new schools with expanded capacity accept students from crowded schools where enrollment consequently is projected to decrease, including Bowen, Burr, Countryside, Mason-Rice and Ward. The second phase of student assignment review will assess the changes made to-date and identify other needs, culminating in a focus on Cabot and other north side schools where overcrowding remains persistent.
Appendix E, Table 12 lists student enrollment in buffer zones by school for this school year and last. The use of buffer zones has been an effective way to ameliorate space constraints at the elementary schools and balance class sizes. Since 2011, buffer zones have been used by school administration to determine space availability requests between the schools in the district. Once a student from a buffer zone is placed in a school, he/she will follow the same feeder pattern as peers in that school. Table 12 displays each buffer zone and, for more recently created zones, notes the year the zone was developed. Buffer zones that were eliminated as part of the 2015 student assignment changes are also clearly marked.
Secondary Projections
Middle school enrollment increased by 42 students in 2016-17, and is projected to remain steady until 2020 when the current grade 2 arrives and enrollment is anticipated to grow 4% and increase by 126 students. More than half of this growth will be moving from Mason-Rice to Brown. Over the next five years, middle school enrollment is projected to grow by an additional 155 students to 3,015 students, an increase of 5%. In 2020, grades 6 and 7 are both projected to be over 1,000 students.
This year’s high school enrollment of 3,996 students has grown by 91 students since last year and is expected to continue to increase for the next five years as the larger elementary and middle school populations move to high school. By 2021-22, a net increase of 204 high
- 2 -

school students is expected. Both high schools will increase over the next five years; enrollment projections show Newton North High School will increase by 113 students, or +5% and Newton South High School will increase by 91 students, or +5%. The difference in enrollment between the two high schools will vary from a low of 135 students in 2019 to a high of 316 students in 2021. Secondary data showing past, present and projected enrollments are presented in Table 9.
National, State and Local Trends
Although the U.S. Census Bureau continues to rank Massachusetts very low in expected school age population growth from 2000-2030, Newton’s enrollment projections and those of other communities near Boston are not typical of Massachusetts; enrollment in the Newton Public Schools and in many nearby districts continues to increase. The chart below shows the status of district enrollments for several nearby towns over the most recent available five-year time period from 2012-13 to 2016-17. Among the towns sampled below, communities like Newton that have fairly central locations within the Greater Boston metropolitan area show growth, while others that are further south or west show enrollments that are level or decreasing.
Since the 2010 United States Census, the population of the City of Newton has increased by 1,300 residents, growing to over 85,000. Appendix B, Table 8 compares City of Newton data from the 2010 United States Census to the 2000 United States Census by age range; the 1990 Census is also shown.
On a national and regional level, the 2010 Census reported 308.7 million people in the United States, a 10% increase from the 2000 Census population of 281.4 million as compared to ten year population growth of only 2% in Newton and 3% statewide. The national increase of 10% over the last decade was lower than the 13% increase of the 1990’s and is similar to the magnitude of growth in the 1980’s. Nationally, 24% of the United States population is less than 18 years of age, 7% of which accounts for children under five years old. This reflects a national school age demographic of 18% of the total population; in contrast, the school age demographic for both Massachusetts and Newton is 16%.
Rental Housing Complexes
Total enrollments by school for four large residential rental communities are shown in the following table; enrollments have been fairly stable at these complexes for the past three years with net changes of 10 to 20 students per year. There is an overall net decrease from the prior year of sixteen students.
Avalon at Newton Highlands, a 294-unit apartment complex opened in 2003, has the highest population of students – 102 students are enrolled in the Newton Public Schools. Avalon at
School Year Belmont Brookline Lexington Natick Newton Wellesley Westwood Wayland Weston2016-17 4,470 7,446 7,015 5,354 12,657 4,917 3,125 2,655 2,1112012-13 3,994 6,836 6,478 4,963 12,170 4,855 3,120 2,707 2,322Change 476 610 537 391 487 62 5 -52 -211Percent 12% 9% 8% 8% 4% 1% 0% -2% -9%Enrollment as of October 1, 2016
Five Year K-12 Enrollment Change in Surrounding Districts
- 3 -

Chestnut Hill, a 204-unit apartment complex opened in 2006, has 71 students enrolled in the Newton Public Schools, an increase of 10 students since last year. Arborpoint at Woodland Station, a 2007 transit-oriented 180-unit rental complex, has 48 students enrolled in the district. Woodland Park is an older complex and consists of 126 rental apartments including 80 two-bedroom units, 30 one-bedroom units and 16 studios, with 40 students living in this complex near the Riverside MBTA station.
About half of the students residing at these complexes are elementary students (48%) and the remaining students attend middle or high school (52%); there are also 42 students enrolled in private school living in these complexes.
Newton Public Schools works with the city’s Planning and Development Department to monitor residential development proposals with a potential impact on enrollment. As of November 1, 2016, project statuses are provided by the Planning & Development Department for the following residential development projects with at least 10 units of housing.
School
Avalon at Newton
Highlands (294 Units)
Avalon at Chestnut Hill (204
Units)
Arborpoint at
Woodland Station
(180 Units)
Woodland Park at 264-290 Grove
(126 Units)
Total
Angier 8 1 9Burr 2 2Countryside 26 26Horace Mann 1 1Memorial-Spaulding 32 32Peirce 16 16Williams 10 21 31Zervas 9 9All Elementary 43 33 26 24 126Bigelow 1 1Brown 18 4 8 30Day 2 5 1 8Oak Hill 1 21 22Newton North 2 7 1 10Newton South 35 17 6 6 64All Secondary 59 38 22 16 135Total Newton Public Schools 102 71 48 40 261Prior Year Total (2015-16) 106 61 53 57 277Change from Prior Year -4 10 -5 -17 -16Additional Private School Students 15 19 5 3 42
Enrollment at Newton's Largest Rental Housing Complexes (2016-17)
- 4 -

Kessler Woods, Court Street and Austin Street are residential developments that have reached the approved permit stage, the point at which potential students are included in the enrollment projections. Construction has begun at Kessler Woods, the 42-acre site on the West Roxbury and Brookline borders of Newton along LaGrange Street and at Court Street in Newtonville near the Washington Street corridor. Construction at Austin Street has not yet begun, but pending resolution of a current appeal, the construction time frame is anticipated to be 15 months.
Preliminary enrollment projections based on experience ratios from three large complexes in Newton have been made and students have been added to the projections for Memorial-Spaulding, Cabot, Day, Oak Hill and to the high schools. Additions to enrollment have been phased in, assuming that each development reaches full occupancy within three years of completion. A table that shows the calculation related to each project can be found in Appendix F, Table 15. Housing Trends in Newton
The table below shows the current housing types in Newton, as well as housing types in FY04, thirteen years ago. According to the City Assessor’s office, the greatest changes during this time in Newton’s housing stock have been an increase of 1,392 condominium properties, or 40% growth. Condominiums have been the result of both conversions of existing properties such as two- or three-family homes, which have decreased since FY04, as well as new construction or additions. Single family home types have been the most stable segment of the housing stock in Newton during this period.
Proposed Residential Development Total Units Affordable Units Status as of November 1, 2016Kessler Woods 88 13 (15%) Under constructionCourt Street, 75-83 36 9 (25%) Under constructionAustin Street 68 17 (25%) Approved, under appealMelrose Street, 283 - Turtle Lane Playhouse 16 4 (15%) Approved, not yet in construction429 Cherry Street 13 3 (23%) Approved, not yet in constructionBeacon Street, 1521 8 2 (25%) Approved, reduced in scaleNeedham Street 950 238 (25%) In conceptual developmentOrr Project @ Washington & Walnut 161 40 (15%, 10%) In conceptual developmentCrescent Street 8 4 (50%) In conceptual developmentBeacon Street, 1615 23 6 (25%) Under review by ZBAWells Avenue, 135 334 84 (25%) Denied, in litigationRiverside 290 44 (15%) Delayed by MBTARowe Street, 70 150 30 (20%) Withdrawn
Housing Type FY04 % of Total in FY04 FY17 % of Total in FY17#
Change %
Change
Single Family 16,885 69% 16,959 67% 74 0.4%
Condominium 3,489 14% 4,881 19% 1,392 40%
Two Family 3,224 13% 2,794 11% -430 -13%
Three Family 308 1% 277 1% -31 -10%
Apartment Buildings 176 1% 154 1% -22 -13%
Mixed Use 296 1% 243 1% -53 -18%
TOTAL PROPERTIES 24,378 100% 25,308 100% 930 4%Source: Newton Assessors Office
City of Newton Housing Types
- 5 -

Trends in Housing Patterns of District Families
There have also been shifts in the housing patterns of families with Newton Public School children. According to Geographic Information System data that matches school students to housing types, families are living in new types of housing that have become available in Newton. While a similar number of school children live in single family homes in 2016 as in 2002 (264 more students), the percentage of school children living in single family homes has declined from 73% to 65% because of enrollment growth during this time period. Conversely, there has been an increase from 5% to 12% in the percentage of school children living in condominiums. This represents a real increase of 908 students living in condominiums today compared to 2002 and a rate of change of 173%. This data illustrates that families of Newton school children today are more likely to live in condominiums and apartments than in 2002.
Real Estate Sales
According to data obtained from City of Newton records, there were 1,213 residential property sales in calendar year 2015 versus 1,311 the year before, a decrease of 7%. Calendar year 2014 had the highest number of property sales of the last ten years, at 1,311. (See Appendix C, Table 9.) Through the first eight months of 2016, real estate sales totaled 781 as compared with 864 (-10%) for the same period one year ago. Appendix C, Table 9 shows the data by school district, making clear the differences in total property sales by neighborhood.
Additional information is provided in Table 10 of Appendix C with properties listed for sale by school district in Newton as of November 2016; there are four fewer properties listed for sale in Newton this year as compared to one year ago. Seventy percent of properties listed for sale in Newton are single family homes with eight out of every ten homes having four or more bedrooms. The three columns to the far right of the exhibit show the percentages by type of property on the market by school district. For example, in the Mason-Rice School district, 90% of properties listed for sale are single family and 10% are condominiums while in the Bowen School district, 47% of properties for sale are single family, and 53% are condominiums. There are no multi-family homes for sale at the present time as compared to 11 properties one year ago.
Type of Housing 2002% of Resident
Students2016
% of Resident Students
ChangeChange
%
Single Family 7,777 73% 8,041 65% 264 3%Two/Three Family 1,671 16% 1,835 15% 164 10%Condominiums 526 5% 1,434 12% 908 173%Apartment Buildings 251 2% 557 5% 306 122%Mixed Use / Other 389 4% 435 4% 46 12%Total 10,614 100% 12,302 100% 1,688 320%Source: Newton Geographic Information Systems
Newton Public School Children by Housing Type
- 6 -

TABLE 1PROJECTED ENROLLMENTS BY SCHOOL
2017-18 TO 2021-22
Spec. Actual Projections Using 5 Year Average Ratios**School Ed.* FY17 FY18 FY19 FY20 FY21 FY22Angier 421 444 455 464 466 476Bowen 417 409 399 360 360 358Burr 402 395 392 369 352 339Cabot 400 394 377 382 370 375Countryside 436 432 430 434 420 413Franklin 446 455 467 469 457 469Horace Mann 417 399 396 392 395 393Lincoln-Eliot 346 347 355 349 352 354Mason-Rice 507 516 504 487 458 443Memorial-Spaulding 454 472 486 491 488 489Peirce 299 285 280 281 265 269Underwood 313 316 319 323 307 315Ward 313 311 306 302 297 304Williams 293 299 290 297 301 287Zervas 337 371 397 422 450 478TOTAL ELEMENTARY (0) 5,801 5,845 5,853 5,822 5,738 5,762Bigelow 525 536 531 538 564 553Brown 774 744 724 732 802 822Day 922 985 988 1,012 1,026 1,012Oak Hill 639 607 612 606 622 628TOTAL MIDDLE (0) 2,860 2,872 2,855 2,888 3,014 3,015Newton North (84) 2,145 2,163 2,154 2,154 2,198 2,258Newton South (12) 1,851 1,907 1,962 2,019 1,968 1,942TOTAL HIGH SCHOOL (96) 3,996 4,070 4,116 4,173 4,166 4,200GRAND TOTAL (96) 12,657 12,787 12,824 12,883 12,918 12,977*Enrollment numbers and projections include students who receive special education services outside the regular classroom for a significant amount of time.**Four-year averages of previous kindergarten enrollments are used to project kindergarten enrollment.
- 7 -

TA
BL
E 2
New
ton
Pub
lic S
choo
lsE
nrol
lmen
t His
tory
and
Pro
ject
ions
by
Sch
ool
1975
to 2
021
Sch
ool N
ame
Pea
k E
nro
llP
eak
Yea
r19
7519
7619
77*
1978
*19
79*
1980
*19
81*
1982
*19
83*
1984
*19
85*
1986
*19
8719
8819
8919
9019
9119
9219
93*
1994
1995
1996
1997
Ang
ier
752
1953
408
408
394
429
414
424
400
375
384
413
412
419
409
410
439
436
441
469
428
430
430
436
423
Bow
en50
220
1333
830
135
434
932
830
930
029
128
331
234
835
036
436
640
341
342
642
841
041
442
141
040
9B
urr
496
1967
338
313
256
232
218
264
236
229
211
204
210
238
249
260
304
299
302
323
275
294
287
292
273
Cab
ot53
919
6740
638
837
334
931
530
641
035
134
233
633
736
236
238
742
444
947
047
344
343
142
041
741
2C
arr
401
1963
295
290
271
269
235
Cla
flin
420
1960
349
314
283
253
231
215
Cou
ntry
side
557
1959
302
302
231
218
349
338
347
316
303
379
394
418
436
451
458
474
500
497
461
477
446
449
469
Dav
is35
219
6127
927
327
625
624
7E
mer
son
345
1955
276
245
222
201
Fra
nklin
601
1961
460
445
420
388
389
478
399
394
388
345
338
334
331
347
364
382
361
360
332
350
346
366
379
Ham
ilton
222
1960
144
147
126
Hor
ace
Man
n42
720
1329
527
025
222
821
631
730
128
726
126
825
824
927
628
729
932
331
832
428
528
829
428
227
3H
yde
669
1952
385
352
350
364
351
341
314
310
301
Linc
oln-
Elio
t43
519
7036
836
134
228
624
432
030
826
923
724
624
223
925
024
928
531
633
835
229
330
633
334
532
1M
ason
-Ric
e62
019
6247
544
542
841
038
436
034
932
128
641
840
241
941
942
343
645
947
548
639
541
740
539
739
5M
emor
ial
536
1953
181
152
Mem
oria
l-S
paul
ding
486
1992
372
349
309
309
301
284
264
372
382
401
415
418
445
449
452
486
426
469
477
454
452
Oak
Hill
Ele
men
tary
450
1962
310
304
323
341
304
274
268
230
207
Pei
rce
429
1960
390
362
341
345
349
355
355
302
290
291
266
253
253
267
282
283
272
292
270
270
259
250
281
Spa
uldi
ng58
719
6126
825
3U
nder
woo
d58
219
7049
746
343
741
139
237
332
829
330
829
129
226
428
027
728
330
331
030
229
531
128
328
528
2W
ard
506
1971
499
500
428
404
371
334
302
278
258
286
279
312
325
354
351
372
378
386
330
342
366
360
335
Will
iam
s37
519
6931
128
127
229
825
823
521
420
921
322
322
121
921
623
824
425
528
430
227
126
125
428
826
9Z
erva
s (f
orm
erly
Bee
thov
en)
350
1964
287
286
242
239
240
238
227
209
213
278
281
258
266
273
280
290
320
325
302
303
288
287
287
Pea
body
(S
PE
D)
37T
ota
l Ele
m7,
898
7,45
56,
993
6,61
96,
144
5,79
05,
359
4,94
84,
749
4,66
24,
662
4,73
54,
851
5,00
75,
297
5,50
35,
647
5,80
55,
216
5,36
35,
309
5,31
85,
260
Cha
nge
-179
-443
-462
-374
-475
-354
-431
-411
-199
-87
073
116
156
290
206
144
158
-589
147
-54
9-5
8%
Cha
nge
-2.2
%-5
.6%
-6.2
%-5
.3%
-7.2
%-5
.8%
-7.4
%-7
.7%
-4.0
%-1
.8%
0.0%
1.6%
2.4%
3.2%
5.8%
3.9%
2.6%
2.8%
-10.
1%2.
8%-1
.0%
0.2%
-1.1
%T
otal
# E
lem
Sch
ools
2323
2221
2018
1717
1715
1515
1515
1515
1515
1515
1515
15
Big
elow
612
1996
589
572
575
529
517
503
482
537
425
350
168
534
567
590
612
522
Bro
wn
(for
mer
ly M
eado
wbr
ook)
1,02
419
6480
082
384
282
281
085
863
665
461
560
059
757
054
855
752
850
862
868
998
994
094
597
464
5D
ay94
720
1378
080
477
872
472
473
477
484
765
260
465
470
968
468
073
079
777
277
075
579
480
885
682
3O
ak H
ill M
iddl
e63
420
1357
2W
arre
n1,
270
1969
883
884
846
763
681
629
606
419
Wee
ks1,
033
1960
675
663
625
563
458
287
To
tal M
idd
le S
cho
ol
3,72
73,
746
3,66
63,
401
3,19
03,
011
2,49
82,
457
1,69
21,
554
1,41
91,
279
1,23
21,
237
1,25
81,
305
1,40
01,
459
2,27
82,
301
2,34
32,
442
2,56
2C
hang
e-9
119
-80
-265
-211
-179
-513
-41
-765
-138
-135
-140
-47
521
4795
5981
923
4299
120
% C
hang
e-2
.4%
0.5%
-2.1
%-7
.2%
-6.2
%-5
.6%
-17.
0%-1
.6%
-31.
1%-8
.2%
-8.7
%-9
.9%
-3.7
%0.
4%1.
7%3.
7%7.
3%4.
2%56
.1%
1.0%
1.8%
4.2%
4.9%
Tot
al #
Mid
dle
Sch
ools
55
55
55
44
33
32
22
22
22
33
33
4
Nor
th2,
976
1972
2,88
52,
741
2,68
52,
621
2,58
42,
471
2,27
52,
075
2,65
92,
540
2,39
02,
195
1,98
31,
771
1,61
71,
589
1,62
31,
691
1,75
71,
765
1,80
81,
867
1,9
11S
outh
1,78
420
071,
332
1,30
01,
211
1,17
81,
132
1,15
41,
503
1,41
81,
311
1,29
81,
229
1,22
61,
174
1,12
71,
104
1,09
11,
058
1,05
51,
109
1,14
21,
220
1,22
31,
211
To
tal H
igh
Sch
oo
l4,
217
4,04
13,
896
3,79
93,
716
3,62
53,
778
3,49
33,
970
3,83
83,
619
3,42
13,
157
2,89
82,
721
2,68
02,
681
2,74
62,
866
2,90
73,
028
3,09
03,
122
Cha
nge
-40
-176
-145
-97
-83
-91
153
-285
477
-132
-219
-198
-264
-259
-177
-41
165
120
4112
162
32%
Cha
nge
-0.9
%-4
.2%
-3.6
%-2
.5%
-2.2
%-2
.4%
4.2%
-7.5
%13
.7%
-3.3
%-5
.7%
-5.5
%-7
.7%
-8.2
%-6
.1%
-1.5
%0.
0%2.
4%4.
4%1.
4%4.
2%2.
0%1.
0%
Gra
nd
To
tal
15,8
4215
,242
14,5
5513
,819
13,0
5012
,426
11,6
3510
,898
10,4
1110
,054
9,70
09,
435
9,24
09,
142
9,27
69,
488
9,72
810
,010
10,3
6010
,571
10,6
8010
,850
10,9
44C
hang
e-3
10-6
00-6
87-7
36-7
69-6
24-7
91-7
37-4
87-3
57-3
54-2
65-1
95-9
813
421
224
028
235
021
110
917
094
% C
hang
e-1
.9%
-3.8
%-4
.5%
-5.1
%-5
.6%
-4.8
%-6
.4%
-6.3
%-4
.5%
-3.4
%-3
.5%
-2.7
%-2
.1%
-1.1
%1.
5%2.
3%2.
5%2.
9%3.
5%2.
0%1.
0%1.
6%0.
9%
* A
ster
isk
deno
tes
chan
ge in
gra
de p
atte
rn
and/
or s
choo
l con
solid
atio
n.
- 8 -

TA
BL
E 2
New
ton
Pub
lic S
choo
lsE
nrol
lmen
t His
tory
and
Pro
ject
ions
by
Sch
ool
1975
to 2
021
Sch
ool N
ame
Pea
k E
nro
llP
eak
Yea
rA
ngie
r75
219
53B
owen
502
2013
Bur
r49
619
67C
abot
539
1967
Car
r40
119
63C
lafli
n42
019
60C
ount
rysi
de55
719
59D
avis
352
1961
Em
erso
n34
519
55F
rank
lin60
119
61H
amilt
on22
219
60H
orac
e M
ann
427
2013
Hyd
e66
919
52Li
ncol
n-E
liot
435
1970
Mas
on-R
ice
620
1962
Mem
oria
l53
619
53M
emor
ial-
Spa
uldi
ng48
619
92O
ak H
ill E
lem
enta
ry45
019
62P
eirc
e42
919
60S
paul
ding
587
1961
Und
erw
ood
582
1970
War
d50
619
71W
illia
ms
375
1969
Zer
vas
(for
mer
ly B
eeth
oven
)35
019
64P
eabo
dy (
SP
ED
)T
ota
l Ele
mC
hang
e%
Cha
nge
Tot
al #
Ele
m S
choo
ls
Big
elow
612
1996
Bro
wn
(for
mer
ly M
eado
wbr
ook)
1,02
419
64D
ay94
720
13O
ak H
ill M
iddl
e63
420
13W
arre
n1,
270
1969
Wee
ks1,
033
1960
To
tal M
idd
le S
cho
ol
Cha
nge
% C
hang
eT
otal
# M
iddl
e S
choo
ls
Nor
th2,
976
1972
Sou
th1,
784
2007
To
tal H
igh
Sch
oo
lC
hang
e%
Cha
nge
Gra
nd
To
tal
Cha
nge
% C
hang
e
* A
ster
isk
deno
tes
chan
ge in
gra
de p
atte
rn
and/
or s
choo
l con
solid
atio
n.
1998
1999
2000
2001
2002
2003
2004
2005
2006
2007
2008
2009
2010
2011
2012
2013
2014
2015
2016
2017
2018
2019
2020
2021
433
412
418
412
396
371
363
370
379
401
392
389
375
395
408
417
402
409
421
444
455
464
466
476
390
377
383
351
336
335
375
386
413
428
435
454
449
448
477
502
475
449
417
409
399
360
360
358
256
278
270
294
300
303
314
314
333
331
369
379
391
409
415
424
424
412
402
395
392
369
352
339
393
385
362
360
352
353
357
391
420
424
425
449
452
440
420
419
418
403
400
394
377
382
370
375
493
499
482
453
455
446
448
463
437
447
479
472
499
490
479
457
466
450
436
432
430
434
420
413
407
389
390
398
384
397
386
385
414
401
396
402
397
401
396
389
413
424
446
455
467
469
457
469
297
301
303
313
330
333
337
344
350
348
370
371
373
386
394
427
434
412
417
399
396
392
395
393
325
285
281
252
220
242
229
282
281
293
284
291
293
317
322
329
337
340
346
347
355
349
352
354
412
393
364
369
364
352
365
372
372
410
422
428
442
437
438
457
478
492
507
516
504
487
458
443
448
462
452
417
440
447
427
419
443
449
442
438
459
458
464
429
434
452
454
472
486
491
488
489
282
271
281
270
271
271
286
306
324
329
338
329
318
316
337
312
306
314
299
285
280
281
265
269
267
278
264
276
294
276
275
264
288
295
282
262
282
289
310
327
341
326
313
316
319
323
307
315
319
343
325
304
281
274
262
262
237
247
260
260
269
278
301
289
304
304
313
311
306
302
297
304
260
258
241
257
260
254
264
275
295
281
276
277
298
302
304
304
292
290
293
299
290
297
301
287
311
281
281
276
287
284
287
300
332
324
328
326
349
321
325
317
309
308
337
371
397
422
450
478
5,29
35,
212
5,09
75,
002
4,97
04,
938
4,97
55,
133
5,31
85,
408
5,49
85,
527
5,64
65,
687
5,79
05,
799
5,83
35,
785
5,80
15,
845
5,85
35,
822
5,73
85,
762
33-8
1-1
15-9
5-3
2-3
237
158
185
9090
2911
941
103
934
-48
1644
8-3
1-8
424
0.6%
-1.5
%-2
.2%
-1.9
%-0
.6%
-0.6
%0.
7%3.
2%3.
6%1.
7%1.
7%0.
5%2.
2%0.
7%1.
8%0.
2%0.
6%-0
.8%
0.3%
0.8%
0.1%
-0.5
%-1
.4%
0.4%
1515
1515
1515
1515
1515
1515
1515
1515
1515
1515
1515
1515
483
446
465
477
513
520
510
496
495
487
505
527
523
533
531
525
504
509
525
536
531
538
564
553
749
771
752
735
756
770
787
705
665
644
681
684
666
677
698
743
738
780
774
744
724
732
802
822
804
804
835
855
822
785
758
768
747
764
747
773
758
845
874
947
932
927
922
985
988
1,01
21,
026
1,01
257
861
962
062
159
759
856
556
556
755
854
757
260
361
261
663
463
260
263
960
761
260
662
262
8
2,61
42,
640
2,67
22,
688
2,68
82,
673
2,62
02,
534
2,47
42,
453
2,48
02,
556
2,55
02,
667
2,71
92,
849
2,80
62,
818
2,86
02,
872
2,85
52,
888
3,01
43,
015
5226
3216
0-1
5-5
3-8
6-6
0-2
127
76-6
117
5213
0-4
312
4212
-17
3312
61
2.0%
1.0%
1.2%
0.6%
0.0%
-0.6
%-2
.0%
-3.3
%-2
.4%
-0.8
%1.
1%3.
1%-0
.2%
4.6%
1.9%
4.8%
-1.5
%0.
4%1.
5%0.
4%-0
.6%
1.2%
4.4%
0.0%
44
44
44
44
44
44
44
44
44
44
44
44
2,01
92,
123
2,14
42,
190
2,21
92,
169
2,12
12,
047
1,96
41,
911
1,82
91,
802
1,87
11,
877
1,94
02,
015
2,06
02,
107
2,14
52,
163
2,15
42,
154
2,19
82,
258
1,24
01,
273
1,33
31,
370
1,39
91,
487
1,55
21,
701
1,74
51,
784
1,76
31,
722
1,70
81,
691
1,72
11,
778
1,80
41,
798
1,85
11,
907
1,96
22,
019
1,96
81,
942
3,25
93,
396
3,47
73,
560
3,61
83,
656
3,67
33,
748
3,70
93,
695
3,59
23,
524
3,57
93,
568
3,66
13,
793
3,86
43,
905
3,99
64,
070
4,11
64,
173
4,16
64,
200
137
137
8183
5838
1775
-39
-14
-103
-68
55-1
193
132
7141
9174
4657
-734
4.4%
4.2%
2.4%
2.4%
1.6%
1.1%
0.5%
2.0%
-1.0
%-0
.4%
-2.8
%-1
.9%
1.6%
-0.3
%2.
6%3.
6%1.
9%1.
1%2.
3%1.
9%1.
1%1.
4%-0
.2%
0.8%
11,1
6611
,248
11,2
4611
,250
11,2
7611
,267
11,2
6811
,415
11,5
0111
,556
11,5
7011
,607
11,7
7511
,922
12,1
7012
,441
12,5
0312
,508
12,6
5712
,787
12,8
241
2,88
312
,918
12,9
7722
282
-24
26-9
114
786
5514
3716
814
724
827
162
514
913
037
5935
592.
0%0.
7%0.
0%0.
0%0.
2%-0
.1%
0.0%
1.3%
0.8%
0.5%
0.1%
0.3%
1.4%
1.2%
2.1%
2.2%
0.5%
0.0%
1.2%
1.0%
0.3%
0.5%
0.3%
0.5%
Pro
ject
ed
- 9 -

Actual Projections Using 5 Year Average Ratios**Grade FY17 FY18 FY19 FY20 FY21 FY22
K 885 902 899 894 904 9061 943 935 948 949 951 9612 1042 955 949 960 958 9633 1005 1,060 968 964 973 9724 976 1,013 1,069 979 972 9815 950 980 1,020 1,076 980 979
TOTAL ELEMENTARY 5,801 5,845 5,853 5,822 5,738 5,762 Diff. from Previous Year 44 8 -31 -84 24% Change 0.8% 0.1% -0.5% -1.4% 0.4%
6 961 925 952 994 1048 9557 972 968 931 959 1001 10538 927 979 972 935 965 1007
TOTAL MIDDLE 2,860 2,872 2,855 2,888 3,014 3,015Diff. from Previous Year 12 -17 33 126 1% Change 0.4% -0.6% 1.2% 4.4% 0.0%
9 992 979 1033 1027 985 101310 976 1002 988 1041 1035 99411 1007 988 1013 998 1053 104712 925 1005 986 1011 997 1050
Spec. Ed. & Post-grads.* 96 96 96 96 96 96TOTAL HIGH 3,996 4,070 4,116 4,173 4,166 4,200Diff. from Previous Year 74 46 57 -7 34% change 1.9% 1.1% 1.4% -0.2% 0.8%GRAND TOTAL 12,657 12,787 12,824 12,883 12,918 12,977Diff. from Previous Year 130 37 59 35 59% Change 1.0% 0.3% 0.5% 0.3% 0.5%*Enrollment numbers and projections include students who receive special education services outside the regular classroom for a significant amount of time.**Four-year averages of previous kindergarten enrollments are used to project kindergarten enrollment.
TABLE 3PROJECTED ENROLLMENTS BY GRADE
2017-18 TO 2021-22
- 10 -

TA
BL
E 4
New
ton
Pub
lic S
choo
lsE
nrol
lmen
t His
tory
and
Pro
ject
ions
by
Gra
de19
75 to
202
1
Gra
de19
7519
7619
7719
7819
7919
8019
8119
8219
8319
8419
8519
8619
8719
8819
8919
9019
9119
9219
9319
9419
9519
96K
946
843
750
681
635
612
628
584
647
673
687
726
730
744
827
809
827
874
906
874
837
870
11,
088
1,00
987
380
472
370
265
265
061
768
871
273
474
975
377
385
184
586
592
194
690
487
12
1,07
81,
069
1,01
089
281
275
567
864
964
861
069
269
272
573
875
577
685
184
587
991
892
088
7
31,
114
1,08
01,
042
1,02
287
881
974
667
666
765
961
068
069
373
477
076
777
585
987
088
289
592
5
41,
116
1,10
31,
073
1,01
91,
002
877
797
739
661
649
642
594
677
705
730
782
763
775
850
869
876
886
51,
191
1,10
11,
089
1,05
51,
005
1,00
086
277
469
965
063
463
559
267
869
873
977
275
774
883
884
885
4S
PE
D76
5654
5456
4036
4445
4447
6059
6570
6964
6042
3629
25T
ota
l K-5
6,60
96,
261
5,89
15,
527
5,11
14,
805
4,39
94,
116
3,98
43,
973
4,02
44,
121
4,22
54,
417
4,62
34,
793
4,89
75,
035
5,21
65,
363
5,30
95,
318
Cha
nge
-197
-348
-370
-364
-416
-306
-406
-283
-132
-11
5197
104
192
206
170
104
138
181
147
-54
9%
Cha
nge
-2.9
%-5
.3%
-5.9
%-6
.2%
-7.5
%-6
.0%
-8.4
%-6
.4%
-3.2
%-0
.3%
1.3%
2.4%
2.5%
4.5%
4.7%
3.7%
2.2%
2.8%
3.6%
2.8%
-1.0
%0.
2%
61,
289
1,19
41,
102
1,09
21,
033
985
960
832
765
689
638
614
626
590
674
710
750
770
746
752
825
833
71,
254
1,26
71,
150
1,05
31,
024
982
928
884
787
739
650
610
589
625
599
665
692
717
742
754
729
822
81,
215
1,26
91,
258
1,13
11,
053
1,01
195
893
488
478
673
764
161
358
063
461
467
770
772
875
775
474
2S
PE
D19
1913
1210
511
1421
2932
2830
3225
2631
3562
3835
45T
ota
l 6-8
3,77
73,
749
3,52
33,
288
3,12
02,
983
2,85
72,
664
2,45
72,
243
2,05
71,
893
1,85
81,
827
1,93
22,
015
2,15
02,
229
2,27
82,
301
2,34
32,
442
Cha
nge
8-2
8-2
26-2
35-1
68-1
37-1
26-1
93-2
07-2
14-1
86-1
64-3
5-3
110
583
135
7949
2342
99%
Cha
nge
0.2%
-0.7
%-6
.0%
-6.7
%-5
.1%
-4.4
%-4
.2%
-6.8
%-7
.8%
-8.7
%-8
.3%
-8.0
%-1
.8%
-1.7
%5.
7%4.
3%6.
7%3.
7%2.
2%1.
0%1.
8%4.
2%
91,
239
1,19
11,
245
1,20
51,
103
1,01
398
996
698
089
880
176
370
065
860
766
664
568
973
477
477
374
910
1,36
61,
273
1,22
41,
271
1,22
51,
126
1,02
01,
000
907
964
931
826
753
686
654
615
692
670
709
706
766
762
111,
418
1,33
11,
295
1,21
31,
260
1,21
01,
094
1,01
31,
001
916
902
863
788
739
676
656
617
684
687
659
707
759
121,
384
1,39
21,
331
1,27
61,
192
1,23
21,
219
1,08
21,
009
987
910
908
849
753
720
675
658
629
675
656
672
695
SP
ED
4945
4639
3957
5757
7373
7561
6762
6468
6974
6111
211
012
5T
ota
l 9-1
25,
456
5,23
25,
141
5,00
44,
819
4,63
84,
379
4,11
83,
970
3,83
83,
619
3,42
13,
157
2,89
82,
721
2,68
02,
681
2,74
62,
866
2,90
73,
028
3,09
0C
hang
e-1
21-2
24-9
1-1
37-1
85-1
81-2
59-2
61-1
48-1
32-2
19-1
98-2
64-2
59-1
77-4
11
6512
041
121
62%
Cha
nge
-2.2
%-4
.1%
-1.7
%-2
.7%
-3.7
%-3
.8%
-5.6
%-6
.0%
-3.6
%-3
.3%
-5.7
%-5
.5%
-7.7
%-8
.2%
-6.1
%-1
.5%
0.0%
2.4%
4.4%
1.4%
4.2%
2.0%
Gra
nd
To
tal
15,8
4215
,242
14,5
5513
,819
13,0
5012
,426
11,6
3510
,898
10,4
1110
,054
9,70
09,
435
9,24
09,
142
9,27
69,
488
9,72
810
,010
10,3
6010
,571
10,6
8010
,850
Cha
nge
-310
-600
-687
-736
-769
-624
-791
-737
-487
-357
-354
-265
-195
-98
134
212
240
282
350
211
109
170
% C
hang
e-1
.9%
-3.8
%-4
.5%
-5.1
%-5
.6%
-4.8
%-6
.4%
-6.3
%-4
.5%
-3.4
%-3
.5%
-2.7
%-2
.1%
-1.1
%1.
5%2.
3%2.
5%2.
9%3.
5%2.
0%1.
0%1.
6%
- 11 -

TA
BL
E 4
New
ton
Pub
lic S
choo
lsE
nrol
lmen
t His
tory
and
Pro
ject
ions
by
Gra
de19
75 to
202
1
Gra
deK 1 2 3 4 5
SP
ED
To
tal K
-5C
hang
e%
Cha
nge
6 7 8S
PE
DT
ota
l 6-8
Cha
nge
% C
hang
e
9 10 11 12S
PE
DT
ota
l 9-1
2C
hang
e%
Cha
nge
Gra
nd
To
tal
Cha
nge
% C
hang
e
1997
1998
1999
2000
2001
2002
2003
2004
2005
2006
2007
2008
2009
2010
2011
2012
2013
2014
2015
2016
2017
2018
2019
2020
2021
808
841
787
736
766
792
796
805
867
887
868
830
862
896
895
934
958
938
877
885
902
899
894
904
906
887
850
866
804
749
805
837
856
853
916
926
950
877
926
940
936
977
999
1,00
594
393
594
894
995
196
187
389
886
785
781
179
582
883
686
889
595
092
498
990
895
696
694
597
999
21,
042
955
949
960
958
963
878
874
901
889
849
815
818
831
860
896
892
962
931
1,00
792
398
198
294
697
71,
005
1,06
096
896
497
397
2
923
876
887
901
896
855
817
819
847
859
897
908
967
932
1,01
793
899
398
094
997
61,
013
1,06
997
997
298
1
873
938
885
894
916
894
832
811
820
851
858
905
884
960
937
1,02
194
499
198
595
098
01,
020
1,07
698
097
918
1619
1615
1410
1718
1417
1917
1719
140
00
00
00
00
5,26
05,
293
5,21
25,
097
5,00
24,
970
4,93
84,
975
5,13
35,
318
5,40
85,
498
5,52
75,
646
5,68
75,
790
5,79
95,
833
5,78
55,
801
5,84
55,
853
5,82
25,
738
5,76
2-5
833
-81
-115
-95
-32
-32
3715
818
590
9029
119
4110
39
34-4
816
448
-31
-84
24-1
.1%
0.6%
-1.5
%-2
.2%
-1.9
%-0
.6%
-0.6
%0.
7%3.
2%3.
6%1.
7%1.
7%0.
5%2.
2%0.
7%1.
8%0.
2%0.
6%-0
.8%
0.3%
0.8%
0.1%
-0.5
%-1
.4%
0.4%
0%83
884
691
186
985
891
689
582
980
482
482
882
987
786
392
290
097
892
296
396
192
595
299
41,
048
955
836
840
843
930
881
875
902
889
836
810
825
836
826
863
875
922
932
963
912
972
968
931
959
1,00
11,
053
828
864
846
851
923
884
867
898
892
837
797
809
848
817
866
889
939
921
943
927
979
972
935
965
1,00
760
6440
2226
139
42
33
65
74
80
00
00
00
00
2,56
22,
614
2,64
02,
672
2,68
82,
688
2,67
32,
620
2,53
42,
474
2,45
32,
480
2,55
62,
550
2,66
72,
719
2,84
92,
806
2,81
82,
860
2,87
22,
855
2,88
83,
014
3,01
512
052
2632
160
-15
-53
-86
-60
-21
2776
-611
752
130
-43
1242
12-1
733
126
14.
9%2.
0%1.
0%1.
2%0.
6%0.
0%-0
.6%
-2.0
%-3
.3%
-2.4
%-0
.8%
1.1%
3.1%
-0.2
%4.
6%1.
9%4.
8%-1
.5%
0.4%
1.5%
0.4%
-0.6
%1.
2%4.
4%0.
0%
776
869
918
872
868
925
899
892
919
905
877
821
835
904
875
931
954
977
945
992
979
1,03
31,
027
985
1,01
374
879
087
588
887
286
593
389
990
691
191
286
884
685
089
688
694
194
197
397
61,
002
988
1,04
11,
035
994
752
765
755
867
877
887
863
925
898
927
927
902
862
843
843
897
888
964
937
1,00
798
81,
013
998
1,05
31,
047
754
756
772
765
864
855
890
860
917
882
914
918
879
879
830
845
910
888
946
925
1,00
598
61,
011
997
1,05
092
7976
8579
8671
9710
884
6583
102
103
124
102
100
9410
496
9696
9696
963,
122
3,25
93,
396
3,47
73,
560
3,61
83,
656
3,67
33,
748
3,70
93,
695
3,59
23,
524
3,57
93,
568
3,66
13,
793
3,86
43,
905
3,99
64,
070
4,11
64,
173
4,16
64,
200
3213
713
781
8358
3817
75-3
9-1
4-1
03-6
855
-11
9313
271
4191
7446
57-7
341.
0%4.
4%4.
2%2.
4%2.
4%1.
6%1.
1%0.
5%2.
0%-1
.0%
-0.4
%-2
.8%
-1.9
%1.
6%-0
.3%
2.6%
3.6%
1.9%
1.1%
2.3%
1.9%
1.1%
1.4%
-0.2
%0.
8%
10,9
4411
,166
11,2
4811
,246
11,2
5011
,276
11,2
6711
,268
11,4
1511
,501
11,5
5611
,570
11,6
0711
,775
11,9
2212
,170
12,4
4112
,503
12,5
0812
,657
12,7
871
2,82
412
,883
12,9
1812
,977
9422
282
-24
26-9
114
786
5514
3716
814
724
827
162
514
913
037
5935
590.
9%2.
0%0.
7%0.
0%0.
0%0.
2%-0
.1%
0.0%
1.3%
0.8%
0.5%
0.1%
0.3%
1.4%
1.2%
2.1%
2.2%
0.5%
0.0%
1.2%
1.0%
0.3%
0.5%
0.3%
0.5%
Pro
ject
ed
- 12 -

TABLE 5COMPARISON OF ACTUAL AND PROJECTED 5 YEAR ENROLLMENT CHANGE
2011-12 TO 2016-17 AND 2016-17 TO 2021-22
School2011-12
Enrollment2016-17
EnrollmentChange
% Change
2016-17 Enrollment
2021-22 Enrollment
Change%
Change
Angier 408 421 13 3.2% 421 476 55 13.1%Bowen 477 417 -60 -12.6% 417 358 -59 -14.1%Burr 415 402 -13 -3.1% 402 339 -63 -15.7%Cabot 420 400 -20 -4.8% 400 375 -25 -6.3%Countryside 479 436 -43 -9.0% 436 413 -23 -5.3%Franklin 396 446 50 12.6% 446 469 23 5.2%Horace Mann 394 417 23 5.8% 417 393 -24 -5.8%Lincoln-Eliot 322 346 24 7.5% 346 354 8 2.3%Mason-Rice 438 507 69 15.8% 507 443 -64 -12.6%Memorial-Spaulding 464 454 -10 -2.2% 454 489 35 7.7%Peirce 337 299 -38 -11.3% 299 269 -30 -10.0%Underwood 310 313 3 1.0% 313 315 2 0.6%Ward 301 313 12 4.0% 313 304 -9 -2.9%Williams 304 293 -11 -3.6% 293 287 -6 -2.0%Zervas 325 337 12 3.7% 337 478 141 41.8%TOTAL ELEMENTARY 5,790 5,801 11 0.2% 5,801 5,762 -39 -0.7%
Bigelow 531 525 -6 -1.1% 525 553 28 5.3%Brown 698 774 76 10.9% 774 822 48 6.2%Day 874 922 48 5.5% 922 1,012 90 9.8%Oak Hill 616 639 23 3.7% 639 628 -11 -1.7%TOTAL MIDDLE 2,719 2,860 141 5.2% 2,860 3,015 155 5.4%
Newton North 1,940 2,145 205 10.6% 2,145 2,258 113 5.3%Newton South 1,721 1,851 130 7.6% 1,851 1,942 91 4.9%TOTAL HIGH SCHOOL 3,661 3,996 335 9.2% 3,996 4,200 204 5.1%
TOTAL ENROLLMENT 12,170 12,657 487 4.0% 12,657 12,977 320 2.5%
- 13 -

Yea
rG
rade
s K
-5G
rade
s 6-
8G
rade
s 9-
12S
yste
m-W
ide
Tot
al%
Cha
nge
# C
hang
eT
otal
% C
hang
e#
Cha
nge
Tot
al%
Cha
nge
# C
hang
eT
otal
% C
hang
e#
Cha
nge
2010
-201
15,
646
2.2%
119
2,55
05.
1%12
53,
579
1.5%
5511
,775
2.5%
299
2011
-201
25,
687
0.7%
412,
667
4.6%
117
3,56
8-0
.3%
-11
11,9
22
1.
2%14
7
2012
-201
35,
790
1.8%
103
2,71
91.
9%52
3,66
12.
6%93
12,1
70
2.
1%24
8
2013
-201
45,
799
0.2%
92,
849
4.8%
130
3,79
33.
6%13
212
,441
2.2%
271
2014
-201
55,
833
0.6%
342,
806
-1.5
%-4
33,
864
1.9%
7112
,503
0.5%
62
2015
-201
65,
785
-0.8
%-4
82,
818
0.4%
123,
905
1.1%
4112
,508
0.0%
5
2016
-201
75,
801
0.3%
162,
860
1.5%
423,
996
2.3%
9112
,657
1.2%
149
2017
-201
85,
845
0.8%
442,
872
0.4%
124,
070
1.9%
7412
,787
1.0%
130
2018
-201
95,
853
0.1%
82,
855
-0.6
%-1
74,
116
1.1%
4612
,824
0.3%
37
2019
-202
05,
822
-0.5
%-3
12,
888
1.2%
334,
173
1.4%
5712
,883
0.5%
59
2020
-202
15,
738
-1.4
%-8
43,
014
4.4%
126
4,16
6-0
.2%
-712
,918
0.3%
35
2021
-202
25,
762
0.4%
243,
015
0.0%
14,
200
0.8%
3412
,977
0.5%
59%
Cha
nge
2010
-201
1 to
20
21-2
022
2.1%
18.2
%17
.4%
10.2
%
% C
hang
e 20
10-2
011
to
2016
-201
72.
7%12
.2%
11.7
%7.
5%
% C
hang
e 20
16-2
017
to
2021
-202
2-0
.7%
5.4%
5.1%
2.5%
TA
BL
E 6
PE
RC
EN
T O
F C
HA
NG
E B
Y G
RA
DE
SP
AN
2010
-201
1 T
O 2
021-
2022
- 14 -

Difference from %Year Enrollment Previous Year Change1967 18,4241977 14,555 –687 –4.5%1978 13,819 –736 –5.1%1979 13,050 –769 –5.6%1980 12,426 –624 –4.8%1981 11,635 –791 –6.4%1982 10,898 –737 –6.3%1983 10,411 –487 –4.5%1984 10,054 –357 –3.4%1985 9,700 –354 –3.5%1986 9,435 –265 –2.7%1987 9,240 –195 –2.1%1988 9,142 –98 –1.1%1989 9,276 +134 +1.5%1990 9,488 +212 +2.3%1991 9,728 +240 +2.5%1992 10,010 +282 +2.9%1993 10,360 +350 +3.5%1994 10,571 +211 +2.0%1995 10,680 +109 +1.0%1996 10,850 +170 +1.6%1997 10,944 +94 +0.9%1998 11,166 +222 +2.0%1999 11,248 +82 +0.7%2000 11,246 –2 +0.0%2001 11,250 +4 +0.0%2002 11,276 +26 +0.2%2003 11,267 –9 -0.1%2004 11,268 +1 0.0%2005 11,415 +147 1.3%2006 11,501 +86 0.8%2007 11,556 +55 0.5%2008 11,570 +14 0.1%2009 11,607 +37 0.3%2010 11,775 +168 1.4%2011 11,922 +147 1.2%2012 12,170 +248 2.1%2013 12,441 +271 2.2%2014 12,503 +62 0.5%2015 12,508 +5 0.0%2016 12,657 +149 1.2%
PROJECTED2017 12,787 +130 +1.0%2018 12,824 +37 +0.3%2019 12,883 +59 +0.5%2020 12,918 +35 +0.3%2021 12,977 +59 +0.5%
Note: Peak enrollment year is in bold
TABLE 7 ACTUAL SYSTEM ENROLLMENT CHANGE 1977-2016
- 15 -

Difference from %Year Enrollment Previous Year Change1961 10,0101981 5,359 –431 –7.4%1982 4,948 –411 –7.7%1983 4,749 –199 –4.0%1984 4,662 –87 –1.8%1985 4,662 +0 +0.0%1986 4,735 +73 +1.6%1987 4,851 +116 +2.4%1988 5,007 +156 +3.2%1989 5,297 +290 +5.8%1990 5,503 +206 +3.9%1991 5,647 +144 +2.6%1992 5,805 +158 +2.7%1993* 5,216 –589 –11.3%1994 5,363 +147 +2.7%1995 5,309 –54 –1.0%1996 5,318 +9 +0.2%1997 5,260 –58 –1.1%1998 5,293 +33 +0.6%1999 5,212 –81 –1.5%2000 5,097 –115 –2.2%2001 5,002 –95 –1.9%2002 4,970 –32 –0.6%2003 4,938 –32 –0.6%2004 4,975 +37 +0.7%2005 5,133 +158 +3.2%2006 5,318 +185 +3.6%2007 5,408 +90 +1.7%2008 5,498 +90 +1.7%2009 5,527 +29 +0.5%2010 5,646 +119 +2.2%2011 5,687 +41 +0.7%2012 5,790 +103 +1.8%2013 5,799 +9 +0.2%2014 5,833 +34 +0.6%2015 5,785 –48 –0.8%2016 5,801 +16 +0.3%
PROJECTED2017 5,845 +44 +0.8%2018 5,853 +8 +0.1%2019 5,822 –31 –0.5%2020 5,738 –84 –1.4%2021 5,762 +24 +0.4%
Note: Peak enrollment year is in bold*Grade organization changed from K-6 to K-5 configuration
ACTUAL ELEMENTARY SCHOOL ENROLLMENT CHANGE 1981-2016
TABLE 8
- 16 -

Difference from %
Year Enrollment Previous Year Change
1984 5,392 –270 –4.8%
1985 5,038 –354 –6.6%
1986 4,700 –338 –6.7%
1987 4,389 –311 –6.6%
1988 4,135 –254 –5.8%
1989 3,979 –156 –3.8%
1990 3,985 +6 +0.2%
1991 4,081 +96 +2.4%
1992 4,205 +124 +3.0%
1993* 5,144 +939 +22.3%
1994 5,208 +64 +1.2%
1995 5,371 +163 +3.1%
1996 5,532 +161 +3.0%
1997 5,684 +152 +2.7%
1998 5,873 +189 +3.3%
1999 6,036 +163 +2.8%
2000 6,149 +113 +1.9%
2001 6,248 +99 +1.6%
2002 6,306 +58 +0.9%
2003 6,329 +23 +0.4%
2004 6,293 –36 –0.6%
2005 6,282 –11 –0.2%
2006 6,183 –99 –1.6%
2007 6,148 –35 –0.6%
2008 6,072 –76 –1.2%
2009 6,080 +8 +0.1%
2010 6,129 +49 +0.8%
2011 6,235 +106 +1.7%
2012 6,380 +145 +2.3%
2013 6,642 +262 +4.1%
2014 6,670 +28 +0.4%
2015 6,723 +53 +0.8%
2016 6,856 +133 +2.0%
Projections
Grades Grades Total Difference from %
Year 6-8 9-12 Enrollment Previous Year Change
2017 2,872 4,070 6,942 +86 +1.3%
2018 2,855 4,116 6,971 +29 +0.4%
2019 2,888 4,173 7,061 +90 +1.3%
2020 3,014 4,166 7,180 +119 +1.7%
2021 3,015 4,200 7,215 +35 +0.5%
*Secondary school enrollments reflect a change in grade configuration from 7-8 to 6-8 at
the middle school level.
SECONDARY ENROLLMENT CHANGE 1984 THROUGH 2016 ACTUAL AND 2021 PROJECTED
TABLE 9
- 17 -


II. ENROLLMENT PROJECTION METHOD
Kindergarten Projection Methodology
NESDEC Comparison
Accuracy of Projections
Frequently Asked Questions


II. ENROLLMENT PROJECTION METHOD The enrollment projections are prepared by combining the current year’s official enrollment as reported on October 1, 2016 to the Department of Elementary and Secondary Education with other available demographic data for Newton. These data are then applied to a spreadsheet model of five-year average cohort survival ratios. The projections are calculated on an individual school and grade basis and then aggregated into system-wide projections. Just as in recent years, five-year cohort survival ratios for grades 1 through 12 are used in this projection. Adjusted straight four-year averages are used for kindergarten this year as explained later in this section. A cohort is defined as a group of students of a specific age or grade level who are at a specific school or are all going to the same school in the next year. Non-resident students are not included in the base for the cohort calculation, but are added to the total after the calculation. Next year's 6th graders at Oak Hill Middle School, for example, are made up of the 5th grade cohorts from Bowen, Memorial-Spaulding and Zervas. The five-year average cohort survival ratio for schools entering Oak Hill is 0.97. There are 232 resident students in the group described above. The cohort calculation therefore yields 225 (232 x 0.97) students. Eight current non-resident students are added to this total, resulting in the final projection of 233 students for students entering the 6th grade at Oak Hill next year.
The following factors are integrated in the forecast: All current School Committee policies on school feeder patterns, split districts, district
boundaries and buffer zones. All feeder patterns reflect current policies. Student assignment policy changes for the Angier and Zervas districts, and affecting nearby school districts, were approved in September 2015 and are fully integrated into the forecast.
METCO students are added to each school and grade after the projections are computed. METCO students who will enter the system in kindergarten, grade one or grade two each year for the next five years are also included in the individual school tables by grade.
Number of entering middle and high school students are based on percentages of students from lower grade level schools to reflect districting, split districts, and buffer zones.
Number of potential students from residential properties (when building permits have been issued by the City of Newton).
Kindergarten Projection Methodology
The following two charts provide data on kindergarten enrollment. The first chart shows the highest kindergarten populations of the past forty years. The 2016-17 kindergarten class of 885 students is one of two classes in the last five years that are under 900 students. The kindergarten projection had a variance this year of 10 fewer students, or -1.1%. The second chart illustrates the rising trend over time of how Newton’s four-year old population (as per City census data) relates to the kindergarten population. The current ratio of 1.87 is the highest of the past decade and is a result of the relatively low city census data of children age 4, at 473 children, resulting in the 885 kindergarten students. Note that the ratio of children age 4 to the following year’s kindergarten has been steadily rising since 2003 driven by lower numbers of 4 year olds documented on the city census and kindergarten classes that, for the most part, have been growing.
- 18 -
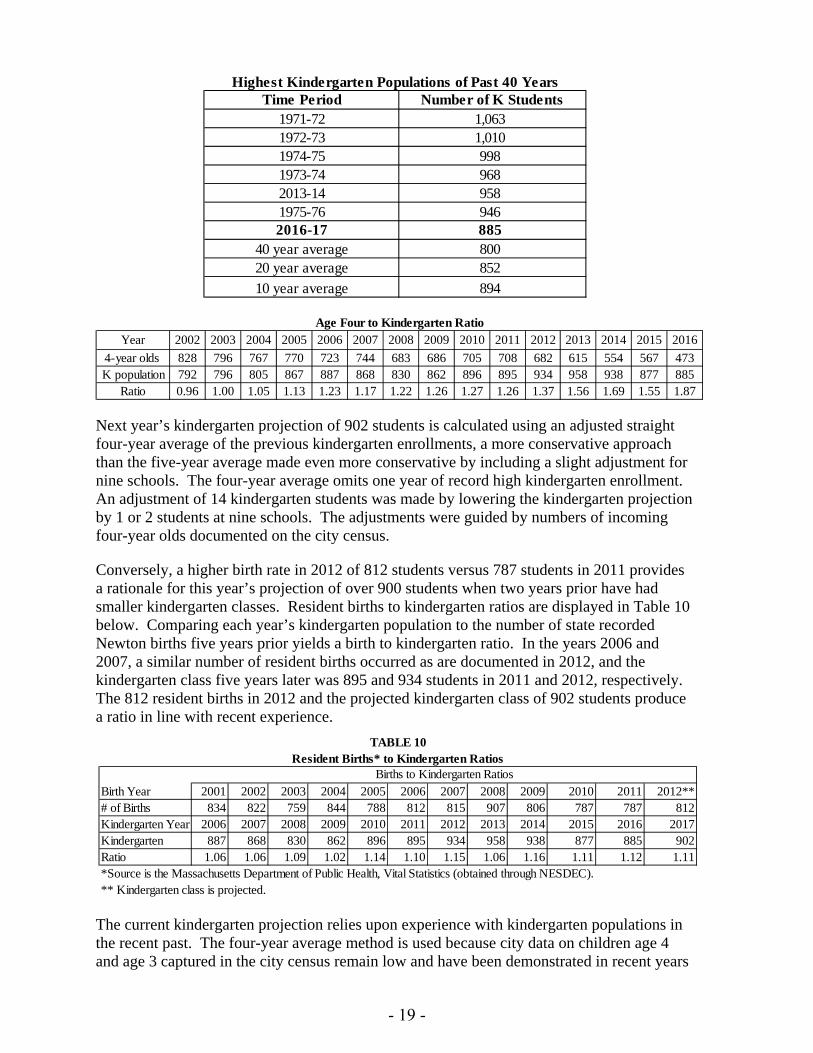
Next year’s kindergarten projection of 902 students is calculated using an adjusted straight four-year average of the previous kindergarten enrollments, a more conservative approach than the five-year average made even more conservative by including a slight adjustment for nine schools. The four-year average omits one year of record high kindergarten enrollment. An adjustment of 14 kindergarten students was made by lowering the kindergarten projection by 1 or 2 students at nine schools. The adjustments were guided by numbers of incoming four-year olds documented on the city census.
Conversely, a higher birth rate in 2012 of 812 students versus 787 students in 2011 provides a rationale for this year’s projection of over 900 students when two years prior have had smaller kindergarten classes. Resident births to kindergarten ratios are displayed in Table 10 below. Comparing each year’s kindergarten population to the number of state recorded Newton births five years prior yields a birth to kindergarten ratio. In the years 2006 and 2007, a similar number of resident births occurred as are documented in 2012, and the kindergarten class five years later was 895 and 934 students in 2011 and 2012, respectively. The 812 resident births in 2012 and the projected kindergarten class of 902 students produce a ratio in line with recent experience.
The current kindergarten projection relies upon experience with kindergarten populations in the recent past. The four-year average method is used because city data on children age 4 and age 3 captured in the city census remain low and have been demonstrated in recent years
Highest Kindergarten Populations of Past 40 YearsTime Period Number of K Students
1971-72 1,0631972-73 1,0101974-75 9981973-74 9682013-14 9581975-76 9462016-17 885
40 year average 80020 year average 852
10 year average 894
Year 2002 2003 2004 2005 2006 2007 2008 2009 2010 2011 2012 2013 2014 2015 2016
4-year olds 828 796 767 770 723 744 683 686 705 708 682 615 554 567 473K population 792 796 805 867 887 868 830 862 896 895 934 958 938 877 885
Ratio 0.96 1.00 1.05 1.13 1.23 1.17 1.22 1.26 1.27 1.26 1.37 1.56 1.69 1.55 1.87
Age Four to Kindergarten Ratio
Birth Year 2001 2002 2003 2004 2005 2006 2007 2008 2009 2010 2011 2012**# of Births 834 822 759 844 788 812 815 907 806 787 787 812Kindergarten Year 2006 2007 2008 2009 2010 2011 2012 2013 2014 2015 2016 2017Kindergarten 887 868 830 862 896 895 934 958 938 877 885 902Ratio 1.06 1.06 1.09 1.02 1.14 1.10 1.15 1.06 1.16 1.11 1.12 1.11*Source is the Massachusetts Department of Public Health, Vital Statistics (obtained through NESDEC).** Kindergarten class is projected.
Births to Kindergarten RatiosResident Births* to Kindergarten Ratios
TABLE 10
- 19 -

to not be a good predictor of the number of kindergarten students one or two years later. For example, using city census data of the number of children age 4 to project next year’s kindergarten yields 738 students.
NESDEC Comparison The enrollment analysis report includes projections for the Newton Public Schools from NESDEC (the New England School Development Council). In total by all grade levels, NESDEC’s enrollment projections for 2017-18 are close to Newton’s projections. NESDEC is projecting higher than Newton for next year, with a small difference of 5 students. This difference is largely accounted for by a higher elementary projection and a lower middle school projection. NESDEC’s kindergarten projection of 921 students for next year is higher than Newton’s projection because of their larger emphasis on resident birth data. NESDEC uses a five-year average of Newton resident birth data to project kindergarten enrollment five years later; to project kindergarten enrollment in later years including 2020-21 and 2021-22, NESDEC uses estimated numbers of births for calendar year 2015 and 2016. Please see Table 11 of Appendix D. There is a greater divergence between Newton and NESDEC’s projections in the second and third years of the projection. The total variances for 2018-19 and 2019-20 are 26 and 27 students, respectively, with Newton being lower. The kindergarten variances by year between this report and NESDEC’s projections for the next five years are within 20 students, for all but the fourth year of the projection, at -19 and -11, -11, +28 and +5. Newton is projecting fewer kindergarten students than NESDEC in the next three years. There are two additional differences between NESDEC’s projection methodology and Newton’s. First, NESDEC’s projections are calculated by total grade rather than by school and by grade. Second, NESDEC uses different cohort survival ratios for all grades influenced by their regional experience of school districts whereas Newton uses a five-year ratio for grades K through 12. Also in contrast to NESDEC, Newton has made an adjustment to projections to account for residential development in the city (the addition of students anticipated from the Kessler Woods, Court Street, and Austin Street developments).
Accuracy of Projections Several tables are included to show how accurately Newton Public Schools projections match actual enrollment. Table 11 shows the projections for the current year (2016-17) by grade level as predicted one, two and three years ago.
TABLE 11Projection History for 2016-17 (FY17)
Date Projected Elementary Middle High School TotalFall 2013 5,899 2,852 4,150 12,901Fall 2014 5,905 2,847 4,042 12,794Fall 2015 5,787 2,838 3,955 12,580Actual October 2016 5,801 2,860 3,996 12,657
- 20 -

Overall, the October 1, 2016 actual enrollment of 12,657 students is 77 students higher than projected in the November 2015 Enrollment Analysis Report, a 0.6% variance from projection. For comparison, variances from projection in the last three years were -1.4% in 2015-16, -0.7% in 2014-15, and 0.0% in 2013-14. In the past 16 years, Newton has had six negative variances when actual enrollment has been lower than projected enrollment. More commonly in this time period, the actual enrollment has been higher than the projection. This year, all three grade levels are enrolled at higher than anticipated levels with 14, 22 and 41 more students at the elementary, middle and high school grade levels respectively, variances ranging from 0.2% to 1.0%. Table 12 provides a one-page summary of last year’s projections by school. Of the six elementary schools that had enrollments lower than projected, Underwood and Bowen had the largest variances of -4.9% (16 fewer students) and -4.4% (19 fewer students), respectively. Peirce and Williams had negative variances around 2% and enrolled 6 to 7 fewer students than expected. Cabot and Mason-Rice were among the schools with more students enrolled than projected; these schools enrolled 12 and 19 more students, or 3.1% and 3.9%, respectively. Bigelow and Oak Hill both varied from projection by more than 2% with Oak Hill having the greatest variance of 4.4%% and 27 more students. Newton South enrolled 50 more students than projected, or a 2.8% variance. Newton North was close to projection with nine fewer students, a -0.4% variance. Table 13 provides school and grade detail comparing the 2016-17 enrollment to the projections made last year. This table illustrates that grades 1, 2, 10 and 11 had the highest variances from projection of over 2%, with the variance for grades 10 and 11 being the highest at 3.3% and 3.2%, respectively. At the middle school level, all grade levels were close to projection with variances by grade of at most 13 students, and under 2%. The projection for grade seven was the most accurate at 0.2%. Grades 10 and 11 at the high school exceeded projection each by 31 students and just over 3%.
- 21 -

SC
HO
OL
S
OC
TO
BE
R
2015
A
CT
UA
LK
12
34
5
Spe
cial
E
duca
tion
**
OC
TO
BE
R
2016
A
CT
UA
L
DIF
F.
2016
-20
15%
DIF
F.
2016
P
roje
cted
*
DIF
F.
AC
TU
AL/
PR
OJ.
% D
IFF
.A
ngie
r40
978
6679
7170
5742
112
2.9%
416
51.
2%B
owen
449
6061
6095
6873
417
-32
-7.1
%43
6-1
9-4
.4%
Bur
r41
248
6874
8062
7040
2-1
0-2
.4%
404
-2-0
.5%
Cab
ot40
352
5676
6976
7140
0-3
-0.7
%38
812
3.1%
Cou
ntry
side
450
6377
8166
7376
436
-14
-3.1
%43
15
1.2%
Fra
nklin
424
7967
8977
6470
446
225.
2%44
8-2
-0.4
%H
orac
e M
ann
412
6267
6269
7186
417
51.
2%41
25
1.2%
Linc
oln-
Elio
t34
062
5557
6351
5834
66
1.8%
340
61.
8%M
ason
-Ric
e49
267
9099
9390
6850
715
3.0%
488
193.
9%M
emor
ial-S
paul
ding
452
7184
8574
7268
454
20.
4%45
04
0.9%
Pei
rce
314
3842
6044
5362
299
-15
-4.8
%30
6-7
-2.3
%U
nder
woo
d32
647
4465
4855
5431
3-1
3-4
.0%
329
-16
-4.9
%W
ard
304
4945
5456
5851
313
93.
0%30
85
1.6%
Will
iam
s29
044
6544
4358
3929
33
1.0%
299
-6-2
.0%
Zer
vas
308
6556
5757
5547
337
299.
4%33
25
1.5%
SU
B-T
OT
AL
5,78
588
594
310
4210
0597
695
00
5,80
116
0.3%
5,78
714
0.2%
SC
HO
OL
S6
78
Big
elow
509
178
184
163
525
163.
1%51
312
2.3%
Bro
wn
780
241
281
252
774
-6-0
.8%
790
-16
-2.0
%D
ay92
730
931
829
592
2-5
-0.5
%92
3-1
-0.1
%O
ak H
ill60
223
318
921
763
937
6.1%
612
274.
4%S
UB
-TO
TA
L2,
818
961
972
927
02,
860
421.
5%2,
838
220.
8%
SC
HO
OL
S9
1011
12S
P**
New
ton
Nor
th2,
107
511
524
552
474
842,
145
381.
8%2,
154
-9-0
.4%
New
ton
Sou
th1,
798
481
452
455
451
121,
851
532.
9%1,
801
502.
8%S
UB
-TO
TA
L3,
905
992
976
1007
925
963,
996
912.
3%3,
955
411.
0%
GR
AN
D T
OT
AL
12,5
0896
12,6
5714
91.
2%12
,580
770.
6%*M
ET
CO
stu
dent
s ar
e in
clud
ed in
all
scho
ols'
pro
ject
ed e
nrol
lmen
ts.
**N
orth
incl
udes
84
stud
ents
rec
eivi
ng s
peci
al e
duca
tion
serv
ices
out
side
of t
he c
lass
room
for
a si
gnifi
cant
am
ount
of t
ime.
Sou
th in
clud
es 1
2 st
uden
ts r
ecei
ving
spe
cial
edu
catio
n se
rvic
es o
utsi
de o
f the
cla
ssro
om fo
r a
sign
ifica
nt a
mou
nt o
f tim
e. (
Spe
cial
edu
catio
n st
uden
ts r
ecei
ving
ser
vice
s ou
tsid
e th
e cl
assr
oom
for
a si
gnifi
cant
am
ount
of t
ime
in g
rade
s K
-8 a
re r
epor
ted
with
thei
r gr
ade.
)
Oct
ob
er 2
016
Act
ual
By
Gra
de
TA
BL
E 1
2C
OM
PA
RIS
ON
OF
OC
TO
BE
R, 2
015
AN
D O
CT
OB
ER
, 201
6 E
NR
OL
LM
EN
TS
AN
DC
OM
PA
RIS
ON
OF
PR
OJE
CT
ED
WIT
H A
CT
UA
L O
CT
OB
ER
, 201
6 E
NR
OL
LM
EN
T
- 22 -- 22 -

Actual 16/17
Proj. 16/17
Actual 16/17
Proj. 16/17
Actual 16/17
Proj. 16/17
Actual 16/17
Proj. 16/17
Actual 16/17
Proj. 16/17
K 78 67 60 62 48 60 52 59 63 631 66 69 61 62 68 64 56 56 77 732 79 79 60 68 74 70 76 69 81 743 71 73 95 100 80 80 69 63 66 654 70 70 68 70 62 62 76 75 73 785 57 58 73 74 70 68 71 66 76 78
Total 421 416 417 436 402 404 400 388 436 431
Actual 16/17
Proj. 16/17
Actual 16/17
Proj. 16/17
Actual 16/17
Proj. 16/17
Actual 16/17
Proj. 16/17
Actual 16/17
Proj. 16/17
K 79 69 62 64 62 54 67 66 71 711 67 70 67 59 55 59 90 86 84 832 89 87 62 64 57 58 99 96 85 823 77 74 69 69 63 63 93 90 74 734 64 70 71 73 51 53 90 85 72 715 70 78 86 83 58 53 68 65 68 70
Total 446 448 417 412 346 340 507 488 454 450
Actual 16/17
Proj. 16/17
Actual 16/17
Proj. 16/17
Actual 16/17
Proj. 16/17
Actual 16/17
Proj. 16/17
Actual 16/17
Proj. 16/17
K 38 46 47 48 49 41 44 45 65 801 42 44 44 44 45 48 65 64 56 462 60 55 65 68 54 50 44 42 57 543 44 46 48 55 56 59 43 43 57 554 53 50 55 58 58 58 58 62 55 535 62 65 54 56 51 52 39 43 47 44
Total 299 306 313 329 313 308 293 299 337 332
GradeActual 16/17
Proj. 16/17
K 885 895 -10 -1.1%1 943 927 16 1.7%2 1042 1016 26 2.6%3 1005 1008 -3 -0.3%4 976 988 -12 -1.2%5 950 953 -3 -0.3%
Total 5,801 5,787 14 0.2%
Bowen Burr Cabot
TABLE 13ACTUAL AND PROJECTED ELEMENTARY ENROLLMENTS BY SCHOOL 2016-17
Countryside
Grade
Angier
Williams
Grade
% Diff.
Grade
TOTAL ELEM.
Lincoln-Eliot
Underwood Ward
Horace Mann
N Diff
M-Spaulding
Zervas
Mason-RiceFranklin
Peirce
- 23 -

Actual 16/17
Proj. 16/17
Actual 16/17
Proj. 16/17
Actual 16/17
Proj. 16/17
Actual 16/17
Proj. 16/17
6 178 171 241 248 309 322 233 2137 184 182 281 284 318 311 189 1938 163 160 252 258 295 290 217 206
Total 525 513 774 790 922 923 639 612
Actual 16/17
Proj. 16/17
961 954 7 0.7%972 970 2 0.2%927 914 13 1.4%
2,860 2,838 22 0.8%
Actual 16/17
Proj. 16/17
Actual 16/17
Proj. 16/17
Actual 16/17
Proj. 16/17
9 511 539 481 457 992 996 -4 -0.4%10 524 509 452 436 976 945 31 3.3%11 552 540 455 436 1,007 976 31 3.2%12 474 484 451 450 925 934 -9 -1.0%
Sp. Ed. 84 82 12 22 96 104 -8 -7.7%Total 2,145 2,154 1,851 1,801 3,996 3,955 41 1.0%
5,801 5,787 14 0.2%2,860 2,838 22 0.8%3,996 3,955 41 1.0%12,657 12,580 77 0.6%Total
Day
ElementaryMiddleHigh
Oak Hill
6
% Diff.
TOTAL HIGH
8Total
SouthNorth
7
N Diff.Grade
Bigelow
Grade
Brown
Grade
TOTAL MIDDLEN
Diff.%
Diff.
%Diff.Division
Actual 16/17
Proj. 16/17
N Diff.
TABLE 13 (CONT.)ACTUAL AND PROJECTED SECONDARY ENROLLMENTS BY SCHOOL 2016-17
- 24 -
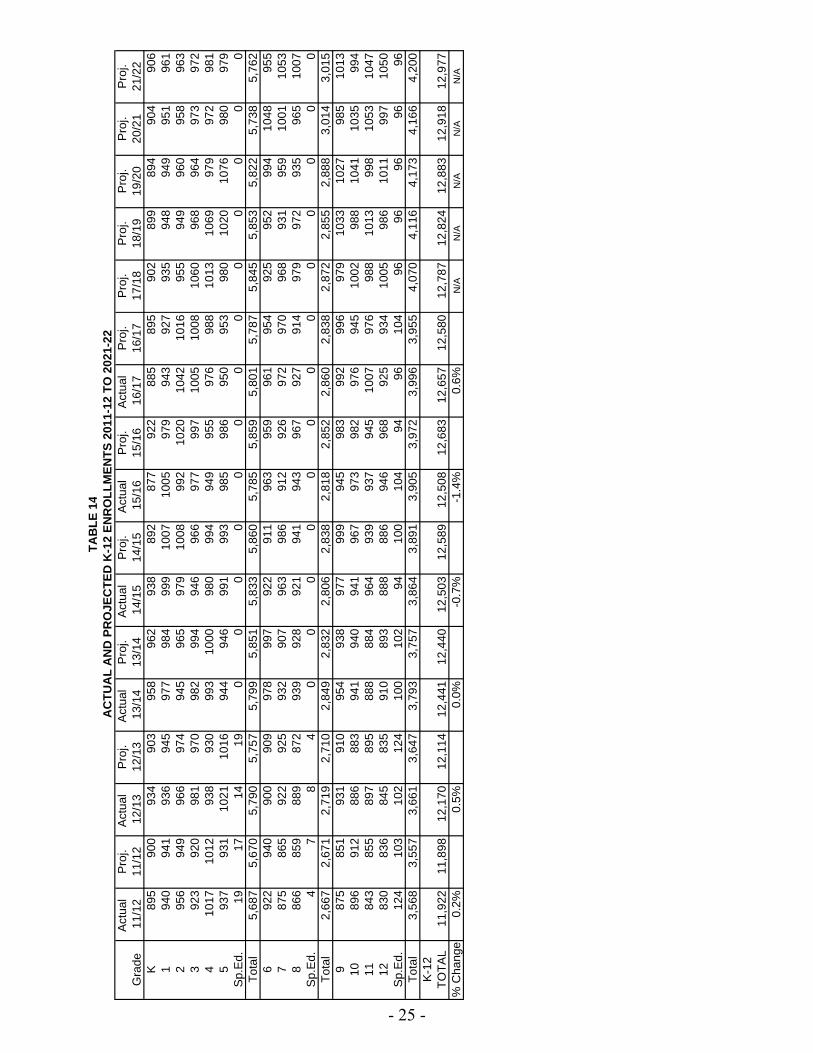
Act
ual
Pro
j.A
ctua
l P
roj.
Act
ual
Pro
j.A
ctua
l P
roj.
Act
ual
Pro
j.A
ctua
l P
roj.
Pro
j.P
roj.
Pro
j.P
roj.
Pro
j.G
rade
11/1
211
/12
12/1
312
/13
13/1
413
/14
14/1
514
/15
15/1
615
/16
16/1
716
/17
17/1
818
/19
19/2
020
/21
21/2
2K
895
900
934
903
958
962
938
892
877
922
885
895
902
899
894
904
906
194
094
193
694
597
798
499
910
0710
0597
994
392
793
594
894
995
196
12
956
949
966
974
945
965
979
1008
992
1020
1042
1016
955
949
960
958
963
392
392
098
197
098
299
494
696
697
799
710
0510
0810
6096
896
497
397
24
1017
1012
938
930
993
1000
980
994
949
955
976
988
1013
1069
979
972
981
593
793
110
2110
1694
494
699
199
398
598
695
095
398
010
2010
7698
097
9S
p.E
d.19
1714
190
00
00
00
00
00
00
Tot
al5,
687
5,67
05,
790
5,75
75,
799
5,85
15,
833
5,86
05,
785
5,85
95,
801
5,78
75,
845
5,85
35,
822
5,73
85,
762
692
294
090
090
997
899
792
291
196
395
996
195
492
595
299
410
4895
57
875
865
922
925
932
907
963
986
912
926
972
970
968
931
959
1001
1053
886
685
988
987
293
992
892
194
194
396
792
791
497
997
293
596
510
07S
p.E
d.4
78
40
00
00
00
00
00
00
Tot
al2,
667
2,67
12,
719
2,71
02,
849
2,83
22,
806
2,83
82,
818
2,85
22,
860
2,83
82,
872
2,85
52,
888
3,01
43,
015
987
585
193
191
095
493
897
799
994
598
399
299
697
910
3310
2798
510
1310
896
912
886
883
941
940
941
967
973
982
976
945
1002
988
1041
1035
994
1184
385
589
789
588
888
496
493
993
794
510
0797
698
810
1399
810
5310
4712
830
836
845
835
910
893
888
886
946
968
925
934
1005
986
1011
997
1050
Sp.
Ed.
124
103
102
124
100
102
9410
010
494
9610
496
9696
9696
Tot
al3,
568
3,55
73,
661
3,64
73,
793
3,75
73,
864
3,89
13,
905
3,97
23,
996
3,95
54,
070
4,11
64,
173
4,16
64,
200
K-1
2T
OT
AL
11,9
2211
,898
12,1
7012
,114
12,4
4112
,440
12,5
0312
,589
12,5
0812
,683
12,6
5712
,580
12,7
8712
,824
12,8
8312
,918
12,9
77%
Cha
nge
0.2%
0.5%
0.0%
-0.7
%-1
.4%
0.6%
N/A
N/A
N/A
N/A
N/A
TA
BL
E 1
4A
CT
UA
L A
ND
PR
OJE
CT
ED
K-1
2 E
NR
OL
LM
EN
TS
201
1-12
TO
202
1-22
- 25 -

Frequently Asked Questions
1. Why do we need to know how many students may be attending each school in Newton in future years?
Enrollment projections are useful for decision-making and planning especially in light of continuing significant enrollment growth. With growing shortages of space at the elementary and middle schools, and with increased demand on local financial resources, accurate projections have become increasingly important. Carefully crafted, presented and interpreted projections are a key first step in the planning process. The district is then able to plan the budgets, including capital improvements, classroom space requirements, sufficient teacher workforce and staffing, instructional materials, transportation and so forth. Accurate projections alert the district to changes in school population to allow for needed adjustments. In addition to the projections, school principals provide critical data on enrollments and registrations each spring.
2. Why can’t the principals count the students who are in their school and add the students who are coming next year?
This technique may work very well in small, stable communities for a single year's projection. However, larger communities like Newton, with a need for long-term planning, require more complex approaches in order to forecast enrollment trends some years into the future. Research done on Newton’s high school enrollment showed that a significant number of students enter and exit the system during the school year and during each summer. Reliance on class lists would provide a less accurate picture than the use of a statistical model that accounts for movements in and out of each school and the system as a whole. It is worth noting that Newton’s elementary school principals submit expected numbers of pupils in May and June so that planning for classrooms and teaching staff can proceed with the most recent information.
3. How complex are projection methods?
Enrollment projection procedures are somewhat complex, but, like most statistical methods, they can be explained and replicated. For example, next year's 6th graders at Oak Hill Middle School are made up of the 5th grade cohorts from Bowen, Memorial-Spaulding and Zervas. The five-year average cohort survival ratio for schools entering Oak Hill is 0.97. There are 232 resident students in the group described above. The cohort calculation therefore yields 225 (232 x 0.97) students. Eight current non-resident students are added to this total, resulting in the final projection of 233 students for students entering the 6th grade at Oak Hill next year. These forecasts help communities to better understand the impact of trends and changes in enrollment, migration and births on school population. All projections are based on underlying assumptions that use historical school enrollment and census data.
4. What procedures are used in other school systems across the United States?
Most school systems use the “Cohort Survival” method, or some variation, as the technique to provide enrollment forecasts. The basic unit used in this technique is the ratio, a measure that expresses the relative size of two numbers. The cohort survival ratio
- 26 -

method models and calculates the flow of a cohort or age group of pupils through the system from one grade to the next over a number of years.
The ratios are influenced by several variables--census data, birth rates, student entrances, exits and transfers, non-public school enrollment patterns, frequency of promotions or retentions, drop-out rates, the proportion of the city school-age population, housing patterns, the number of building permits issued, and other urban trends. Because these variables change from year to year and from school to school, an average ratio of three to five years is used to project for the future. The more stable the community or the individual school neighborhood, the easier and more reliable the projections.
The advantages of this type of model are: (1) it captures the multiple forces which affect population changes (move-ins, move-outs, transfers between schools); and (2) it distinguishes changes in each age group rather than looking at a composite of all changes.
A limited number of school systems have prepared enrollment forecasts using other procedures. For example, regression analysis utilizing the same predictors - births and past tendencies of school children to advance from one grade to the next - can be employed. Other methods include: Growth technique (establishes a district level enrollment curve based on ratios, migration, retention, drop-outs, private school enrollment, etc.); historical comparison of dwellings to enrollment used to base projections; method of analogy (analysis of national trends or local growth influence on district enrollment); and the multiple factor method (study of social and economic factors’ influence on enrollment).
5. What procedure historically has been utilized in Newton?
The cohort survival ratio method for system-wide projections with adjustments, if appropriate, at the school level has been used for many years. In the past, a combination of three-year and five-year average ratios has been used. This report includes five-year ratios for grades 1 through 12 in order to provide a consistent timeframe for the model across all schools and to take advantage of a full five years of growth. A four-year adjusted average of previous kindergarten classroom populations is used for next year’s kindergarten projection. Within the past for kindergarten projections, Newton has used city census data for the number of children aged 3 or 4 years as compared to the kindergarten population two years hence. This year’s city census data was too low to formulate a reasonable kindergarten projection.
6. How accurate are projections?
The quality of the data obviously influences the accuracy of the projections. Cohort survival relies on data that is usually readily available and reasonably reliable - census data on births and past enrollments.
"Goodness of fit," a measure of the percentage of error, is determined by dividing the actual enrollment figure by the projected enrollment figure for each level. The errors are the magnitude of the percentage difference between projected and actual enrollments. A small percentage of error is preferred. Research literature indicates that total school district enrollment may be projected with an accuracy of plus or minus 1%, yet an individual school's error rate might exceed 10%. Past system-wide error rates in Newton have been
- 27 -

low, at around +/-1%, while grade level and school based projections have been significantly higher. Tables 12, 13 and 14 show the accuracy of projections at the system level and also school by school and grade by grade.
In summary, short-term projections are generally more accurate than long-term projections. Projections for districts with larger enrollments are more accurate than those for smaller dis-tricts. System-wide projections are more accurate than individual school projections. Error is especially important to consider when reviewing the data beyond five years in the future. These projections, at best, provide only the direction or trend enrollments will take into the 2020’s. This is because beyond the fourth year of the projection, elementary enrollments must be based on predicted births in a calendar year that is not yet complete, and for which data has not yet been 100% collected. Secondary level enrollments can be projected beyond that point with a greater assurance of reliability.
- 28 -


III. ENROLLMENT HISTORY
Grade-by-Grade Analysis
A Comparison to Peak Enrollment Years


III. ENROLLMENT HISTORY
This section of the report looks at historical enrollment patterns in two ways. The first is on a grade-by-grade basis, tracking the in- and out-migration of students as each kindergarten class moves through the system. The second provides a look at current enrollment as compared with peak enrollment years.
Grade-by-Grade Analysis
Table 15 shows the changes in size of each grade from 2015-16 to 2016-17. Most migrations were positive, the largest of which was 66 students from kindergarten to grade 1. The net in-migration from grade 8 to grade 9 was also robust, with cohort growth of 49 students. There were negative migrations in middle school, namely grade 5 to grade 6 (-24 students), and in high school, from grade 11 to grade 12 (-12 students).
Table 16 shows Newton's historical cohort survival ratios by grade from 1991-92 through 2016-17. This table shows the net in- and out-migration patterns for each grade level. Ratios greater than one indicate growth and ratios less than one indicate a decrease in the trend. Over the years, each cohort moving from K-1 has a survival ratio greater than one, indicating net in-migration. In the past two years, the ratio from grade K-1 has been robust, at 1.07 and 1.08, underscoring the recent trend of families to move into Newton earlier on in elementary school. The grade 1-2 at 1.04 is at its highest this year since 2010-11. Other elementary school ratios (grades 2-3, 3-4, and 4-5) are between 1.00 and 1.01, indicating net enrollment stability. An average of the ratios from these four elementary grades is 1.01 this year; the peak average has been 1.02 during the course of enrollment growth trend that began in 2004.
This year’s ratio of 0.98 from grade 5-6 is considered typical; in past years and in this year, the transition from elementary school to middle school has been marked by net out-migration between grades 5 to 6 as some students leave to enroll in private schools. Conversely, the transition from grade 8 to high school has historically shown a net in-migration as students enter the public school during this transition year. This year’s ratio from grade 8 to grade 9 is 1.05 and compares to last year’s ratio of 1.03 but is lower than the four peak years between 2010 and 2013 where the grade 8 to 9 ratio was 1.07 or 1.08.
A Comparison to Peak Enrollment Years
Current South High School enrollment of 1,851 students is at an historic peak. Total 2016-17 enrollment of 12,657 is 69% of the 1967 peak enrollment of 18,424. At the beginning of the current growth trend in 2004, the district’s enrollment of 11,268 students was 61% of the 1967 peak year.
Peak Enrollment Year Number of K -12 Schools K-12 18,424 1967 23 Elementary, 5 Jr. Highs, 2 Sr. Highs K-6 9,887 1960 25 Elementary, 5 Jr. Highs, 2 Sr. Highs, 1 Technical High School North High 2,976 1972 23 Elementary, 5 Jr. Highs, 2 Sr. Highs South High 1,851 2016 15 Elementary, 4 Middle Schools, 2 Sr. Highs
- 29 -

TABLE 15ENROLLMENTS BY GRADE
2015 and 2016
October 1 EnrollmentChanges in Enrollment 2015-2016 to 2016-2017
Grade 2015Net
Migration 2016 N %
K 877 885 +8 +0.9%+66
1 1,005 943 -62 -6.2%+37
2 992 1,042 +50 +5.0%+13
3 977 1,005 +28 +2.9%-1
4 949 976 +27 +2.8%+1
5 985 950 -35 -3.6%-24
TOTAL ELEMENTARY SCHOOLS 5,785 5,801 +16 +0.3%
6 963 961 -2 -0.2%+9
7 912 972 +60 +6.6%+15
8 943 927 -16 -1.7%+49
9 945 992 +47 +5.0%+31
10 973 976 +3 +0.3%+34
11 937 1,007 +70 +7.5%-12
12 946 925 -21 -2.2%
Special Education/Ungraded* 104 96 -8 -7.7%
TOTAL SECONDARY SCHOOLS 6,723 6,856 +133 +2.0%GRAND TOTAL 12,508 12,657 +149 +1.2%
* Includes students who receive special education services outside the regular classroom for a significant amount of time (students in K-8 are reported with their grades).* Includes students who receive special education services beyond grade twelve.
- 30 -

Sch
oo
l Y
ear
K-1
1-2
2-3
3-4
4-5
5-6
6-7
7-8
8-9
9-10
10-1
111
-12
91-9
21.
04
1.
00
1.
00
0.
99
0.
99
1.
01
0.
97
1.
02
1.
05
1.
04
1.
00
1.
00
92
-93
1.05
1.00
1.01
1.00
0.99
1.00
0.96
1.02
1.02
1.04
0.99
1.02
93-9
41.
05
1.
02
1.
03
0.
99
0.
97
0.
99
0.
96
1.
02
1.
04
1.
03
1.
03
0.
99
94
-95
1.04
1.00
1.00
1.00
0.99
1.01
1.01
1.02
1.06
0.96
0.93
0.95
95-9
61.
03
0.
97
0.
97
0.
99
0.
98
0.
98
0.
97
1.
00
1.
02
0.
99
1.
00
1.
02
96
-97
1.04
0.98
1.01
0.99
0.98
0.98
1.00
1.02
0.99
0.99
0.99
0.98
97-9
81.
02
1.
00
0.
99
1.
00
0.
99
0.
98
1.
00
1.
01
1.
05
1.
00
0.
99
0.
99
98
-99
1.05
1.01
1.00
1.00
1.02
0.97
1.00
1.03
1.05
1.02
1.02
1.01
99-0
01.
03
1.
02
1.
00
1.
01
1.
01
0.
97
1.
00
1.
01
1.
06
1.
01
0.
96
1.
01
00
-01
1.02
0.99
1.03
1.00
1.01
0.98
1.02
1.01
1.03
0.97
0.99
1.01
01-0
21.
02
1.
01
0.
99
1.
01
1.
02
0.
96
1.
01
0.
99
1.
02
1.
00
0.
99
1.
00
02
-03
1.05
1.06
1.00
1.01
1.00
1.00
1.02
1.00
1.00
1.00
1.02
0.97
03-0
41.
06
1.
03
1.
03
1.
00
0.
97
1.
00
0.
98
0.
99
1.
02
1.
01
1.
00
1.
00
04
-05
1.08
1.00
1.00
1.00
0.99
1.00
0.99
1.00
1.03
1.00
0.99
1.00
05-0
61.
06
1.
01
1.
03
1.
02
1.
00
0.
99
1.
01
1.
00
1.
02
1.
02
1.
00
0.
99
06
-07
1.06
1.05
1.03
1.00
1.00
1.00
1.01
1.00
1.01
0.99
1.02
0.98
07-0
81.
04
1.
04
1.
00
1.
00
1.
00
0.
97
1.
00
0.
98
1.
05
1.
01
1.
02
0.
99
08
-09
1.09
1.00
1.01
1.02
1.01
0.97
1.01
0.98
1.03
0.99
0.99
0.99
09-1
01.
06
1.
04
1.
01
1.
01
0.
97
0.
97
1.
00
1.
01
1.
03
1.
03
0.
99
0.
97
10
-11
1.07
1.04
1.02
1.00
0.99
0.98
0.98
0.99
1.07
1.02
1.00
1.02
11-1
21.
05
1.
03
1.
02
1.
01
1.
01
0.
96
1.
01
1.
00
1.
07
0.
99
0.
99
0.
98
12
-13
1.05
1.03
1.03
1.02
1.00
0.96
1.00
1.02
1.08
1.01
1.00
1.00
13-1
41.
05
1.
01
1.
02
1.
01
1.
01
0.
96
1.
04
1.
02
1.
07
1.
01
1.
00
1.
01
14
-15
1.04
1.00
1.00
1.00
1.00
0.98
0.98
0.99
1.04
0.99
1.02
1.00
15-1
61.
07
0.
99
1.
00
1.
00
1.
01
0.
97
0.
99
0.
98
1.
03
1.
00
1.
00
0.
98
16
-17
1.08
1.04
1.01
1.00
1.00
0.98
1.01
1.02
1.05
1.03
1.03
0.99
TA
BL
E 1
6H
IST
OR
ICA
L C
OH
OR
T S
UR
VIV
AL
RA
TIO
S B
Y G
RA
DE
- 31 -
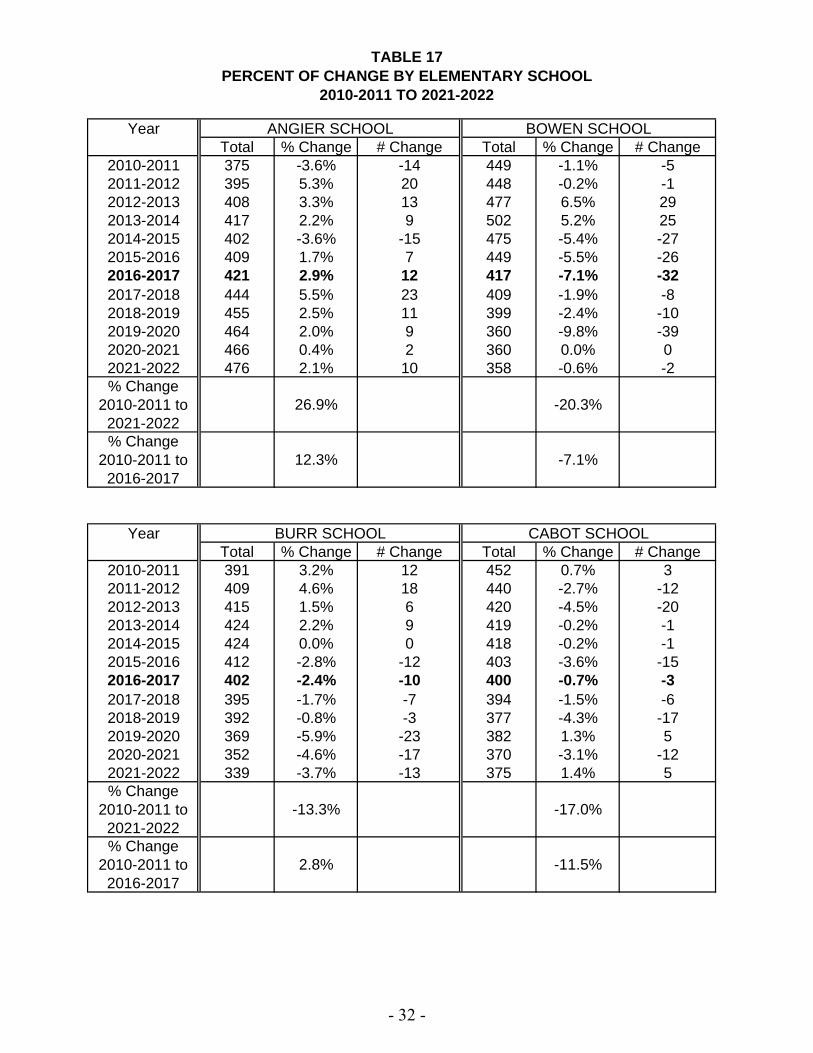
TABLE 17 PERCENT OF CHANGE BY ELEMENTARY SCHOOL
2010-2011 TO 2021-2022
Year ANGIER SCHOOL BOWEN SCHOOLTotal % Change # Change Total % Change # Change
2010-2011 375 -3.6% -14 449 -1.1% -52011-2012 395 5.3% 20 448 -0.2% -12012-2013 408 3.3% 13 477 6.5% 292013-2014 417 2.2% 9 502 5.2% 252014-2015 402 -3.6% -15 475 -5.4% -272015-2016 409 1.7% 7 449 -5.5% -262016-2017 421 2.9% 12 417 -7.1% -322017-2018 444 5.5% 23 409 -1.9% -82018-2019 455 2.5% 11 399 -2.4% -102019-2020 464 2.0% 9 360 -9.8% -392020-2021 466 0.4% 2 360 0.0% 02021-2022 476 2.1% 10 358 -0.6% -2% Change
2010-2011 to 2021-2022
26.9% -20.3%
% Change 2010-2011 to
2016-201712.3% -7.1%
Year BURR SCHOOL CABOT SCHOOLTotal % Change # Change Total % Change # Change
2010-2011 391 3.2% 12 452 0.7% 32011-2012 409 4.6% 18 440 -2.7% -122012-2013 415 1.5% 6 420 -4.5% -202013-2014 424 2.2% 9 419 -0.2% -12014-2015 424 0.0% 0 418 -0.2% -12015-2016 412 -2.8% -12 403 -3.6% -152016-2017 402 -2.4% -10 400 -0.7% -32017-2018 395 -1.7% -7 394 -1.5% -62018-2019 392 -0.8% -3 377 -4.3% -172019-2020 369 -5.9% -23 382 1.3% 52020-2021 352 -4.6% -17 370 -3.1% -122021-2022 339 -3.7% -13 375 1.4% 5% Change
2010-2011 to 2021-2022
-13.3% -17.0%
% Change 2010-2011 to
2016-20172.8% -11.5%
- 32 -

TABLE 17 PERCENT OF CHANGE BY ELEMENTARY SCHOOL
2010-2011 TO 2021-2022
Year COUNTRYSIDE SCHOOL FRANKLIN SCHOOLTotal % Change # Change Total % Change # Change
2010-2011 499 5.7% 27 397 -1.2% -52011-2012 490 -1.8% -9 401 1.0% 42012-2013 479 -2.2% -11 396 -1.2% -52013-2014 457 -4.6% -22 389 -1.8% -72014-2015 466 2.0% 9 413 6.2% 242015-2016 450 -3.4% -16 424 2.7% 112016-2017 436 -3.1% -14 446 5.2% 222017-2018 432 -0.9% -4 455 2.0% 92018-2019 430 -0.5% -2 467 2.6% 122019-2020 434 0.9% 4 469 0.4% 22020-2021 420 -3.2% -14 457 -2.6% -122021-2022 413 -1.7% -7 469 2.6% 12% Change
2010-2011 to 2021-2022
-17.2% 18.1%
% Change 2010-2011 to
2016-2017-12.6% 12.3%
Year HORACE MANN SCHOOL LINCOLN-ELIOT SCHOOLTotal % Change # Change Total % Change # Change
2010-2011 373 0.5% 2 293 0.7% 22011-2012 386 3.5% 13 317 8.2% 242012-2013 394 2.1% 8 322 1.6% 52013-2014 427 8.4% 33 329 2.2% 72014-2015 434 1.6% 7 337 2.4% 82015-2016 412 -5.1% -22 340 0.9% 32016-2017 417 1.2% 5 346 1.8% 62017-2018 399 -4.3% -18 347 0.3% 12018-2019 396 -0.8% -3 355 2.3% 82019-2020 392 -1.0% -4 349 -1.7% -62020-2021 395 0.8% 3 352 0.9% 32021-2022 393 -0.5% -2 354 0.6% 2% Change
2010-2011 to 2021-2022
5.4% 20.8%
% Change 2010-2011 to
2016-201711.8% 18.1%
- 33 -

TABLE 17 PERCENT OF CHANGE BY ELEMENTARY SCHOOL
2010-2011 TO 2021-2022
Year MASON-RICE SCHOOL MEMORIAL-SPAULDING SCHOOLTotal % Change # Change Total % Change # Change
2010-2011 442 3.3% 14 459 4.8% 212011-2012 437 -1.1% -5 458 -0.2% -12012-2013 438 0.2% 1 464 1.3% 62013-2014 457 4.3% 19 429 -7.5% -352014-2015 478 4.6% 21 434 1.2% 52015-2016 492 2.9% 14 452 4.1% 182016-2017 507 3.0% 15 454 0.4% 22017-2018 516 1.8% 9 472 4.0% 182018-2019 504 -2.3% -12 486 3.0% 142019-2020 487 -3.4% -17 491 1.0% 52020-2021 458 -6.0% -29 488 -0.6% -32021-2022 443 -3.3% -15 489 0.2% 1% Change
2010-2011 to 2021-2022
0.2% 6.5%
% Change 2010-2011 to
2016-201714.7% -1.1%
Year PEIRCE SCHOOL UNDERWOOD SCHOOLTotal % Change # Change Total % Change # Change
2010-2011 318 -3.3% -11 282 7.6% 202011-2012 316 -0.6% -2 289 2.5% 72012-2013 337 6.6% 21 310 7.3% 212013-2014 312 -7.4% -25 327 5.5% 172014-2015 306 -1.9% -6 341 4.3% 142015-2016 314 2.6% 8 326 -4.4% -152016-2017 299 -4.8% -15 313 -4.0% -132017-2018 285 -4.7% -14 316 1.0% 32018-2019 280 -1.8% -5 319 0.9% 32019-2020 281 0.4% 1 323 1.3% 42020-2021 265 -5.7% -16 307 -5.0% -162021-2022 269 1.5% 4 315 2.6% 8% Change
2010-2011 to 2021-2022
-15.4% 11.7%
% Change 2010-2011 to
2016-2017-6.0% 11.0%
- 34 -

TABLE 17 PERCENT OF CHANGE BY ELEMENTARY SCHOOL
2010-2011 TO 2021-2022
Year WARD SCHOOL WILLIAMS SCHOOLTotal % Change # Change Total % Change # Change
2010-2011 269 3.5% 9 298 7.6% 212011-2012 278 3.3% 9 302 1.3% 42012-2013 301 8.3% 23 304 0.7% 22013-2014 289 -4.0% -12 304 0.0% 02014-2015 304 5.2% 15 292 -3.9% -122015-2016 304 0.0% 0 290 -0.7% -22016-2017 313 3.0% 9 293 1.0% 32017-2018 311 -0.6% -2 299 2.0% 62018-2019 306 -1.6% -5 290 -3.0% -92019-2020 302 -1.3% -4 297 2.4% 72020-2021 297 -1.7% -5 301 1.3% 42021-2022 304 2.4% 7 287 -4.7% -14% Change
2010-2011 to 2021-2022
13.0% -3.7%
% Change 2010-2011 to
2016-201716.4% -1.7%
Year ZERVAS SCHOOL TOTAL ELEMENTARY K-5Total % Change # Change Total % Change # Change
2010-2011 349 7.1% 23 5,646 2.2% 1192011-2012 321 -8.0% -28 5,687 0.7% 412012-2013 325 1.2% 4 5,790 1.8% 1032013-2014 317 -2.5% -8 5,799 0.2% 92014-2015 309 -2.5% -8 5,833 0.6% 342015-2016 308 -0.3% -1 5,785 -0.8% -482016-2017 337 9.4% 29 5,801 0.3% 162017-2018 371 10.1% 34 5,845 0.8% 442018-2019 397 7.0% 26 5,853 0.1% 82019-2020 422 6.3% 25 5,822 -0.5% -312020-2021 450 6.6% 28 5,738 -1.4% -842021-2022 478 6.2% 28 5,762 0.4% 24% Change
2010-2011 to 2021-2022
37.0% 2.1%
% Change 2010-2011 to
2016-2017-3.4% 2.7%
- 35 -

Year BIGELOW MIDDLE SCHOOL BROWN MIDDLE SCHOOL DAY MIDDLE SCHOOLTotal % Change # Change Total % Change # Change Total % Change # Change
2010-2011 523 -0.8% -4 666 -2.6% 11 758 -1.9% 872011-2012 533 1.9% 10 677 1.7% 11 845 11.5% 872012-2013 531 -0.4% -2 698 3.1% 21 874 3.4% 292013-2014 525 -1.1% -6 743 6.4% 45 947 8.4% 732014-2015 504 -4.0% -21 738 -0.7% -5 932 -1.6% -152015-2016 509 1.0% 5 780 5.7% 42 927 -0.5% -52016-2017 525 3.1% 16 774 -0.8% -6 922 -0.5% -52017-2018 536 2.1% 11 744 -3.9% -30 985 6.8% 632018-2019 531 -0.9% -5 724 -2.7% -20 988 0.3% 32019-2020 538 1.3% 7 732 1.1% 8 1012 2.4% 242020-2021 564 4.8% 26 802 9.6% 70 1026 1.4% 142021-2022 553 -2.0% -11 822 2.5% 20 1012 -1.4% -14% Change
2010-2011 to 2021-2022
5.7% 23.4% 33.5%
% Change 2010-2011 to
2016-20170.4% 16.2% 21.6%
Year OAK HILL MIDDLE SCHOOL TOTAL MIDDLE SCHOOLTotal % Change # Change Total % Change # Change
2010-2011 603 5.4% 31 2550 5.1% 1252011-2012 612 1.5% 9 2667 4.6% 1172012-2013 616 0.7% 4 2719 1.9% 522013-2014 634 2.9% 18 2849 4.8% 1302014-2015 632 -0.3% -2 2806 -1.5% -432015-2016 602 -4.7% -30 2818 0.4% 122016-2017 639 6.1% 37 2860 1.5% 422017-2018 607 -5.0% -32 2872 0.4% 122018-2019 612 0.8% 5 2855 -0.6% -172019-2020 606 -1.0% -6 2888 1.2% 332020-2021 622 2.6% 16 3014 4.4% 1262021-2022 628 1.0% 6 3015 0.0% 1% Change 2010-2011
to 2021-2022
4.1% 18.2%
% Change 2010-2011
to 2016-2017
6.0% 12.2%
TABLE 18PERCENT OF CHANGE BY MIDDLE SCHOOL
2010-2011 TO 2021-2022
- 36 -

Year NORTH HIGH SCHOOL SOUTH HIGH SCHOOL TOTAL HIGH SCHOOLTotal % Change # Change Total % Change # Change Total % Change # Change
2010-2011 1,871 3.8% 69 1,708 -0.8% -14 3,579 1.5% 552011-2012 1,877 0.3% 6 1,691 -1.0% -17 3,568 -0.3% -112012-2013 1,940 3.4% 63 1,721 1.8% 30 3,661 2.6% 932013-2014 2,015 3.9% 75 1,778 3.3% 57 3,793 3.6% 1322014-2015 2,060 2.2% 45 1,804 1.5% 26 3,864 1.9% 712015-2016 2,107 2.3% 47 1,798 -0.3% -6 3,905 1.1% 412016-2017 2,145 1.8% 38 1,851 2.9% 53 3,996 2.3% 912017-2018 2,163 0.8% 18 1,907 3.0% 56 4,070 1.9% 742018-2019 2,154 -0.4% -9 1,962 2.9% 55 4,116 1.1% 462019-2020 2,154 0.0% 0 2,019 2.9% 57 4,173 1.4% 572020-2021 2,198 2.0% 44 1,968 -2.5% -51 4,166 -0.2% -72021-2022 2,258 2.7% 60 1,942 -1.3% -26 4,200 0.8% 34% Change
2010-2011 to 2021-2022
20.7% 13.7% 17.4%
% Change 2010-2011 to 2016-2017
14.6% 8.4% 11.7%
TABLE 19PERCENT OF CHANGE BY HIGH SCHOOL
2010-2011 TO 2021-2022
- 37 -


IV. INDIVIDUAL SCHOOL REPORTS


IV. INDIVIDUAL SCHOOL REPORTS The individual school reports contain the following information: Elementary Schools
1. Enrollments by grade for last year (2015-16) and this year (2016-17) and the change in enrollment at each grade level. Enrollment projections by grade for the next five years (2017-18 to 2021-22) are also reported based on a 5-year cohort survival ratio average for grades 1 through 5 and an adjusted straight 4-year average for kindergarten.
2. Ten years of kindergarten and total school enrollments.
3. Distribution of the ages of incoming kindergarten students since 2009.
4. The number of children younger than age five living in each district.
5. A line graph depicting enrollment history over time and projections (5 years).
Middle Schools
1. Enrollments by grade for last year (2015-16) and this year (2016-17) and the change in enrollment at each grade level. Enrollment projections by grade for the next five years (2017-18 to 2021-22) are also presented based on a 5-year cohort survival ratio average.
2. Ten years of enrollment change.
3. Number of 5th grade students from feeder elementary schools who will enter the 6th grade next year (2017-18).
4. A line graph depicting enrollment history over time and projections (5 years).
High Schools
1. Enrollments by grade for last year (2015-16) and this year (2016-17) and the change in enrollment at each grade level. Enrollment projections by grade for the next five years (2017-18 to 2021-22) are also presented based on a 5-year cohort survival ratio average.
2. Ten years enrollment change.
3. Number of 8th grade students from feeder middle schools who will enter the 9th grade next year (2017-18).
4. A line graph depicting enrollment history over time and projections (5 years).
- 38 -

Angier
ACTUAL AND PROJECTED ENROLLMENTS BY GRADE
OctoberEnrollment Difference Projections Using 5-year Average Ratios***
2015 2016 N % 2017 2018 2019 2020 2021Grade FY16 FY17 FY18 FY19 FY20 FY21 FY22
K 62 78 16 25.8% 72 72 73 75 72
1 74 66 -8 -10.8% 83 76 77 78 79
2 70 79 9 12.9% 67 85 77 78 79
3 70 71 1 1.4% 81 69 87 79 80
4 59 70 11 18.6% 72 82 70 88 80
5 74 57 -17 -23.0% 69 71 80 68 86
Spec. Ed.** 0 0 0 0.0% 0 0 0 0 0
TOTAL 409 421* 12 2.9% 444 455 464 466 476*Includes 11 METCO students.**Students who receive special education services outside of the classroom for a significant amount of time (students in K-8 are reported with their grades).***Projections include new METCO students for each year.
TEN YEARS OF TOTAL SCHOOL ENROLLMENTS
Enrollment Change from % Change fromYear K Total Previous Year Previous Year2007 67 4012008 47 392 -9 -2.2%2009 48 389 -3 -0.8%2010 57 375 -14 -3.6%2011 62 395 20 5.3%2012 69 408 13 3.3%2013 67 417 9 2.2%2014 65 402 -15 -3.6%2015 62 409 7 1.7%2016 78 421 12 2.9%
Peak enrollment year: 2016, 421 students
- 39 -

Angier
DISTRIBUTION OF THE AGES OF INCOMING KINDERGARTEN STUDENTS
Age 5 Age 6Year # % # % Total2009 43 89.6% 5 10.4% 482010 56 98.2% 1 1.8% 572011 57 91.9% 5 8.1% 622012 67 97.1% 2 2.9% 692013 63 94.0% 4 6.0% 672014 61 93.8% 4 6.2% 652015 58 93.5% 4 6.5% 622016 74 94.9% 4 5.1% 78
NUMBER OF CHILDREN YOUNGER THAN AGE FIVE
Age Number Year Entering K1 25 2020-20212 32 2019-20203 37 2018-20194 41 2017-2018
(as of January 1, 2016 City Census)
100
200
300
400
500
600
Enrollment History and Projections
- 40 -

Bowen
ACTUAL AND PROJECTED ENROLLMENTS BY GRADE
OctoberEnrollment Difference Projections Using 5-year Average Ratios***
2015 2016 N % 2017 2018 2019 2020 2021Grade FY16 FY17 FY18 FY19 FY20 FY21 FY22
K 59 60 1 1.7% 62 56 55 56 56
1 67 61 -6 -9.0% 64 66 59 59 60
2 99 60 -39 -39.4% 61 64 66 59 59
3 71 95 24 33.8% 59 59 63 64 57
4 71 68 -3 -4.2% 93 58 58 62 63
5 82 73 -9 -11.0% 70 96 59 60 63
Spec. Ed.** 0 0 0 0.0% 0 0 0 0 0
TOTAL 449 417* -32 -7.1% 409 399 360 360 358*Includes 18 METCO students.**Students who receive special education services outside of the classroom for a significant amount of time (students in K-8 are reported with their grades).***Projections include new METCO students for each year.
TEN YEARS OF TOTAL SCHOOL ENROLLMENTS
Enrollment Change from % Change fromYear K Total Previous Year Previous Year2007 77 4282008 59 435 7 1.6%2009 69 454 19 4.4%2010 70 449 -5 -1.1%2011 67 448 -1 -0.2%2012 79 477 29 6.5%2013 95 502 25 5.2%2014 65 475 -27 -5.4%2015 59 449 -26 -5.5%2016 60 417 -32 -7.1%
Peak enrollment year: 2013, 502 students
- 41 -

Bowen
DISTRIBUTION OF THE AGES OF INCOMING KINDERGARTEN STUDENTS
Age 5 Age 6Year # % # % Total2009 61 88.4% 8 11.6% 692010 68 97.1% 2 2.9% 702011 63 94.0% 4 6.0% 672012 74 93.7% 5 6.3% 792013 93 97.9% 2 2.1% 952014 61 93.8% 4 6.2% 652015 55 93.2% 4 6.8% 592016 58 96.7% 2 3.3% 60
*Age 6 for 2008-09 school year includes one 7-year old.
NUMBER OF CHILDREN YOUNGER THAN AGE FIVE
Age Number Year Entering K1 23 2020-20212 25 2019-20203 31 2018-20194 37 2017-2018
(as of January 1, 2016 City Census)
100
200
300
400
500
600
Enrollment History and Projections
- 42 -

Burr
ACTUAL AND PROJECTED ENROLLMENTS BY GRADE
OctoberEnrollment Difference Projections Using 5-year Average Ratios***
2015 2016 N % 2017 2018 2019 2020 2021Grade FY16 FY17 FY18 FY19 FY20 FY21 FY22
K 63 48 -15 -23.8% 59 56 54 53 55
1 70 68 -2 -2.9% 50 61 58 57 55
2 80 74 -6 -7.5% 69 51 62 59 57
3 62 80 18 29.0% 74 69 51 62 59
4 68 62 -6 -8.8% 80 74 69 51 62
5 69 70 1 1.4% 63 81 75 70 51
Spec. Ed.** 0 0 0 0.0% 0 0 0 0 0
TOTAL 412 402* -10 -2.4% 395 392 369 352 339*Includes 5 METCO students.**Students who receive special education services outside of the classroom for a significant amount of time (students in K-8 are reported with their grades).***Projections include new METCO students for each year.
TEN YEARS OF TOTAL SCHOOL ENROLLMENTS
Enrollment Change from % Change fromYear K Total Previous Year Previous Year2007 54 3312008 68 369 38 11.5%2009 69 379 10 2.7%2010 65 391 12 3.2%2011 68 409 18 4.6%2012 65 415 6 1.5%2013 80 424 9 2.2%2014 70 424 0 0.0%2015 63 412 -12 -2.8%2016 48 402 -10 -2.4%
Peak enrollment year: 2013, 424 students
- 43 -

Burr
DISTRIBUTION OF THE AGES OF INCOMING KINDERGARTEN STUDENTS
Age 5 Age 6Year # % # % Total2009 60 87.0% 9 13.0% 692010 60 92.3% 5 7.7% 652011 64 94.1% 4 5.9% 682012 62 95.4% 3 4.6% 652013 78 97.5% 2 2.5% 802014 67 95.7% 3 4.3% 702015 62 98.4% 1 1.6% 632016 46 95.8% 2 4.2% 48
*Age 6 for the 2007-08 and 2008-09 school years include one 7-year old.
NUMBER OF CHILDREN YOUNGER THAN AGE FIVE
Age Number Year Entering K1 18 2020-20212 28 2019-20203 23 2018-20194 30 2017-2018
(as of January 1, 2016 City Census)
100
200
300
400
500
600
Enrollment History and Projections
- 44 -

Cabot
ACTUAL AND PROJECTED ENROLLMENTS BY GRADE
OctoberEnrollment Difference Projections Using 5-year Average Ratios***
2015 2016 N % 2017 2018 2019 2020 2021Grade FY16 FY17 FY18 FY19 FY20 FY21 FY22
K 52 52 0 0.0% 54 54 56 56 57
1 69 56 -13 -18.8% 57 58 63 63 61
2 62 76 14 22.6% 59 58 63 65 65
3 76 69 -7 -9.2% 79 60 61 64 66
4 66 76 10 15.2% 68 78 60 62 63
5 78 71 -7 -9.0% 77 69 79 60 63
Spec. Ed.** 0 0 0 0.0% 0 0 0 0 0
TOTAL 403 400* -3 -0.7% 394 377 382 370 375*Includes 14 METCO students.**Students who receive special education services outside of the classroom for a significant amount of time (students in K-8 are reported with their grades).***Projections include new METCO students for each year.
TEN YEARS OF TOTAL SCHOOL ENROLLMENTS
Enrollment Change from % Change fromYear K Total Previous Year Previous Year2007 60 4242008 63 425 1 0.2%2009 69 449 24 5.6%2010 72 452 3 0.7%2011 63 440 -12 -2.7%2012 73 420 -20 -4.5%2013 54 419 -1 -0.2%2014 61 418 -1 -0.2%2015 52 403 -15 -3.6%2016 52 400 -3 -0.7%
Peak enrollment year: 2010, 452 students
- 45 -

Cabot
DISTRIBUTION OF THE AGES OF INCOMING KINDERGARTEN STUDENTS
Age 5 Age 6Year # % # % Total2009 64 92.8% 5 7.2% 692010 71 98.6% 1 1.4% 722011 60 95.2% 3 4.8% 632012 68 93.2% 5 6.8% 732013 51 94.4% 3 5.6% 542014 58 95.1% 3 4.9% 612015 51 98.1% 1 1.9% 522016 47 90.4% 5 9.6% 52
NUMBER OF CHILDREN YOUNGER THAN AGE FIVE
Age Number Year Entering K1 30 2020-20212 34 2019-20203 39 2018-20194 36 2017-2018
(as of January 1, 2016 City Census)
100
200
300
400
500
600
Enrollment History and Projections
- 46 -

Countryside
ACTUAL AND PROJECTED ENROLLMENTS BY GRADE
OctoberEnrollment Difference Projections Using 5-year Average Ratios***
2015 2016 N % 2017 2018 2019 2020 2021Grade FY16 FY17 FY18 FY19 FY20 FY21 FY22
K 70 63 -7 -10.0% 64 66 65 65 65
1 75 77 2 2.7% 66 66 68 69 69
2 63 81 18 28.6% 77 66 66 68 69
3 76 66 -10 -13.2% 84 79 69 68 71
4 76 73 -3 -3.9% 67 85 80 69 69
5 90 76 -14 -15.6% 74 68 86 81 70
Spec. Ed.** 0 0 0 0.0% 0 0 0 0 0
TOTAL 450 436* -14 -3.1% 432 430 434 420 413*Includes 10 METCO students.**Students who receive special education services outside of the classroom for a significant amount of time (students in K-8 are reported with their grades).***Projections include new METCO students for each year.
TEN YEARS OF TOTAL SCHOOL ENROLLMENTS
Enrollment Change from % Change fromYear K Total Previous Year Previous Year2007 82 4472008 85 479 32 7.2%2009 85 472 -7 -1.5%2010 86 499 27 5.7%2011 62 490 -9 -1.8%2012 69 479 -11 -2.2%2013 64 457 -22 -4.6%2014 72 466 9 2.0%2015 70 450 -16 -3.4%2016 63 436 -14 -3.1%
Peak enrollment year: 2010, 499 students
- 47 -

Countryside
DISTRIBUTION OF THE AGES OF INCOMING KINDERGARTEN STUDENTS
Age 5 Age 6Year # % # % Total2009 74 87.1% 11 12.9% 852010 83 96.5% 3 3.5% 862011 59 95.2% 3 4.8% 622012 66 95.7% 3 4.3% 692013 64 100.0% 0 0.0% 642014 72 100.0% 0 0.0% 722015 69 98.6% 1 1.4% 702016 63 100.0% 0 0.0% 63
NUMBER OF CHILDREN YOUNGER THAN AGE FIVE
Age Number Year Entering K1 10 2020-20212 22 2019-20203 27 2018-20194 28 2017-2018
(as of January 1, 2016 City Census)
100
200
300
400
500
600
Enrollment History and Projections
- 48 -

Franklin
ACTUAL AND PROJECTED ENROLLMENTS BY GRADE
OctoberEnrollment Difference Projections Using 5-year Average Ratios***
2015 2016 N % 2017 2018 2019 2020 2021Grade FY16 FY17 FY18 FY19 FY20 FY21 FY22
K 67 79 12 17.9% 75 75 74 76 76
1 87 67 -20 -23.0% 80 76 76 76 78
2 73 89 16 21.9% 67 80 76 76 76
3 71 77 6 8.5% 92 69 83 78 79
4 74 64 -10 -13.5% 75 90 68 81 77
5 52 70 18 34.6% 66 77 92 70 83
Spec. Ed.** 0 0 0 0 0 0 0 0
TOTAL 424 446* 22 5.2% 455 467 469 457 469*Includes 12 METCO students.**Students who receive special education services outside of the classroom for a significant amount of time (students in K-8 are reported with their grades).***Projections include new METCO students for each year.
TEN YEARS OF TOTAL SCHOOL ENROLLMENTS
Enrollment Change from % Change fromYear K Total Previous Year Previous Year2007 64 4012008 56 396 -5 -1.2%2009 67 402 6 1.5%2010 42 397 -5 -1.2%2011 72 401 4 1.0%2012 63 396 -5 -1.2%2013 78 389 -7 -1.8%2014 76 413 24 6.2%2015 67 424 11 2.7%2016 79 446 22 5.2%
Peak enrollment year: 2016, 446 students
- 49 -

Franklin
DISTRIBUTION OF THE AGES OF INCOMING KINDERGARTEN STUDENTS
Age 5 Age 6Year # % # % Total2009 63 94.0% 4 6.0% 672010 35 83.3% 7 16.7% 422011 71 98.6% 1 1.4% 722012 61 96.8% 2 3.2% 632013 77 98.7% 1 1.3% 782014 70 92.1% 6 7.9% 762015 64 95.5% 3 4.5% 672016 76 96.2% 3 3.8% 79
NUMBER OF CHILDREN YOUNGER THAN AGE FIVE
Age Number Year Entering K1 39 2020-20212 43 2019-20203 42 2018-20194 51 2017-2018
(as of January 1, 2016 City Census)
100
200
300
400
500
600
Enrollment History and Projections
- 50 -

Horace Mann
ACTUAL AND PROJECTED ENROLLMENTS BY GRADE
OctoberEnrollment Difference Projections Using 5-year Average Ratios***
2015 2016 N % 2017 2018 2019 2020 2021Grade FY16 FY17 FY18 FY19 FY20 FY21 FY22
K 57 62 5 8.8% 61 61 60 61 61
1 65 67 2 3.1% 66 65 65 65 65
2 68 62 -6 -8.8% 66 65 64 64 64
3 69 69 0 0.0% 64 67 67 66 65
4 84 71 -13 -15.5% 72 67 70 70 69
5 69 86 17 24.6% 70 71 66 69 69
Spec. Ed.** 0 0 0 0.0% 0 0 0 0 0
TOTAL 412 417* 5 1.2% 399 396 392 395 393*Includes 10 METCO students.**Students who receive special education services outside of the classroom for a significant amount of time (students in K-8 are reported with their grades).***Projections include new METCO students for each year.
TEN YEARS OF TOTAL SCHOOL ENROLLMENTS
Enrollment Change from % Change fromYear K Total Previous Year Previous Year2007 49 3482008 67 370 22 6.3%2009 57 371 1 0.3%2010 67 373 2 0.5%2011 80 386 13 3.5%2012 65 394 8 2.1%2013 67 427 33 8.4%2014 65 434 7 1.6%2015 57 412 -22 -5.1%2016 62 417 5 1.2%
Peak enrollment year: 2014, 434 students
- 51 -

Horace Mann
DISTRIBUTION OF THE AGES OF INCOMING KINDERGARTEN STUDENTS
Age 5 Age 6Year # % # % Total2009 53 93.0% 4 7.0% 572010 65 97.0% 2 3.0% 672011 78 97.5% 2 2.5% 802012 59 90.8% 6 9.2% 652013 66 98.5% 1 1.5% 672014 62 95.4% 3 4.6% 652015 53 93.0% 4 7.0% 572016 55 88.7% 7 11.3% 62
NUMBER OF CHILDREN YOUNGER THAN AGE FIVE
Age Number Year Entering K1 16 2020-20212 17 2019-20203 25 2018-20194 21 2017-2018
(as of January 1, 2016 City Census)
100
200
300
400
500
600
Enrollment History and Projections
- 52 -

Lincoln-Eliot
ACTUAL AND PROJECTED ENROLLMENTS BY GRADE
OctoberEnrollment Difference Projections Using 5-year Average Ratios***
2015 2016 N % 2017 2018 2019 2020 2021Grade FY16 FY17 FY18 FY19 FY20 FY21 FY22
K 58 62 4 6.9% 59 58 60 61 59
1 56 55 -1 -1.8% 60 58 57 59 59
2 63 57 -6 -9.5% 56 62 59 58 60
3 51 63 12 23.5% 54 54 59 56 55
4 52 51 -1 -1.9% 64 55 55 60 57
5 60 58 -2 -3.3% 54 68 59 58 64
Spec. Ed.** 0 0 0 0.0% 0 0 0 0 0
TOTAL 340 346* 6 1.8% 347 355 349 352 354*Includes 16 METCO students.**Students who receive special education services outside of the classroom for a significant amount of time (students in K-8 are reported with their grades).***Projections include new METCO students for each year.
TEN YEARS OF TOTAL SCHOOL ENROLLMENTS
Enrollment Change from % Change fromYear K Total Previous Year Previous Year2007 45 2932008 43 284 -9 -3.1%2009 49 291 7 2.5%2010 58 293 2 0.7%2011 55 317 24 8.2%2012 48 322 5 1.6%2013 63 329 7 2.2%2014 57 337 8 2.4%2015 58 340 3 0.9%2016 62 346 6 1.8%
Peak enrollment year: 2016, 346 students
- 53 -

Lincoln-Eliot
DISTRIBUTION OF THE AGES OF INCOMING KINDERGARTEN STUDENTS
Age 5 Age 6Year # % # % Total2009 43 87.8% 6 12.2% 492010 55 94.8% 3 5.2% 582011 53 96.4% 2 3.6% 552012 48 100.0% 0 0.0% 482013 63 100.0% 0 0.0% 632014 57 100.0% 0 0.0% 572015 58 100.0% 0 0.0% 582016 58 93.5% 4 6.5% 62
*Age 6 for the 2007-08 school year included one 7-year old.
NUMBER OF CHILDREN YOUNGER THAN AGE FIVE
Age Number Year Entering K1 17 2020-20212 35 2019-20203 35 2018-20194 41 2017-2018
(as of January 1, 2016 City Census)
100
200
300
400
500
600
Enrollment History and Projections
- 54 -

Mason-Rice
ACTUAL AND PROJECTED ENROLLMENTS BY GRADE
OctoberEnrollment Difference Projections Using 5-year Average Ratios***
2015 2016 N % 2017 2018 2019 2020 2021Grade FY16 FY17 FY18 FY19 FY20 FY21 FY22
K 81 67 -14 -17.3% 70 68 68 66 68
1 96 90 -6 -6.3% 72 76 73 73 72
2 91 99 8 8.8% 91 73 77 74 75
3 86 93 7 8.1% 99 92 74 77 74
4 66 90 24 36.4% 95 101 94 75 79
5 72 68 -4 -5.6% 89 94 101 93 75
Spec. Ed.** 0 0 0 0.0% 0 0 0 0 0
TOTAL 492 507* 15 3.0% 516 504 487 458 443*Includes 10 METCO students.**Students who receive special education services outside of the classroom for a significant amount of time (students in K-8 are reported with their grades).***Projections include new METCO students for each year.
TEN YEARS OF TOTAL SCHOOL ENROLLMENTS
Enrollment Change from % Change fromYear K Total Previous Year Previous Year2007 75 4102008 67 422 12 2.9%2009 72 428 6 1.4%2010 64 442 14 3.3%2011 64 437 -5 -1.1%2012 79 438 1 0.2%2013 88 457 19 4.3%2014 82 478 21 4.6%2015 81 492 14 2.9%2016 67 507 15 3.0%
Peak enrollment year: 2016, 507 students
- 55 -

Mason-Rice
DISTRIBUTION OF THE AGES OF INCOMING KINDERGARTEN STUDENTS
Age 5 Age 6Year # % # % Total2009 61 84.7% 11 15.3% 722010 62 96.9% 2 3.1% 642011 61 95.3% 3 4.7% 642012 69 87.3% 10 12.7% 792013 78 88.6% 10 11.4% 882014 73 89.0% 9 11.0% 822015 74 91.4% 7 8.6% 812016 63 94.0% 4 6.0% 67
NUMBER OF CHILDREN YOUNGER THAN AGE FIVE
Age Number Year Entering K1 23 2020-20212 21 2019-20203 29 2018-20194 32 2017-2018
(as of January 1, 2016 City Census)
100
200
300
400
500
600
Enrollment History and Projections
- 56 -

Memorial-Spaulding
ACTUAL AND PROJECTED ENROLLMENTS BY GRADE
OctoberEnrollment Difference Projections Using 5-year Average Ratios***
2015 2016 N % 2017 2018 2019 2020 2021Grade FY16 FY17 FY18 FY19 FY20 FY21 FY22
K 77 71 -6 -7.8% 74 77 74 76 77
1 81 84 3 3.7% 78 81 84 81 83
2 74 85 11 14.9% 86 80 81 85 83
3 68 74 6 8.8% 84 84 77 79 83
4 69 72 3 4.3% 77 86 87 79 82
5 83 68 -15 -18.1% 73 78 88 88 81
Spec. Ed.** 0 0 0 0.0% 0 0 0 0 0
TOTAL 452 454* 2 0.4% 472 486 491 488 489*Includes 12 METCO students.**Students who receive special education services outside of the classroom for a significant amount of time (students in K-8 are reported with their grades).***Projections include new METCO students for each year.
TEN YEARS OF TOTAL SCHOOL ENROLLMENTS
Enrollment Change from % Change fromYear K Total Previous Year Previous Year2007 58 4492008 62 442 -7 -1.6%2009 62 438 -4 -0.9%2010 74 459 21 4.8%2011 66 458 -1 -0.2%2012 69 464 6 1.3%2013 67 429 -35 -7.5%2014 79 434 5 1.2%2015 77 452 18 4.1%2016 71 454 2 0.4%
Peak enrollment year: 2012, 464 students
- 57 -
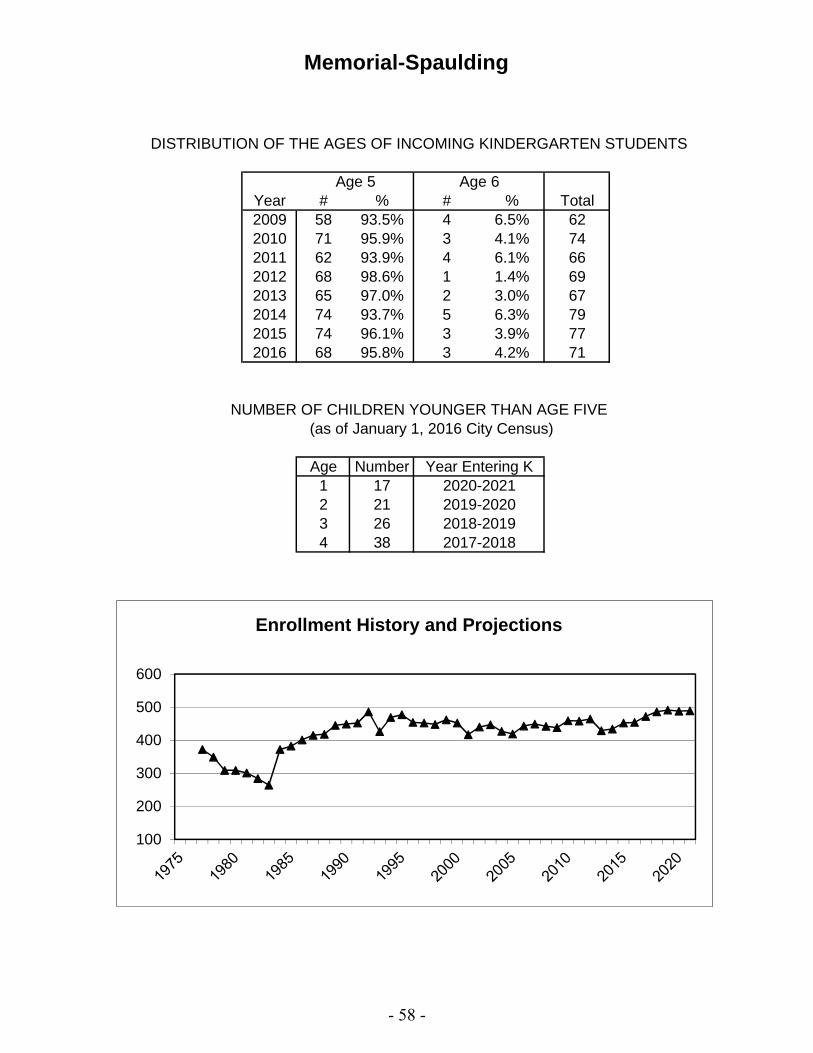
Memorial-Spaulding
DISTRIBUTION OF THE AGES OF INCOMING KINDERGARTEN STUDENTS
Age 5 Age 6Year # % # % Total2009 58 93.5% 4 6.5% 622010 71 95.9% 3 4.1% 742011 62 93.9% 4 6.1% 662012 68 98.6% 1 1.4% 692013 65 97.0% 2 3.0% 672014 74 93.7% 5 6.3% 792015 74 96.1% 3 3.9% 772016 68 95.8% 3 4.2% 71
NUMBER OF CHILDREN YOUNGER THAN AGE FIVE
Age Number Year Entering K1 17 2020-20212 21 2019-20203 26 2018-20194 38 2017-2018
(as of January 1, 2016 City Census)
100
200
300
400
500
600
Enrollment History and Projections
- 58 -

Peirce
ACTUAL AND PROJECTED ENROLLMENTS BY GRADE
OctoberEnrollment Difference Projections Using 5-year Average Ratios***
2015 2016 N % 2017 2018 2019 2020 2021Grade FY16 FY17 FY18 FY19 FY20 FY21 FY22
K 41 38 -3 -7.3% 43 42 41 41 42
1 56 42 -14 -25.0% 41 46 44 44 45
2 44 60 16 36.4% 42 41 46 44 44
3 50 44 -6 -12.0% 63 44 43 49 47
4 68 53 -15 -22.1% 45 64 45 44 49
5 55 62 7 12.7% 51 43 62 43 42
Spec. Ed.** 0 0 0 0.0% 0 0 0 0 0
TOTAL 314 299* -15 -4.8% 285 280 281 265 269*Includes 14 METCO students.**Students who receive special education services outside of the classroom for a significant amount of time (students in K-8 are reported with their grades).***Projections include new METCO students for each year.
TEN YEARS OF TOTAL SCHOOL ENROLLMENTS
Enrollment Change from % Change fromYear K Total Previous Year Previous Year2007 53 3292008 39 338 9 2.7%2009 39 329 -9 -2.7%2010 45 318 -11 -3.3%2011 55 316 -2 -0.6%2012 51 337 21 6.6%2013 46 312 -25 -7.4%2014 48 306 -6 -1.9%2015 41 314 8 2.6%2016 38 299 -15 -4.8%
Peak enrollment year: 2008, 338 students
- 59 -

Peirce
DISTRIBUTION OF THE AGES OF INCOMING KINDERGARTEN STUDENTS
Age 5 Age 6Year # % # % Total2009 32 82.1% 7 17.9% 392010 42 93.3% 3 6.7% 452011 45 81.8% 10 18.2% 552012 48 94.1% 3 5.9% 512013 42 91.3% 4 8.7% 462014 44 91.7% 4 8.3% 482015 41 100.0% 0 0.0% 412016 37 97.4% 1 2.6% 38
* Age 6 for school year 2009-10 included one 7-year old.
NUMBER OF CHILDREN YOUNGER THAN AGE FIVE
Age Number Year Entering K1 5 2020-20212 18 2019-20203 17 2018-20194 19 2017-2018
(as of January 1, 2016 City Census)
100
200
300
400
500
600
Enrollment History and Projections
- 60 -

Underwood
ACTUAL AND PROJECTED ENROLLMENTS BY GRADE
OctoberEnrollment Difference Projections Using 5-year Average Ratios***
2015 2016 N % 2017 2018 2019 2020 2021Grade FY16 FY17 FY18 FY19 FY20 FY21 FY22
K 41 47 6 14.6% 47 48 45 48 48
1 66 44 -22 -33.3% 50 50 52 47 52
2 51 65 14 27.5% 44 51 50 52 48
3 55 48 -7 -12.7% 69 47 54 54 55
4 55 55 0 0.0% 50 72 49 56 55
5 58 54 -4 -6.9% 56 51 73 50 57
Spec. Ed.** 0 0 0 0.0% 0 0 0 0 0
TOTAL 326 313* -13 -4.0% 316 319 323 307 315*Includes 20 METCO students.**Students who receive special education services outside of the classroom for a significant amount of time (students in K-8 are reported with their grades).***Projections include new METCO students for each year.
TEN YEARS OF TOTAL SCHOOL ENROLLMENTS
Enrollment Change from % Change fromYear K Total Previous Year Previous Year2007 44 2952008 43 282 -13 -4.4%2009 46 262 -20 -7.1%2010 49 282 20 7.6%2011 49 289 7 2.5%2012 47 310 21 7.3%2013 48 327 17 5.5%2014 62 341 14 4.3%2015 41 326 -15 -4.4%2016 47 313 -13 -4.0%
Peak enrollment year: 2014, 341 students
- 61 -

Underwood
DISTRIBUTION OF THE AGES OF INCOMING KINDERGARTEN STUDENTS*
Age 5 Age 6Year # % # % Total2009 39 84.8% 7 15.2% 462010 43 87.8% 6 12.2% 492011 46 93.9% 3 6.1% 492012 42 89.4% 5 10.6% 472013 47 97.9% 1 2.1% 482014 58 93.5% 4 6.5% 622015 40 97.6% 1 2.4% 412016 47 100.0% 0 0.0% 47
NUMBER OF CHILDREN YOUNGER THAN AGE FIVE
Age Number Year Entering K1 16 2020-20212 17 2019-20203 21 2018-20194 20 2017-2018
(as of January 1, 2016 City Census)
100
200
300
400
500
600
Enrollment History and Projections
- 62 -

Ward
ACTUAL AND PROJECTED ENROLLMENTS BY GRADE
OctoberEnrollment Difference Projections Using 5-year Average Ratios***
2015 2016 N % 2017 2018 2019 2020 2021Grade FY16 FY17 FY18 FY19 FY20 FY21 FY22
K 43 49 6 14.0% 43 43 44 44 45
1 49 45 -4 -8.2% 54 47 47 49 50
2 57 54 -3 -5.3% 46 56 49 48 50
3 57 56 -1 -1.8% 56 49 58 51 51
4 53 58 5 9.4% 56 56 49 58 51
5 45 51 6 13.3% 56 55 55 47 57
Spec. Ed.** 0 0 0 0.0% 0 0 0 0 0
TOTAL 304 313* 9 3.0% 311 306 302 297 304*Includes 14 METCO students.**Students who receive special education services outside of the classroom for a significant amount of time (students in K-8 are reported with their grades).***Projections include new METCO students for each year.
TEN YEARS OF TOTAL SCHOOL ENROLLMENTS
Enrollment Change from % Change fromYear K Total Previous Year Previous Year2007 47 2472008 42 260 13 5.3%2009 34 260 0 0.0%2010 42 269 9 3.5%2011 46 278 9 3.3%2012 47 301 23 8.3%2013 43 289 -12 -4.0%2014 46 304 15 5.2%2015 43 304 0 0.0%2016 49 313 9 3.0%
Peak enrollment year: 2016, 313 students
- 63 -
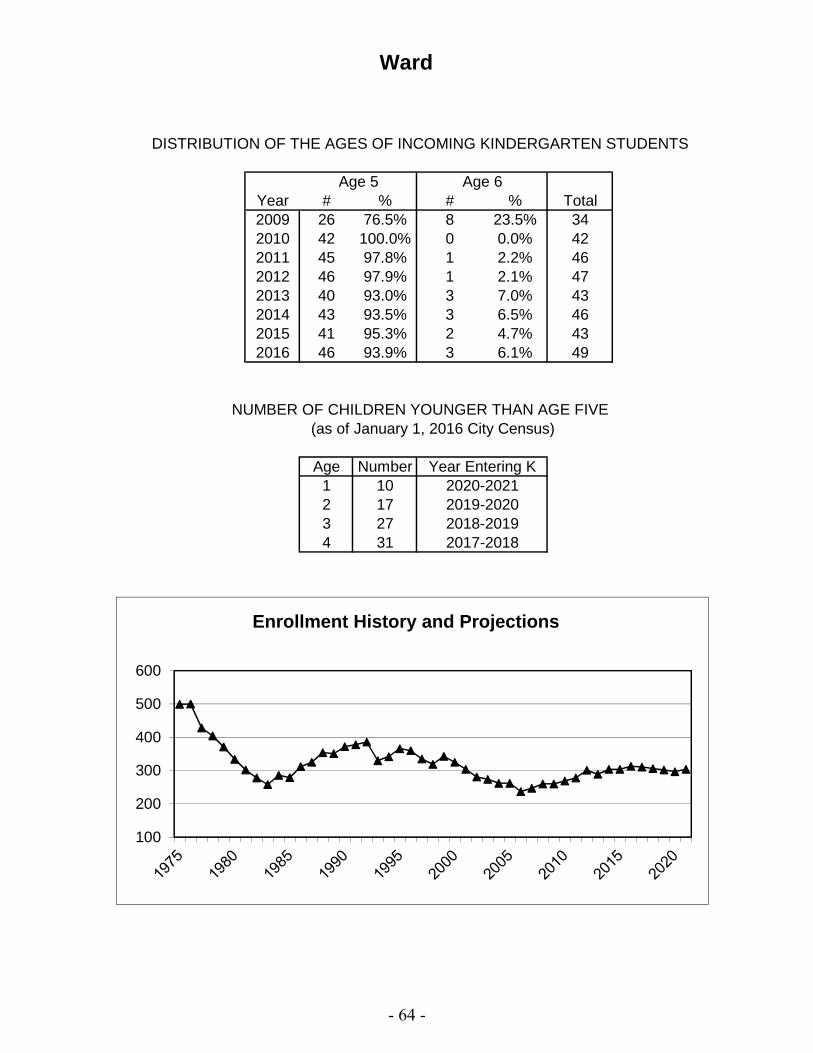
Ward
DISTRIBUTION OF THE AGES OF INCOMING KINDERGARTEN STUDENTS
Age 5 Age 6Year # % # % Total2009 26 76.5% 8 23.5% 342010 42 100.0% 0 0.0% 422011 45 97.8% 1 2.2% 462012 46 97.9% 1 2.1% 472013 40 93.0% 3 7.0% 432014 43 93.5% 3 6.5% 462015 41 95.3% 2 4.7% 432016 46 93.9% 3 6.1% 49
NUMBER OF CHILDREN YOUNGER THAN AGE FIVE
Age Number Year Entering K1 10 2020-20212 17 2019-20203 27 2018-20194 31 2017-2018
(as of January 1, 2016 City Census)
100
200
300
400
500
600
Enrollment History and Projections
- 64 -

Williams
ACTUAL AND PROJECTED ENROLLMENTS BY GRADE
OctoberEnrollment Difference Projections Using 5-year Average Ratios***
2015 2016 N % 2017 2018 2019 2020 2021Grade FY16 FY17 FY18 FY19 FY20 FY21 FY22
K 62 44 -18 -29.0% 45 45 47 45 46
1 41 65 24 58.5% 45 46 46 50 48
2 43 44 1 2.3% 67 47 47 47 52
3 61 43 -18 -29.5% 44 68 47 48 48
4 45 58 13 28.9% 43 44 68 47 48
5 38 39 1 2.6% 55 40 42 64 45
Spec. Ed.** 0 0 0 0.0% 0 0 0 0 0
TOTAL 290 293* 3 1.0% 299 290 297 301 287*Includes 14 METCO students.**Students who receive special education services outside of the classroom for a significant amount of time (students in K-8 are reported with their grades).***Projections include new METCO students for each year.
TEN YEARS OF TOTAL SCHOOL ENROLLMENTS
Enrollment Change from % Change fromYear K Total Previous Year Previous Year2007 41 2812008 43 276 -5 -1.8%2009 51 277 1 0.4%2010 43 298 21 7.6%2011 46 302 4 1.3%2012 50 304 2 0.7%2013 45 304 0 0.0%2014 37 292 -12 -3.9%2015 62 290 -2 -0.7%2016 44 293 3 1.0%
Peak enrollment year: 2012, 304 students
- 65 -

Williams
DISTRIBUTION OF THE AGES OF INCOMING KINDERGARTEN STUDENTS
Age 5 Age 6Year # % # % Total2009 46 90.2% 5 9.8% 512010 41 95.3% 2 4.7% 432011 46 100.0% 0 0.0% 462012 49 98.0% 1 2.0% 502013 40 88.9% 5 11.1% 452014 34 91.9% 3 8.1% 372015 58 93.5% 4 6.5% 622016 43 97.7% 1 2.3% 44
NUMBER OF CHILDREN YOUNGER THAN AGE FIVE
Age Number Year Entering K1 12 2020-20212 15 2019-20203 22 2018-20194 21 2017-2018
(as of January 1, 2016 City Census)
100
200
300
400
500
600
Enrollment History and Projections
- 66 -

Zervas
ACTUAL AND PROJECTED ENROLLMENTS BY GRADE
OctoberEnrollment Difference Projections Using 5-year Average Ratios***
2015 2016 N % 2017 2018 2019 2020 2021Grade FY16 FY17 FY18 FY19 FY20 FY21 FY22
K 44 65 21 47.7% 74 78 78 81 79
1 53 56 3 5.7% 69 76 80 81 85
2 54 57 3 5.6% 57 70 77 81 82
3 54 57 3 5.6% 58 58 71 78 82
4 43 55 12 27.9% 56 57 57 70 77
5 60 47 -13 -21.7% 57 58 59 59 73
Spec. Ed.** 0 0 0 0.0% 0 0 0 0 0
TOTAL 308 337* 29 9.4% 371 397 422 450 478*Includes 16 METCO students.**Students who receive special education services outside of the classroom for a significant amount of time (students in K-8 are reported with their grades).***Projections include new METCO students for each year.
TEN YEARS OF TOTAL SCHOOL ENROLLMENTS
Enrollment Change from % Change fromYear K Total Previous Year Previous Year2007 52 3242008 46 328 4 1.2%2009 45 326 -2 -0.6%2010 62 349 23 7.1%2011 40 321 -28 -8.0%2012 60 325 4 1.2%2013 53 317 -8 -2.5%2014 53 309 -8 -2.5%2015 44 308 -1 -0.3%2016 65 337 29 9.4%
Peak enrollment year: 2010, 349 students
- 67 -

Zervas
DISTRIBUTION OF THE AGES OF INCOMING KINDERGARTEN STUDENTS
Age 5 Age 6Year # % # % Total2009 41 91.1% 4 8.9% 452010 58 93.5% 4 6.5% 622011 39 97.5% 1 2.5% 402012 52 86.7% 8 13.3% 602013 52 98.1% 1 1.9% 532014 51 96.2% 2 3.8% 532015 43 97.7% 1 2.3% 442016 59 90.8% 6 9.2% 65
NUMBER OF CHILDREN YOUNGER THAN AGE FIVE
Age Number Year Entering K1 16 2020-20212 26 2019-20203 32 2018-20194 27 2017-2018
(as of January 1, 2016 City Census)
100
200
300
400
500
600
Enrollment History and Projections
- 68 -
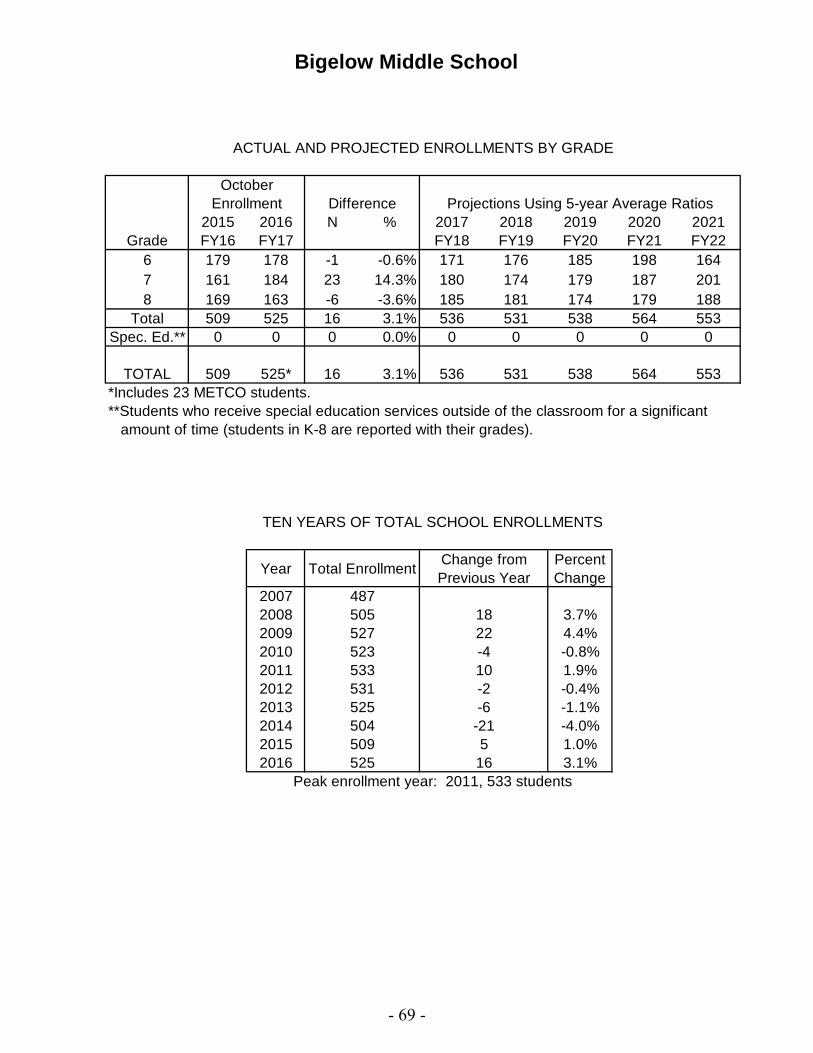
Bigelow Middle School
ACTUAL AND PROJECTED ENROLLMENTS BY GRADE
OctoberEnrollment Difference Projections Using 5-year Average Ratios
2015 2016 N % 2017 2018 2019 2020 2021Grade FY16 FY17 FY18 FY19 FY20 FY21 FY22
6 179 178 -1 -0.6% 171 176 185 198 1647 161 184 23 14.3% 180 174 179 187 2018 169 163 -6 -3.6% 185 181 174 179 188
Total 509 525 16 3.1% 536 531 538 564 553Spec. Ed.** 0 0 0 0.0% 0 0 0 0 0
TOTAL 509 525* 16 3.1% 536 531 538 564 553*Includes 23 METCO students.**Students who receive special education services outside of the classroom for a significant amount of time (students in K-8 are reported with their grades).
TEN YEARS OF TOTAL SCHOOL ENROLLMENTS
Year Total EnrollmentChange from Previous Year
Percent Change
2007 4872008 505 18 3.7%2009 527 22 4.4%2010 523 -4 -0.8%2011 533 10 1.9%2012 531 -2 -0.4%2013 525 -6 -1.1%2014 504 -21 -4.0%2015 509 5 1.0%2016 525 16 3.1%
Peak enrollment year: 2011, 533 students
- 69 -

Bigelow Middle School
FIFTH GRADE STUDENTS FROM THE BIGELOW FEEDER SCHOOLS
Elementary 2016-2017School 5th Grade Enrollment
Cabot 0Lincoln-Eliot 58Underwood 54Ward 51Total 163
100200300400500600700800900
1,000
Enrollment History and Projections
- 70 -

Brown Middle School
ACTUAL AND PROJECTED ENROLLMENTS BY GRADE
OctoberEnrollment Difference Projections Using 5-year Average Ratios
2015 2016 N % 2017 2018 2019 2020 2021Grade FY16 FY17 FY18 FY19 FY20 FY21 FY22
6 284 241 -43 -15.1% 219 263 249 285 2837 254 281 27 10.6% 241 218 262 251 2858 242 252 10 4.1% 284 243 221 266 254
Total 780 774 -6 -0.8% 744 724 732 802 822Spec. Ed.** 0 0 0 0 0 0 0 0
TOTAL 780 774* -6 -0.8% 744 724 732 802 822*Includes 20 METCO students.**Students who receive special education services outside of the classroom for a significant amount of time (students in K-8 are reported with their grades).
TEN YEARS OF TOTAL SCHOOL ENROLLMENTS
YearTotal
EnrollmentChange from Previous Year
Percent Change
2007 6442008 681 37 5.7%2009 684 3 0.4%2010 666 -18 -2.6%2011 677 11 1.7%2012 698 21 3.1%2013 743 45 6.4%2014 738 -5 -0.7%2015 780 42 5.7%2016 774 -6 -0.8%
Peak enrollment year: 2015, 780 students
- 71 -

Brown Middle School
Elementary 2016-2017School 5th Grade Enrollment
Angier 57Countryside 76Mason-Rice 68Williams 39Total 240
FIFTH GRADE STUDENTS FROM BROWN FEEDER SCHOOLS
100200300400500600700800900
1,000
Enrollment History and Projections
- 72 -

Day Middle School
ACTUAL AND PROJECTED ENROLLMENTS BY GRADE
OctoberEnrollment Difference Projections Using 5-year Average Ratios
2015 2016 N % 2017 2018 2019 2020 2021Grade FY16 FY17 FY18 FY19 FY20 FY21 FY22
6 308 309 1 0.3% 351 318 333 364 3067 289 318 29 10.0% 313 355 322 337 3678 330 295 -35 -10.6% 321 315 357 325 339
Total 927 922 -5 -0.5% 985 988 1012 1026 1012Spec. Ed.** 0 0 0 0.0% 0 0 0 0 0
TOTAL 927 922* -5 -0.5% 985 988 1012 1026 1012*Includes 31 METCO students.**Students who receive special education services outside of the classroom for a significant amount of time (students in K-8 are reported with their grades).
TEN YEARS OF TOTAL SCHOOL ENROLLMENTS
Year Total EnrollmentChange from Previous Year
Percent Change
2007 7642008 747 -17 -2.2%2009 773 26 3.5%2010 758 -15 -1.9%2011 845 87 11.5%2012 874 29 3.4%2013 947 73 8.4%2014 932 -15 -1.6%2015 927 -5 -0.5%2016 922 -5 -0.5%
Peak enrollment year: 2013, 947 students
- 73 -

Day Middle School
Elementary 2016-2017School 5th Grade Enrollment
Burr 70Cabot 71Franklin 70Horace Mann 86Peirce 62Total 359
FIFTH GRADE STUDENTS FROM THE DAY FEEDER SCHOOLS
100200300400500600700800900
1,0001,100
Enrollment History and Projections
- 74 -

Oak Hill Middle School
ACTUAL AND PROJECTED ENROLLMENTS BY GRADE
OctoberEnrollment Difference Projections Using 5-year Average Ratios
2015 2016 N % 2017 2018 2019 2020 2021Grade FY16 FY17 FY18 FY19 FY20 FY21 FY22
6 192 233 41 21.4% 184 195 227 201 2027 208 189 -19 -9.1% 234 184 196 226 2008 202 217 15 7.4% 189 233 183 195 226
Total 602 639 37 6.1% 607 612 606 622 628Spec. Ed.** 0 0 0 0.0% 0 0 0 0 0
TOTAL 602 639* 37 6.1% 607 612 606 622 628*Includes 29 METCO students.**Students who receive special education services outside of the classroom for a significant amount of time (students in K-8 are reported with their grades).
TEN YEARS OF TOTAL SCHOOL ENROLLMENTS
YearTotal
EnrollmentChange from Previous Year
Percent Change
2007 5582008 547 -11 -2.0%2009 572 25 4.6%2010 603 31 5.4%2011 612 9 1.5%2012 616 4 0.7%2013 634 18 2.9%2014 632 -2 -0.3%2015 602 -30 -4.7%2016 639 37 6.1%
Peak enrollment year: 2016, 639 students
- 75 -

Oak Hill Middle School
FIFTH GRADE STUDENTS FROM THE OAK HILL FEEDER SCHOOLS
Elementary 2016-2017School 5th Grade Enrollment
Bowen 73Memorial-Spaulding 68Zervas 47Total 188
1997-98 marked the opening of Oak Hill Middle School.
100200300400500600700800900
1,000
Enrollment History and Projections
- 76 -

North High School
ACTUAL AND PROJECTED ENROLLMENTS BY GRADE
OctoberEnrollment Difference Projections Using 5-year Average Ratios
2015 2016 N % 2017 2018 2019 2020 2021Grade FY16 FY17 FY18 FY19 FY20 FY21 FY22
9 507 511 4 0.8% 479 530 519 555 53810 537 524 -13 -2.4% 519 486 537 526 56311 484 552 68 14.0% 531 525 491 543 53212 497 474 -23 -4.6% 550 529 523 490 541
TOTAL 2,025 2,061 36 2% 2,079 2,070 2,070 2,114 2,174Post Grads 0 0 0 0 0 0 0 0 0Spec. Ed.* 82 84 2 2% 84 84 84 84 84
TOTAL 2,107 2,145** 38 1.8% 2,163 2,154 2,154 2,198 2,258**Includes 68 METCO students.*Students who receive special education services outside of the classroom for a significant amount of time.
TEN YEARS OF TOTAL SCHOOL ENROLLMENTS
Year Total EnrollmentChange from Previous Year
Percent Change
2007 1,9112008 1,829 -82 -4.3%2009 1,802 -27 -1.5%2010 1,871 69 3.8%2011 1,877 6 0.3%2012 1,940 63 3.4%2013 2,015 75 3.9%2014 2,060 45 2.2%2015 2,107 47 2.3%2016 2,145 38 1.8%
Peak enrollment year: 2016, 2145 students
- 77 -

North High School
Middle 2016-2017School 8th Grade Enrollment
Bigelow 163Brown (10%) 8Day 295Total 466
EIGHTH GRADE STUDENTS FROM THE NORTH FEEDER SCHOOLS
500
1,000
1,500
2,000
2,500
3,000
Enrollment History and Projections
- 78 -

South High School
ACTUAL AND PROJECTED ENROLLMENTS BY GRADE
OctoberEnrollment Difference Projections Using 5-year Average Ratios
2015 2016 N % 2017 2018 2019 2020 2021Grade FY16 FY17 FY18 FY19 FY20 FY21 FY22
9 438 481 43 9.8% 500 503 508 430 475
10 436 452 16 3.7% 483 502 504 509 431
11 453 455 2 0.4% 457 488 507 510 515
12 449 451 2 0.4% 455 457 488 507 509
TOTAL 1,776 1,839 63 4% 1,895 1,950 2,007 1,956 1,930Post Grads 0 0 0 0 0 0 0 0 0Spec. Ed.* 22 12 -10 -45% 12 12 12 12 12
TOTAL 1,798 1,851** 53 2.9% 1,907 1,962 2,019 1,968 1,942**Includes 61 METCO students.*Students who receive special education services outside of the classroom for a significant amount of time.
TEN YEARS OF TOTAL SCHOOL ENROLLMENTS
Year Total EnrollmentChange from Previous Year
Percent Change
2007 1,7842008 1,763 -21 -1.2%2009 1,722 -41 -2.3%2010 1,708 -14 -0.8%2011 1,691 -17 -1.0%2012 1,721 30 1.8%2013 1,778 57 3.3%2014 1,804 26 1.5%2015 1,798 -6 -0.3%2016 1,851 53 2.9%
Peak enrollment year: 2016, 1851 students
- 79 -

South High School
Middle 2016-2017School 8th Grade Enrollment
Brown (90%) 244OakHill 217Total 461
EIGHTH GRADE STUDENTS FROM THE SOUTH FEEDER SCHOOLS
500
1,000
1,500
2,000
2,500
3,000
Enrollment History and Projections
- 80 -


V. STUDENT EXITS AND ENTRANCES


STUDENT EXITS AND ENTRANCES
This section reports on student mobility in Newton Public Schools due to the movement of
students not resulting from grade promotion. The student mobility statistics reported below
illuminate the annual cycle of new student entrances and student exits in the district and how
net migration can affect total enrollment. In addition, exit and entrance statistics further
detail the extent and the type of student mobility changes that are experienced by schools
during the course of a full academic year; thus student mobility statistics reported in this
section cover the entire 2015-16 school year, in contrast to other statistics in this report,
which are reported as of a moment in time (October 1st).
The table below displays three years of exit and entrance history. 2015-16 shows a positive
net migration in contrast to the negative net migration in 2014-15. In 2015-16, new students
comprised 6.5% of the total student population (not including new kindergarten enrollments
in the fall), while student exits in the same year (not including graduates) made up 5.9% of
the total population. In comparison to 2013-14, although the percentage of both entrances
and exits in 2015-16 is smaller, the net migration is larger due to a smaller number of exits.
There are a significant number of students who both enter and exit the Newton Public
Schools in a single year. During the 2015-16 school year, 144 students, or 17.6% of the total
entrances, both entered and left the Newton Public Schools. The following table displays
both the entrance and exit reasons for these students. The majority of these 144 students
enrolled from outside of the country (53%), while the remainder enrolled from outside of
Massachusetts, from private school, or from another town in Massachusetts. The majority of
these 144 students exited because they moved out of Newton (44%) or moved out of the
country (36%), while the remaining students left to attend private school or for other reasons.
As illustrated in the table, the largest group of entering and exiting students enrolled from
outside the country and moved out of the country during 2015-16 (42 students, or 29% of the
students who entered and exited).
Annual Student Mobility 2013-14 2014-15 2015-16
Number of Student Exits 810 863 744
Percentage of Enrollment 6.5% 6.9% 5.9%
Number of Student Entrances 846 805 817
Percentage of Enrollment 6.8% 6.4% 6.5%
In Migration (Out Migration) 36 -58 73
- 81 -

Student Exit Statistics
In 2015-16, a total of 744 students, or 5.9% of the total population, left their schools during
or after the close of the academic year, not including graduates. In 2015-16, at all grade
levels, the greatest number of student exits resulted from students moving out of Newton.
This is similar to the previous year where the greatest number of student exits also resulted
from students moving out of Newton. Most students who moved out of Newton in 2015-16
left during the elementary years, which was also true in 2013-14 and 2014-15. Like the
previous two years, the middle school grade level had the highest percentage of students
leaving to attend private school of all grade levels. The following tables provide the total
number of exiting students by school and grade level, and by reason for exit.
In these tables, the reasons for exit are displayed for exits during Summer 2016 to provide
more specific information, as the majority of exits occur at or after the end of the school year.
The number of exits during the 2015-16 school year, as well as all exits occurring in 2014-15
and 2015-16 (which includes the 2015-16 school year and Summer 2016 exits), are also
included for comparison. Displaying the statistics in this way also allows for a comparison
between the total exits in Summer 2016 to the total entrances as of October 1, 2016 for a
current look at how student mobility is affecting growth at the beginning of the 2016-17
school year. There were 531 total exits in Summer 2016 and (as detailed in the next section)
there are 754 student entrances as of October 1, 2016.
Moved out of the
Country
Moved out of
Newton
Left to
Attend Non-
Public
School
Left Due to
Special
Education
Placement
Other
Reasons**Total
Enrolled from MA* 1 14 6 1 22
Enrolled from outside
of MA8 22 1 2 33
Enrolled from outside
the Country42 20 4 10 76
Enrolled from Private
School1 7 4 1 13
Total 52 63 14 1 14 144
**Other includes non-resident student transfers, home schooled students and deceased students.
Entered from
Students who both entered and exited in 2015-16
Exited to
*The majority of students in this category have enrolled from another MA community and some have enrolled from
an origin that is unknown.
- 82 -

TABLE 20
School
All
2014-15
Exits
Exits
during the
2015-16
School
Year
Moved out
of the
Country
Summer
2016
Moved Out
of Newton
Summer
2016
Left to
Attend
Non-Public
School
Summer
2016
Left Due to
Special
Education
Placement
Summer
2016
Left for
Other*
Reasons
Summer
2016
All
2015-16
Exits
All Grades 863 213 81 263 159 11 17 744
% Total
Enrollment 6.9% 1.7% 0.6% 2.1% 1.3% 0.1% 0.1% 5.9%
28.6% 10.9% 35.3% 21.4% 1.5% 2.3% 100.0%
*Other includes non-resident student transfers, home schooled students and deceased students.
SUMMARY ALL GRADES
2015 - 2016
% of All 2015-16 Exits
School
All
2014-15
Exits
Exits
during the
2015-16
School
Year
Moved out
of the
Country
Summer
2016
Moved Out
of Newton
Summer
2016
Left to
Attend
Non-Public
School
Summer
2016
Left Due to
Special
Education
Placement
Summer
2016
Left for
Other*
Reasons
Summer
2016
All
2015-16
Exits
Angier 33 4 3 12 5 1 25
Bowen 45 12 7 12 7 38
Burr 31 6 2 12 2 1 23
Cabot 25 7 2 14 1 24
Countryside 40 8 5 17 1 31
Franklin 23 10 5 3 1 19
Horace Mann 31 5 3 10 3 1 22
Lincoln-Eliot 31 16 1 21 1 39
Mason-Rice 21 7 3 7 9 26
Memorial-Spaulding 39 6 3 16 7 32
Peirce 34 2 4 6 27 1 40
Underwood 29 23 3 2 28
Ward 20 2 3 14 6 25
Williams 32 14 9 8 3 34
Zervas 26 5 2 10 6 23
Total 460 127 47 167 82 2 4 429
% of Elementary
Enrollment 7.9% 2.2% 0.8% 2.9% 1.4% 0.0% 0.1% 7.4%
29.6% 11.0% 38.9% 19.1% 0.5% 0.9% 100.0%
*Other includes non-resident student transfers, home schooled students and deceased students.
EXITING ELEMENTARY SCHOOL STUDENTS
2015 - 2016
% of All 2015-16 Exits
- 83 -

TABLE 21
TABLE 22
School
All
2014-15
Exits
Exits
during the
2015-16
School
Year
Moved out
of the
Country
Summer
2016
Moved Out
of Newton
Summer
2016
Left to
Attend
Non-Public
School
Summer
2016
Left Due to
Special
Education
Placement
Summer
2016
Left for
Other*
Reasons
Summer
2016
All
2015-16
Exits
Bigelow 41 6 1 24 4 1 36
Brown 44 11 3 9 17 1 1 42
Day 65 9 2 18 15 3 47
Oak Hill 60 6 7 9 17 3 42
Total 210 32 13 60 53 8 1 167
% Middle School
Enrollment 7.5% 1.1% 0.5% 2.1% 1.9% 0.3% 0.0% 5.9%
19.2% 7.8% 35.9% 31.7% 4.8% 0.6% 100.0%
*Other includes non-resident student transfers, home schooled students and deceased students.
2015 - 2016
EXITING MIDDLE SCHOOL STUDENTS
% of All 2015-16 Exits
School
All
2014-15
Exits
Exits
during the
2015-16
School
Year
Moved out
of the
Country
Summer
2016
Moved Out
of Newton
Summer
2016
Left to
Attend
Non-Public
School
Summer
2016
Left Due to
Special
Education
Placement
Summer
2016
Left for
Other*
Reasons
Summer
2016
All
2015-16
Exits
North High 91 30 2 18 7 1 3 61
South High 102 24 19 18 17 9 87
Total 193 54 21 36 24 1 12 148
% High School
Enrollment 5.0% 1.4% 0.5% 0.9% 0.6% 0.0% 0.3% 3.8%
36.5% 14.2% 24.3% 16.2% 0.7% 8.1% 100.0%
*Other includes non-resident student transfers, home schooled students and deceased students.
EXITING HIGH SCHOOL STUDENTS
2015 - 2016
% of All 2015-16 Exits
- 84 -

A three year history of student exits is shown below. In 2015-16, the decrease in student
exits is observed at all three grade levels, although the decrease in exits compared to the
previous year is largest at the middle and high school grade levels.
TABLE 23
School 2013-14 2014-15
# %
Change 2015-16
# %
Change
Angier 38 33 -5 25 -8
Bowen 51 45 -6 38 -7
Burr 22 31 9 23 -8
Cabot 30 25 -5 24 -1
Countryside 24 40 16 31 -9
Franklin 35 23 -12 19 -4
Horace Mann 14 31 17 22 -9
Lincoln-Eliot 20 31 11 39 8
Mason-Rice 30 21 -9 26 5
Memorial-Spaulding 33 39 6 32 -7
Peirce 38 34 -4 40 6
Underwood 34 29 -5 28 -1
Ward 26 20 -6 25 5
Williams 40 32 -8 34 2
Zervas 28 26 -2 23 -3
Total Elementary 463 460 -3 429 -31
% Elementary Enrollment 8.0% 7.9% -0.6% 7.4% -6.7%
Bigelow 26 41 15 36 -5
Brown 54 44 -10 42 -2
Day 62 65 3 47 -18
Oak Hill 53 60 7 42 -18
Total Middle School 195 210 15 167 -43
% Middle School Enrollment 6.8% 7.5% 7.7% 5.9% -20.5%
North High 78 91 13 61 -30
South High 74 102 28 87 -15
Total High School 152 193 41 148 -45
% High School Enrollment 4.0% 5.0% 27.0% 3.8% -23.3%
Grand Total 810 863 53 744 -119
% Total Enrollment 6.5% 6.9% 6.5% 5.9% -13.8%
TOTAL STUDENT EXITS
Three Year History
- 85 -

Table 24 provides a history of student exits to private schools at the elementary, middle and
high school levels since 2009-10. It includes a break out of the number and percentage of
exits in transition years after the completion of elementary school and middle school. In
2015-16, 46% of students who left elementary school to attend private school did so in grade
5, which is slightly higher than last year, but lower than 2012-13 and 2013-14. Of the
students who left their middle school to attend private school, 41% transferred in grade 8, a
decrease from the previous year.
TABLE 24
09-10 10-11 11-12 12-13 13-14 14-15 15-16
All Elementary 81 113 79 98 67 85 84
% of Elementary Enrollment 1.6% 2.0% 1.4% 1.7% 2.5% 1.5% 1.5%
Grade 5* 35 50 34 49 36 34 39
% of Elementary exits 43.2% 44.2% 43.0% 50.0% 53.7% 40.0% 46.4%
All Middle School 59 69 36 50 45 67 54
% of Middle School Enrollment 2.3% 1.2% 1.0% 1.8% 1.2% 2.4% 1.9%
Grade 8* 21 41 20 26 20 35 22
% of Middle School exits 35.6% 59.4% 55.6% 52.0% 44.4% 52.2% 40.7%
All High School 27 29 19 29 39 45 34
% of High School Enrollment 0.8% 0.8% 0.1% 0.8% 0.3% 1.2% 0.9%
Grand Total 167 211 134 177 151 197 172
% of Total Enrollment 1.4% 1.4% 0.9% 1.5% 1.2% 1.6% 1.4%
*Statistics on Grade 5 and Grade 8 exits are provided to highlight grade level transition years.
LevelAcademic Year
HISTORY OF EXITS TO NON-PUBLIC SCHOOLS
- 86 -
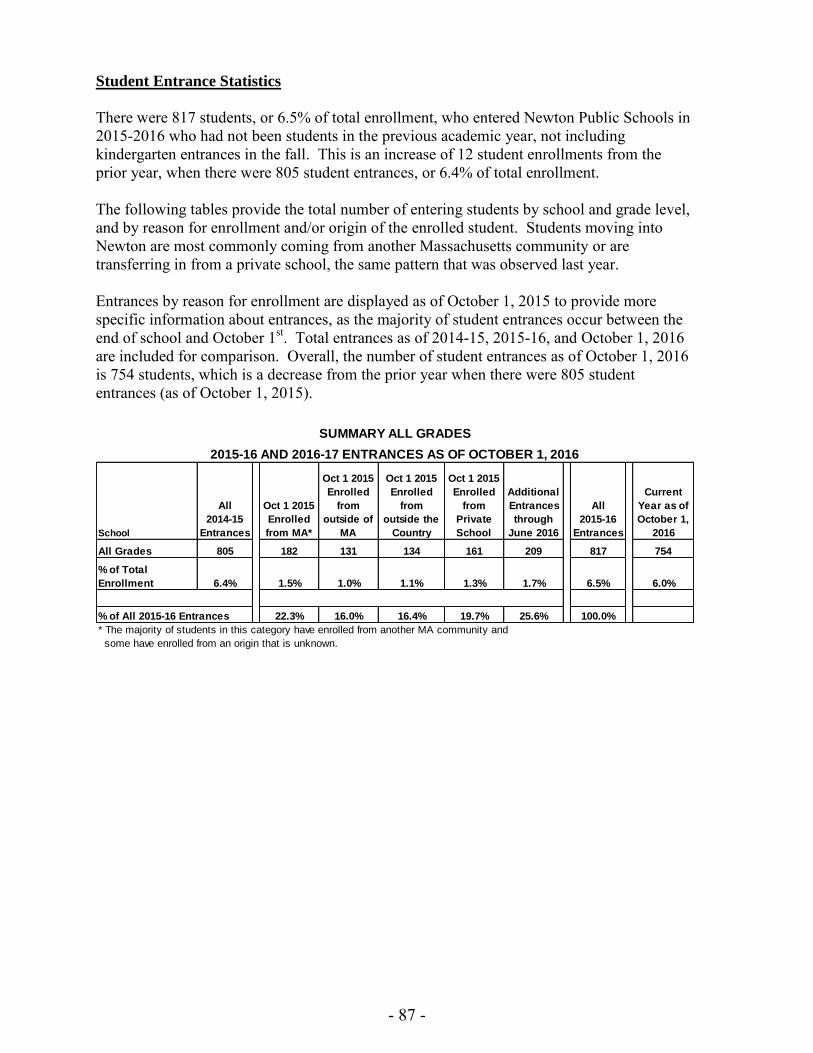
Student Entrance Statistics
There were 817 students, or 6.5% of total enrollment, who entered Newton Public Schools in
2015-2016 who had not been students in the previous academic year, not including
kindergarten entrances in the fall. This is an increase of 12 student enrollments from the
prior year, when there were 805 student entrances, or 6.4% of total enrollment.
The following tables provide the total number of entering students by school and grade level,
and by reason for enrollment and/or origin of the enrolled student. Students moving into
Newton are most commonly coming from another Massachusetts community or are
transferring in from a private school, the same pattern that was observed last year.
Entrances by reason for enrollment are displayed as of October 1, 2015 to provide more
specific information about entrances, as the majority of student entrances occur between the
end of school and October 1st. Total entrances as of 2014-15, 2015-16, and October 1, 2016
are included for comparison. Overall, the number of student entrances as of October 1, 2016
is 754 students, which is a decrease from the prior year when there were 805 student
entrances (as of October 1, 2015).
School
All
2014-15
Entrances
Oct 1 2015
Enrolled
from MA*
Oct 1 2015
Enrolled
from
outside of
MA
Oct 1 2015
Enrolled
from
outside the
Country
Oct 1 2015
Enrolled
from
Private
School
Additional
Entrances
through
June 2016
All
2015-16
Entrances
Current
Year as of
October 1,
2016
All Grades 805 182 131 134 161 209 817 754
% of Total
Enrollment 6.4% 1.5% 1.0% 1.1% 1.3% 1.7% 6.5% 6.0%
22.3% 16.0% 16.4% 19.7% 25.6% 100.0%
* The majority of students in this category have enrolled from another MA community and
some have enrolled from an origin that is unknown.
% of All 2015-16 Entrances
SUMMARY ALL GRADES
2015-16 AND 2016-17 ENTRANCES AS OF OCTOBER 1, 2016
- 87 -

TABLE 25
TABLE 26
School
All
2014-15
Entrances
Oct 1 2015
Enrolled
from MA*
Oct 1 2015
Enrolled
from
outside of
MA
Oct 1 2015
Enrolled
from
outside the
Country
Oct 1 2015
Enrolled
from
Private
School
Additional
Entrances
through
June 2016
All
2015-16
Entrances
Current
Year as of
October 1,
2016
Angier 16 5 9 5 4 3 26 17
Bowen 40 10 6 7 6 9 38 20
Burr 22 3 5 3 4 11 26 20
Cabot 20 13 7 1 3 6 30 33
Countryside 43 11 4 6 7 7 35 29
Franklin 24 6 3 4 3 3 19 14
Horace Mann 27 2 1 3 3 8 17 22
Lincoln-Eliot 30 13 5 4 15 37 32
Mason-Rice 28 6 6 4 8 9 33 26
Memorial-Spaulding 40 6 8 4 10 12 40 29
Peirce 14 10 2 3 7 3 25 22
Underwood 20 12 1 4 3 4 24 25
Ward 29 5 9 3 2 6 25 23
Williams 41 4 4 7 3 16 34 14
Zervas 15 7 4 4 2 15 32 34
Total 409 113 74 62 65 127 441 360
% of Elementary
Enrollment 7.0% 2.0% 1.3% 1.1% 1.1% 2.2% 7.6% 6.2%
25.6% 16.8% 14.1% 14.7% 28.8% 100.0%
* The majority of students in this category have enrolled from another MA community and
some have enrolled from an origin that is unknown.
% of All 2015-16 Entrances
ENTERING ELEMENTARY SCHOOL STUDENTS
2015-16 AND 2016-17 ENTRANCES AS OF OCTOBER 1, 2016
School
All
2014-15
Entrances
Oct 1 2015
Enrolled
from MA*
Oct 1 2015
Enrolled
from
outside of
MA
Oct 1 2015
Enrolled
from
outside the
Country
Oct 1 2015
Enrolled
from
Private
School
Additional
Entrances
through
June 2016
All
2015-16
Entrances
Current
Year as of
October 1,
2016
Bigelow 54 10 6 6 3 9 34 40
Brown 37 8 7 8 6 5 34 37
Day 37 6 9 3 7 15 40 36
Oak Hill 42 9 8 9 5 12 43 42
Total 170 33 30 26 21 41 151 155
% of Middle School
Enrollment 6.1% 1.2% 1.1% 0.9% 0.7% 1.5% 5.4% 5.4%
21.9% 19.9% 17.2% 13.9% 27.2% 100.0%
* The majority of students in this category have enrolled from another MA community and
some have enrolled from an origin that is unknown.
% of All 2015-16 Entrances
ENTERING MIDDLE SCHOOL STUDENTS
2015-16 AND 2016-17 ENTRANCES AS OF OCTOBER 1, 2016
- 88 -

TABLE 27
School
All
2014-15
Entrances
Oct 1 2015
Enrolled
from MA*
Oct 1 2015
Enrolled
from
outside of
MA
Oct 1 2015
Enrolled
from
outside the
Country
Oct 1 2015
Enrolled
from
Private
School
Additional
Entrances
through
June 2016
All
2015-16
Entrances
Current
Year as of
October 1,
2016
North High 102 24 14 18 43 21 120 94
South High 124 12 13 28 32 20 105 145
Total 226 36 27 46 75 41 225 239
% of High School
Enrollment 5.8% 0.9% 0.7% 1.2% 1.9% 1.0% 5.8% 6.0%
16.0% 12.0% 20.4% 33.3% 18.2% 100.0%
* The majority of students in this category have enrolled from another MA community and
some have enrolled from an origin that is unknown.
% of All 2015-16 Entrances
ENTERING HIGH SCHOOL STUDENTS
2015-16 AND 2016-17 ENTRANCES AS OF OCTOBER 1, 2016
- 89 -


VI. NON-PUBLIC/PRIVATE SCHOOL STUDENTS


NON-PUBLIC/PRIVATE SCHOOL STUDENTS
This section reports on school-age children residing in Newton who are attending non-public
or private schools. A census of non-public school students is conducted each year, as
required by Massachusetts law and provides information on where Newton’s school-age
population is attending school outside of Newton Public Schools, and includes private
independent schools, private special education schools, other public schools, charter schools,
or students who are home schooled. Special education students placed out by Newton Public
Schools are included in the census. The data reported in this section is based on the 2016
non-public school student census.
Based on the 2016 census, 18.8% of the school-age population, or 2,903 students, were
enrolled in non-public schools in 2015-16. This is an increase from the previous year, when
18.1% of the school-age population (2,765 students) was enrolled in non-public schools.
Figures 1 and 2 display a history of enrollment in non-public schools in Newton. These
figures show that the number and percent of the school-age population in Newton enrolled in
non-public schools has remained relatively stable over the prior three years, with an increase
in 2015-16.
- 90 -

The chart below shows the breakdown of non-public school enrollment by type of school in
2015-16. The majority of the school-age population in Newton that is enrolled in non-public
schools is enrolled in private schools in Massachusetts.
The remainder of this section examines non-public schools enrollment at the three grade
levels and by districted Newton school.
The percentage of the school-age population attending non-public schools at the elementary,
middle, and high school grade levels over time is illustrated in Figure 3 below. There is a
consistent history of higher rates of enrollment in non-public schools at the secondary grade
levels (grades 6-12), where approximately 21% of the school-age population is enrolled in
non-public schools in 2015-16. At the middle school level, the percentage of students
enrolled in non-public schools has increased, from 20.7% in 2014-15 to 22.0%. At the high
school level, the percentage of students enrolled in non-public schools has decreased slightly
from 20.7% in 2014-15 to 20.4% in 2015-16. Elementary students continue to be enrolled in
non-public schools at a rate between 15% and 16% as they have since 2006, although the rate
has increased slightly this year.
Special
Education
Collaborative
Charter
School
Other Public
School
Home
Schooled
In-State
Private School
Out-of-State
Private School
<1% <1% <1% 2% 95% 1%
PERCENT OF NON-PUBLIC SCHOOL ENROLLMENT BY TYPE OF SCHOOL
- 91 -

Three additional tables are included in this section. Table 28 displays non-public school
enrollment by grade and Table 29 presents this information further delineated by districted
school. Table 30 displays the distribution of Newton Public Schools students who are placed
out-of-district due to the special education needs of the students by grade level and districted
school. Highlights of these tables are described below:
The number of students enrolled in non-public schools increased at the elementary
and middle school levels at similar rates, and decreased slightly at the high school
level. The overall increase at the elementary level is due to increases in kindergarten
and grade 3, while the increase at the middle school level is due to increases in grade
8.
Grade 6 and grade 9, both transition years in Newton, show increases in the number
of students enrolled at non-public schools from the prior year, +4 and +31 students,
respectively. In 2014-15, these grades showed enrollment decreases of -6 and -3
students, respectively.
Enrollment of students with special education placements attending private schools,
special education collaborative programs, or other public schools has increased
slightly from 2014-15, from 131 to 134 students, a 2% increase.
- 92 -

K 127 11.9% 188 17.7% 61 48.0%
1 156 13.5% 173 14.7% 17 10.9%
2 192 16.4% 176 15.1% -16 -8.3%
3 158 14.3% 204 17.3% 46 29.1%
4 182 15.7% 179 15.9% -3 -1.6%
5 211 17.6% 188 16.0% -23 -10.9%
Total 1,026 15.0% 1,108 16.1% 82 8.0%
6 240 20.7% 244 20.2% 4 1.7%
7 253 20.8% 261 22.3% 8 3.2%
8 239 20.6% 288 23.4% 49 20.5%
Total 732 20.7% 793 22.0% 61 8.3%
9 232 19.0% 263 21.3% 31 13.4%
10 246 20.4% 253 20.4% 7 2.8%
11 215 18.0% 242 20.3% 27 12.6%
12 314 25.1% 244 19.7% -70 -22.3%
Total 1,007 20.7% 1,002 20.4% -5 -0.5%
Grand Total 2,765 18.1% 2,903 18.8% 138 5.0%
TABLE 28
NON-PUBLIC SCHOOL STUDENTS AS PERCENT OF
TOTAL SCHOOL-AGE POPULATION
BY GRADE
% of School-Age
Population
% of School-Age
Population
N
2014-15
N
2015-16
Note: Students that are special education and beyond grade 12 are reported as grade 12.
Change from Prior
Year (N, %)Grade
- 93 -

Elementary District N
% of School
Age Population K 1 2 3 4 5 N
% of School
Age Population
Angier 74 15.5% 11 15 16 15 11 18 86 17.4%
Bowen 79 14.3% 23 11 10 18 19 11 92 17.0%
Burr 14 3.2% 5 1 8 2 2 1 19 4.4%
Cabot 82 16.4% 14 11 17 15 11 13 81 16.7%
Countryside 79 14.5% 10 17 13 10 10 8 68 13.1%
Franklin 33 7.4% 10 3 5 10 7 6 41 8.8%
Horace Mann 41 8.6% 14 5 8 7 5 11 50 10.8%
Lincoln-Eliot 27 7.4% 8 6 5 7 11 2 39 10.3%
Mason-Rice 113 19.1% 16 12 13 18 19 23 101 17.0%
Memorial-Spaulding 130 23.0% 20 26 20 29 20 32 147 24.5%
Peirce 95 23.7% 14 13 15 19 20 16 97 23.6%
Underwood 63 15.6% 8 11 6 13 8 11 57 14.9%
Ward 110 26.6% 20 18 21 23 16 24 122 28.6%
Williams 20 6.4% 6 4 4 3 6 1 24 7.6%
Zervas 66 17.6% 9 20 15 15 14 11 84 21.4%
Total Elementary 1,026 15.0% 188 173 176 204 179 188 1,108 16.1%
6 7 8
Bigelow Middle 122 19.5% 47 46 46 139 21.5%
Brown Middle 211 22.2% 67 80 84 231 22.8%
Day Middle 214 18.7% 74 67 75 216 18.9%
Oak Hill Middle 185 22.6% 56 68 83 207 25.6%
Total Middle School 732 20.7% 244 261 288 793 22.0%
9 10 11 12
Newton North 443 17.7% 131 111 106 112 460 17.9%
Newton South 564 23.8% 132 142 136 132 542 23.2%
Total High School 1007 20.7% 263 253 242 244 1002 20.4%
GRAND TOTAL 2,765 18.1% 2,903 18.8%
Notes
1) Students that are special education and beyond grade 12 are reported as grade 12.
2) Students residing in buffer zones are assigned a districted school according to the attendance percentages
of currently enrolled buffer zone resident students.
BY DISTRICTED SCHOOL AND GRADE LEVEL
NON-PUBLIC SCHOOL STUDENTS
TABLE 29
AS PERCENT OF TOTAL SCHOOL-AGE POPULATION
2015-162015-16 by Grade2014-15
- 94 -
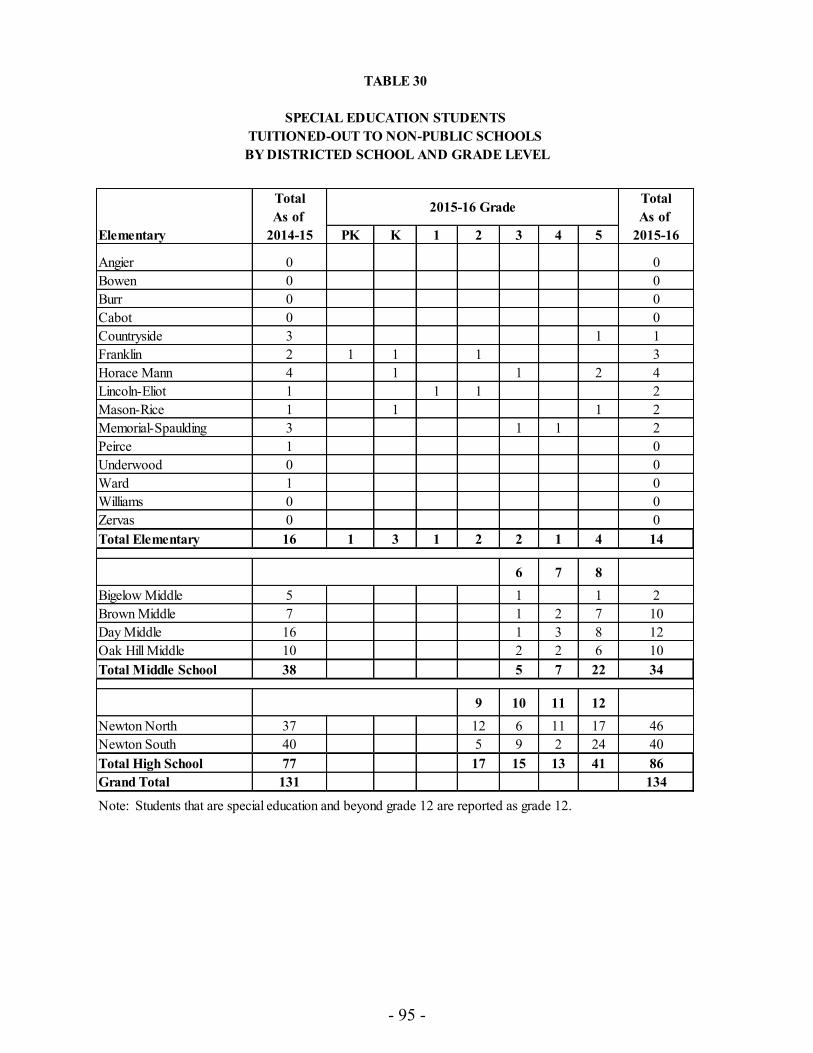
Total Total
As of As of
Elementary 2014-15 PK K 1 2 3 4 5 2015-16
Angier 0 0
Bowen 0 0
Burr 0 0
Cabot 0 0
Countryside 3 1 1
Franklin 2 1 1 1 3
Horace Mann 4 1 1 2 4
Lincoln-Eliot 1 1 1 2
Mason-Rice 1 1 1 2
Memorial-Spaulding 3 1 1 2
Peirce 1 0
Underwood 0 0
Ward 1 0
Williams 0 0
Zervas 0 0
Total Elementary 16 1 3 1 2 2 1 4 14
6 7 8
Bigelow Middle 5 1 1 2
Brown Middle 7 1 2 7 10
Day Middle 16 1 3 8 12
Oak Hill Middle 10 2 2 6 10
Total Middle School 38 5 7 22 34
9 10 11 12
Newton North 37 12 6 11 17 46
Newton South 40 5 9 2 24 40
Total High School 77 17 15 13 41 86
Grand Total 131 134
Note: Students that are special education and beyond grade 12 are reported as grade 12.
2015-16 Grade
TABLE 30
SPECIAL EDUCATION STUDENTS
TUITIONED-OUT TO NON-PUBLIC SCHOOLS
BY DISTRICTED SCHOOL AND GRADE LEVEL
- 95 -

APPENDICES
A. STUDENT POPULATION DETAIL
B. CITY OF NEWTON POPULATION
C. RESIDENTIAL PROPERTY DATA
D. NESDEC’S ENROLLMENT PROJECTIONS VS.
NEWTON’S
E. SCHOOL DISTRICTS AND BUFFER ZONES
F. RESIDENTIAL DEVELOPMENT


APPENDIX A
STUDENT POPULATION DETAIL
Demographic Information (Table 1)
Tables 1A – 1D provide demographic information for enrollments by school and by grade.
Table 1A displays the percentage of FY17 enrollment by race/ethnicity for each school and
the district. Table 1B displays the percentage of FY17 enrollment by race/ethnicity for each
grade level.
School
African
American/
Black
AsianHispanic
or Latino
American
Indian or
Alaska
Native
White
Native
Hawaiian,
Pacific
Islander
Multi-
Race,
Non-
Hispanic
Angier 421 3% 15% 5% 0% 70% 0% 6%
Bowen 417 7% 29% 5% 0.2% 54% 0% 6%
Burr 402 3% 20% 11% 0.2% 59% 0% 5%
Cabot 400 4% 13% 6% 0.0% 71% 0% 7%
Countryside 436 4% 23% 8% 0.2% 58% 0% 8%
Franklin 446 3% 13% 9% 0.2% 71% 0% 4%
Horace Mann 417 4% 18% 8% 0% 62% 0% 8%
Lincoln-Eliot 346 8% 17% 14% 0% 55% 0% 5%
Mason-Rice 507 1% 13% 4% 0% 75% 0% 7%
Memorial-Spaulding 454 3% 26% 7% 0% 59% 0% 6%
Peirce 299 4% 19% 9% 0% 61% 0.7% 6%
Underwood 313 4% 18% 12% 0% 64% 0% 3%
Ward 313 4% 15% 3% 0% 71% 0% 7%
Williams 293 3% 26% 10% 0.3% 57% 0% 4%
Zervas 337 5% 18% 5% 0.3% 64% 0.3% 7%
TOTAL ELEMENTARY 5,801 4% 19% 7% 0.1% 64% 0.1% 6%
Bigelow 525 6% 15% 10% 1% 62% 0.2% 6%
Brown 774 4% 21% 6% 0.1% 63% 0% 6%
Day 922 7% 14% 8% 0.2% 65% 0% 7%
Oak Hill 639 5% 22% 6% 0.2% 59% 0% 8%
TOTAL MIDDLE 2,860 5% 18% 7% 0.3% 62% 0% 7%
Newton North 2,145 5% 14% 9% 0.2% 66% 0.1% 5%
Newton South 1,851 6% 20% 6% 0.1% 64% 0% 4%
TOTAL HIGH SCHOOL 3,996 5% 17% 8% 0.1% 65% 0.1% 4%
GRAND TOTAL 12,657 5% 18% 8% 0.2% 64% 0% 6%
TABLE 1A
ENROLLMENTS BY RACE/ETHNICITY BY SCHOOL
FY17
Percentage of enrollment
Total
Enrollment
FY17
- 96 -

Tables 1C and 1D display the percentage of students who are low income (measured by
students qualifying for free or reduced price lunch) and the percentage of students who are
economically disadvantaged for FY16 and FY17. The economically disadvantaged indicator
is a newly tracked indicator (introduced by the state in 2015) to replace the low income
indicator, due to the introduction of the Community Eligibility Provision that no longer
requires eligibility determination. The economically disadvantaged indicator includes
students who participate in one or more of the following state-administered programs: SNAP
(Supplemental Nutrition Assistance Program), TAFDC (Transitional Aid to Families with
Dependent Children), DCF (Department of Children and Families’ foster care program), and
Medicaid (MassHealth). Both indicators are available in Newton. For FY17, the percentages
of economically disadvantaged by school and grade are estimated based on the most recent
free and reduced lunch data.
Grade
African
American/
Black
AsianHispanic
or Latino
American
Indian or
Alaska
Native
White
Native
Hawaiian,
Pacific
Islander
Multi-
Race,
Non-
Hispanic
K 885 2% 18% 7% 0% 63% 0.2% 9%
1 943 4% 20% 8% 0% 62% 0% 6%
2 1,042 5% 17% 7% 0.2% 64% 0% 6%
3 1,005 5% 20% 6% 0.2% 63% 0% 5%
4 976 4% 18% 8% 0.1% 65% 0% 6%
5 950 3% 19% 8% 0.1% 64% 0.1% 5%
TOTAL ELEMENTARY 5,801 4% 19% 7% 0.1% 64% 0.1% 6%
6 961 4% 17% 7% 0.2% 63% 0% 8%
7 972 6% 19% 8% 0.2% 60% 0% 7%
8 927 6% 17% 7% 0.4% 63% 0.1% 6%
TOTAL MIDDLE 2,860 5% 18% 7% 0.3% 62% 0% 7%
9 1,007 7% 16% 7% 0.1% 65% 0% 5%
10 1,000 5% 17% 7% 0.4% 67% 0% 4%
11 1,022 5% 18% 8% 0% 66% 0.2% 4%
12 967 5% 16% 9% 0% 64% 0% 5%
TOTAL HIGH 3,996 5% 17% 8% 0.1% 65% 0.1% 4%
GRAND TOTAL 12,657 5% 18% 8% 0.2% 64% 0% 6%
Note: Students in grade SP are included with grade 12 in this table.
Total
Enrollment
FY17
Percentage of enrollment
TABLE 1B
ENROLLMENTS BY RACE/ETHNICITY BY GRADE
FY17
- 97 -

School
Low
Income
FY16
Low
Income
FY17
% Point
Change
Eco.
Disadv.
FY16
Eco.
Disadv.
FY17*
% Point
Change
Angier 421 8% 7% -1% 5% 3% -2%
Bowen 417 11% 13% 2% 8% 8% 0%
Burr 402 9% 10% 1% 7% 6% -1%
Cabot 400 9% 12% 3% 7% 5% -2%
Countryside 436 14% 13% -1% 9% 8% -1%
Franklin 446 11% 13% 2% 8% 8% 0%
Horace Mann 417 14% 15% 1% 9% 10% 1%
Lincoln-Eliot 346 28% 28% 0% 18% 14% -4%
Mason-Rice 507 5% 5% 0% 3% 3% 0%
Memorial-Spaulding 454 10% 10% 0% 9% 6% -3%
Peirce 299 9% 11% 2% 4% 6% 2%
Underwood 313 14% 16% 2% 11% 11% 0%
Ward 313 7% 6% -1% 4% 4% 0%
Williams 293 9% 8% -1% 7% 4% -3%
Zervas 337 13% 13% 0% 10% 9% -1%
TOTAL ELEMENTARY 5,801 11% 12% 1% 8% 7% -1%
Bigelow 525 19% 20% 1% 10% 9% -1%
Brown 774 10% 10% 0% 6% 5% -1%
Day 922 12% 15% 3% 7% 8% 1%
Oak Hill 639 13% 14% 1% 8% 8% 0%
TOTAL MIDDLE 2,860 13% 14% 1% 8% 7% -1%
Newton North 2,145 17% 18% 1% 10% 10% 0%
Newton South 1,851 13% 14% 1% 8% 8% 0%
TOTAL HIGH SCHOOL 3,996 15% 16% 1% 9% 9% 0%
GRAND TOTAL 12,657 13% 14% 1% 8% 8% 0%
Total
Enrollment
FY17
Percentage of enrollment
*Economically Disadvantaged percentages for FY17 are estimates based on FY17 free and reduced
price lunch data.
TABLE 1C
ENROLLMENTS BY LOW INCOME AND ECONOMICALLY DISADVANTAGED
BY SCHOOL
FY17
- 98 -

Grade
Low
Income
FY16
Low
Income
FY17
% Point
Change
Eco.
Disadv.
FY16
Eco.
Disadv.
FY17*
% Point
Change
K 885 10% 7% -3% 8% 5% -3%
1 943 10% 12% 2% 7% 7% 0%
2 1042 13% 11% -2% 9% 7% -2%
3 1005 11% 14% 3% 8% 8% 0%
4 976 12% 13% 1% 8% 7% -1%
5 950 12% 14% 2% 7% 7% 0%
TOTAL ELEMENTARY 5,801 11% 12% 1% 8% 7% -1%
6 961 14% 14% 0% 7% 7% 0%
7 972 13% 15% 2% 8% 7% -1%
8 927 12% 14% 2% 7% 8% 1%
TOTAL MIDDLE 2,860 13% 14% 1% 8% 7% -1%
9 1007 14% 14% 0% 9% 8% -1%
10 1000 14% 16% 2% 8% 10% 2%
11 1022 18% 15% -3% 10% 7% -3%
12 967 15% 20% 5% 9% 11% 2%
TOTAL HIGH 3,996 15% 16% 1% 9% 9% 0%
GRAND TOTAL 12,657 13% 14% 1% 8% 8% 0%
Note: Students in grade SP are included with grade 12 in this table.
*Economically Disadvantaged percentages for FY17 are estimates based on FY17 free and reduced
price lunch data.
Total
Enrollment
FY17
Percentage of enrollment
TABLE 1D
ENROLLMENTS BY LOW INCOME AND ECONOMICALLY DISADVANTAGED
BY GRADE
FY17
- 99 -

Preschool Enrollment (Table 2)
Table 2 displays preschool enrollment in Newton for 2016-16 and 2015-16. Preschool
enrollment as of October 1, 2016 is 195 students, an increase of 6 students from the prior
year. The majority of current preschool students (68%) are receiving special education
services. Table 2A displays the nature of disability for current preschool students.
Category 2015-16 2016-17 Difference % Change
Role Model Students 85 62 -23 -27.1%
Students Receiving Services 104 133 29 27.9%
TOTAL 189 195 6 3.2%
Type of Need
Developmental Delay (ages 3 to 9 only)
Typically Developing/Role Model
Communication
Autism
Neurological
Health
Sensory/Hard of Hearing or Deaf
Emotional
TOTAL
Number of Students
PRESCHOOL STUDENTS
OCTOBER 1, 2016
TABLE 2
PRESCHOOL STUDENTS
OCTOBER 1, 2015 AND OCTOBER 1, 2016
TABLE 2A
195
63
62
35
20
6
5
3
1
- 100 -

METCO Enrollment (Table 3)
The number of students participating in the METCO Program in the Newton Schools as of
October 1, 2016 is 428. Of the 428 students, 46% are enrolled in the elementary schools,
24% are at the middle schools, and 30% are at the high schools.
K 1 2 3 4 5
Angier 2 2 3 4 11
Bowen 3 2 5 4 4 18
Burr 2 3 5
Cabot 1 5 4 3 1 14
Countryside 6 4 10
Franklin 1 2 2 4 2 1 12
Horace Mann 1 4 2 2 1 10
Lincoln-Eliot 2 5 1 4 4 16
Mason-Rice 1 6 2 1 10
Memorial-Spaulding 1 4 4 2 1 12
Peirce 2 4 4 1 1 2 14
Underwood 1 2 4 5 5 3 20
Ward 2 2 3 4 2 1 14
Williams 2 3 2 7 14
Zervas 1 1 3 6 2 3 16
Total Elementary 15 37 42 42 38 22 0 196
45.8%
6 7 8
6 5 12 23
5 9 6 20
8 13 10 31
8 8 13 29
27 35 41 0 103
24.1%
9 10 11 12
22 14 12 19 1 68
24 12 11 14 61
46 26 23 33 1 129
30.1%
428
* The enrollment includes students who receive special education services outside the regular classroom for a
significant amount of time.
Bigelow
Brown
Day
Oak Hill
Grand Total
North High
South High
Total High School
Total Middle
Grade level as % of all METCO students
Grade level as % of all METCO students
TABLE 3
BY SCHOOL AND GRADEGrade
2016-17 METCO ENROLLMENT
SchoolSpecial
Education*Total
Grade level as % of all METCO students
- 101 -
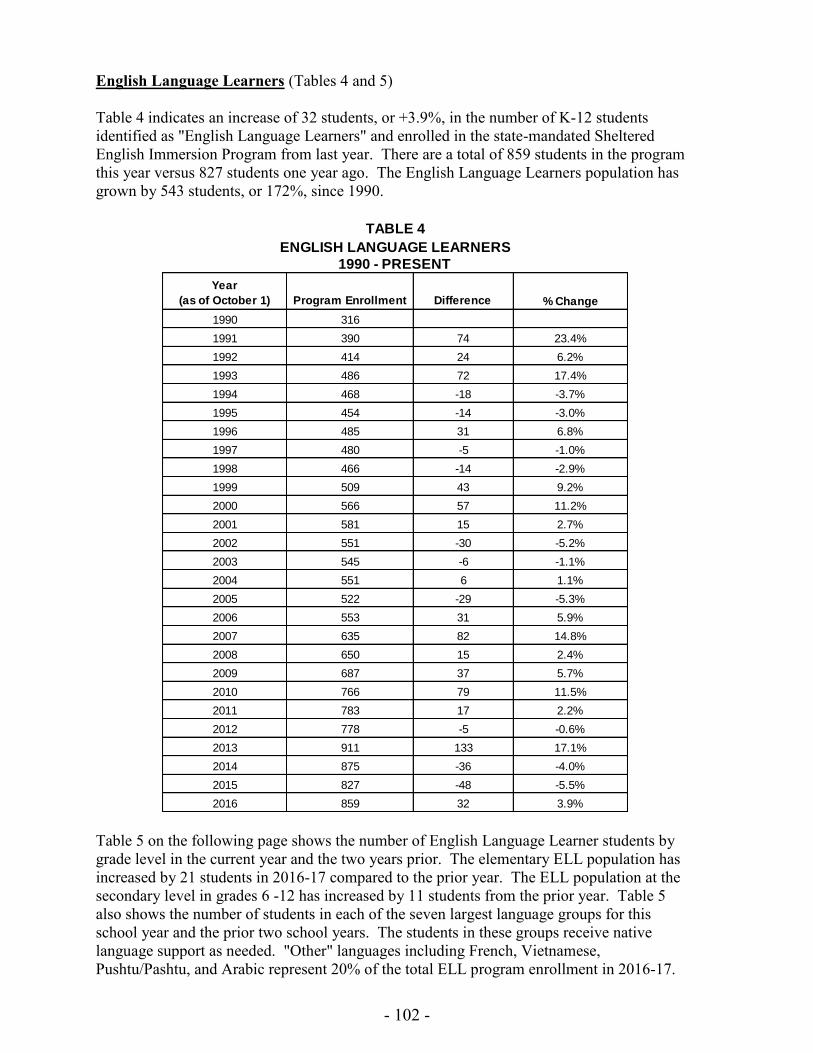
English Language Learners (Tables 4 and 5)
Table 4 indicates an increase of 32 students, or +3.9%, in the number of K-12 students
identified as "English Language Learners" and enrolled in the state-mandated Sheltered
English Immersion Program from last year. There are a total of 859 students in the program
this year versus 827 students one year ago. The English Language Learners population has
grown by 543 students, or 172%, since 1990.
Table 5 on the following page shows the number of English Language Learner students by
grade level in the current year and the two years prior. The elementary ELL population has
increased by 21 students in 2016-17 compared to the prior year. The ELL population at the
secondary level in grades 6 -12 has increased by 11 students from the prior year. Table 5
also shows the number of students in each of the seven largest language groups for this
school year and the prior two school years. The students in these groups receive native
language support as needed. "Other" languages including French, Vietnamese,
Pushtu/Pashtu, and Arabic represent 20% of the total ELL program enrollment in 2016-17.
Year
(as of October 1) Program Enrollment Difference % Change
1990 316
1991 390 74 23.4%
1992 414 24 6.2%
1993 486 72 17.4%
1994 468 -18 -3.7%
1995 454 -14 -3.0%
1996 485 31 6.8%
1997 480 -5 -1.0%
1998 466 -14 -2.9%
1999 509 43 9.2%
2000 566 57 11.2%
2001 581 15 2.7%
2002 551 -30 -5.2%
2003 545 -6 -1.1%
2004 551 6 1.1%
2005 522 -29 -5.3%
2006 553 31 5.9%
2007 635 82 14.8%
2008 650 15 2.4%
2009 687 37 5.7%
2010 766 79 11.5%
2011 783 17 2.2%
2012 778 -5 -0.6%
2013 911 133 17.1%
2014 875 -36 -4.0%
2015 827 -48 -5.5%
2016 859 32 3.9%
TABLE 4
1990 - PRESENT
ENGLISH LANGUAGE LEARNERS
- 102 -

LA
NG
UA
GE
K-5
6-1
2T
ota
lK
-56-1
2T
ota
lK
-56-1
2T
ota
lK
-56-1
2T
ota
lK
-56-1
2T
ota
l
Chin
ese (
All
Form
s)
174
69
243
157
86
243
-17
17
0154
89
243
-33
0
Russia
n108
13
121
102
16
118
-63
-396
11
107
-6-5
-11
Spanis
h69
30
99
76
23
99
7-7
067
43
110
-920
11
Kore
an
39
25
64
37
11
48
-2-1
4-1
634
842
-3-3
-6
Japanese
35
10
45
29
534
-6-5
-11
39
746
10
212
Hebre
w55
16
71
51
12
63
-4-4
-866
21
87
15
924
Port
uguese
29
19
48
21
17
38
-8-2
-10
35
15
50
14
-212
Oth
er
127
57
184
117
67
184
-10
10
0120
54
174
3-1
3-1
0
TO
TA
L636
239
875
590
237
827
-46
-2-4
8611
248
859
21
11
32
TR
EN
DS
OV
ER
TH
RE
E Y
EA
RS
2015-1
6 v
s. 2
016-1
7
TA
BL
E 5
BY
FIR
ST
LA
NG
UA
GE
AN
D G
RA
DE
LE
VE
L
2014-1
5 v
s. 2
015-1
6
EN
GL
ISH
LA
NG
UA
GE
LE
AR
NE
RS
Dif
fere
nce
Dif
fere
nce
20
16
-17
20
15
-16
20
14
-15
- 103 -

Students with Special Education Services (Table 6)
The following table reports five years of enrollment history of students requiring special
education services by placement type and grade level, which has been stable. Program
placement type is defined according to the time out of the regular classroom environment
required by a special education placement. The majority of students with special education
services are fully included in the general education classroom, with less than 21% of time
spent outside of the classroom. For all grade levels combined, the percentage of students
receiving special education services in the Newton Public Schools this year is 19.1%. This is
an increase of 17 students from last school year; however, the percentage of special
education students compared to district enrollment is slightly lower than last year, as overall
enrollment also increased this year. There are more special education students at the
elementary and middle grade levels this year, with 872 students (15.0% of total elementary
enrollment) and 604 students (21.1% of total middle enrollment) respectively, versus 860
students (14.9% of elementary enrollment) at the elementary level last year and 597 students
(21.2% of middle enrollment) at the middle school level last year. There is a decrease of 2
students receiving special education services at the high school level. This year, there has
been a slight increase in out of district placements as of October 2016, with slightly more
students placed out of district to private special education schools (128 students vs. 123 in
October 2015 and 126 in October 2014).
Ten year trends in the distribution of students by special education placement and grade level
are illustrated in the graph at the end of the section.
TABLE 6
DISTRIBUTION OF STUDENTS RECEIVING SPECIAL EDUCATION SERVICES
Level 10 20 40* 41* 50 60* 70 90
% of Time Outside Classroom <21% 21-60% >60% 100% 100% 100% 100% 100%
Elementary 775 37 49 2 8 1 0 0 872 15.0%
Middle 419 116 44 1 24 0 0 0 604 21.1%
High 628 111 113 12 60 18 0 2 944 23.6%
Total 1,822 264 206 15 92 19 0 2 2,420 19.1%
Level 10 20 40* 41* 50 60* 70 90
% of Time Outside Classroom <21% 21-60% >60% 100% 100% 100% 100% 100%
Elementary 758 77 16 1 8 0 0 0 860 14.9%
Middle 401 121 41 3 29 2 0 0 597 21.2%
High 627 132 107 7 50 19 0 4 946 24.2%
Total 1,786 330 164 11 87 21 0 4 2,403 19.2%
**Pre-school students are not included. If Pre-school students (107) were included in this table, the total Special Education population
would be 2,510 (20.1%).
October 2015
Level of Service
Total Special
Education**
% of Total
Enrollment
*The Level of Service of "40" is the highest level of service within Newton Public Schools and is defined as "All ages, in a substantially
separate classroom"; "41" and "50" is "All ages, in a Public/Private Separate Day School"; "60" and higher is "All ages, in a Residential
School." Tuitioned out students are included in codes "41" and higher.
**Pre-school students are not included. If Pre-school students (133) were included in this table, the total Special Education population
would be 2,553 (20.2%).
October 2016
Level of Service
Total Special
Education**
% of Total
Enrollment
*The Level of Service of "40" is the highest level of service within Newton Public Schools and is defined as "All ages, in a substantially
separate classroom"; "41" and "50" is "All ages, in a Public/Private Separate Day School"; "60" and higher is "All ages, in a Residential
School." Tuitioned out students are included in codes "41" and higher.
- 104 -

TABLE 6 (Continued) DISTRIBUTION OF STUDENTS RECEIVING SPECIAL EDUCATION SERVICES
TEN YEAR TRENDS PERCENTAGE OF STUDENTS RECEIVING SPECIAL EDUCATION SERVICES
Level 10 20 40* 41* 50 60* 70 90
% of Time Outside Classroom <21% 21-60% >60% 100% 100% 100% 100% 100%
Elementary 749 79 14 2 9 0 0 853 14.6%
Middle 416 132 54 5 30 0 1 638 22.7%
High 587 139 93 10 57 9 0 3 898 23.2%
Total 1,752 350 161 17 96 9 0 4 2,389 19.1%
Level 10 20 40* 41* 50 60* 70 90
% of Time Outside Classroom <21% 21-60% >60% 100% 100% 100% 100% 100%
Elementary 728 71 12 2 13 0 0 0 826 14.2%
Middle 424 139 43 4 31 1 0 0 642 22.5%
High 585 128 97 6 67 9 0 3 895 23.6%
Total 1,737 338 152 12 111 10 0 3 2,363 19.0%
Level 10 20 40* 41* 50 60* 70 90
% of Time Outside Classroom <21% 21-60% >60% 100% 100% 100% 100% 100%
Elementary 717 67 35 1 18 0 0 0 838 14.5%
Middle 425 129 24 2 26 2 0 0 608 22.4%
High 548 130 96 8 73 13 0 3 871 23.8%
Total 1,690 326 155 11 117 15 0 3 2,317 19.0%
October 2012
Level of Service
Total Special
Education**
% of Total
Enrollment
*The Level of Service of "40" is the highest level of service within Newton Public Schools and is defined as "All ages, in a substantially
separate classroom"; "41" and "50" is "All ages, in a Public/Private Separate Day School"; "60" and higher is "All ages, in a Residential
School." Tuitioned out students are included in codes "41" and higher.
**Pre-school students are not included. If Pre-school students (122) were included in this table, the total Special Education population
would be 2,439 (19.6%).
October 2014
Level of Service
Total Special
Education**
% of Total
Enrollment
*The Level of Service of "40" is the highest level of service within Newton Public Schools and is defined as "All ages, in a substantially
separate classroom"; "41" and "50" is "All ages, in a Public/Private Separate Day School"; "60" and higher is "All ages, in a Residential
School." Tuitioned out students are included in codes "41" and higher.
**Pre-school students are not included. If Pre-school students (131) were included in this table, the total Special Education population
would be 2,520 (20.2%).
**Pre-school students are not included. If Pre-school students (112) were included in this table, the total Special Education population
would be 2,475 (19.9%).
October 2013
Level of Service
Total Special
Education**
% of Total
Enrollment
*The Level of Service of "40" is the highest level of service within Newton Public Schools and is defined as "All ages, in a substantially
separate classroom"; "41" and "50" is "All ages, in a Public/Private Separate Day School"; "60" and higher is "All ages, in a Residential
School." Tuitioned out students are included in codes "41" and higher.
- 105 -

Non-Resident Students (Table 7)
The number of non-resident students attending the Newton Public Schools increased by 7
students since last year, or 1.2%, and is currently 599 students.
Category 2015-16 2016-17 Difference % Change
METCO Program Students 429 428 -1 -0.2%
Tuition-In Students 2 0 -2 -100.0%
Hearing Impaired (EDCO) 20 22 2 10.0%
Faculty Children 110 116 6 5.5%
Approved to Attend* 15 11 -4 -26.7%
Foreign Exchange Student 16 22 6 37.5%
TOTAL 592 599 7 1.2%
TABLE 7
NON-RESIDENT STUDENTS
OCTOBER 1, 2015 AND OCTOBER 1, 2016
* Students may be "Approved to Attend" for reasons including status as a homeless student or state
ward, or due to another time-limited residency issue.
- 106 -

Age Range1990
Census*2000
Census*2010
Census*
Change 2010 Census vs. 2000
Census % Change
0-4 4,423 4,401 4,497 96 2.2%
5-9 4,411 5,014 5,290 276 5.5%
10-14 3,935 5,267 5,336 69 1.3%
15-19 6,800 6,653 8,017 1,364 20.5%
20-24 7,189 5,133 5,594 461 9.0%
25-34 13,609 10,809 8,268 (2,541) -23.5%
35-44 13,590 12,823 10,755 (2,068) -16.1%
45-54 9,025 13,400 12,621 (779) -5.8%
55-59 3,569 4,408 6,132 1,724 39.1%
60-64 3,743 3,281 5,657 2,376 72.4%
65-74 6,449 5,918 6,197 279 4.7%
75-84 4,248 4,667 4,294 (373) -8.0%
85 and Older 1,594 2,055 2,488 433 21.1%
Grand Total 82,585 83,829 85,146 1,317 1.6%
*Source: U.S. Census Bureau, City of Newton, Massachusetts Census
City of Newton, Massachusetts Population Growth
APPENDIX B
TABLE 8
- 107 -

School District 2005 2006 2007 2008 2009 2010 2011 2012 2013 2014 2015 2016*Angier 64 60 71 42 50 45 68 58 70 67 78 64Angier/Williams 6 7 6 6 9 7 7 7 13 8 4 3Angier/Zervas 25 19Bowen 172 142 142 128 144 153 134 165 76 95 62 51Bowen/Mason-Rice 9 9 8 7 6 6 13 15 18 24 9 4Bowen/Memorial Spaulding 64 65 54 29Bowen/Ward 10 24 17 8Burr 65 41 45 39 45 36 54 55 51 60 47 40Burr/Williams 9 6 6 3 5 5 6 7 12 6 0 0Cabot 90 76 77 68 48 81 46 91 82 80 78 45Countryside 79 55 69 61 50 66 64 70 61 81 109 48Countryside/Angier 49 45 59 32 39 33 31 42 35 56 0 0Countryside/Bowen 13 12 11 12 14 11 10 5 12 12 13 10Countryside/Memorial-Spaulding 3 2 1 3 2 5 4 1 2 4 2 1Countryside/Zervas 2 2 1 1 1 1 1 1 2 2 0 0Franklin 62 55 74 45 55 77 66 66 66 97 69 41Franklin/Burr 5 7 12 8 15 9 5 15 12 17 10 7Franklin/Horace Mann 7 7 4 7 6 9 3 8 4 9 2 1Horace Mann 50 43 56 37 38 49 32 52 53 56 41 31Horace Mann/Cabot 5 1Horace Mann/Lincoln-Eliot 7 7 11 5 4 4 7 9 13 8 8 6Lincoln-Eliot 69 77 69 42 43 47 49 62 66 65 59 39Mason-Rice 65 56 84 69 52 52 50 67 57 71 75 30Mason-Rice/Ward 15 4 12 11 6 6 4 12 11 12 11 9Memorial-Spaulding 111 91 92 77 91 100 94 114 98 111 117 77Peirce 40 54 59 43 34 39 33 49 47 38 43 37Underwood 72 65 54 56 56 48 55 76 73 67 76 42Underwood/Ward 4 0 1 5 0 1 1 2 3 3 2 2Ward 59 53 56 105 52 40 62 62 54 59 68 48Williams 35 61 32 21 33 28 31 33 41 41 38 18Williams/Peirce 12 10 9 14 4 10 10 18 13 15 12 7Zervas 52 39 52 47 45 45 43 52 46 57 79 63Zervas/Mason-Rice 1 3 0 1 1 0 2 2 0 1 0 0
Totals 1,227 1,089 1,173 995 948 1,013 985 1,216 1,165 1,311 1,213 781
* Calendar Year 2016 information is from January 1, 2016 to August 30, 2016.
Residential Property Sales by District January 2005 to August 2016CITY OF NEWTON
APPENDIX CTABLE 9
- 108 -

APPE
NDIX C
TABLE 10
PROPE
RTIES LISTED
FOR SA
LE IN
NEW
TON, M
A. BY ELEM
ENTA
RY DISTR
ICT
SIN
GL
E F
AM
ILY
- S
F
CO
ND
O -
C M
UL
TI-
FA
MIL
Y -
MF
Sch
oo
l Dis
tric
t
Nu
mb
er o
f T
axab
le
Pro
per
ties
% F
or
Sal
eN
um
ber
fo
r S
ale
Nu
mb
er
for
Sal
e L
ast
Yea
r2
B.R
.3
B.R
.4
B.R
. 5
B.R
. 6+
B
.R.
1 B
.R.
2 B
.R.
3 B
.R.
4 B
.R.
5+ B
.R.
3 B
.R.
4 B
.R.
5+ B
.R.
SF
CM
F
Ang
ier
1,39
51.
0%14
233
24
510
0%0%
0%10
0%B
owen
1,27
91.
3%17
92
12
33
21
347
%53
%0%
100%
Bur
r1,
280
0.3%
45
11
11
50%
50%
0%10
0%C
abot
1,93
00.
6%11
101
22
33
27%
73%
0%10
0%C
ount
rysi
de1,
423
0.8%
1222
12
12
15
57%
42%
0%99
%F
rank
lin1,
704
0.4%
65
21
11
167
%33
%0%
100%
Hor
ace
Man
n1,
313
0.8%
116
13
21
22
64%
36%
0%10
0%Li
ncol
n-E
liot
1,53
40.
5%8
81
31
362
%38
%0%
99%
Mas
on-R
ice
1,72
80.
6%10
71
13
41
90%
10%
0%10
0%M
emor
ial-S
paul
ding
2,11
31.
1%24
251
34
95
292
%8%
0%10
0%P
eirc
e1,
012
1.0%
1010
14
510
0%0%
0%10
0%U
nder
woo
d1,
432
1.0%
1419
32
31
11
364
%36
%0%
100%
War
d1,
395
0.7%
1013
13
41
190
%10
%0%
100%
Will
iam
s75
81.
2%9
23
41
189
%11
%0%
100%
Zer
vas
1,23
80.
6%8
222
12
11
175
%25
%0%
100%
Ang
ier
/ Will
iam
s14
61
Ang
ier/
Zer
vas
963.
1%3
12
100%
0%0%
100%
Bow
en /
Mas
on R
ice
611
Bow
en/M
emor
ial-S
paul
ding
854
1.1%
95
22
32
22%
78%
0%10
0%B
owen
/ W
ard
101
4.0%
44
100%
0%0%
100%
Bur
r / W
illia
ms
124
Cou
ntry
side
/ A
ngie
r81
8C
ount
rysi
de/B
owen
321
0.3%
11
110
0%0%
0%10
0%C
ount
rysi
de /
Mem
oria
l Spa
uldi
ng66
6.1%
41
11
175
%25
%0%
100%
Cou
ntry
side
/Zer
vas
34F
rank
lin/B
urr
195
0.5%
11
100%
0%0%
100%
Fra
nklin
/ H
orac
e M
ann
146
Hor
ace
Man
n / C
abot
454.
4%2
11
0%10
0%0%
100%
Hor
ace
Man
n/Li
ncol
n-E
liot
176
2.3%
43
11
225
%75
%0%
100%
Mas
on-R
ice
/ War
d27
72
Und
erw
ood/
War
d76
1W
illia
ms/
Pei
rce
246
1.2%
34
12
33%
67%
0%10
0%Z
erva
s/M
ason
-Ric
e50
To
tal
25,9
160.
8%19
920
32
2727
4538
619
1213
100
00
70%
30%
0%10
0%
Last
Yea
r's P
rope
rty
Mix
203
228
4641
307
1112
96
14
6D
iffer
ence
-40
-1-1
94
8-1
80
44
-1-4
-6%
Diff
eren
ce-2
%0%
-4%
-41%
10%
27%
-14%
73%
0%44
%67
%-1
00%
-100
%
Not
e: T
his
data
cam
e fr
om M
LS L
istin
gs o
f res
iden
tial p
rope
rtie
s fo
r sa
le in
New
ton,
Ma.
as
of N
ovem
ber
2016
and
is s
ubje
ct to
cha
nge
on a
dai
ly b
asis
. O
nly
listin
gs c
lass
ified
as
"act
ive"
are
incl
uded
. T
here
may
be
othe
r pr
oper
ties
for
sale
in N
ewto
n th
at a
re n
ot c
onta
ined
on
this
list
ing
serv
ice.
The
num
ber
of ta
xabl
e pr
oper
ties
is u
pdat
ed a
s of
Nov
201
4.
% B
Y T
YP
E
- 109 -

NESDEC's Projections vs Newton's Projections
Grades K through 12
LevelFY18
2017-18FY19
2018-19FY20
2019-20FY21
2020-21FY22
2021-22Elementary 5,845 5,853 5,822 5,738 5,762Middle 2,872 2,855 2,888 3,014 3,015High School 3,974 4,020 4,077 4,070 4,104Special Education 96 96 96 96 96Total 12,787 12,824 12,883 12,918 12,977
LevelFY18
2017-18FY19
2018-19FY20
2019-20FY21
2020-21FY22
2021-22Elementary 5,865 5,893 5,876 5,790 5,806Middle 2,856 2,840 2,867 2,970 2,973High School 3,975 4,021 4,071 4,060 4,095Special Education 96 96 96 96 96Total 12,792 12,850 12,910 12,916 12,970
LevelFY18
2017-18FY19
2018-19FY20
2019-20FY21
2020-21FY22
2021-22Elementary -20 -40 -54 -52 -44Middle 16 15 21 44 42High School -1 -1 6 10 9Special Education 0 0 0 0 0Total -5 -26 -27 2 7
LevelFY18
2017-18FY19
2018-19FY20
2019-20FY21
2020-21FY22
2021-22Kindergarten 902 899 894 904 906
LevelFY18
2017-18FY19
2018-19FY20
2019-20FY21
2020-21FY22
2021-22Kindergarten 921 910 905 876 901
LevelFY18
2017-18FY19
2018-19FY20
2019-20FY21
2020-21FY22
2021-22Kindergarten -19 -11 -11 28 5
*Note: All non-resident students have been added to NESDEC's projections.
Newton's Projections
NESDEC's Projections*
Difference
APPENDIX D
TABLE 11
Newton's Projections
NESDEC's Projections*
Difference
Kindergarten Only
- 110 -

AP
PE
ND
IX E
TA
BL
E 1
2E
lem
enta
ry S
tud
ents
by
Dis
tric
t w
ith
Bu
ffer
Zo
nes
Oct
ob
er 2
016
Ele
men
tary
Dis
tric
tS
choo
l Atte
ndin
gK
12
34
5T
otal
Tot
al S
tude
nts
in
Dis
tric
t inc
ludi
ng
Out
-of-
Ass
igne
d D
istr
ict S
tude
nts
2016
-17
% o
f D
istr
ict
2016
-17
% o
f Tot
al
Stu
dent
s
2015
-16
Num
ber
of
Stu
dent
s
2014
-15
Num
ber
of
Stu
dent
s
Bu
ffer
Zo
nes
AN
GIE
R-C
OU
NT
RY
SID
EA
ngie
r59
(Stu
dent
Ass
ignm
ent C
hang
e 20
15-1
6)C
ount
rysi
de12
7(Z
one
Elim
inat
ed)
Sub
tota
l18
6
AN
GIE
R-W
ILLI
AM
SA
ngie
r0
00
10
12
7%0%
126
(Stu
dent
Ass
ignm
ent C
hang
e 20
15-1
6)W
illia
ms
26
38
35
2793
%0%
2627
(Zon
e B
ound
ary
Cha
nge)
Sub
tota
l2
63
93
629
2910
0%1%
2753
AN
GIE
R-Z
ER
VA
SA
ngie
r7
75
18
331
78%
1%28
(Stu
dent
Ass
ignm
ent C
hang
e 20
15-1
6)Z
erva
s2
04
02
19
23%
0%1
(New
Zon
e )S
ubto
tal
97
91
104
4076
100%
1%29
BO
WE
N-C
OU
NT
RY
SID
EB
owen
10
64
62
1933
%0%
1818
(Exp
ande
d in
201
1-12
)C
ount
rysi
de0
79
66
1038
67%
1%45
45S
ubto
tal
17
1510
1212
5758
100%
1%63
63
BO
WE
N-M
AS
ON
-RIC
EB
owen
75
510
47
3878
%1%
4090
(Stu
dent
Ass
ignm
ent C
hang
e 20
15-1
6)M
ason
-Ric
e1
33
02
211
22%
0%8
44(Z
one
Bou
ndar
y C
hang
e)S
ubto
tal
88
810
69
4951
100%
1%48
134
BO
WE
N-M
EM
OR
IAL-
SP
AU
LDIN
GB
owen
66
615
411
4889
%1%
5561
(New
in 2
014-
15)
Mem
oria
l-Spa
uldi
ng3
30
00
06
11%
0%5
1S
ubto
tal
99
615
411
5458
100%
1%60
62
BO
WE
N-W
AR
DB
owen
37
16
13
2188
%0%
2121
(New
in 2
014-
15)
War
d1
00
10
13
13%
0%2
1S
ubto
tal
47
17
14
2424
100%
0%23
22
BU
RR
-FR
AN
KLI
NB
urr
38
33
44
2557
%0%
2016
(Exp
ande
d in
201
2-13
)F
rank
lin2
26
32
419
43%
0%24
21S
ubto
tal
510
96
68
4444
100%
1%44
37
BU
RR
-WIL
LIA
MS
Bur
r33
(Stu
dent
Ass
ignm
ent C
hang
e 20
15-1
6)W
illia
ms
35(Z
one
Elim
inat
ed)
Sub
tota
l68
CA
BO
T-H
OR
AC
E M
AN
NC
abot
12
00
00
318
%0%
2(S
tude
nt A
ssig
nmen
t Cha
nge
2015
-16)
Hor
ace
Man
n0
21
46
114
82%
0%18
(New
Zon
e )S
ubto
tal
14
14
61
1717
100%
0%20
CO
UN
TR
YS
IDE
-ME
MO
RIA
L-S
PA
ULD
ING
Cou
ntry
side
10
00
00
14%
0%0
0(E
xpan
ded
in 2
016-
17)
Mem
oria
l-Spa
uldi
ng1
92
23
1027
96%
0%3
3S
ubto
tal
29
22
310
2830
100%
1%3
3
CO
UN
TR
YS
IDE
-ZE
RV
AS
Cou
ntry
side
46
46
45
2976
%1%
311
(Stu
dent
Ass
ignm
ent C
hang
e 20
15-1
6)Z
erva
s1
22
22
09
24%
0%1
0(Z
one
Bou
ndar
y C
hang
e)S
ubto
tal
58
68
65
3846
100%
1%32
1
- 111 -
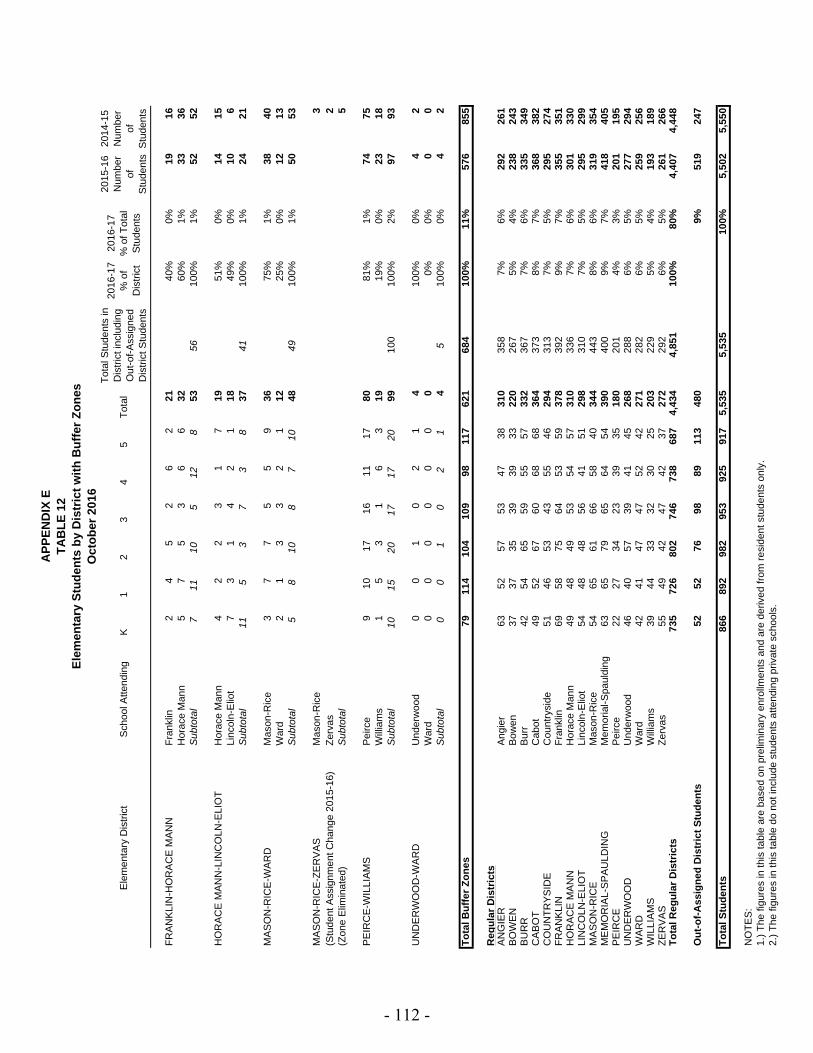
AP
PE
ND
IX E
TA
BL
E 1
2E
lem
enta
ry S
tud
ents
by
Dis
tric
t w
ith
Bu
ffer
Zo
nes
Oct
ob
er 2
016
Ele
men
tary
Dis
tric
tS
choo
l Atte
ndin
gK
12
34
5T
otal
Tot
al S
tude
nts
in
Dis
tric
t inc
ludi
ng
Out
-of-
Ass
igne
d D
istr
ict S
tude
nts
2016
-17
% o
f D
istr
ict
2016
-17
% o
f Tot
al
Stu
dent
s
2015
-16
Num
ber
of
Stu
dent
s
2014
-15
Num
ber
of
Stu
dent
s
FR
AN
KLI
N-H
OR
AC
E M
AN
NF
rank
lin2
45
26
221
40%
0%19
16H
orac
e M
ann
57
53
66
3260
%1%
3336
Sub
tota
l7
1110
512
853
5610
0%1%
5252
HO
RA
CE
MA
NN
-LIN
CO
LN-E
LIO
TH
orac
e M
ann
42
23
17
1951
%0%
1415
Linc
oln-
Elio
t7
31
42
118
49%
0%10
6S
ubto
tal
115
37
38
3741
100%
1%24
21
MA
SO
N-R
ICE
-WA
RD
Mas
on-R
ice
37
75
59
3675
%1%
3840
War
d2
13
32
112
25%
0%12
13S
ubto
tal
58
108
710
4849
100%
1%50
53
MA
SO
N-R
ICE
-ZE
RV
AS
Mas
on-R
ice
3(S
tude
nt A
ssig
nmen
t Cha
nge
2015
-16)
Zer
vas
2(Z
one
Elim
inat
ed)
Sub
tota
l5
PE
IRC
E-W
ILLI
AM
SP
eirc
e9
1017
1611
1780
81%
1%74
75W
illia
ms
15
31
63
1919
%0%
2318
Sub
tota
l10
1520
1717
2099
100
100%
2%97
93
UN
DE
RW
OO
D-W
AR
DU
nder
woo
d0
01
02
14
100%
0%4
2W
ard
00
00
00
00%
0%0
0S
ubto
tal
00
10
21
45
100%
0%4
2
To
tal B
uff
er Z
on
es79
114
104
109
9811
762
168
410
0%11
%57
685
5
Re
gu
lar
Dis
tric
tsA
NG
IER
Ang
ier
6352
5753
4738
310
358
7%6%
292
261
BO
WE
NB
owen
3737
3539
3933
220
267
5%4%
238
243
BU
RR
Bur
r42
5465
5955
5733
236
77%
6%33
534
9C
AB
OT
Cab
ot49
5267
6068
6836
437
38%
7%36
838
2C
OU
NT
RY
SID
EC
ount
rysi
de51
4653
4355
4629
431
37%
5%29
527
4F
RA
NK
LIN
Fra
nklin
6958
7564
5359
378
392
9%7%
355
351
HO
RA
CE
MA
NN
Hor
ace
Man
n49
4849
5354
5731
033
67%
6%30
133
0LI
NC
OLN
-ELI
OT
Linc
oln-
Elio
t54
4848
5641
5129
831
07%
5%29
529
9M
AS
ON
-RIC
EM
ason
-Ric
e54
6561
6658
4034
444
38%
6%31
935
4M
EM
OR
IAL-
SP
AU
LDIN
GM
emor
ial-S
paul
ding
6365
7965
6454
390
400
9%7%
418
405
PE
IRC
EP
eirc
e22
2734
2339
3518
020
14%
3%20
119
5U
ND
ER
WO
OD
Und
erw
ood
4640
5739
4145
268
288
6%5%
277
294
WA
RD
War
d42
4147
4752
4227
128
26%
5%25
925
6W
ILLI
AM
SW
illia
ms
3944
3332
3025
203
229
5%4%
193
189
ZE
RV
AS
Zer
vas
5549
4247
4237
272
292
6%5%
261
266
To
tal R
egu
lar
Dis
tric
ts73
572
680
274
673
868
74,
434
4,85
110
0%80
%4,
407
4,44
8
Ou
t-o
f-A
ssig
ned
Dis
tric
t S
tud
ents
5252
7698
8911
348
09%
519
247
To
tal S
tud
ents
866
892
982
953
925
917
5,53
55,
535
100%
5,50
25,
550
NO
TE
S:
1.)
The
figu
res
in th
is ta
ble
are
base
d on
pre
limin
ary
enro
llmen
ts a
nd a
re d
eriv
ed fr
om r
esid
ent s
tude
nts
only
.2.
) T
he fi
gure
s in
this
tabl
e do
not
incl
ude
stud
ents
atte
ndin
g pr
ivat
e sc
hool
s.
- 112 -

Sch
ool:
Fee
ds In
to:
2016
2017
2018
2019
2020
2021
2016
2017
2018
2019
2020
2021
Linc
oln-
Elio
tB
igel
ow34
634
735
534
935
235
4U
nder
woo
dB
igel
ow31
331
631
932
330
731
5W
ard
Big
elow
313
311
306
302
297
304
Bur
rD
ay40
239
539
236
935
233
9C
abot
Day
400
394
377
382
370
375
Fra
nklin
Day
446
455
467
469
457
469
Hor
ace
Man
nD
ay41
739
939
639
239
539
3P
eirc
eD
ay29
928
528
028
126
526
9
Ang
ier
Bro
wn
421
444
455
464
466
476
Cou
ntry
side
Bro
wn
436
432
430
434
420
413
Mas
on-R
ice
Bro
wn
101
103
101
9792
8940
641
340
339
036
635
4W
illia
ms
Bro
wn
293
299
290
297
301
287
Bow
enO
ak H
ill41
740
939
936
036
035
8M
emor
ial-S
paul
ding
Oak
Hill
454
472
486
491
488
489
Zer
vas
Oak
Hill
337
371
397
422
450
478
To
tal E
lem
enta
ry3,
037
3,00
52,
993
2,96
42,
887
2,90
72,
764
2,84
02,
860
2,85
82,
851
2,85
5
Big
elow
Nor
th52
553
653
153
856
455
3D
ayN
orth
922
985
988
1,01
21,
026
1,01
2B
row
nN
orth
(13
%);
Sou
th (
87%
)10
197
9495
104
107
673
647
630
637
698
715
Oak
Hill
Sou
th63
960
761
260
662
262
8
To
tal M
idd
le S
cho
ol
1,54
81,
618
1,61
31,
645
1,69
41,
672
1,31
21,
254
1,24
21,
243
1,32
01,
343
New
ton
Nor
th2,
145
2,16
32,
154
2,15
42,
198
2,25
8N
ewto
n S
outh
1,85
11,
907
1,96
22,
019
1,96
81,
942
To
tal A
ll G
rad
e L
evel
s6,
730
6,78
66,
760
6,76
36,
779
6,83
75,
927
6,00
16,
064
6,12
06,
139
6,14
0C
hang
e fr
om P
rior
Yea
r56
-26
316
5874
6356
191
% C
hang
e0.
8%-0
.4%
0.0%
0.2%
0.9%
1.2%
1.0%
0.9%
0.3%
0.0%
Dif
fere
nce
bet
wee
n N
ort
h a
nd
So
uth
294
256
192
135
230
316
New
ton
So
uth
Fee
din
g S
cho
ols
New
ton
No
rth
Fee
din
g S
cho
ols
AP
PE
ND
IX E
TA
BL
E 1
3
To
tal E
nro
llmen
t b
y H
igh
Sch
oo
l Fee
der
Pat
tern
s
- 113 -
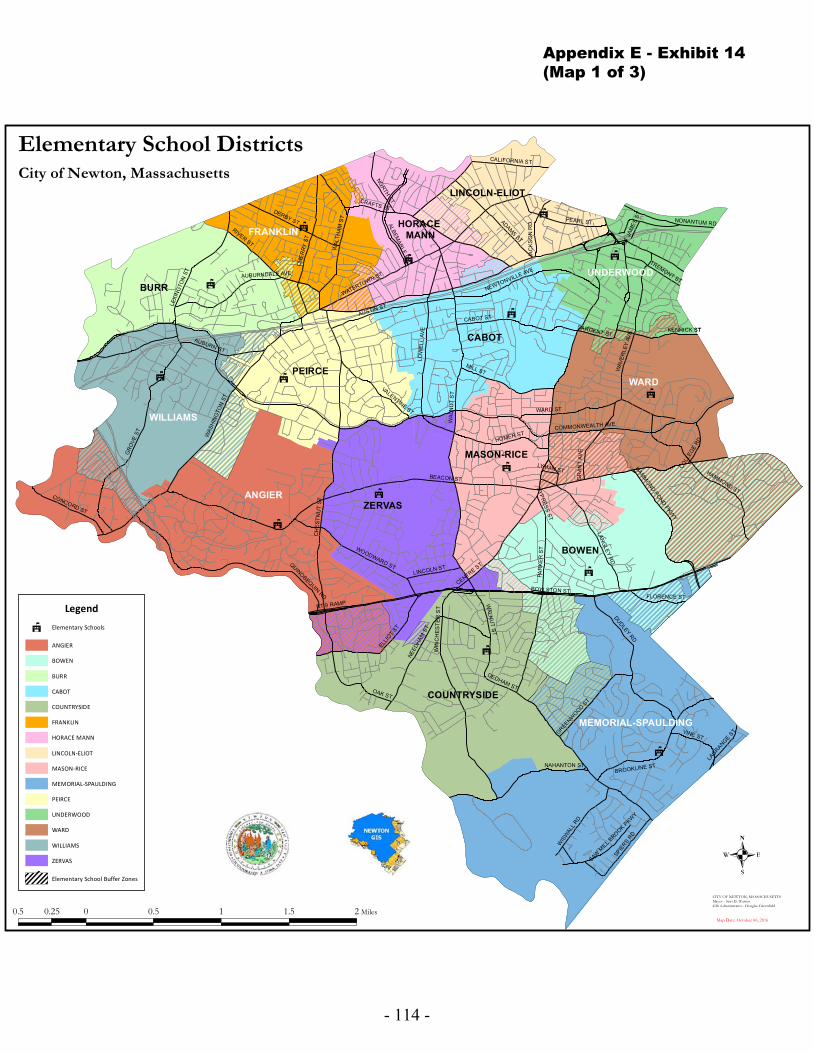
Appendix E - Exhibit 14(Map 1 of 3)
- 114 -

Appendix E - Exhibit 14(Map 2 of 3)
- 115 -

Appendix E - Exhibit 14(Map 3 of 3)
- 116 -
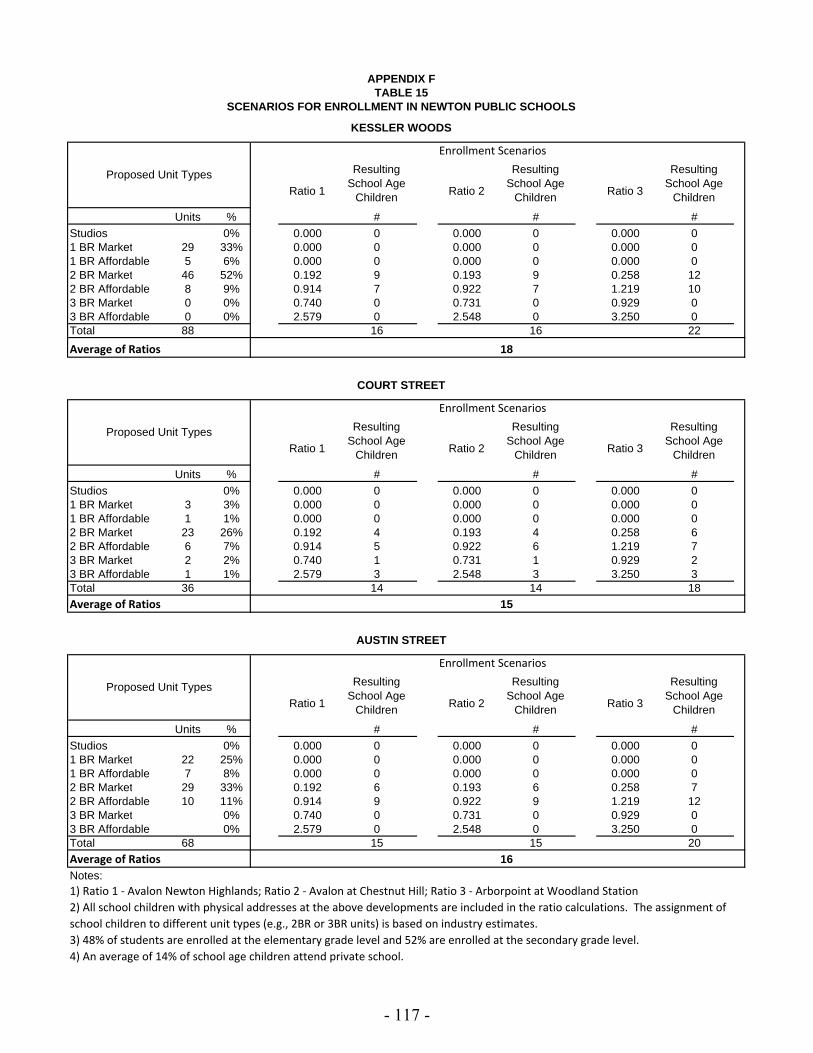
Resulting School Age
Children
Resulting School Age
Children
Resulting School Age
Children
Units % # # #
Studios 0% 0.000 0 0.000 0 0.000 01 BR Market 29 33% 0.000 0 0.000 0 0.000 01 BR Affordable 5 6% 0.000 0 0.000 0 0.000 02 BR Market 46 52% 0.192 9 0.193 9 0.258 122 BR Affordable 8 9% 0.914 7 0.922 7 1.219 103 BR Market 0 0% 0.740 0 0.731 0 0.929 03 BR Affordable 0 0% 2.579 0 2.548 0 3.250 0Total 88 16 16 22
Average of Ratios
Resulting School Age
Children
Resulting School Age
Children
Resulting School Age
Children
Units % # # #
Studios 0% 0.000 0 0.000 0 0.000 01 BR Market 3 3% 0.000 0 0.000 0 0.000 01 BR Affordable 1 1% 0.000 0 0.000 0 0.000 02 BR Market 23 26% 0.192 4 0.193 4 0.258 62 BR Affordable 6 7% 0.914 5 0.922 6 1.219 73 BR Market 2 2% 0.740 1 0.731 1 0.929 23 BR Affordable 1 1% 2.579 3 2.548 3 3.250 3Total 36 14 14 18
Average of Ratios
Resulting School Age
Children
Resulting School Age
Children
Resulting School Age
Children
Units % # # #
Studios 0% 0.000 0 0.000 0 0.000 01 BR Market 22 25% 0.000 0 0.000 0 0.000 01 BR Affordable 7 8% 0.000 0 0.000 0 0.000 02 BR Market 29 33% 0.192 6 0.193 6 0.258 72 BR Affordable 10 11% 0.914 9 0.922 9 1.219 123 BR Market 0% 0.740 0 0.731 0 0.929 03 BR Affordable 0% 2.579 0 2.548 0 3.250 0Total 68 15 15 20
Average of RatiosNotes:1) Ratio 1 ‐ Avalon Newton Highlands; Ratio 2 ‐ Avalon at Chestnut Hill; Ratio 3 ‐ Arborpoint at Woodland Station
3) 48% of students are enrolled at the elementary grade level and 52% are enrolled at the secondary grade level.
Enrollment Scenarios
Ratio 1 Ratio 2 Ratio 3
15
2) All school children with physical addresses at the above developments are included in the ratio calculations. The assignment of
school children to different unit types (e.g., 2BR or 3BR units) is based on industry estimates.
4) An average of 14% of school age children attend private school.
AUSTIN STREET
Ratio 3
COURT STREET
18
Proposed Unit Types
Ratio 1 Ratio 2 Ratio 3
Enrollment Scenarios
16
Proposed Unit Types
APPENDIX FTABLE 15
KESSLER WOODS
SCENARIOS FOR ENROLLMENT IN NEWTON PUBLIC SCHOOLS
Proposed Unit Types
Ratio 1 Ratio 2
Enrollment Scenarios
- 117 -