Embed Size (px)
Citation preview

Enrollment
Analysis Report
2019-2020 to 2024-2025
December 2019
Newton Public Schools 100 Walnut Street Newton, MA 02460

David Fleishman Superintendent
Liam Hurley
Assistant Superintendent/Chief Financial & Administrative Officer
Acknowledgements:
Sean Mannion, Director of Finance Katy Hogue, District Student Data Manager Janelle Sutherland, Administrative Assistant

TABLE OF CONTENTS SECTION PAGE
Introduction and Overview
1-4
I. Enrollment Trends
System-wide Projections Elementary Projections
Secondary Projections National, State and Local Trends Rental Housing Complexes Housing Trends in Newton Trends in Housing Patterns of District Families Real Estate Sales
5-17
II. Enrollment Projection Method Kindergarten Projection Methodology NESDEC Comparison Accuracy of Projections Frequently Asked Questions
18-29
III. Enrollment History Grade-by-Grade Analysis A Comparison to Peak Enrollment Years
30-32
IV. Individual School Reports
33-75 V. Student Exits and Entrances
VI. Non-Public/Private School Students
Appendices
A. Student Population Detail B. City of Newton Population C. Residential Property Data D. NESDEC’s Enrollment Projections vs. Newton’s E. School Districts and Buffer Zones F. Residential Development
76-84
85-90
91-131

LIST OF TABLES
TABLE PAGE 1. Projected Enrollments by School 2020-21 to 2024-25 12 2. Enrollment History and Projections by School 1975-76 to 2024-25 13-14 3. Projected Enrollments by Grade 2020-2021 to 2024-25 15 4. Enrollment History and Projections by Grade 1975-76 to 2024-25 16-17 5. Comparison of Projected with Actual 2018-19 and 2019-20 Enrollment 23 6. Actual and Projected Enrollments by School 2019-2020 24-25 7. Actual and Projected K-12 Enrollments 2014-15 to 2024-25 26 8. Enrollments by Grade 2018-19 and 2019-20 31 9. Historical Cohort Survival Ratios by Grade 32 10. Exiting Elementary School Students 2018-19 78 11. Exiting Middle School Students 2018-19 79 12. Exiting High School Students 2018-19 79 13. Total Student Exits 2016-17 through 2018-19 80 14. History of Exits to Non-Public Schools 2012-13 to 2018-19 81 15. Entering Elementary School Students 2018-19 and 2019-20 as of October 1, 2019 83 16. Entering Middle School Students 2018-19 and 2019-20 as of October 1, 2019 83 17. Entering High School Students 2018-19 and 2019-20 as of October 1, 2019 84 18. Non-Public/Private School Students by Grade (2019 Census) 88 19. Non-Public/Private School by School (2019 Census) 89 20. Special Education Students Tuitioned-Out (2019 Census) 90

APPENDICES Appendix A – Student Population Detail PAGE
1. Student Demographics 91-94 2. Preschool Students 95 3. METCO Enrollment by School and Grade 96 4. English Language Learners Enrollment 97 5. English Language Learners Enrollment by Language 99 6. Students Receiving Special Education Services 100-101 7. Number of Non-resident Students 102
Appendix B – City of Newton Population
8. City of Newton Population Growth 103 Appendix C – Residential Property Data
9. Residential Property Sales by Elementary District 104 10. Properties Listed for Sale in Newton by Elementary District 105
Appendix D – NESDEC Enrollment Projections
11. NESDEC’s Enrollment Projections vs. Newton’s 106 Appendix E – School Districts and Buffer Zones
12. Elementary Students by District with Buffer Zones 107-108 13. Total Enrollment by High School Feeder Patterns 109 14. Current Elementary, Middle and High School District Maps 110-112
Appendix F – Residential Development
Proposed Residential Development Projections: FAQs 113-117 15. Estimated Enrollment of Existing and Proposed Residential Development 118-26 16. Actual Enrollment for Existing Complexes 127-131

INTRODUCTION AND OVERVIEW

Enrollment Analysis Report 2019
INTRODUCTION AND OVERVIEW
The Newton Public Schools system-wide K-12 enrollment was 12,611 students on October 1, 2019, a decrease of 74 students from last year. The thirteen years of enrollment growth from 2004 to 2017 is now reflected in every grade K-12. This is the second year of a decline in enrollment, mainly due to lower enrollment in kindergarten, grade 2, and grade 4 compared to last year. This decline in enrollment was projected for grade 2 and grade 4, but not for kindergarten. Projections for next year indicate a small decline in enrollment (of 15 students), as a larger grade 12 class graduates this summer than the combined total of projected incoming kindergartners and students moving into the district. The current five-year enrollment projections through 2024-25 show small overall district enrollment declines, as larger classes graduate grade 12 and smaller kindergarten classes are projected to enter. As in prior years, the current five-year enrollment projections include students projected to enroll from permitted residential developments (please see Appendix F for detailed information).
This is the fifth consecutive year of kindergarten enrollment under 900, which decreases the elementary projections over the next five years as these smaller cohorts of students progress through the elementary grades. The large fifth grade class (over 1,000 students) will also move into the middle schools next year. Even though projected kindergarten classes average 814 students over the next five years, strong cohort growth in first and second grades results in cohorts close to or over 900 students in grades 1 through 5 over the next five years. Because of this strong cohort growth, this year’s class of 825 kindergarten students is projected to grow to 941 students by 2024 (when this class is in fifth grade).
District-wide, Newton’s elementary enrollment is projected to decrease over the next five years from 5,626 students today to 5,349 students in 2024. Last year’s projections had elementary enrollment in five years (from 2018 to 2023) at 5,583 students, a total of 200 more students than in the current projection for 2023 of 5,383 students. Three primary factors that impact growth are the reason for this change: the size of the incoming kindergarten class, the size of the outgoing fifth grade class, and cohort growth. The recent smaller size of kindergarten classes combined with large classes moving to middle school, even with continued cohort growth, results in lower elementary projections. Although the overall elementary projections over the next five years show an overall decrease, this is not consistent across individual elementary schools.
In contrast to the elementary schools, the middle schools have continued to grow; they have grown by 450 students (18%) from 2007 to the present. In 2007, average classes were 817 students; today, grade cohorts average 968 students, reflecting the growth from elementary schools in earlier years. This year’s sixth grade class of 995 students was the kindergarten class of 2013-2014, which was 958 students. Middle schools are projected to grow by 123 students (4.2%) next year, mainly driven by the arrival of the large elementary cohort currently in grade 5. Total enrollment is projected to be over 3,000 students, with more than 1,000 students in grade 6. Middle school enrollment totals decrease over the remaining four years of the projection, as the large cohorts move to high school and smaller cohorts come into middle school from grade 5. Over the five-year projection, middle school enrollment is projected to decline by 56 students from 2,903 students today to 2,847
- 1 -

Enrollment Analysis Report 2019
students in 2024. Similar to elementary schools, although this decline is projected district-wide, it is not consistent across middle schools.
The high school growth trend that began in 2012 has resulted in an additional 514 students (since 2011), or 14% growth. This year, grades 10, 11, and 12 are enrolled at or above 1,000 students, and grade 9 is close to 1,000 students. During the next five years, the projected average grade size at the high schools is 1,000 or more students. Next year’s total high school enrollment is projected to decline slightly from this year’s enrollment, as a larger grade 12 class graduates and a smaller grade 9 class enters. Over the remaining four years of the projection, however, high school enrollment is projected to grow. Growth at the high school level since 2012 is the result of movement through the system of the earlier elementary and middle school growth. With the exception of next year, high school is the only level with district-wide projected growth over the five-year projection, with 201 students (5%) added.
This school year has seen a decrease in enrollment from last year for students currently enrolled as English Language Learners (ELL); however, there has been growth in the program of 82 students (13%) over the past ten years. There are 769 ELL students in 2019-20; of these, 541 are elementary students (10% of the elementary population). The percentage of students receiving special education services has decreased this year to 17% compared to 18% last year.
The Newton Early Childhood Program (NECP) currently enrolls 184 preschool children in integrated early childhood classrooms or in therapeutic services; enrollment typically increases during the course of the year. Special education students enrolled in out-of-district special education schools total 131 students based on the October 2019 Student Services Report, which includes 110 out of district placements and 21 agreements, and is an increase of 5 students from last year. Including these students, the district’s full enrollment totals just over 12,900 students. Section V on Student Exits and Entrances and Appendix A on Student Population Detail contain additional information on preschool and outplaced special education student populations.
The K-12 district current enrollment of 12,611 is below the projection of 12,702 students made in November 2018, with a system-wide variance from projection of -91 students, or -0.7%. The elementary school grade level has the widest variance from projection of -98 students, or -1.7%, which is mainly due to lower than projected kindergarten, grade 3, and grade 4 classes. Variances of greater than 1% are considered significant. The middle school level also has a negative variance from projection of -10 students, or -0.3%. The high school level is enrolled slightly over projection, with +17 student, or +0.4%. With the exception of the 2015-16 school year (when the variance was -1.4%), system-wide variances from projection have been below 1%, typically around one-half of one percent in recent years.
This report details changes in enrollments by school since last year. It reviews current enrollments as compared with the November 2018 projections, and projects enrollments using five-year historical data considered in the context of local trends in real estate sales, new developments, student mobility, birth data, census data, housing trends and other factors. Actual 2019-20 enrollments presented in this report have changed slightly from the Preliminary Enrollment Report in October 2019, with a net decrease of 8 students.
- 2 -

Enrollment Analysis Report 2019
The district has implemented two phases of student assignment changes in order to balance enrollments among district schools as first Angier and Zervas opened, followed by Cabot in 2019, each with expanded enrollment capacity. There are now three full years of experience built into the projection model associated with changes to Newton Public Schools elementary student assignment policies, approved in September 2015. The October 2018 student assignment changes have also been integrated into the five-year projections.
Future Enrollment The traditional cohort survival method of enrollment projections using five-year historical data yields the projections for grades 1 through 12. The kindergarten projections have been calculated using an adjusted three-year average of previous kindergarten enrollments. This is the same basic methodology that has been used since 2013 with a slightly more conservative approach for projecting kindergarten. Using a 3-year average instead of a 4-year or 5-year average for kindergarten omits all recent peak kindergarten enrollment years, which lowers the projection. See Section II entitled Enrollment Projection Method for more information and discussion of the full methodology used in this year’s forecast. The table below shows the projections for the next five years, as well the current year’s enrollment.
The following graph is a representation of more than 40 years of enrollment in the Newton Public Schools, from 1975 to 2019, as well as projections from 2020 through 2024. The graph illustrates the trend of sustained increases during the 1990’s, then a six-year period of stability, followed by the growth trend of thirteen years, the slight decline over the past two years, and the slight projected decline for the next five years.
ActualLevel 2019-20 2020-21 2021-22 2022-23 2023-24 2024-25
Elementary 5,626 5,513 5,471 5,405 5,383 5,349 Middle 2,903 3,026 2,984 2,962 2,855 2,847 High School 4,082 4,057 4,118 4,146 4,253 4,283 Total 12,611 12,596 12,573 12,513 12,491 12,479 * The projections include a separate forecast for kindergarten based on an adjusted three-year average of previous kindergarten enrollments.
Projections Using 5 Year Ratios*
- 3 -

Enrollment Analysis Report 2019
Purpose of the Report
The Enrollment Analysis Report serves as the basis upon which Newton Public Schools conducts enrollment planning throughout the year, including the identification of potential needs for elementary buffer zones to balance enrollment at schools. This report also guides planning for any changes in the use of facilities that may be necessary in upcoming years and helps to identify short-term facility needs. The enrollment projections are also used to inform the long-range facility planning in which Newton is currently engaged, extending for the next twenty years. Enrollment projections for the next school year are embedded in the budget proposals for each upcoming year. As actual enrollments become known over the course of the year, planning assumptions are re-evaluated and adjusted. The annual enrollment analysis report thus supports district planning throughout the year and helps to inform the most effective and responsive decisions possible.
The Report
I. Enrollment Trends for the System, Elementary and Secondary – an in-depth look at system-wide and grade distribution projections.
II. Enrollment Projection Method and Accuracy of Projections – an overview and answers to commonly asked questions about the methodology.
III. Enrollment History – a discussion of past enrollment trends for the district and for the elementary, middle, and high school grade configurations.
IV. Individual School Reports – a detailed review including theoretical classroom distributions included for planning purposes to assess enrollment capacity (and are not staffing patterns).
V. Student Exits and Entrances – data on student mobility in the previous school year, as well as preliminary entrance information for the current year.
VI. Non-Public School/Private School Enrollments – data on Newton school age children who are eligible to attend but are enrolled outside the district and at private schools.
Appendices A through F
• Basic demographic information • Data on preschool students • Students in the METCO program • English Language Learners and students receiving special education services • City of Newton population growth by age group • Current residential properties for sale in Newton and historical property sales • New England School Development Council’s (NESDEC) enrollment projections for
Newton, discussed in detail in Section II • Elementary school students by district with buffer zones • Enrollment by high school feeder patterns • Current elementary, middle and high school district maps • Projections for enrollment from permitted residential developments
- 4 -

ENROLLMENT TRENDS
System-wide Projections
Elementary Projections
Secondary Projections
National, State and Local Trends
Rental Housing Complexes
Housing Trends in Newton
Trends in Housing Patterns of District Families
Real Estate Sales

Enrollment Analysis Report 2019
I. ENROLLMENT TRENDS
System-wide Projections
Enrollment for all schools is projected to decrease by a net of 132 students (a decline of 1%) during the next five years, after growing 13% from 2004-05 to 2017-18. This growth trend is not quite as high in number, though longer in years, as the earlier period of growth from 1989 to 1999 (eleven years) when the district’s population grew by over 2,000 to 11,248 students (23% growth).
Table 1 and Table 3 display the current enrollment for 2019-20 by school and by grade, as well as projections for the next five years. Tables 2 and 4 provide enrollment history and projections from 1975-76 to 2024-25, by school and by grade.
The chart below provides an overview of five decades of enrollment trends with differences shown by grade level. Over the next five years, enrollment at elementary and middle grade levels is projected to have net decreases and high school enrollment is projected to increase.
Elementary Projections
Today’s kindergarten enrollment of 825 students is the fifth class of fewer than 900 students since 2012. The years 2012 through 2014 saw record breaking high kindergarten classes of 934, 958, and 938 students; the two prior years also had large classes of just under 900 students. Elementary enrollment is projected to decrease from 5,626 students to 5,513 students next year as the large fifth grade cohort moves on to middle school.
- 5 -

Enrollment Analysis Report 2019
Overall elementary enrollment is projected to further decrease in five years to 5,349 students as smaller projected kindergarten classes enter the district. Last year’s projection forecast 5,583 students in five years, as future projected kindergarten classes were larger in last year’s projections. Enrollment projections are dependent on current student counts and trends from the past five years. With recent experience of lower kindergarten enrollment and one class of more than 1,000 students moving on to middle school in 2020, elementary enrollment is trending lower. Even with the introduction of full-day kindergarten in fall 2019, projected kindergarten classes are lower this year due to lower birth rate data for incoming kindergarten classes. The average size of the kindergarten classes over the prior five years is 857 students (down from 880 students last year); the four-year average of kindergarten classes is 852 students and the three-year average is 841 students. Please refer to Section II for further information on the kindergarten projections, which typically are the most variable and challenging to project.
For the elementary school projections by grade and by school and other enrollment details, please refer to Section IV, Individual School Reports. Student assignment changes approved in September 2015 are now fully integrated into the projections (with the use of a three-year average for kindergarten projections). The 2018 student assignment changes designed to utilize new capacity at Cabot and ease crowding in north-side elementary schools are also incorporated into the projections and result in projected increases in enrollment at Cabot and Peirce, despite overall decreases in enrollment at the elementary level. Zervas is also projected to increase over the next five years, which is mainly due to a larger than projected kindergarten class this year and five-year average cohort survival ratios of 1.04 or higher for all grade level cohorts (indicating students moving into Zervas in all grade levels).
Appendix E, Table 12 lists student enrollment in buffer zones by school for this school year and last. The use of buffer zones has been an effective way to ameliorate space constraints at the elementary schools and balance class sizes. Since 2011, buffer zones have been used by school administration to determine space availability requests between schools in the district. Once a student from a buffer zone is placed in a school, he/she will follow the same feeder pattern as peers in that school. Table 12 displays each buffer zone and, for more recently created zones, notes the year the zone was developed.
Secondary Projections
Middle school enrollment increased by 52 students in 2019-20 when the large grade 5 class from last year arrived at the middle schools, and is projected to increase in 2020 by 123 students when the current large grade 5 class arrives. Middle school enrollment is projected to decrease in the remaining four years of the projection as grade 6 classes enter that are smaller than the exiting grade 8 classes from the prior year. In 2020 and 2021, there are two grades close to or over 1,000 students projected; there has not been a middle school grade over 1,000 students since 1980. Although middle school enrollment is projected to decline district-wide over the last four years of the projection, this is the not the case at each middle school. In particular, Oak Hill is projected to grow or remain stable in all five years of the projection. This is mainly due to the relatively strong average cohort survival ratio at Oak Hill from grades five to six (for incoming sixth graders) and projected growth at Zervas.
- 6 -

Enrollment Analysis Report 2019
High school enrollment surpassed 4,000 students in 2017 and is projected to grow to over 4,200 students in five years. Current 2019 high school enrollment increased by 35 students from last year. By 2024-25, a net increase of 201 high school students is expected. Both high schools are projected to increase in five years; enrollment projections show Newton North High School will increase by 41 students, or +2%, and Newton South High School will increase by 160 students, or +8%. The difference in enrollment between the two high schools is projected to be 3 students in 2024. This is due to slightly higher cohort survival ratios for students at South compared to North, larger incoming grade 9 cohorts at South compared to North in 2023 and 2024, and the inclusion of the Northland development on the Southside in the projections.
National, State and Local Trends
Although the U.S. Census Bureau continues to rank Massachusetts low in expected school age population growth from 2000-2030, Newton’s enrollment projections and those of other communities near Boston are not typical of Massachusetts; enrollment in the Newton Public Schools and in many nearby districts has increased in recent years. The chart below shows the status of district enrollments for several nearby towns over the most recent five-year time period. Among the towns sampled below, communities like Newton that have fairly central locations within the Greater Boston metropolitan area show some growth, while others that are further south or west show enrollments that are level or decreasing.
Since the 2010 United States Census, the population of the City of Newton has increased by 1,300 residents, growing to over 85,000. Appendix B, Table 8 compares City of Newton data from the 2010 United States Census to the 2000 United States Census by age range; the 1990 Census is also shown.
On a national and regional level, the 2010 Census reported 308.7 million people in the United States, a 10% increase from the 2000 Census population of 281.4 million, as compared to ten year population growth of only 2% in Newton and 3% statewide. The national increase of 10% over the last decade was lower than the 13% increase of the 1990’s and is similar to the magnitude of growth in the 1980’s. Nationally, 24% of the United States population is less than 18 years of age, 7% of which accounts for children under five years old. This reflects a national school age demographic of 18% of the total population; in contrast, the school age demographic for both Massachusetts and Newton is 16%.
School Year Belmont Brookline* Lexington Natick Newton Needham Wellesley Westwood Wayland Weston2019-20 4,700 7,855 7,190 5,550 12,779 5,706 4,945 3,000 2,707 2,0392015-16 4,362 7,668 6,925 5,434 12,670 5,581 5,075 3,151 2,657 2,180Change 338 187 265 116 109 125 -130 -151 50 -141Percent 8% 2% 4% 2% 1% 2% -3% -5% 2% -6%Massachusetts DESE School Profile Enrollment as of October 1, 2019*Brookline's enrollment is as of 2018-19
Five Year PK-12 Enrollment Change in Surrounding Districts
- 7 -

Enrollment Analysis Report 2019
Residential Housing Complexes
There are several new residential complexes included in the projections, either recently completed or with completion expected in the near future. These include:
• Kessler Woods on the West Roxbury and Brookline border with 88 units • Court Street in Newtonville off of Washington Street with 36 units • Austin Street mixed-used development with 68 units • Washington Place on Washington Street near the intersection with Walnut Street,
with construction of 140 units (in process) • 429 Cherry Street with construction of 13 units (in process) • 392-404 Langley Road (additional building to the existing buildings on Langley
Road) with construction of 20 units (in process) • 200-230 Boylston (Chestnut Hill phase 2) with construction of 100 units (special
permit approved) • Melrose Street, 283-Turtle Lane Playhouse with construction of 16 units (special
permit approved) • 189 Adams Street with construction of 12 units (special permit approved) • 182 California Street with construction of 20 units (special permit approved) • Northland on Needham and Oak Streets with construction of 800 units (special
permit approved)
Estimates for future student enrollment from the developments above are included in the five year enrollment projections. A total of 83 elementary school students, 45 middle school students, and 45 high school students (a grand total of 173 students) from these complexes have been distributed across the five year projections amongst Bowen, Burr, Cabot, Countryside, Lincoln-Eliot, Memorial-Spaulding, Williams, Bigelow, Brown, Day, Oak Hill, North, and South. These additions are phased into the projections, assuming that each development reaches full occupancy within five years of completion. The start date for phasing in students from a new development is dependent on the first year of occupancy for the development; these first years are displayed in Appendix F, Table 15. After five years, it is assumed that all students from a new development have been incorporated into the cohort survival ratios utilized in the projection methodology, and students are no longer manually added to the projections from that development. Newton Public Schools includes estimates for future student enrollment in its five-year enrollment projections only for projects that have received special permits or building permits. Based on these criteria, the Riverside development is not included in the five-year projections in this analysis because it has not yet received a special permit; however, the estimates for enrollment from Riverside are included in Appendix F, Table 15 for reference.
A table that shows the calculation of total students related to each project can be found in Appendix F, Table 15. Actual enrollment of Newton Public School students in larger developments and accuracy of the projections for these developments are displayed in Appendix F, Table 16.
Appendix F, Table 15 consolidates information about existing, permitted, and planned development at various stages in the City of Newton. The information on project status and number of units by type has been prepared in consultation with Newton’s Planning
- 8 -

Enrollment Analysis Report 2019
Department and is current as of early December 2019. Planned projects that have reached the stage where a breakdown of total units by unit type is available have a preliminary estimate for the number of students that potentially may enroll. It is important to note that estimates relating to size and number of units typically change as the project progresses through the planning approval process.
Newton Public Schools, in collaboration with the City of Newton Executive, Public Buildings, and Planning Departments, has updated its methodology used in the calculation of student generation for local residential development. The student generation ratios used prior to November 2018 by Newton Public Schools originated in the early 2000s and were based on the experience of actual student enrollment from the three largest residential complexes in Newton built since that time: Avalon Newton Highlands, Avalon Chestnut Hill, and Arborpoint at Woodland Station. A detailed description of the updated methodology is available in Appendix F in the FAQ section.
The updated methodology is the result of an in-depth review that has been supported by expert resources. This review included the following:
• Review of residential development in other Massachusetts communities • Review of student generation rates in West Hartford, CT • Application of Public Use Microdata Sample (PUMS) data to understand housing
patterns of families in Newton with school age children • Demographics based enrollment projections • Municipal financial impact modeling
For the three largest residential rental communities in Newton, the numbers of school age children in residence are shown in the table below. Student enrollments have become fairly stable at these complexes; there is an overall net decrease from the prior year of fourteen students. Slightly less than half of the students at the three complexes are elementary students and slightly more than half attend middle or high school. There are also 44 students residing in these complexes who are enrolled in private school (17%), similar to Newton as a whole (as explained in Section VI).
- 9 -

Enrollment Analysis Report 2019
Housing Trends in Newton
The table below shows the housing types in Newton in the year before the recent enrollment growth trend began (2003-04, FY04) and compares these housing types to those available in Newton today. According to the City Assessor’s office, the greatest change during this time in Newton’s housing stock has been an increase of 1,746 condominium properties, which is growth of 50%. Condominiums have been the result of both conversions of existing properties such as two- or three-family homes (which have decreased since FY04) as well as new construction or additions. Single family home types have been the most stable segment of the housing stock in Newton during this period.
Trends in Housing Patterns of District Families
There have also been shifts in the housing patterns of families with Newton Public Schools children. According to Geographic Information Systems data that matches school students to housing types, families are more frequently living in new types of housing that have
SchoolAvalon at Newton
Highlands (294 Units)
Avalon at Chestnut Hill
(204 Units)
Arborpoint at Woodland Station
(180 Units)Year Built 2003 2004 2007
Countryside Bowen PeirceZervas Mem-Spaulding Williams
In District 40 30 22Out-of-assigned District 3 2 2In District 25 13 8Out-of-assigned District 1 0 0In District 23 28 15Out-of-assigned District 3 0 1
Total Enrollment 95 73 48 216Prior Year Total (2018-19) 102 82 46 230Change from Prior Year -7 -9 2 -14
Private School Students 20 17 7 44
Enrollment at Newton's Largest Rental Housing Complexes (2019-20)
% by Level
* Districted schools listed are elementary schools. Student assignment at elementary school determines middle school and high school assignment. Students attend out-of-assigned district schools for a variety of reasons including educational needs, family relocation within Newton, changes in school district boundaries, or buffer zones.
Districted Schools*
46%
22%
32%
Elementary Enrollment
Middle School Enrollment
High School Enrollment
Housing Type FY04 % of Total in FY04 FY20 % of Total in FY20 # Change
% Change
Single Family 16,885 69% 16,953 66% 68 0.4%Condominium 3,489 14% 5,235 21% 1,746 50%Two Family 3,224 13% 2,693 11% -531 -16%Three Family 308 1% 273 1% -35 -11%Apartment Buildings 176 1% 149 1% -27 -15%Mixed Use 296 1% 231 1% -65 -22%
TOTAL PROPERTIES 24,378 100% 25,534 100% 1,156 5%Source: Newton Assessor's Office
City of Newton Housing Types
- 10 -

Enrollment Analysis Report 2019
become more available in Newton. While similar numbers of Newton school children live in single family homes in 2019 as in 2002 (just under 8,000 students), the percentage of school children living in single family homes has declined from 73% to 65% because of enrollment growth during this time period. Conversely, there has been an increase from 5% to 13% in the percentage of school children living in condominiums. This represents a real increase of more than 1,000 students living in condominiums today compared to 2002. There has also been an increase in students living in apartments, with 2% in 2002 compared to 4% in 2019, or a total of 535 students in apartments in 2019. This data illustrates that Newton school children today are more likely to live in condominiums and apartments than in 2002. Students are slightly less likely to live in two or three family homes in 2019, as the percentage has declined from 16% in 2002 to 14% today.
Real Estate Sales
According to data obtained from City of Newton records, there were 1,166 residential property sales in calendar year 2018 versus 1,304 in the prior year. Calendar years 2017 and 2014 had the highest number of property sales of the last fourteen years, with over 1,300 sales in each year. Through the first nine months of 2019, real estate sales totaled 772 as compared with 965 in the first nine months of 2018 (a decrease of 20%). Appendix C, Table 9 shows this data by school district.
Additional information is provided in Table 10 of Appendix C with properties listed for sale by school district in Newton as of November 2019; there are 224 properties listed for sale in Newton. At the same time last year, there were 179 properties listed for sale. Although there are currently more properties for sale than last year, real estate sales through the first nine months of 2019 have been lower than at the same time last year. Sixty-one percent of the properties listed for sale in Newton are single family homes, with the majority of these homes (82% of the listed homes) having four or more bedrooms. The distribution of type of property on the market by school district is also provided in this table for reference. For example, in the Peirce School district, 100% of properties listed for sale are single family homes, while in the Countryside School district, 60% of properties for sale are single family and 40% are condominiums.
Type of Housing 2002% of Resident
Students 2019% of Resident
StudentsChange
#Change
%
Single Family 7,777 73% 7,953 65% 176 2%Two/Three Family 1,671 16% 1,741 14% 70 4%Condominiums 526 5% 1,631 13% 1,105 210%Apartment Buildings 251 2% 535 4% 284 113%Mixed Use / Other 389 4% 350 3% -39 -10%Total 10,614 100% 12,210 100% 1,596 15%* Preschool - Grade 12Source: Newton Geographic Information Systems
Newton Public School Children by Housing Type*
- 11 -

TABLE 1PROJECTED ENROLLMENTS BY SCHOOL
2020-21 TO 2024-25
Actual Projections Using 5 Year Average Ratios**School FY20 FY21 FY22 FY23 FY24 FY25Angier 502 490 498 488 493 482Bowen 372 371 361 356 346 342Burr 366 355 358 371 361 363Cabot 393 407 423 448 466 475Countryside 413 393 387 375 379 382Franklin 413 391 390 365 357 355Horace Mann 391 389 378 368 369 365Lincoln-Eliot 362 359 356 348 334 318Mason-Rice 446 425 400 387 383 384Memorial-Spaulding 465 442 421 399 375 366Peirce 284 281 290 298 302 301Underwood 269 248 247 241 242 240Ward 255 239 228 218 221 216Williams 261 265 249 249 239 237Zervas 434 458 485 494 516 523TOTAL ELEMENTARY (0) 5,626 5,513 5,471 5,405 5,383 5,349Bigelow 494 524 495 492 453 462Brown 778 829 826 831 798 785Day 999 999 968 934 893 890Oak Hill 632 674 695 705 711 710TOTAL MIDDLE (0) 2,903 3,026 2,984 2,962 2,855 2,847Newton North (28) 2,099 2,106 2,153 2,143 2,194 2,140Newton South (1) 1,983 1,951 1,965 2,003 2,059 2,143TOTAL HIGH SCHOOL (29) 4,082 4,057 4,118 4,146 4,253 4,283GRAND TOTAL (29) 12,611 12,596 12,573 12,513 12,491 12,479*Enrollment numbers and projections include students who receive special education services beyond grade 12.**Adjusted three-year averages of previous kindergarten enrollments are used to project kindergarten enrollment.
SP*
- 12 -

TAB
LE 2
New
ton
Pub
lic S
choo
lsE
nrol
lmen
t His
tory
and
Pro
ject
ions
by
Sch
ool
1975
to 2
024
Scho
ol N
ame
Peak
En
roll
Peak
Ye
ar19
7519
7619
77*
1978
*19
79*
1980
*19
81*
1982
*19
83*
1984
*19
85*
1986
*19
8719
8819
8919
9019
9119
9219
93*
1994
1995
1996
1997
1998
Angi
er75
219
5340
840
839
442
941
442
440
037
538
441
341
241
940
941
043
943
644
146
942
843
043
043
642
343
3Bo
wen
502
2013
338
301
354
349
328
309
300
291
283
312
348
350
364
366
403
413
426
428
410
414
421
410
409
390
Burr
496
1967
338
313
256
232
218
264
236
229
211
204
210
238
249
260
304
299
302
323
275
294
287
292
273
256
Cab
ot53
919
6740
638
837
334
931
530
641
035
134
233
633
736
236
238
742
444
947
047
344
343
142
041
741
239
3C
arr
401
1963
295
290
271
269
235
Cla
flin
420
1960
349
314
283
253
231
215
Cou
ntry
side
557
1959
302
302
231
218
349
338
347
316
303
379
394
418
436
451
458
474
500
497
461
477
446
449
469
493
Dav
is35
219
6127
927
327
625
624
7Em
erso
n34
519
5527
624
522
220
1Fr
ankl
in60
119
6146
044
542
038
838
947
839
939
438
834
533
833
433
134
736
438
236
136
033
235
034
636
637
940
7H
amilt
on22
219
6014
414
712
6H
orac
e M
ann
434
2014
295
270
252
228
216
317
301
287
261
268
258
249
276
287
299
323
318
324
285
288
294
282
273
297
Hyd
e66
919
5238
535
235
036
435
134
131
431
030
1Li
ncol
n-El
iot
435
1970
368
361
342
286
244
320
308
269
237
246
242
239
250
249
285
316
338
352
293
306
333
345
321
325
Mas
on-R
ice
620
1962
475
445
428
410
384
360
349
321
286
418
402
419
419
423
436
459
475
486
395
417
405
397
395
412
Mem
oria
l53
619
5318
115
2M
emor
ial-S
paul
ding
486
1992
372
349
309
309
301
284
264
372
382
401
415
418
445
449
452
486
426
469
477
454
452
448
Oak
Hill
Elem
enta
ry45
019
6231
030
432
334
130
427
426
823
020
7Pe
irce
429
1960
390
362
341
345
349
355
355
302
290
291
266
253
253
267
282
283
272
292
270
270
259
250
281
282
Spau
ldin
g58
719
6126
825
3U
nder
woo
d58
219
7049
746
343
741
139
237
332
829
330
829
129
226
428
027
728
330
331
030
229
531
128
328
528
226
7W
ard
506
1971
499
500
428
404
371
334
302
278
258
286
279
312
325
354
351
372
378
386
330
342
366
360
335
319
Willi
ams
375
1969
311
281
272
298
258
235
214
209
213
223
221
219
216
238
244
255
284
302
271
261
254
288
269
260
Zerv
as (f
orm
erly
Bee
thov
en)
434
2019
287
286
242
239
240
238
227
209
213
278
281
258
266
273
280
290
320
325
302
303
288
287
287
311
Peab
ody
(Spe
cial
Edu
catio
n)37
Tota
l Ele
m7,
898
7,45
56,
993
6,61
96,
144
5,79
05,
359
4,94
84,
749
4,66
24,
662
4,73
54,
851
5,00
75,
297
5,50
35,
647
5,80
55,
216
5,36
35,
309
5,31
85,
260
5,29
3C
hang
e-1
79-4
43-4
62-3
74-4
75-3
54-4
31-4
11-1
99-8
70
7311
615
629
020
614
415
8-5
8914
7-5
49
-58
33%
Cha
nge
-2.2
%-5
.6%
-6.2
%-5
.3%
-7.2
%-5
.8%
-7.4
%-7
.7%
-4.0
%-1
.8%
0.0%
1.6%
2.4%
3.2%
5.8%
3.9%
2.6%
2.8%
-10.
1%2.
8%-1
.0%
0.2%
-1.1
%0.
6%To
tal #
Ele
m S
choo
ls23
2322
2120
1817
1717
1515
1515
1515
1515
1515
1515
1515
15
Bige
low
612
1996
589
572
575
529
517
503
482
537
425
350
168
534
567
590
612
522
483
Brow
n (fo
rmer
ly M
eado
wbr
ook)
1,02
419
6480
082
384
282
281
085
863
665
461
560
059
757
054
855
752
850
862
868
998
994
094
597
464
574
9D
ay99
920
1978
080
477
872
472
473
477
484
765
260
465
470
968
468
073
079
777
277
075
579
480
885
682
380
4O
ak H
ill M
iddl
e63
920
1657
257
8W
arre
n1,
270
1969
883
884
846
763
681
629
606
419
Wee
ks1,
033
1960
675
663
625
563
458
287
Tota
l Mid
dle
Scho
ol3,
727
3,74
63,
666
3,40
13,
190
3,01
12,
498
2,45
71,
692
1,55
41,
419
1,27
91,
232
1,23
71,
258
1,30
51,
400
1,45
92,
278
2,30
12,
343
2,44
22,
562
2,61
4C
hang
e-9
119
-80
-265
-211
-179
-513
-41
-765
-138
-135
-140
-47
521
4795
5981
923
4299
120
52%
Cha
nge
-2.4
%0.
5%-2
.1%
-7.2
%-6
.2%
-5.6
%-1
7.0%
-1.6
%-3
1.1%
-8.2
%-8
.7%
-9.9
%-3
.7%
0.4%
1.7%
3.7%
7.3%
4.2%
56.1
%1.
0%1.
8%4.
2%4.
9%2.
0%To
tal #
Mid
dle
Scho
ols
55
55
55
44
33
32
22
22
22
33
33
44
Nor
th2,
976
1972
2,88
52,
741
2,68
52,
621
2,58
42,
471
2,27
52,
075
2,65
92,
540
2,39
02,
195
1,98
31,
771
1,61
71,
589
1,62
31,
691
1,75
71,
765
1,80
81,
867
1,91
12,
019
Sout
h1,
983
2019
1,33
21,
300
1,21
11,
178
1,13
21,
154
1,50
31,
418
1,31
11,
298
1,22
91,
226
1,17
41,
127
1,10
41,
091
1,05
81,
055
1,10
91,
142
1,22
01,
223
1,21
11,
240
Tota
l Hig
h Sc
hool
4,21
74,
041
3,89
63,
799
3,71
63,
625
3,77
83,
493
3,97
03,
838
3,61
93,
421
3,15
72,
898
2,72
12,
680
2,68
12,
746
2,86
62,
907
3,02
83,
090
3,12
23,
259
Cha
nge
-40
-176
-145
-97
-83
-91
153
-285
477
-132
-219
-198
-264
-259
-177
-41
165
120
4112
162
3213
7%
Cha
nge
-0.9
%-4
.2%
-3.6
%-2
.5%
-2.2
%-2
.4%
4.2%
-7.5
%13
.7%
-3.3
%-5
.7%
-5.5
%-7
.7%
-8.2
%-6
.1%
-1.5
%0.
0%2.
4%4.
4%1.
4%4.
2%2.
0%1.
0%4.
4%
Gra
nd T
otal
15,8
4215
,242
14,5
5513
,819
13,0
5012
,426
11,6
3510
,898
10,4
1110
,054
9,70
09,
435
9,24
09,
142
9,27
69,
488
9,72
810
,010
10,3
6010
,571
10,6
8010
,850
10,9
4411
,166
Cha
nge
-310
-600
-687
-736
-769
-624
-791
-737
-487
-357
-354
-265
-195
-98
134
212
240
282
350
211
109
170
9422
2%
Cha
nge
-1.9
%-3
.8%
-4.5
%-5
.1%
-5.6
%-4
.8%
-6.4
%-6
.3%
-4.5
%-3
.4%
-3.5
%-2
.7%
-2.1
%-1
.1%
1.5%
2.3%
2.5%
2.9%
3.5%
2.0%
1.0%
1.6%
0.9%
2.0%
* A
ster
isk
deno
tes
chan
ge in
gra
de p
atte
rn
and/
or s
choo
l con
solid
atio
n.
- 13 -

TAB
LE 2
New
ton
Pub
lic S
choo
lsE
nrol
lmen
t His
tory
and
Pro
ject
ions
by
Sch
ool
1975
to 2
024
Scho
ol N
ame
Peak
En
roll
Peak
Ye
arAn
gier
752
1953
Bow
en50
220
13Bu
rr49
619
67C
abot
539
1967
Car
r40
119
63C
lafli
n42
019
60C
ount
rysi
de55
719
59D
avis
352
1961
Emer
son
345
1955
Fran
klin
601
1961
Ham
ilton
222
1960
Hor
ace
Man
n43
420
14H
yde
669
1952
Linc
oln-
Elio
t43
519
70M
ason
-Ric
e62
019
62M
emor
ial
536
1953
Mem
oria
l-Spa
uldi
ng48
619
92O
ak H
ill El
emen
tary
450
1962
Peirc
e42
919
60Sp
auld
ing
587
1961
Und
erw
ood
582
1970
War
d50
619
71W
illiam
s37
519
69Ze
rvas
(for
mer
ly B
eeth
oven
)43
420
19Pe
abod
y (S
peci
al E
duca
tion)
Tota
l Ele
mC
hang
e%
Cha
nge
Tota
l # E
lem
Sch
ools
Bige
low
612
1996
Brow
n (fo
rmer
ly M
eado
wbr
ook)
1,02
419
64D
ay99
920
19O
ak H
ill M
iddl
e63
920
16W
arre
n1,
270
1969
Wee
ks1,
033
1960
Tota
l Mid
dle
Scho
olC
hang
e%
Cha
nge
Tota
l # M
iddl
e Sc
hool
s
Nor
th2,
976
1972
Sout
h1,
983
2019
Tota
l Hig
h Sc
hool
Cha
nge
% C
hang
e
Gra
nd T
otal
Cha
nge
% C
hang
e
* A
ster
isk
deno
tes
chan
ge in
gra
de p
atte
rn
and/
or s
choo
l con
solid
atio
n.
1999
2000
2001
2002
2003
2004
2005
2006
2007
2008
2009
2010
2011
2012
2013
2014
2015
2016
2017
2018
2019
2020
2021
2022
2023
2024
412
418
412
396
371
363
370
379
401
392
389
375
395
408
417
402
409
421
467
503
502
490
498
488
493
482
377
383
351
336
335
375
386
413
428
435
454
449
448
477
502
475
449
417
421
397
372
371
361
356
346
342
278
270
294
300
303
314
314
333
331
369
379
391
409
415
424
424
412
402
386
384
366
355
358
371
361
363
385
362
360
352
353
357
391
420
424
425
449
452
440
420
419
418
403
400
391
386
393
407
423
448
466
475
499
482
453
455
446
448
463
437
447
479
472
499
490
479
457
466
450
436
410
413
413
393
387
375
379
382
389
390
398
384
397
386
385
414
401
396
402
397
401
396
389
413
424
446
434
427
413
391
390
365
357
355
301
303
313
330
333
337
344
350
348
370
371
373
386
394
427
434
412
417
404
399
391
389
378
368
369
365
285
281
252
220
242
229
282
281
293
284
291
293
317
322
329
337
340
346
374
365
362
359
356
348
334
318
393
364
369
364
352
365
372
372
410
422
428
442
437
438
457
478
492
507
512
487
446
425
400
387
383
384
462
452
417
440
447
427
419
443
449
442
438
459
458
464
429
434
452
454
453
464
465
442
421
399
375
366
271
281
270
271
271
286
306
324
329
338
329
318
316
337
312
306
314
299
276
271
284
281
290
298
302
301
278
264
276
294
276
275
264
288
295
282
262
282
289
310
327
341
326
313
284
290
269
248
247
241
242
240
343
325
304
281
274
262
262
237
247
260
260
269
278
301
289
304
304
313
309
296
255
239
228
218
221
216
258
241
257
260
254
264
275
295
281
276
277
298
302
304
304
292
290
293
296
278
261
265
249
249
239
237
281
281
276
287
284
287
300
332
324
328
326
349
321
325
317
309
308
337
407
427
434
458
485
494
516
523
5,21
25,
097
5,00
24,
970
4,93
84,
975
5,13
35,
318
5,40
85,
498
5,52
75,
646
5,68
75,
790
5,79
95,
833
5,78
55,
801
5,82
45,
787
5,62
65,
513
5,47
15,
405
5,38
35,
349
-81
-115
-95
-32
-32
3715
818
590
9029
119
4110
39
34-4
816
23-3
7-1
98-1
13-4
2-6
6-2
2-3
4-1
.5%
-2.2
%-1
.9%
-0.6
%-0
.6%
0.7%
3.2%
3.6%
1.7%
1.7%
0.5%
2.2%
0.7%
1.8%
0.2%
0.6%
-0.8
%0.
3%0.
4%-0
.6%
-3.4
%-2
.0%
-0.8
%-1
.2%
-0.4
%-0
.6%
1515
1515
1515
1515
1515
1515
1515
1515
1515
1515
1515
1515
1515
446
465
477
513
520
510
496
495
487
505
527
523
533
531
525
504
509
525
521
501
494
524
495
492
453
462
771
752
735
756
770
787
705
665
644
681
684
666
677
698
743
738
780
774
753
744
778
829
826
831
798
785
804
835
855
822
785
758
768
747
764
747
773
758
845
874
947
932
927
922
980
976
999
999
968
934
893
890
619
620
621
597
598
565
565
567
558
547
572
603
612
616
634
632
602
639
614
630
632
674
695
705
711
710
2,64
02,
672
2,68
82,
688
2,67
32,
620
2,53
42,
474
2,45
32,
480
2,55
62,
550
2,66
72,
719
2,84
92,
806
2,81
82,
860
2,86
82,
851
2,90
33,
026
2,98
42,
962
2,85
52,
847
2632
160
-15
-53
-86
-60
-21
2776
-611
752
130
-43
1242
8-1
735
123
-42
-22
-107
-81.
0%1.
2%0.
6%0.
0%-0
.6%
-2.0
%-3
.3%
-2.4
%-0
.8%
1.1%
3.1%
-0.2
%4.
6%1.
9%4.
8%-1
.5%
0.4%
1.5%
0.3%
-0.6
%1.
2%4.
2%-1
.4%
-0.7
%-3
.6%
-0.3
%4
44
44
44
44
44
44
44
44
44
44
44
44
4
2,12
32,
144
2,19
02,
219
2,16
92,
121
2,04
71,
964
1,91
11,
829
1,80
21,
871
1,87
71,
940
2,01
52,
060
2,10
72,
145
2,16
52,
136
2,09
92,
106
2,15
32,
143
2,19
42,
140
1,27
31,
333
1,37
01,
399
1,48
71,
552
1,70
11,
745
1,78
41,
763
1,72
21,
708
1,69
11,
721
1,77
81,
804
1,79
81,
851
1,89
31,
911
1,98
31,
951
1,96
52,
003
2,05
92,
143
3,39
63,
477
3,56
03,
618
3,65
63,
673
3,74
83,
709
3,69
53,
592
3,52
43,
579
3,56
83,
661
3,79
33,
864
3,90
53,
996
4,05
84,
047
4,08
24,
057
4,11
84,
146
4,25
34,
283
137
8183
5838
1775
-39
-14
-103
-68
55-1
193
132
7141
9162
-11
24-2
561
2810
730
4.2%
2.4%
2.4%
1.6%
1.1%
0.5%
2.0%
-1.0
%-0
.4%
-2.8
%-1
.9%
1.6%
-0.3
%2.
6%3.
6%1.
9%1.
1%2.
3%1.
6%-0
.3%
0.6%
-0.6
%1.
5%0.
7%2.
6%0.
7%
11,2
4811
,246
11,2
5011
,276
11,2
6711
,268
11,4
1511
,501
11,5
5611
,570
11,6
0711
,775
11,9
2212
,170
12,4
4112
,503
12,5
0812
,657
12,7
5012
,685
12,6
1112
,596
12,5
7312
,513
12,4
9112
,479
82-2
426
-91
147
8655
1437
168
147
248
271
625
149
93-6
5-1
39-1
5-2
3-6
0-2
2-1
20.
7%0.
0%0.
0%0.
2%-0
.1%
0.0%
1.3%
0.8%
0.5%
0.1%
0.3%
1.4%
1.2%
2.1%
2.2%
0.5%
0.0%
1.2%
0.7%
-0.5
%-1
.1%
-0.1
%-0
.2%
-0.5
%-0
.2%
-0.1
%
Proj
ecte
d
- 14 -

Actual Projections Using 5 Year Average Ratios**Grade FY20 FY21 FY22 FY23 FY24 FY25
K 825 837 822 813 806 7941 902 894 899 890 874 8732 918 919 910 913 906 8903 968 925 927 919 924 9174 952 978 928 934 926 9345 1061 960 985 936 947 941
TOTAL ELEMENTARY 5,626 5,513 5,471 5,405 5,383 5,349 Diff. from Previous Year -113 -42 -66 -22 -34% Change -2.0% -0.8% -1.2% -0.4% -0.6%
6 995 1041 940 971 926 9337 984 999 1043 944 979 9318 924 986 1001 1047 950 983
TOTAL MIDDLE 2,903 3,026 2,984 2,962 2,855 2,847Diff. from Previous Year 123 -42 -22 -107 -8% Change 4.2% -1.4% -0.7% -3.6% -0.3%
9 997 966 1033 1048 1099 99410 1036 1014 980 1049 1065 111511 1000 1050 1028 994 1066 108012 1020 998 1048 1026 994 1065
SP* 29 29 29 29 29 29TOTAL HIGH 4,082 4,057 4,118 4,146 4,253 4,283Diff. from Previous Year -25 61 28 107 30% change -0.6% 1.5% 0.7% 2.6% 0.7%GRAND TOTAL 12,611 12,596 12,573 12,513 12,491 12,479Diff. from Previous Year -15 -23 -60 -22 -12% Change -0.1% -0.2% -0.5% -0.2% -0.1%*Enrollment numbers and projections include students who receive special education services beyond grade 12.**Adjusted three-year averages of previous kindergarten enrollments are used to project kindergarten enrollment.
TABLE 3PROJECTED ENROLLMENTS BY GRADE
2020-21 TO 2024-25
- 15 -

TAB
LE 4
New
ton
Pub
lic S
choo
lsE
nrol
lmen
t His
tory
and
Pro
ject
ions
by
Gra
de19
75 to
202
4
*Sta
rting
in 2
019,
onl
y st
uden
ts in
gra
de S
P ar
e in
clud
ed in
this
row
. Prio
r to
2019
, thi
s ro
w in
clud
ed s
tude
nts
in g
rade
s 9-
12 w
ho re
ceiv
ed s
peci
al e
duca
tion
serv
ices
out
side
the
regu
lar c
lass
room
for a
sig
nific
ant a
mou
nt o
f tim
e.
Gra
de19
7519
7619
7719
7819
7919
8019
8119
8219
8319
8419
8519
8619
8719
8819
8919
9019
9119
9219
9319
9419
9519
9619
9719
98K
946
843
750
681
635
612
628
584
647
673
687
726
730
744
827
809
827
874
906
874
837
870
808
841
11,
088
1,00
987
380
472
370
265
265
061
768
871
273
474
975
377
385
184
586
592
194
690
487
188
785
02
1,07
81,
069
1,01
089
281
275
567
864
964
861
069
269
272
573
875
577
685
184
587
991
892
088
787
389
83
1,11
41,
080
1,04
21,
022
878
819
746
676
667
659
610
680
693
734
770
767
775
859
870
882
895
925
878
874
41,
116
1,10
31,
073
1,01
91,
002
877
797
739
661
649
642
594
677
705
730
782
763
775
850
869
876
886
923
876
51,
191
1,10
11,
089
1,05
51,
005
1,00
086
277
469
965
063
463
559
267
869
873
977
275
774
883
884
885
487
393
8SP
ED76
5654
5456
4036
4445
4447
6059
6570
6964
6042
3629
2518
16To
tal K
-56,
609
6,26
15,
891
5,52
75,
111
4,80
54,
399
4,11
63,
984
3,97
34,
024
4,12
14,
225
4,41
74,
623
4,79
34,
897
5,03
55,
216
5,36
35,
309
5,31
85,
260
5,29
3C
hang
e-1
97-3
48-3
70-3
64-4
16-3
06-4
06-2
83-1
32-1
151
9710
419
220
617
010
413
818
114
7-5
49
-58
33%
Cha
nge
-2.9
%-5
.3%
-5.9
%-6
.2%
-7.5
%-6
.0%
-8.4
%-6
.4%
-3.2
%-0
.3%
1.3%
2.4%
2.5%
4.5%
4.7%
3.7%
2.2%
2.8%
3.6%
2.8%
-1.0
%0.
2%-1
.1%
0.6%
61,
289
1,19
41,
102
1,09
21,
033
985
960
832
765
689
638
614
626
590
674
710
750
770
746
752
825
833
838
846
71,
254
1,26
71,
150
1,05
31,
024
982
928
884
787
739
650
610
589
625
599
665
692
717
742
754
729
822
836
840
81,
215
1,26
91,
258
1,13
11,
053
1,01
195
893
488
478
673
764
161
358
063
461
467
770
772
875
775
474
282
886
4SP
ED19
1913
1210
511
1421
2932
2830
3225
2631
3562
3835
4560
64To
tal 6
-83,
777
3,74
93,
523
3,28
83,
120
2,98
32,
857
2,66
42,
457
2,24
32,
057
1,89
31,
858
1,82
71,
932
2,01
52,
150
2,22
92,
278
2,30
12,
343
2,44
22,
562
2,61
4C
hang
e8
-28
-226
-235
-168
-137
-126
-193
-207
-214
-186
-164
-35
-31
105
8313
579
4923
4299
120
52%
Cha
nge
0.2%
-0.7
%-6
.0%
-6.7
%-5
.1%
-4.4
%-4
.2%
-6.8
%-7
.8%
-8.7
%-8
.3%
-8.0
%-1
.8%
-1.7
%5.
7%4.
3%6.
7%3.
7%2.
2%1.
0%1.
8%4.
2%4.
9%2.
0%
91,
239
1,19
11,
245
1,20
51,
103
1,01
398
996
698
089
880
176
370
065
860
766
664
568
973
477
477
374
977
686
910
1,36
61,
273
1,22
41,
271
1,22
51,
126
1,02
01,
000
907
964
931
826
753
686
654
615
692
670
709
706
766
762
748
790
111,
418
1,33
11,
295
1,21
31,
260
1,21
01,
094
1,01
31,
001
916
902
863
788
739
676
656
617
684
687
659
707
759
752
765
121,
384
1,39
21,
331
1,27
61,
192
1,23
21,
219
1,08
21,
009
987
910
908
849
753
720
675
658
629
675
656
672
695
754
756
SPED
*49
4546
3939
5757
5773
7375
6167
6264
6869
7461
112
110
125
9279
Tota
l 9-1
25,
456
5,23
25,
141
5,00
44,
819
4,63
84,
379
4,11
83,
970
3,83
83,
619
3,42
13,
157
2,89
82,
721
2,68
02,
681
2,74
62,
866
2,90
73,
028
3,09
03,
122
3,25
9C
hang
e-1
21-2
24-9
1-1
37-1
85-1
81-2
59-2
61-1
48-1
32-2
19-1
98-2
64-2
59-1
77-4
11
6512
041
121
6232
137
% C
hang
e-2
.2%
-4.1
%-1
.7%
-2.7
%-3
.7%
-3.8
%-5
.6%
-6.0
%-3
.6%
-3.3
%-5
.7%
-5.5
%-7
.7%
-8.2
%-6
.1%
-1.5
%0.
0%2.
4%4.
4%1.
4%4.
2%2.
0%1.
0%4.
4%
Gra
nd T
otal
15,8
4215
,242
14,5
5513
,819
13,0
5012
,426
11,6
3510
,898
10,4
1110
,054
9,70
09,
435
9,24
09,
142
9,27
69,
488
9,72
810
,010
10,3
6010
,571
10,6
8010
,850
10,9
4411
,166
Cha
nge
-310
-600
-687
-736
-769
-624
-791
-737
-487
-357
-354
-265
-195
-98
134
212
240
282
350
211
109
170
9422
2%
Cha
nge
-1.9
%-3
.8%
-4.5
%-5
.1%
-5.6
%-4
.8%
-6.4
%-6
.3%
-4.5
%-3
.4%
-3.5
%-2
.7%
-2.1
%-1
.1%
1.5%
2.3%
2.5%
2.9%
3.5%
2.0%
1.0%
1.6%
0.9%
2.0%
- 16 -

TAB
LE 4
New
ton
Pub
lic S
choo
lsE
nrol
lmen
t His
tory
and
Pro
ject
ions
by
Gra
de19
75 to
202
4
*Sta
rting
in 2
019,
onl
y st
uden
ts in
gra
de S
P ar
e in
clud
ed in
this
row
. Prio
r to
2019
, thi
s ro
w in
clud
ed s
tude
nts
in g
rade
s 9-
12 w
ho re
ceiv
ed s
peci
al e
duca
tion
serv
ices
out
side
the
regu
lar c
lass
room
for a
sig
nific
ant a
mou
nt o
f tim
e.
Gra
de K 1 2 3 4 5SP
EDTo
tal K
-5C
hang
e%
Cha
nge
6 7 8SP
EDTo
tal 6
-8C
hang
e%
Cha
nge
9 10 11 12SP
ED*
Tota
l 9-1
2C
hang
e%
Cha
nge
Gra
nd T
otal
Cha
nge
% C
hang
e
1999
2000
2001
2002
2003
2004
2005
2006
2007
2008
2009
2010
2011
2012
2013
2014
2015
2016
2017
2018
2019
2020
2021
2022
2023
2024
787
736
766
792
796
805
867
887
868
830
862
896
895
934
958
938
877
885
850
848
825
837
822
813
806
794
866
804
749
805
837
856
853
916
926
950
877
926
940
936
977
999
1,00
594
396
690
790
289
489
989
087
487
386
785
781
179
582
883
686
889
595
092
498
990
895
696
694
597
999
21,
042
960
980
918
919
910
913
906
890
901
889
849
815
818
831
860
896
892
962
931
1,00
792
398
198
294
697
71,
005
1,04
197
096
892
592
791
992
491
788
790
189
685
581
781
984
785
989
790
896
793
21,
017
938
993
980
949
976
1,02
01,
058
952
978
928
934
926
934
885
894
916
894
832
811
820
851
858
905
884
960
937
1,02
194
499
198
595
098
71,
024
1,06
196
098
593
694
794
119
1615
1410
1718
1417
1917
1719
140
00
00
00
00
05,
212
5,09
75,
002
4,97
04,
938
4,97
55,
133
5,31
85,
408
5,49
85,
527
5,64
65,
687
5,79
05,
799
5,83
35,
785
5,80
15,
824
5,78
75,
626
5,51
35,
471
5,40
55,
383
5,34
9-8
1-1
15-9
5-3
2-3
237
158
185
9090
2911
941
103
934
-48
1623
-37
-161
-113
-42
-66
-22
-34
-1.5
%-2
.2%
-1.9
%-0
.6%
-0.6
%0.
7%3.
2%3.
6%1.
7%1.
7%0.
5%2.
2%0.
7%1.
8%0.
2%0.
6%-0
.8%
0.3%
0.4%
-0.6
%-2
.8%
-2.0
%-0
.8%
-1.2
%-0
.4%
-0.6
%
911
869
858
916
895
829
804
824
828
829
877
863
922
900
978
922
963
961
931
973
995
1,04
194
097
192
693
384
393
088
187
590
288
983
681
082
583
682
686
387
592
293
296
391
297
294
893
298
499
91,
043
944
979
931
846
851
923
884
867
898
892
837
797
809
848
817
866
889
939
921
943
927
989
946
924
986
1,00
11,
047
950
983
4022
2613
94
23
36
57
48
00
00
00
00
00
02,
640
2,67
22,
688
2,68
82,
673
2,62
02,
534
2,47
42,
453
2,48
02,
556
2,55
02,
667
2,71
92,
849
2,80
62,
818
2,86
02,
868
2,85
12,
903
3,02
62,
984
2,96
22,
855
2,84
726
3216
0-1
5-5
3-8
6-6
0-2
127
76-6
117
5213
0-4
312
428
-17
5212
3-4
2-2
2-1
07-8
1.0%
1.2%
0.6%
0.0%
-0.6
%-2
.0%
-3.3
%-2
.4%
-0.8
%1.
1%3.
1%-0
.2%
4.6%
1.9%
4.8%
-1.5
%0.
4%1.
5%0.
3%-0
.6%
1.8%
4.2%
-1.4
%-0
.7%
-3.6
%-0
.3%
918
872
868
925
899
892
919
905
877
821
835
904
875
931
954
977
945
992
980
1,01
299
796
61,
033
1,04
81,
099
994
875
888
872
865
933
899
906
911
912
868
846
850
896
886
941
941
973
976
998
983
1,03
61,
014
980
1,04
91,
065
1,11
575
586
787
788
786
392
589
892
792
790
286
284
384
389
788
896
493
71,
007
988
999
1,00
01,
050
1,02
899
41,
066
1,08
077
276
586
485
589
086
091
788
291
491
887
987
983
084
591
088
894
692
51,
006
984
1,02
099
81,
048
1,02
699
41,
065
7685
7986
7197
108
8465
8310
210
312
410
210
094
104
9686
6929
2929
2929
293,
396
3,47
73,
560
3,61
83,
656
3,67
33,
748
3,70
93,
695
3,59
23,
524
3,57
93,
568
3,66
13,
793
3,86
43,
905
3,99
64,
058
4,04
74,
082
4,05
74,
118
4,14
64,
253
4,28
313
781
8358
3817
75-3
9-1
4-1
03-6
855
-11
9313
271
4191
62-1
135
-25
6128
107
304.
2%2.
4%2.
4%1.
6%1.
1%0.
5%2.
0%-1
.0%
-0.4
%-2
.8%
-1.9
%1.
6%-0
.3%
2.6%
3.6%
1.9%
1.1%
2.3%
1.6%
-0.3
%0.
9%-0
.6%
1.5%
0.7%
2.6%
0.7%
11,2
4811
,246
11,2
5011
,276
11,2
6711
,268
11,4
1511
,501
11,5
5611
,570
11,6
0711
,775
11,9
2212
,170
12,4
4112
,503
12,5
0812
,657
12,7
5012
,685
12,6
1112
,596
12,5
7312
,513
12,4
9112
,479
82-2
426
-91
147
8655
1437
168
147
248
271
625
149
93-6
5-7
4-1
5-2
3-6
0-2
2-1
20.
7%0.
0%0.
0%0.
2%-0
.1%
0.0%
1.3%
0.8%
0.5%
0.1%
0.3%
1.4%
1.2%
2.1%
2.2%
0.5%
0.0%
1.2%
0.7%
-0.5
%-0
.6%
-0.1
%-0
.2%
-0.5
%-0
.2%
-0.1
%
Proj
ecte
d
- 17 -

ENROLLMENT PROJECTION METHOD
Kindergarten Projection Methodology
NESDEC Comparison
Accuracy of Projections
Frequently Asked Questions

Enrollment Analysis Report 2019
II. ENROLLMENT PROJECTION METHOD The enrollment projections are prepared by combining the current year’s official enrollment as reported on October 1, 2019 to the Department of Elementary and Secondary Education with other available demographic data for Newton. A model of five-year average cohort survival ratios are then applied to these data (in grades one through twelve). The projections are calculated on an individual school and grade basis and then aggregated into system-wide projections. Adjusted three-year averages are used for kindergarten this year, as explained later in this section. A cohort is defined as a group of students of a specific age or grade level who are at a specific school or are all going to the same school in the next year. Non-resident students are not included in the base for the cohort calculation, but are added to the total after the calculation. For example, assuming the five-year average cohort survival ratio for Bowen, Memorial-Spaulding, and Zervas grade 5 students moving on to grade 6 at Oak Hill is 0.97 and there are 232 resident students in this group, the cohort calculation would yield 225 (232 x 0.97) students. Eight current non-resident students would be added to this total, resulting in the final projection of 233 students for students entering the 6th grade at Oak Hill.
The following factors are integrated in the projections:
• School feeder patterns, district boundaries and buffer zones reflect current School Committee policies. Student assignment policy changes for the Angier, Zervas and Cabot districts, and the effects on nearby school districts, were approved in September 2015 and October 2018 and are fully integrated into the projections.
• METCO students are added to each school and grade after the projections are computed. METCO students who will enter the system in kindergarten, grade one or grade two each year for the next five years are also included in the individual school tables by grade.
• The number of entering middle and high school students is based on percentages of students from lower grade level schools to reflect districting, out-of assigned district placements, and buffer zones.
• The number of potential students from new residential properties is calculated and integrated into the projections when special permits have been issued by the City of Newton.
Kindergarten Projection Methodology
The following two charts provide historical data on kindergarten enrollment. The first chart shows the highest kindergarten populations of the past fifty years. The 2019-20 kindergarten class of 825 marks a fifth year of lower enrollments, a shift from the three recent years of enrollment over 900 students, of which the 2013-14 enrollment was the peak. The second chart illustrates the rising trend over time of how Newton’s four-year old population (documented on the City census) relates to the kindergarten population. The
- 18 -

Enrollment Analysis Report 2019
ratio has been rising due to decreasing numbers of children age 4 on the census compared to the number of kindergarten students each year. The number of 4-year olds on the city census has been under 600 children since 2013, when previously 600 to 700 children were typically recorded.
Next year’s kindergarten projection of 837 students is calculated using an adjusted three-year average of the previous kindergarten enrollments, a more conservative approach than the four-year or five-year average. The three-year average captures experience with kindergarten populations in the recent past and excludes all of the record high kindergarten years. Similar to the average cohort survival ratio methodology, the three-year average for kindergarten students is calculated for resident students, and non-resident student projections are added to each year’s projection after the average has been calculated. An adjustment has been made to the kindergarten projection in each of the next five years by deducting one kindergarten student from each school (for a total deduction of 15 students in each year of the projection). This adjustment has been included to bring the projections more in line with recent birth rate data, which indicates a decline in birth rates for upcoming kindergarten classes (as described below). In the past, the kindergarten projection method has incorporated city census data on children age 4. However, in recent years, this data has not been a good predictor of the number of kindergarten students and therefore is not included.
Resident births to kindergarten ratios are displayed below. Comparing each year’s kindergarten population to the number of state recorded Newton births five years prior yields a birth to kindergarten ratio. The 771 resident births in 2015 and the kindergarten class of 837 students projected next year in 2020-21 produce a ratio of 1.09 which is similar to recent experience. The current 2019-20 year has a lower ratio, with 797 resident births and a kindergarten class of 825 students, resulting in a birth to
Highest Kindergarten Populations of Past 50 YearsTime Period Number of K Students
1970-71 1,1551971-72 1,0631972-73 1,0101973-74 9681974-75 9981975-76 9462013-14 9582019-20 825
50 year average 82920 year average 85610 year average 891
Year 2002 2003 2004 2005 2006 2007 2008 2009 2010 2011 2012 2013 2014 2015 2016 2017 2018 20194-year olds 828 796 767 770 723 744 683 686 705 708 682 615 554 567 473 509 544 487K population 792 796 805 867 887 868 830 862 896 895 934 958 938 877 885 850 848 825
Ratio 0.96 1.00 1.05 1.13 1.23 1.17 1.22 1.26 1.27 1.26 1.37 1.56 1.69 1.55 1.87 1.67 1.56 1.69
Age Four to Kindergarten Ratio
- 19 -

Enrollment Analysis Report 2019
kindergarten ratio of 1.04 which is similar to the 2017-18 school year, and relatively low compared with other recent years.
NESDEC Comparison The enrollment analysis report includes projections for the Newton Public Schools from NESDEC (the New England School Development Council) as comparative data. In total by all grade levels, NESDEC’s enrollment projections for 2020-21 are very close to Newton’s projections. NESDEC is projecting one student higher than Newton for next year; by level, NESDEC is projecting slightly smaller elementary level classes and slightly larger high school level classes than Newton. NESDEC uses a five-year average of Newton resident birth data to project kindergarten enrollment five years later; to project kindergarten enrollment in the last year of the projection, NESDEC uses estimated numbers of births. Please see Table 11 of Appendix D for more detail. There is a large divergence between Newton and NESDEC’s kindergarten projections in the second, third, and fourth years of the projections, with a difference of 53, 53, and 84 students respectively (Newton’s projections are higher). NESDEC’s lower projections of kindergarten students in these years are due to lower birth rate data five years prior (in 2016, 2017, and 2018, respectively). Birth data from the Massachusetts Registry of Vital Records and Statistics documents 706 resident births in 2016, 696 resident births in 2017, and 661 births in 2018, which indicate a decline in the birth rates from recent years (see table above). This decline in the birth rate is the reason an adjusted three-year average is utilized for Newton’s kindergarten projections. There are two additional differences between NESDEC’s projection methodology and Newton’s. First, NESDEC’s projections are calculated by total grade rather than by school and by grade. Second, NESDEC uses different cohort survival ratios for all grades influenced by their regional experience of school districts whereas Newton uses a five-year ratio based on Newton data for grades K through 12.
Accuracy of Projections Several tables are included to show how accurately Newton Public Schools projections match actual enrollment. The table below shows the projections for the current year (2019-20) by grade level compared to predictions one, two and three years ago.
Birth Year 2004 2005 2006 2007 2008 2009 2010 2011 2012 2013 2014 2015**# of Births 844 788 812 815 907 806 787 787 812 801 797 771Kindergarten Year 2009 2010 2011 2012 2013 2014 2015 2016 2017 2018 2019 2020Kindergarten 862 896 895 934 958 938 877 885 850 848 825 837Ratio 1.02 1.14 1.10 1.15 1.06 1.16 1.11 1.12 1.05 1.06 1.04 1.09*Source is the Massachusetts Department of Public Health, Vital Statistics (obtained through NESDEC).** Kindergarten class is projected.
Births to Kindergarten RatiosResident Births* to Kindergarten Ratios
- 20 -

Enrollment Analysis Report 2019
The effect of four years of lower kindergarten enrollments is reflected in the elementary projections for October 2019, which have decreased in each of the three prior enrollment projections. The middle school and high school projections made last fall were relatively accurate. Overall, the October 1, 2019 actual enrollment of 12,611 students is 91 students lower than projected one year ago in the November 2018 Enrollment Analysis Report, a -0.7% variance from projection. For comparison, variances from projection also were negative in four of the prior five years: specifically, -0.7% in 2018-19, -0.3% in 2017-18, -1.4% in 2015-16, and -0.7% in 2014-15. In the past 18 years, Newton has had eight negative variances when actual enrollment has been lower than projected enrollment. In ten years of this time period, the actual enrollment has been higher than the projection. This year, elementary and middle grade levels are enrolled at lower than projected levels with 98 and 10 fewer students, respectively, while the high school level is enrolled at higher than projected levels (17 students above projection). Table 5 provides a one-page summary of last year’s projections by school. Of the ten elementary schools that had enrollments lower than projected, Ward had the largest variance of -11.5%. Five elementary schools enrolled more than (or the same as) projected; Bowen had the largest variance of +3.0%. Bigelow was the only middle school that varied from projection by more than 1%, with a variance of -3.5% (18 fewer students). Newton North enrolled slightly fewer students than projected with a variance of -0.4% (-9 students) and Newton South enrolled more students than projected with a variance of 1.3% (+26 students). Table 6 provides school and grade detail comparing the 2019-20 enrollment to the projections made last year. This table illustrates that, similar to last year, kindergarten had the highest variance from projection, -5.2%. Grades 3 and 4 also had variances greater than 1%, with -2.1% and -3.0%, respectively. At the middle school grade level, grades 6 and 7 had variances greater than 1%, with -1.7% and +1.5%, respectively. At the high school grade level, grades 10 and 12 had variances greater than 1%, with variances of +1.9% (or 19 students) and +2.7% (or 27 students), respectively. At the high school grade level, however, please note that new this year, students who receive special education services outside the regular classroom for a significant amount of time are included with their grade level cohorts. In prior years, projections and actual high school grade level numbers removed these students from their grade level cohorts and included them in the Special Education row. Variances at the high school level, therefore, are less meaningful this year, as the methodology has changed.
Date Projected Elementary Middle High School TotalFall 2016 5,853 2,855 4,116 12,824Fall 2017 5,816 2,852 4,112 12,780Fall 2018 5,724 2,913 4,065 12,702
Actual October 2019 5,626 2,903 4,082 12,611
Projection History for 2019-20 (FY20)
- 21 -

Enrollment Analysis Report 2019
Table 7 provides actual enrollment, corresponding projections, and percentage variance for each of the past five years since 2014-15, as well as the projections through 2024-25.
- 22 -

SCH
OO
LS
OC
TOB
ER
2018
AC
TUAL
K1
23
45
OC
TOB
ER
2019
AC
TUAL
DIF
F.
2019
-20
18%
DIF
F.20
19
Pro
ject
ed*
DIF
F.
AC
TUA
L/P
RO
J.%
DIF
F.A
ngie
r50
365
8673
9982
9750
2-1
-0.2
%51
7-1
5-2
.9%
Bow
en39
755
6268
6262
6337
2-2
5-6
.3%
361
113.
0%B
urr
384
6260
7246
5670
366
-18
-4.7
%36
7-1
-0.3
%C
abot
386
6665
6260
6872
393
71.
8%39
5-2
-0.5
%C
ount
rysi
de41
355
6867
7266
8541
30
0.0%
404
92.
2%Fr
ankl
in42
765
6166
8357
8141
3-1
4-3
.3%
417
-4-1
.0%
Hor
ace
Man
n39
957
6361
7175
6439
1-8
-2.0
%38
83
0.8%
Linc
oln-
Elio
t36
555
6866
5853
6236
2-3
-0.8
%35
57
2.0%
Mas
on-R
ice
487
5861
6778
9191
446
-41
-8.4
%46
2-1
6-3
.5%
Mem
oria
l-Spa
uldi
ng46
451
6383
8491
9346
51
0.2%
467
-2-0
.4%
Pei
rce
271
4349
4743
4557
284
134.
8%28
40
0.0%
Und
erw
ood
290
4240
3645
4264
269
-21
-7.2
%28
4-1
5-5
.3%
War
d29
634
4035
4547
5425
5-4
1-1
3.9%
288
-33
-11.
5%W
illia
ms
278
3840
5139
5637
261
-17
-6.1
%27
9-1
8-6
.5%
Zerv
as42
779
7664
8361
7143
47
1.6%
456
-22
-4.8
%SU
B-T
OTA
L5,
787
825
902
918
968
952
1061
5,62
6-1
61-2
.8%
5,72
4-9
8-1
.7%
SCH
OO
LS6
78
Big
elow
501
162
176
156
494
-7-1
.4%
512
-18
-3.5
%B
row
n74
426
327
723
877
834
4.6%
771
70.
9%D
ay97
633
032
934
099
923
2.4%
994
50.
5%O
ak H
ill63
024
020
219
063
22
0.3%
636
-4-0
.6%
SUB
-TO
TAL
2,85
199
598
492
42,
903
521.
8%2,
913
-10
-0.3
%
SCH
OO
LS9
1011
12S
P**
New
ton
Nor
th2,
136
503
539
500
529
282,
099
-37
-1.7
%2,
108
-9-0
.4%
New
ton
Sou
th1,
911
494
497
500
491
11,
983
723.
8%1,
957
261.
3%SU
B-T
OTA
L4,
047
997
1036
1000
1020
294,
082
350.
9%4,
065
170.
4%
GR
AND
TO
TAL
12,6
8512
,611
-74
-0.6
%12
,702
-91
-0.7
%*M
ETC
O s
tude
nts
are
incl
uded
in a
ll sc
hool
s' p
roje
cted
enr
ollm
ents
.
**S
tude
nts
rece
ivin
g sp
ecia
l edu
catio
n se
rvic
es b
eyon
d gr
ade
12.
Oct
ober
201
9 Ac
tual
By
Gra
de
TAB
LE 5
CO
MPA
RIS
ON
OF
OC
TOB
ER, 2
018
AND
OC
TOB
ER, 2
019
ENR
OLL
MEN
TS A
ND
CO
MPA
RIS
ON
OF
PRO
JEC
TED
WIT
H A
CTU
AL O
CTO
BER
, 201
9 EN
RO
LLM
ENT
- 23 -

Actual 19/20
Proj. 19/20
Actual 19/20
Proj. 19/20
Actual 19/20
Proj. 19/20
Actual 19/20
Proj. 19/20
Actual 19/20
Proj. 19/20
K 65 74 55 60 62 57 66 65 55 601 86 91 62 59 60 58 65 66 68 612 73 77 68 63 72 69 62 63 67 633 99 101 62 58 46 49 60 62 72 684 82 87 62 65 56 62 68 66 66 705 97 87 63 56 70 72 72 73 85 82
Total 502 517 372 361 366 367 393 395 413 404
Actual 19/20
Proj. 19/20
Actual 19/20
Proj. 19/20
Actual 19/20
Proj. 19/20
Actual 19/20
Proj. 19/20
Actual 19/20
Proj. 19/20
K 65 61 57 56 55 54 58 61 51 721 61 61 63 64 68 56 61 60 63 632 66 63 61 61 66 63 67 70 83 803 83 86 71 71 58 62 78 78 84 784 57 60 75 75 53 52 91 94 91 845 81 86 64 61 62 68 91 99 93 90
Total 413 417 391 388 362 355 446 462 465 467
Actual 19/20
Proj. 19/20
Actual 19/20
Proj. 19/20
Actual 19/20
Proj. 19/20
Actual 19/20
Proj. 19/20
Actual 19/20
Proj. 19/20
K 43 51 42 39 34 42 38 48 79 701 49 47 40 46 40 47 40 48 76 772 47 43 36 39 35 40 51 51 64 693 43 46 45 49 45 49 39 40 83 924 45 42 42 46 47 52 56 58 61 685 57 55 64 65 54 58 37 34 71 80
Total 284 284 269 284 255 288 261 279 434 456
GradeActual 19/20
Proj. 19/20
K 825 870 -45 -5.2%1 902 904 -2 -0.2%2 918 914 4 0.4%3 968 989 -21 -2.1%4 952 981 -29 -3.0%5 1061 1066 -5 -0.5%
Total 5,626 5,724 -98 -1.7%
M-Spaulding
Zervas
Mason-RiceFranklin
Peirce Williams
Grade
% Diff.
Grade
TOTAL ELEM.
Lincoln-Eliot
Underwood Ward
Horace Mann
N Diff
Bowen Burr Cabot
TABLE 6ACTUAL AND PROJECTED ELEMENTARY ENROLLMENTS BY SCHOOL 2019-20
Countryside
Grade
Angier
- 24 -

Actual 19/20
Proj. 19/20
Actual 19/20
Proj. 19/20
Actual 19/20
Proj. 19/20
Actual 19/20
Proj. 19/20
6 162 182 263 272 330 321 240 2377 176 171 277 270 329 322 202 2068 156 159 238 229 340 351 190 193
Total 494 512 778 771 999 994 632 636
Actual 19/20
Proj. 19/20
995 1012 -17 -1.7%984 969 15 1.5%924 932 -8 -0.9%
2,903 2,913 -10 -0.3%
Actual 19/20
Proj. 19/20
Actual 19/20
Proj. 19/20
Actual 19/20
Proj. 19/20
9 503 509 494 481 997 990 7 0.7%10 539 536 497 481 1,036 1,017 19 1.9%11 500 500 500 496 1,000 996 4 0.4%12 529 505 491 488 1,020 993 27 2.7%
SP* 28 58 1 11 29 69 -40 -58.0%Total 2,099 2,108 1,983 1,957 4,082 4,065 17 0.4%
5,626 5,724 -98 -1.7%2,903 2,913 -10 -0.3%4,082 4,065 17 0.4%12,611 12,702 -91 -0.7%
TABLE 6 (CONT.)ACTUAL AND PROJECTED SECONDARY ENROLLMENTS BY SCHOOL 2019-20
%Diff.Division
Actual 19/20
Proj. 19/20
N Diff.
7
N Diff.Grade
Bigelow
Grade
Brown
Grade
TOTAL MIDDLEN
Diff.%
Diff.
*Starting in 19/20 (actual), only students in grade SP are included in this row. In the 19/20 projections, this row included students in grades 9-12 who received special education services outside the regular classroom for a significant amount of time.
Total
Day
ElementaryMiddleHigh
Oak Hill
6
% Diff.
TOTAL HIGH
8Total
SouthNorth
- 25 -

Actu
al
Proj
.Ac
tual
Pr
oj.
Actu
al
Proj
.Ac
tual
Pr
oj.
Actu
al
Proj
.Ac
tual
Pr
oj.
Proj
.Pr
oj.
Proj
.Pr
oj.
Proj
.G
rade
14/1
514
/15
15/1
615
/16
16/1
716
/17
17/1
817
/18
18/1
918
/19
19/2
019
/20
20/2
121
/22
22/2
323
/24
24/2
5K
938
892
877
922
885
895
850
902
848
885
825
870
837
822
813
806
794
199
910
0710
0597
994
392
796
693
590
790
190
290
489
489
989
087
487
32
979
1008
992
1020
1042
1016
960
955
980
978
918
914
919
910
913
906
890
394
696
697
799
710
0510
0810
4110
6097
097
196
898
992
592
791
992
491
74
980
994
949
955
976
988
1020
1013
1058
1050
952
981
978
928
934
926
934
599
199
398
598
695
095
398
798
010
2410
3110
6110
6696
098
593
694
794
1To
tal
5,83
35,
860
5,78
55,
859
5,80
15,
787
5,82
45,
845
5,78
75,
816
5,62
65,
724
5,51
35,
471
5,40
55,
383
5,34
96
922
911
963
959
961
954
931
925
973
964
995
1012
1041
940
971
926
933
796
398
691
292
697
297
094
896
893
293
598
496
999
910
4394
497
993
18
921
941
943
967
927
914
989
979
946
953
924
932
986
1001
1047
950
983
Tota
l2,
806
2,83
82,
818
2,85
22,
860
2,83
82,
868
2,87
22,
851
2,85
22,
903
2,91
33,
026
2,98
42,
962
2,85
52,
847
997
799
994
598
399
299
698
097
910
1210
4099
799
096
610
3310
4810
9999
410
941
967
973
982
976
945
998
1002
983
988
1036
1017
1014
980
1049
1065
1115
1196
493
993
794
510
0797
698
898
899
910
1310
0099
610
5010
2899
410
6610
8012
888
886
946
968
925
934
1006
1005
984
985
1020
993
998
1048
1026
994
1065
SP*
9410
010
494
9610
486
9669
8629
6929
2929
2929
Tota
l3,
864
3,89
13,
905
3,97
23,
996
3,95
54,
058
4,07
04,
047
4,11
24,
082
4,06
54,
057
4,11
84,
146
4,25
34,
283
K-12
TOTA
L12
,503
12,5
8912
,508
12,6
8312
,657
12,5
8012
,750
12,7
8712
,685
12,7
8012
,611
12,7
0212
,596
12,5
7312
,513
12,4
9112
,479
% V
aria
nce
-0.7
%-1
.4%
0.6%
-0.3
%-0
.7%
-0.7
%N
/AN
/AN
/AN
/AN
/A
TAB
LE 7
ACTU
AL A
ND
PR
OJE
CTE
D K
-12
ENR
OLL
MEN
TS 2
014-
15 T
O 2
024-
25
- 26 -

Enrollment Analysis Report 2019
Frequently Asked Questions
1. Why do we need to know how many students may be attending each school in Newton in future years?
Enrollment projections are useful for decision-making and planning, especially in light of enrollment changes and residential development. Carefully crafted, presented and interpreted projections are a key first step in the planning process. The district is then able to plan the budgets, including capital improvements, classroom space requirements, sufficient teacher workforce and staffing, instructional materials, transportation and so forth. Accurate projections alert the district to changes in school population to allow for needed adjustments. In addition to the projections, school principals provide critical data on enrollments and registrations each spring. These projections help communities to better understand the impact of trends and changes in enrollment, migration and births on school population. All projections are based on underlying assumptions that use historical school enrollment and census data.
2. Why can’t the principals count the students who are in their school and add the students who are coming next year?
This technique may work very well in small, stable communities for a single year's projection. However, larger communities like Newton, with a need for long-term planning, require more complex approaches in order to project enrollment trends some years into the future. Research done on Newton’s high school enrollment showed that a significant number of students enter and exit the system during the school year and during each summer. Reliance on class lists would provide a less accurate picture than the use of a statistical model that accounts for movements in and out of each school and the system as a whole. It is worth noting that Newton’s elementary school principals submit expected numbers of pupils in May and June so that planning for classrooms and teaching staff can proceed with the most recent information.
3. What procedures are used in other school systems across the United States?
Most school systems use the “Cohort Survival” method, or some variation, as the technique to provide enrollment projections. The basic unit used in this technique is the ratio, a measure that expresses the relative size of two numbers. The cohort survival ratio method models and calculates the flow of a cohort or age group of pupils through the system from one grade to the next over a number of years.
The ratios are influenced by several variables--census data, birth rates, student entrances, exits, and transfers, non-public school enrollment patterns, frequency of promotions or retentions, drop-out rates, the proportion of the city school-age population, housing patterns, the number of building permits issued, and other urban trends. Because these variables change from year to year and from school to school, an average ratio of three to five years is used to project for the future. The more stable the community or the individual school neighborhood, the easier and more reliable the projections.
- 27 -

Enrollment Analysis Report 2019
The advantages of this type of model are: (1) it captures the multiple forces which affect population changes (move-ins, move-outs, transfers between schools); and (2) it distinguishes changes in each age group rather than looking at a composite of all changes.
A limited number of school systems have prepared enrollment projections using other procedures. For example, regression analysis utilizing the same predictors - births and past tendencies of school children to advance from one grade to the next - can be employed. Other methods include: growth technique (establishes a district level enrollment curve based on ratios, migration, retention, drop-outs, private school enrollment, etc.); historical comparison of dwellings to enrollment used to base projections; method of analogy (analysis of national trends or local growth influence on district enrollment); and the multiple factor method (study of social and economic factors’ influence on enrollment).
4. What procedure historically has been utilized in Newton?
The cohort survival ratio method for system-wide projections with adjustments, if appropriate, at the school level has been used for many years. In the past, a combination of three-year, four-year, and five-year average ratios has been used, with the greatest variation in the kindergarten projection method. The method consistently has relied upon five-year ratios for grades 1 through 12 in order to provide a consistent timeframe for the model across all schools and to take advantage of a full five years of experience. The method used to project kindergarten has relied upon a combination of approaches in order to arrive at the most reasonable projection, given high variability in class size. In the past for kindergarten projections, Newton has used city census data for the number of children aged 3 or 4 years as compared to the kindergarten population two years hence, but this has not been possible in recent years.
5. How accurate are projections?
The quality of the data obviously influences the accuracy of the projections. Cohort survival relies on data that is usually readily available and reasonably reliable - census data on births and past enrollments.
"Goodness of fit," a measure of the percentage of error, is determined by dividing the difference between the actual and projected enrollment for each level by the projected enrollment figure. The errors are the magnitude of the percentage difference between projected and actual enrollments. A small percentage of error is preferred. Research literature indicates that total school district enrollment may be projected with an accuracy of plus or minus 1%, yet an individual school's error rate might exceed 10%. Past system-wide error rates in Newton have been low, at around +/-1%, while grade level and school based projections have been higher.
In summary, short-term projections are generally more accurate than long-term projections. Projections for districts with larger enrollments are more accurate than those for smaller districts. System-wide projections are more accurate than individual school projections. Error is especially important to consider when reviewing the data beyond five years in the future. These projections, at best, provide only the direction or trend enrollments will take into the future. This is because beyond the fourth year of the
- 28 -

Enrollment Analysis Report 2019
projection, elementary enrollments must be based on predicted births in a calendar year that is not yet complete, and for which data has not yet been 100% collected. Secondary level enrollments can be projected beyond that point with a greater assurance of reliability.
- 29 -

ENROLLMENT HISTORY
Grade-by-Grade Analysis
A Comparison to Peak Enrollment Years

Enrollment Analysis Report 2019
III. ENROLLMENT HISTORY
This section of the report looks at historical enrollment patterns in two ways. The first is on a grade-by-grade basis, tracking the in- and out-migration of students as each kindergarten class moves through the system. The second provides a look at current enrollment as compared with peak enrollment years.
Grade-by-Grade Analysis
Table 8 shows the changes in size of each grade cohort from 2018-19 to 2019-20. Most cohort migrations were positive, the largest of which was 54 students from kindergarten to grade 1. The net in-migration from grade 8 to grade 9 was also large, with cohort growth of 51 students. There were negative migrations for some cohorts in elementary and middle schools, specifically grade 2 to grade 3 (-12 students), grade 3 to grade 4 (-18 students), grade 5 to grade 6 (-29 students), and grade 7 to grade 8 (-8 students).
Table 9 shows Newton's historical cohort survival ratios by grade from 1991-92 through 2019-20. This table shows the net in- and out-migration patterns for each grade level. Ratios greater than one indicate growth and ratios less than one indicate a decrease in the cohort. Over the years, each cohort moving from K-1 has a survival ratio greater than one, indicating net in-migration. In the past five years, the ratio from grade K-1 has been high, (1.06 or higher), underscoring Newton’s consistent experience of cohort growth in early elementary grades. The average cohort growth of K-1 and 1-2 is a ratio of 1.04 this year, the same as last year.
This year’s ratio of 0.97 from grade 5-6 is typical of most recent years; in past years and in this year, the transition from elementary school to middle school has been marked by net out-migration between grades 5 to 6, as some students leave to enroll in private schools. Conversely, the transition from grade 8 to high school has historically shown a net in-migration as students enter the public schools during this transition year. This year’s ratio from grade 8 to grade 9 is 1.05, higher than last year’s ratio of 1.02, and similar to the two years prior.
A Comparison to Peak Enrollment Years
Current Newton South High School enrollment of 1,983 students is at an historic peak. The total 2019-20 enrollment of 12,611 is 68% of the 1967 peak enrollment of 18,424. At the beginning of the most recent growth trend in 2004, the district’s enrollment of 11,268 students was 61% of the 1967 peak year.
Peak Enrollment Year Number of K -12 Schools K-12 18,424 1967 23 Elementary, 5 Jr. Highs, 2 Sr. Highs K-6 9,887 1960 25 Elementary, 5 Jr. Highs, 2 Sr. Highs, 1 Technical High School North High 2,976 1972 23 Elementary, 5 Jr. Highs, 2 Sr. Highs South High 1,983 2019 15 Elementary, 4 Middle Schools, 2 High Schools
- 30 -

TABLE 8ENROLLMENTS BY GRADE
2018 and 2019
October 1 Enrollment Changes in Enrollment 2018-2019 to 2019-2020
Grade 2018Net
Migration 2019 N %
K 848 825 -23 -2.7%+54
1 907 902 -5 -0.6%+11
2 980 918 -62 -6.3%-12
3 970 968 -2 -0.2%-18
4 1,058 952 -106 -10.0%+3
5 1,024 1,061 +37 +3.6%-29
TOTAL ELEMENTARY SCHOOLS 5,787 5,626 -161 -2.8%
6 973 995 +22 +2.3%+11
7 932 984 +52 +5.6%-8
8 946 924 -22 -2.3%+51
9 1,012 997 -15 -1.5%+24
10 983 1,036 +53 +5.4%+17
11 999 1,000 +1 +0.1%+21
12 984 1,020 +36 +3.7%
SP* 69 29 -40 -58.0%
TOTAL SECONDARY SCHOOLS 6,898 6,985 +87 +1.3%GRAND TOTAL 12,685 12,611 -74 -0.6%
*Starting in 2019, only students in grade SP are included in this row. Prior to 2019, this row included students in grades 9-12 who received special education services outside the regular classroom for a significant amount of time.
- 31 -

Scho
ol
Year
K-1
1-2
2-3
3-4
4-5
5-6
6-7
7-8
8-9
9-10
10-1
111
-12
Aver
age
K-2
Aver
age
K
-5Av
erag
e Al
l Gra
des
91-9
21.
04
1.
00
1.
00
0.
99
0.
99
1.
01
0.
97
1.
02
1.
05
1.
04
1.
00
1.
00
1.
021.
011.
0192
-93
1.05
1.00
1.01
1.00
0.99
1.00
0.96
1.02
1.02
1.04
0.99
1.02
1.02
1.01
1.01
93-9
41.
05
1.
02
1.
03
0.
99
0.
97
0.
99
0.
96
1.
02
1.
04
1.
03
1.
03
0.
99
1.
031.
011.
0194
-95
1.04
1.00
1.00
1.00
0.99
1.01
1.01
1.02
1.06
0.96
0.93
0.95
1.02
1.01
1.00
95-9
61.
03
0.
97
0.
97
0.
99
0.
98
0.
98
0.
97
1.
00
1.
02
0.
99
1.
00
1.
02
1.
000.
990.
9996
-97
1.04
0.98
1.01
0.99
0.98
0.98
1.00
1.02
0.99
0.99
0.99
0.98
1.01
1.00
1.00
97-9
81.
02
1.
00
0.
99
1.
00
0.
99
0.
98
1.
00
1.
01
1.
05
1.
00
0.
99
0.
99
1.
011.
001.
0098
-99
1.05
1.01
1.00
1.00
1.02
0.97
1.00
1.03
1.05
1.02
1.02
1.01
1.03
1.02
1.02
99-0
01.
03
1.
02
1.
00
1.
01
1.
01
0.
97
1.
00
1.
01
1.
06
1.
01
0.
96
1.
01
1.
021.
021.
0100
-01
1.02
0.99
1.03
1.00
1.01
0.98
1.02
1.01
1.03
0.97
0.99
1.01
1.01
1.01
1.00
01-0
21.
02
1.
01
0.
99
1.
01
1.
02
0.
96
1.
01
0.
99
1.
02
1.
00
0.
99
1.
00
1.
011.
011.
0002
-03
1.05
1.06
1.00
1.01
1.00
1.00
1.02
1.00
1.00
1.00
1.02
0.97
1.06
1.02
1.01
03-0
41.
06
1.
03
1.
03
1.
00
0.
97
1.
00
0.
98
0.
99
1.
02
1.
01
1.
00
1.
00
1.
041.
021.
0104
-05
1.08
1.00
1.00
1.00
0.99
1.00
0.99
1.00
1.03
1.00
0.99
1.00
1.04
1.01
1.01
05-0
61.
06
1.
01
1.
03
1.
02
1.
00
0.
99
1.
01
1.
00
1.
02
1.
02
1.
00
0.
99
1.
041.
021.
0106
-07
1.06
1.05
1.03
1.00
1.00
1.00
1.01
1.00
1.01
0.99
1.02
0.98
1.05
1.03
1.01
07-0
81.
04
1.
04
1.
00
1.
00
1.
00
0.
97
1.
00
0.
98
1.
05
1.
01
1.
02
0.
99
1.
041.
021.
0108
-09
1.09
1.00
1.01
1.02
1.01
0.97
1.01
0.98
1.03
0.99
0.99
0.99
1.05
1.03
1.01
09-1
01.
06
1.
04
1.
01
1.
01
0.
97
0.
97
1.
00
1.
01
1.
03
1.
03
0.
99
0.
97
1.
051.
021.
0110
-11
1.07
1.04
1.02
1.00
0.99
0.98
0.98
0.99
1.07
1.02
1.00
1.02
1.05
1.02
1.01
11-1
21.
05
1.
03
1.
02
1.
01
1.
01
0.
96
1.
01
1.
00
1.
07
0.
99
0.
99
0.
98
1.
041.
021.
0112
-13
1.05
1.03
1.03
1.02
1.00
0.96
1.00
1.02
1.08
1.01
1.00
1.00
1.04
1.02
1.02
13-1
41.
05
1.
01
1.
02
1.
01
1.
01
0.
96
1.
04
1.
02
1.
07
1.
01
1.
00
1.
01
1.
031.
021.
0214
-15
1.04
1.00
1.00
1.00
1.00
0.98
0.98
0.99
1.04
0.99
1.02
1.00
1.02
1.01
1.00
15-1
61.
07
0.
99
1.
00
1.
00
1.
01
0.
97
0.
99
0.
98
1.
03
1.
00
1.
00
0.
98
1.
031.
011.
0016
-17
1.08
1.04
1.01
1.00
1.00
0.98
1.01
1.02
1.05
1.03
1.03
0.99
1.06
1.03
1.02
17-1
81.
09
1.
02
1.
00
1.
01
1.
01
0.
98
0.
99
1.
02
1.
06
1.
01
1.
01
1.
00
1.
051.
031.
0218
-19
1.07
1.01
1.01
1.02
1.00
0.99
1.00
1.00
1.02
1.00
1.00
1.00
1.04
1.02
1.01
19-2
01.
06
1.
01
0.
99
0.
98
1.
00
0.
97
1.
01
0.
99
1.
05
1.
02
1.
02
1.
02
1.
041.
011.
01
TAB
LE 9
HIS
TOR
ICAL
CO
HO
RT
SUR
VIVA
L R
ATIO
S B
Y G
RAD
E
- 32 -

INDIVIDUAL SCHOOL REPORTS

Enrollment Analysis Report 2019
IV. INDIVIDUAL SCHOOL REPORTS The individual school reports contain the following information: Elementary Schools
1. Enrollments by grade for last year (2018-19) and this year (2019-20) and the change in enrollment at each grade level. Enrollment projections by grade for the next five years (2020-21 to 2024-25) are also reported based on a 5-year cohort survival ratio average for grades 1 through 5 and an adjusted 3-year average for kindergarten.
2. Ten years of kindergarten and total school enrollments, with five years projected.
3. Actual and projected classroom distributions for five years including, for next school year, average class sizes and maximum class sizes by grade. The projected classroom distributions are theoretical and are for planning purposes to assess enrollment capacity and to plan for the utilization of buffer zones as necessary to balance enrollment.
4. A line graph depicting enrollment history over time and for projections (5 years).
Middle Schools
1. Enrollments by grade for last year (2018-19) and this year (2019-20) and the change in enrollment at each grade level. Enrollment projections by grade for the next five years (2020-21 to 2024-25) are also presented based on 5-year cohort survival ratio averages.
2. Ten years of enrollment change.
3. Number of 5th grade students from feeder elementary schools who will enter the 6th grade next year in 2020-21.
4. A line graph depicting enrollment history over time and for projections (5 years).
High Schools
1. Enrollments by grade for last year (2018-19) and this year (2019-20) and the change in enrollment at each grade level. Enrollment projections by grade for the next five years (2020-21 to 2024-25) are also presented based on a 5-year cohort survival ratio average.
2. Ten years of enrollment change.
3. Number of 8th grade students from feeder middle schools who will enter the 9th grade next year in 2020-21.
4. A line graph depicting enrollment history over time and for projections (5 years).
- 33 -

Angier
ACTUAL AND PROJECTED ENROLLMENTS BY GRADE
OctoberEnrollment Difference Projections Using 5-year Average Ratios
2018 2019 N % 2020 2021 2022 2023 2024Grade FY19 FY20 FY21 FY22 FY23 FY24 FY25
K 84 65 -19 -22.6% 70 72 69 67 69
1 73 86 13 17.8% 71 77 81 75 74
2 97 73 -24 -24.7% 91 76 82 86 80
3 86 99 13 15.1% 77 97 81 87 91
4 89 82 -7 -7.9% 99 77 97 81 87
5 74 97 23 31.1% 82 99 78 97 81
TOTAL 503 502* -1 -0.2% 490 498 488 493 482*2019 Includes 10 METCO students. Projections include new METCO students for each year.
TEN YEARS OF TOTAL SCHOOL ENROLLMENTS - FIVE PROJECTED
Enrollment Change from % Change fromYear K Total Previous Year Previous Year2010 57 3752011 62 395 20 5.3%2012 69 408 13 3.3%2013 67 417 9 2.2%2014 65 402 -15 -3.6%2015 62 409 7 1.7%2016 78 421 12 2.9%2017 65 467 46 10.9%2018 84 503 36 7.7%2019 65 502 -1 -0.2%2020 70 490 -12 -2.4%2021 72 498 8 1.6%2022 69 488 -10 -2.0%2023 67 493 5 1.0%2024 69 482 -11 -2.2%
Peak enrollment year: 2018, 503 students
- 34 -

Angier
2019 Avg. Class 2020 Avg. Class Max 2021 2022 2023 2024Grade FY20 Size FY21 Size Size FY22 FY23 FY24 FY25
K 3 21.7 3 23.3 24.0 3 3 3 3
1 4 21.5 3 23.7 24.0 3 4 3 4
2 4 18.3 4 22.8 23.0 4 4 4 4
3 5 19.8 4 19.3 20.0 5 4 4 4
4 4 20.5 5 19.8 20.0 4 4 4 4
5 4 24.3 4 20.5 21.0 4 4 4 4
TOTAL 23 23 22 23
Avg. Class Size
21.7 21.2 22.4 21.0
ACTUAL AND PROJECTED CLASSROOM DISTRIBUTIONS
Note: The projected classroom arrays are theoretical, not staffing patterns, and are for planning purposes to assess enrollment capacity and to plan for the utilization of buffer zones as necessary to balance enrollment.
24
20.9
Actual Projections Using 5-year Average Ratios***
23
21.3
100
200
300
400
500
600
Enrollment History and Projections
- 35 -

Bowen
ACTUAL AND PROJECTED ENROLLMENTS BY GRADE
OctoberEnrollment Difference Projections Using 5-year Average Ratios
2018 2019 N % 2020 2021 2022 2023 2024Grade FY19 FY20 FY21 FY22 FY23 FY24 FY25
K 54 55 1 1.9% 60 55 55 56 52
1 67 62 -5 -7.5% 59 64 60 60 62
2 60 68 8 13.3% 60 56 62 57 57
3 66 62 -4 -6.1% 66 58 54 60 56
4 55 62 7 12.7% 61 64 57 53 59
5 95 63 -32 -33.7% 65 64 68 60 56
TOTAL 397 372* -25 -6.3% 371 361 356 346 342*2019 Includes 10 METCO students. Projections include new METCO students for each year.
TEN YEARS OF TOTAL SCHOOL ENROLLMENTS - FIVE PROJECTED
Enrollment Change from % Change fromYear K Total Previous Year Previous Year2010 70 4492011 67 448 -1 -0.2%2012 79 477 29 6.5%2013 95 502 25 5.2%2014 65 475 -27 -5.4%2015 59 449 -26 -5.5%2016 60 417 -32 -7.1%2017 64 421 4 1.0%2018 54 397 -24 -5.7%2019 55 372 -25 -6.3%2020 60 371 -1 -0.3%2021 55 361 -10 -2.7%2022 55 356 -5 -1.4%2023 56 346 -10 -2.8%2024 52 342 -4 -1.2%
Peak enrollment year: 2013, 502 students
- 36 -

Bowen
2019 Avg. Class 2020 Avg. Class Max 2021 2022 2023 2024Grade FY20 Size FY21 Size Size FY22 FY23 FY24 FY25
K 3 18.3 3 20.0 20.0 3 3 3 3
1 3 20.7 3 19.7 20.0 3 3 3 3
2 3 22.7 3 20.0 20.0 3 3 3 3
3 3 20.7 3 22.0 22.0 3 3 3 3
4 3 20.7 3 20.3 21.0 3 3 3 3
5 3 21.0 3 21.7 22.0 3 3 3 3
TOTAL 18 18 18 18
Avg. Class Size
20.1 19.8 19.2 19.0
Note: The projected classroom arrays are theoretical, not staffing patterns, and are for planning purposes to assess enrollment capacity and to plan for the utilization of buffer zones as necessary to balance enrollment.
Actual Projections Using 5-year Average Ratios***
18 18
20.7 20.6
ACTUAL AND PROJECTED CLASSROOM DISTRIBUTIONS
100
200
300
400
500
600
Enrollment History and Projections
- 37 -

Burr
ACTUAL AND PROJECTED ENROLLMENTS BY GRADE
OctoberEnrollment Difference Projections Using 5-year Average Ratios
2018 2019 N % 2020 2021 2022 2023 2024Grade FY19 FY20 FY21 FY22 FY23 FY24 FY25
K 55 62 7 12.7% 60 59 59 57 60
1 69 60 -9 -13.0% 66 63 63 63 60
2 51 72 21 41.2% 60 67 63 64 63
3 62 46 -16 -25.8% 68 58 63 60 60
4 72 56 -16 -22.2% 45 66 57 61 59
5 75 70 -5 -6.7% 56 45 66 56 61
TOTAL 384 366* -18 -4.7% 355 358 371 361 363*2019 Includes 12 METCO students. Projections include new METCO students each year.
TEN YEARS OF TOTAL SCHOOL ENROLLMENTS - FIVE PROJECTED
Enrollment Change from % Change fromYear K Total Previous Year Previous Year2010 65 3912011 68 409 18 4.6%2012 65 415 6 1.5%2013 80 424 9 2.2%2014 70 424 0 0.0%2015 63 412 -12 -2.8%2016 48 402 -10 -2.4%2017 60 386 -16 -4.0%2018 55 384 -2 -0.5%2019 62 366 -18 -4.7%2020 60 355 -11 -3.0%2021 59 358 3 0.8%2022 59 371 13 3.6%2023 57 361 -10 -2.7%2024 60 363 2 0.6%
Peak enrollment year: 2013, 424 students
- 38 -

Burr
2019Avg. Clas 2020 Avg. Class Max 2021 2022 2023 2024Grade FY20 Size FY21 Size Size FY22 FY23 FY24 FY25
K 3 20.7 3 20.0 20.0 3 3 3 3
1 3 20.0 3 22.0 22.0 3 3 3 3
2 3 24.0 3 20.0 20.0 3 3 3 3
3 2 23.0 3 22.7 23.0 3 3 3 3
4 3 18.7 2 22.5 23.0 3 3 3 3
5 3 23.3 3 18.7 19.0 2 3 3 3
TOTAL 17 18 18 18
Avg. Class Size 21.1 20.6 20.1 20.2
Note: The projected classroom arrays are theoretical, not staffing patterns, and are for planning purposes to assess enrollment capacity and to plan for the utilization of buffer zones as necessary to balance enrollment.
21.5 20.9
Actual Projections Using 5-year Average Ratios***
17 17
ACTUAL AND PROJECTED CLASSROOM DISTRIBUTIONS
100
200
300
400
500
600
Enrollment History and Projections
- 39 -

Cabot
ACTUAL AND PROJECTED ENROLLMENTS BY GRADE
OctoberEnrollment Difference Projections Using 5-year Average Ratios
2018 2019 N % 2020 2021 2022 2023 2024Grade FY19 FY20 FY21 FY22 FY23 FY24 FY25
K 60 66 6 10.0% 68 68 70 68 66
1 59 65 6 10.2% 75 76 77 76 75
2 61 62 1 1.6% 71 82 81 82 82
3 67 60 -7 -10.4% 63 72 83 82 83
4 70 68 -2 -2.9% 59 62 72 82 83
5 69 72 3 4.3% 71 63 65 76 86
TOTAL 386 393* 7 1.8% 407 423 448 466 475*2019 Includes 14 METCO students. Projections include new METCO students for each year.
TEN YEARS OF TOTAL SCHOOL ENROLLMENTS - FIVE PROJECTED
Enrollment Change from % Change fromYear K Total Previous Year Previous Year2010 72 4522011 63 440 -12 -2.7%2012 73 420 -20 -4.5%2013 54 419 -1 -0.2%2014 61 418 -1 -0.2%2015 52 403 -15 -3.6%2016 52 400 -3 -0.7%2017 57 391 -9 -2.3%2018 60 386 -5 -1.3%2019 66 393 7 1.8%2020 68 407 14 3.6%2021 68 423 16 3.9%2022 70 448 25 5.9%2023 68 466 18 4.0%2024 66 475 9 1.9%
Peak enrollment year: 2024, 475 students
- 40 -
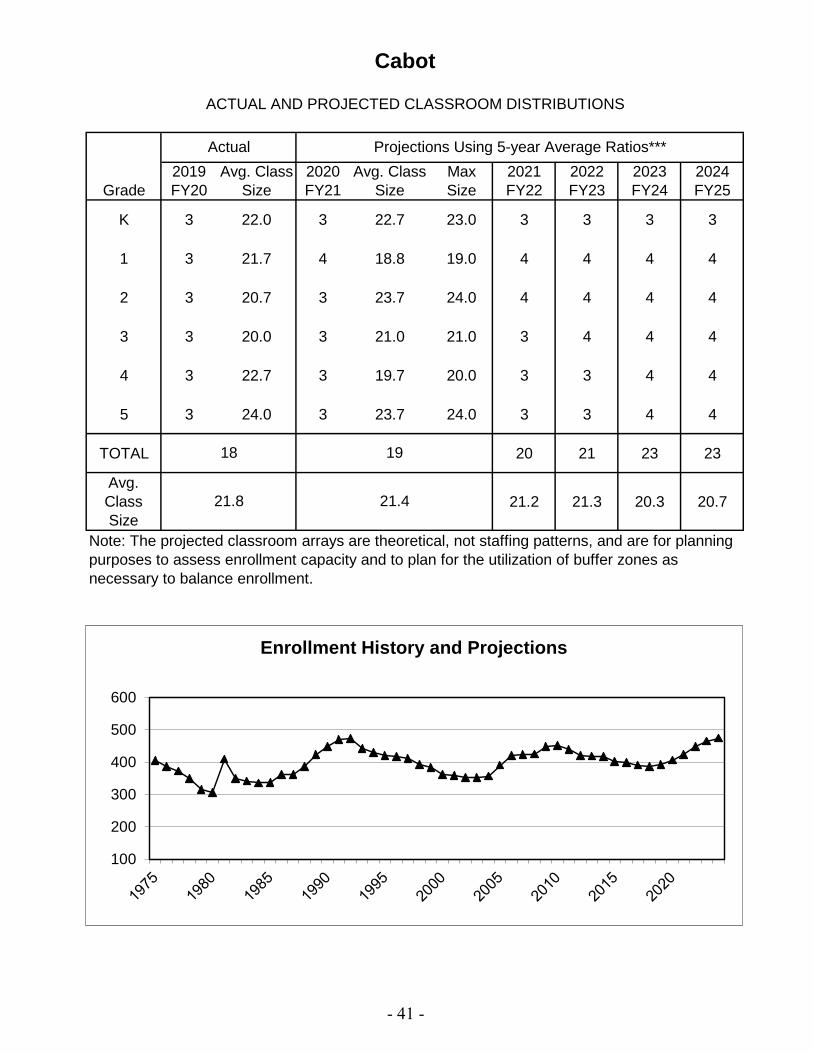
Cabot
2019 Avg. Class 2020 Avg. Class Max 2021 2022 2023 2024Grade FY20 Size FY21 Size Size FY22 FY23 FY24 FY25
K 3 22.0 3 22.7 23.0 3 3 3 3
1 3 21.7 4 18.8 19.0 4 4 4 4
2 3 20.7 3 23.7 24.0 4 4 4 4
3 3 20.0 3 21.0 21.0 3 4 4 4
4 3 22.7 3 19.7 20.0 3 3 4 4
5 3 24.0 3 23.7 24.0 3 3 4 4
TOTAL 20 21 23 23
Avg. Class Size
21.2 21.3 20.3 20.7
Note: The projected classroom arrays are theoretical, not staffing patterns, and are for planning purposes to assess enrollment capacity and to plan for the utilization of buffer zones as necessary to balance enrollment.
Actual Projections Using 5-year Average Ratios***
18 19
21.8 21.4
ACTUAL AND PROJECTED CLASSROOM DISTRIBUTIONS
100
200
300
400
500
600
Enrollment History and Projections
- 41 -

Countryside
ACTUAL AND PROJECTED ENROLLMENTS BY GRADE
OctoberEnrollment Difference Projections Using 5-year Average Ratios
2018 2019 N % 2020 2021 2022 2023 2024Grade FY19 FY20 FY21 FY22 FY23 FY24 FY25
K 59 55 -4 -6.8% 56 55 54 55 55
1 64 68 4 6.3% 58 59 58 60 62
2 66 67 1 1.5% 68 57 59 61 63
3 67 72 5 7.5% 70 70 60 64 66
4 81 66 -15 -18.5% 74 71 72 64 68
5 76 85 9 11.8% 67 75 72 75 68
TOTAL 413 413* 0 0.0% 393 387 375 379 382*2019 Includes 19 METCO students. Projections include new METCO students for each year.
TEN YEARS OF TOTAL SCHOOL ENROLLMENTS - FIVE PROJECTED
Enrollment Change from % Change fromYear K Total Previous Year Previous Year2010 86 4992011 62 490 -9 -1.8%2012 69 479 -11 -2.2%2013 64 457 -22 -4.6%2014 72 466 9 2.0%2015 70 450 -16 -3.4%2016 63 436 -14 -3.1%2017 56 410 -26 -6.0%2018 59 413 3 0.7%2019 55 413 0 0.0%2020 56 393 -20 -4.8%2021 55 387 -6 -1.5%2022 54 375 -12 -3.1%2023 55 379 4 1.1%2024 55 382 3 0.8%
Peak enrollment year: 2010, 499 students
- 42 -

Countryside
2019 Avg. Class 2020 Avg. Class Max 2021 2022 2023 2024Grade FY20 Size FY21 Size Size FY22 FY23 FY24 FY25
K 3 18.3 3 18.7 19.0 3 3 3 3
1 3 22.7 3 19.3 20.0 3 3 3 3
2 3 22.3 3 22.7 23.0 3 3 3 3
3 3 24.0 3 23.3 24.0 3 3 3 3
4 3 22.0 3 24.7 25.0 3 3 3 3
5 4 21.3 3 22.3 23.0 3 3 3 3
TOTAL 18 18 18 18
Avg. Class Size
21.5 20.8 21.1 21.221.7 21.8
Note: The projected classroom arrays are theoretical, not staffing patterns, and are for planning purposes to assess enrollment capacity and to plan for the utilization of buffer zones as necessary to balance enrollment.
Actual Projections Using 5-year Average Ratios***
19 18
ACTUAL AND PROJECTED CLASSROOM DISTRIBUTIONS
100
200
300
400
500
600
Enrollment History and Projections
- 43 -
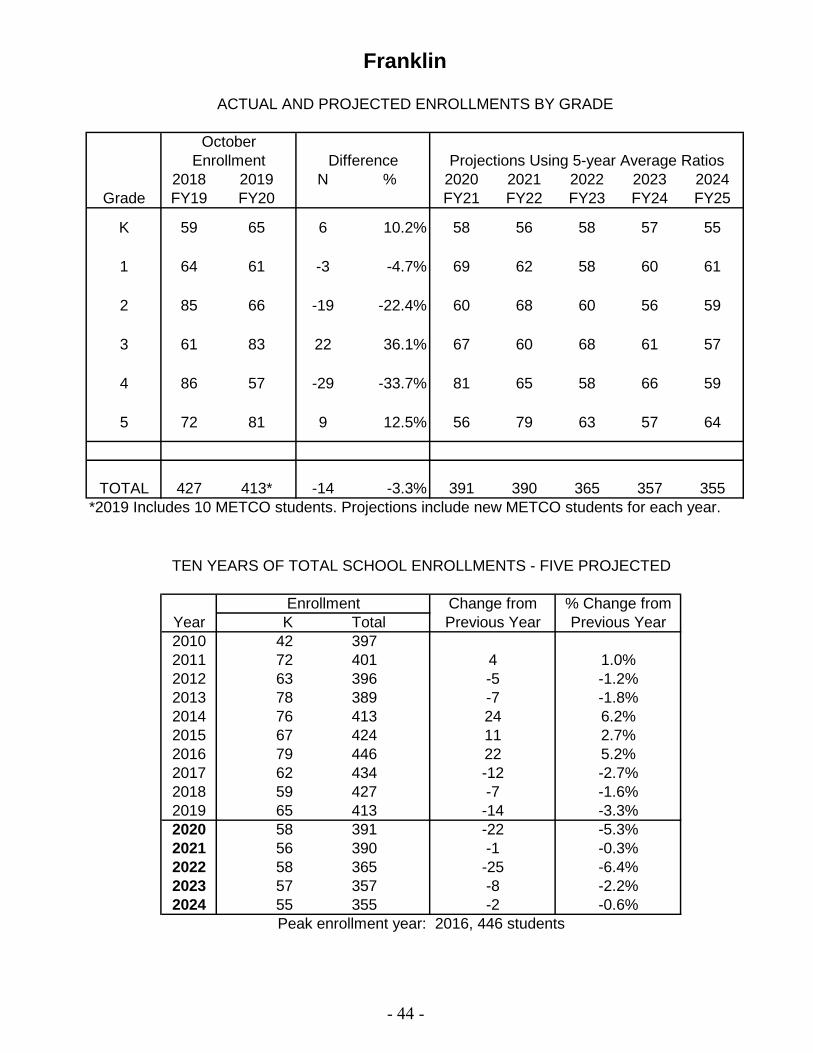
Franklin
ACTUAL AND PROJECTED ENROLLMENTS BY GRADE
OctoberEnrollment Difference Projections Using 5-year Average Ratios
2018 2019 N % 2020 2021 2022 2023 2024Grade FY19 FY20 FY21 FY22 FY23 FY24 FY25
K 59 65 6 10.2% 58 56 58 57 55
1 64 61 -3 -4.7% 69 62 58 60 61
2 85 66 -19 -22.4% 60 68 60 56 59
3 61 83 22 36.1% 67 60 68 61 57
4 86 57 -29 -33.7% 81 65 58 66 59
5 72 81 9 12.5% 56 79 63 57 64
TOTAL 427 413* -14 -3.3% 391 390 365 357 355*2019 Includes 10 METCO students. Projections include new METCO students for each year.
TEN YEARS OF TOTAL SCHOOL ENROLLMENTS - FIVE PROJECTED
Enrollment Change from % Change fromYear K Total Previous Year Previous Year2010 42 3972011 72 401 4 1.0%2012 63 396 -5 -1.2%2013 78 389 -7 -1.8%2014 76 413 24 6.2%2015 67 424 11 2.7%2016 79 446 22 5.2%2017 62 434 -12 -2.7%2018 59 427 -7 -1.6%2019 65 413 -14 -3.3%2020 58 391 -22 -5.3%2021 56 390 -1 -0.3%2022 58 365 -25 -6.4%2023 57 357 -8 -2.2%2024 55 355 -2 -0.6%
Peak enrollment year: 2016, 446 students
- 44 -
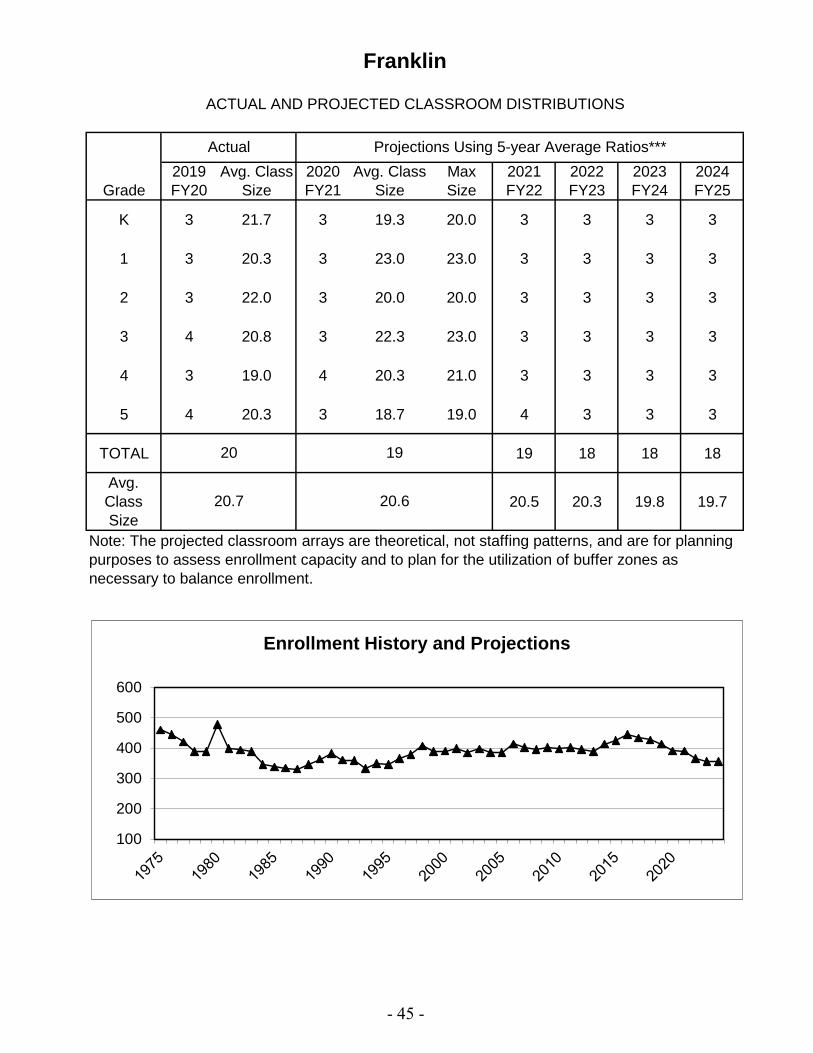
Franklin
2019 Avg. Class 2020 Avg. Class Max 2021 2022 2023 2024Grade FY20 Size FY21 Size Size FY22 FY23 FY24 FY25
K 3 21.7 3 19.3 20.0 3 3 3 3
1 3 20.3 3 23.0 23.0 3 3 3 3
2 3 22.0 3 20.0 20.0 3 3 3 3
3 4 20.8 3 22.3 23.0 3 3 3 3
4 3 19.0 4 20.3 21.0 3 3 3 3
5 4 20.3 3 18.7 19.0 4 3 3 3
TOTAL 19 18 18 18
Avg. Class Size
20.5 20.3 19.8 19.7
ACTUAL AND PROJECTED CLASSROOM DISTRIBUTIONS
20.7 20.6
Note: The projected classroom arrays are theoretical, not staffing patterns, and are for planning purposes to assess enrollment capacity and to plan for the utilization of buffer zones as necessary to balance enrollment.
Actual Projections Using 5-year Average Ratios***
20 19
100
200
300
400
500
600
Enrollment History and Projections
- 45 -

Horace Mann
ACTUAL AND PROJECTED ENROLLMENTS BY GRADE
OctoberEnrollment Difference Projections Using 5-year Average Ratios
2018 2019 N % 2020 2021 2022 2023 2024Grade FY19 FY20 FY21 FY22 FY23 FY24 FY25
K 61 57 -4 -6.6% 56 58 57 57 56
1 61 63 2 3.3% 60 61 61 62 60
2 70 61 -9 -12.9% 63 60 61 61 62
3 73 71 -2 -2.7% 62 64 61 62 62
4 62 75 13 21.0% 73 63 65 62 63
5 72 64 -8 -11.1% 75 72 63 65 62
TOTAL 399 391* -8 -2.0% 389 378 368 369 365*2019 Includes 12 METCO students. Projections include new METCO students for each year.
TEN YEARS OF TOTAL SCHOOL ENROLLMENTS - FIVE PROJECTED
Enrollment Change from % Change fromYear K Total Previous Year Previous Year2010 67 3732011 80 386 13 3.5%2012 65 394 8 2.1%2013 67 427 33 8.4%2014 65 434 7 1.6%2015 57 412 -22 -5.1%2016 62 417 5 1.2%2017 60 404 -13 -3.1%2018 61 399 -5 -1.2%2019 57 391 -8 -2.0%2020 56 389 -2 -0.5%2021 58 378 -11 -2.8%2022 57 368 -10 -2.6%2023 57 369 1 0.3%2024 56 365 -4 -1.1%
Peak enrollment year: 2014, 434 students
- 46 -

Horace Mann
2019 Avg. Class 2020 Avg. Class Max 2021 2022 2023 2024Grade FY20 Size FY21 Size Size FY22 FY23 FY24 FY25
K 3 19.0 3 18.7 19.0 3 3 3 3
1 3 21.0 3 20.0 20.0 3 3 3 3
2 3 20.3 3 21.0 21.0 3 3 3 3
3 3 23.7 3 20.7 21.0 3 3 3 3
4 3 25.0 3 24.3 25.0 3 3 3 3
5 3 21.3 3 25.0 25.0 3 3 3 3
TOTAL 18 18 18 18
Avg. Class Size
21.0 20.4 20.5 20.3
ACTUAL AND PROJECTED CLASSROOM DISTRIBUTIONS
21.7 21.6
Note: The projected classroom arrays are theoretical, not staffing patterns, and are for planning purposes to assess enrollment capacity and to plan for the utilization of buffer zones as necessary to balance enrollment.
Actual Projections Using 5-year Average Ratios***
18 18
100
200
300
400
500
600
Enrollment History and Projections
- 47 -

Lincoln-Eliot
ACTUAL AND PROJECTED ENROLLMENTS BY GRADE
OctoberEnrollment Difference Projections Using 5-year Average Ratios
2018 2019 N % 2020 2021 2022 2023 2024Grade FY19 FY20 FY21 FY22 FY23 FY24 FY25
K 57 55 -2 -3.5% 53 50 48 49 47
1 62 68 6 9.7% 57 54 54 50 53
2 65 66 1 1.5% 69 58 55 55 52
3 51 58 7 13.7% 63 65 55 51 52
4 63 53 -10 -15.9% 60 65 67 57 53
5 67 62 -5 -7.5% 57 64 69 72 61
TOTAL 365 362* -3 -0.8% 359 356 348 334 318*2019 Includes 19 METCO students. Projections include new METCO students for each year.
TEN YEARS OF TOTAL SCHOOL ENROLLMENTS - FIVE PROJECTED
Enrollment Change from % Change fromYear K Total Previous Year Previous Year2010 58 2932011 55 317 24 8.2%2012 48 322 5 1.6%2013 63 329 7 2.2%2014 57 337 8 2.4%2015 58 340 3 0.9%2016 62 346 6 1.8%2017 67 374 28 8.1%2018 57 365 -9 -2.4%2019 55 362 -3 -0.8%2020 53 359 -3 -0.8%2021 50 356 -3 -0.8%2022 48 348 -8 -2.2%2023 49 334 -14 -4.0%2024 47 318 -16 -4.8%
Peak enrollment year: 2017, 374 students
- 48 -

Lincoln-Eliot
2019 Avg. Class 2020 Avg. Class Max 2021 2022 2023 2024Grade FY20 Size FY21 Size Size FY22 FY23 FY24 FY25
K 3 18.3 3 17.7 18.0 3 3 3 2
1 3 22.7 3 19.0 19.0 3 3 2 3
2 3 22.0 3 23.0 23.0 3 3 3 3
3 3 19.3 3 21.0 21.0 3 3 3 3
4 3 17.7 3 20.0 20.0 3 3 3 3
5 3 20.7 3 19.0 19.0 3 3 3 3
TOTAL 18 18 17 17
Avg. Class Size
19.8 19.3 19.6 18.720.1 19.9
Note: The projected classroom arrays are theoretical, not staffing patterns, and are for planning purposes to assess enrollment capacity and to plan for the utilization of buffer zones as necessary to balance enrollment.
Actual Projections Using 5-year Average Ratios***
18 18
ACTUAL AND PROJECTED CLASSROOM DISTRIBUTIONS
100
200
300
400
500
600
Enrollment History and Projections
- 49 -

Mason-Rice
ACTUAL AND PROJECTED ENROLLMENTS BY GRADE
OctoberEnrollment Difference Projections Using 5-year Average Ratios
2018 2019 N % 2020 2021 2022 2023 2024Grade FY19 FY20 FY21 FY22 FY23 FY24 FY25
K 56 58 2 3.6% 61 58 56 56 55
1 68 61 -7 -10.3% 64 65 64 62 62
2 77 67 -10 -13.0% 62 65 66 65 64
3 92 78 -14 -15.2% 69 64 67 68 67
4 98 91 -7 -7.1% 79 70 65 68 69
5 96 91 -5 -5.2% 90 78 69 64 67
TOTAL 487 446* -41 -8.4% 425 400 387 383 384*2019 Includes 9 METCO students. Projections include new METCO students for each year.
TEN YEARS OF TOTAL SCHOOL ENROLLMENTS - FIVE PROJECTED
Enrollment Change from % Change fromYear K Total Previous Year Previous Year2010 64 4422011 64 437 -5 -1.1%2012 79 438 1 0.2%2013 88 457 19 4.3%2014 82 478 21 4.6%2015 81 492 14 2.9%2016 67 507 15 3.0%2017 68 512 5 1.0%2018 56 487 -25 -4.9%2019 58 446 -41 -8.4%2020 61 425 -21 -4.7%2021 58 400 -25 -5.9%2022 56 387 -13 -3.3%2023 56 383 -4 -1.0%2024 55 384 1 0.3%
Peak enrollment year: 2017, 512 students
- 50 -

Mason-Rice
2019 Avg. Class 2020 Avg. Class Max 2021 2022 2023 2024Grade FY20 Size FY21 Size Size FY22 FY23 FY24 FY25
K 3 19.3 3 20.3 21.0 3 3 3 3
1 3 20.3 3 21.3 22.0 3 3 3 3
2 3 22.3 3 20.7 21.0 3 3 3 3
3 4 19.5 3 23.0 23.0 3 3 3 3
4 4 22.8 4 19.8 20.0 3 3 3 3
5 4 22.8 4 22.5 23.0 4 3 3 3
TOTAL 19 18 18 18
Avg. Class Size
21.1 21.5 21.3 21.3
ACTUAL AND PROJECTED CLASSROOM DISTRIBUTIONS
21.2 21.3
Note: The projected classroom arrays are theoretical, not staffing patterns, and are for planning purposes to assess enrollment capacity and to plan for the utilization of buffer zones as necessary to balance enrollment.
Actual Projections Using 5-year Average Ratios***
21 20
100
200
300
400
500
600
Enrollment History and Projections
- 51 -

Memorial-Spaulding
ACTUAL AND PROJECTED ENROLLMENTS BY GRADE
OctoberEnrollment Difference Projections Using 5-year Average Ratios
2018 2019 N % 2020 2021 2022 2023 2024Grade FY19 FY20 FY21 FY22 FY23 FY24 FY25
K 60 51 -9 -15.0% 60 57 57 55 55
1 79 63 -16 -20.3% 52 64 59 59 57
2 79 83 4 5.1% 66 55 66 62 60
3 82 84 2 2.4% 84 68 57 68 63
4 89 91 2 2.2% 88 88 71 59 71
5 75 93 18 24.0% 92 89 89 72 60
TOTAL 464 465* 1 0.2% 442 421 399 375 366*2019 Includes 19 METCO students. Projections include new METCO students for each year.
TEN YEARS OF TOTAL SCHOOL ENROLLMENTS - FIVE PROJECTED
Enrollment Change from % Change fromYear K Total Previous Year Previous Year2010 74 4592011 66 458 -1 -0.2%2012 69 464 6 1.3%2013 67 429 -35 -7.5%2014 79 434 5 1.2%2015 77 452 18 4.1%2016 71 454 2 0.4%2017 75 453 -1 -0.2%2018 60 464 11 2.4%2019 51 465 1 0.2%2020 60 442 -23 -4.9%2021 57 421 -21 -4.8%2022 57 399 -22 -5.2%2023 55 375 -24 -6.0%2024 55 366 -9 -2.4%
Peak enrollment year: 2019, 465 students
- 52 -
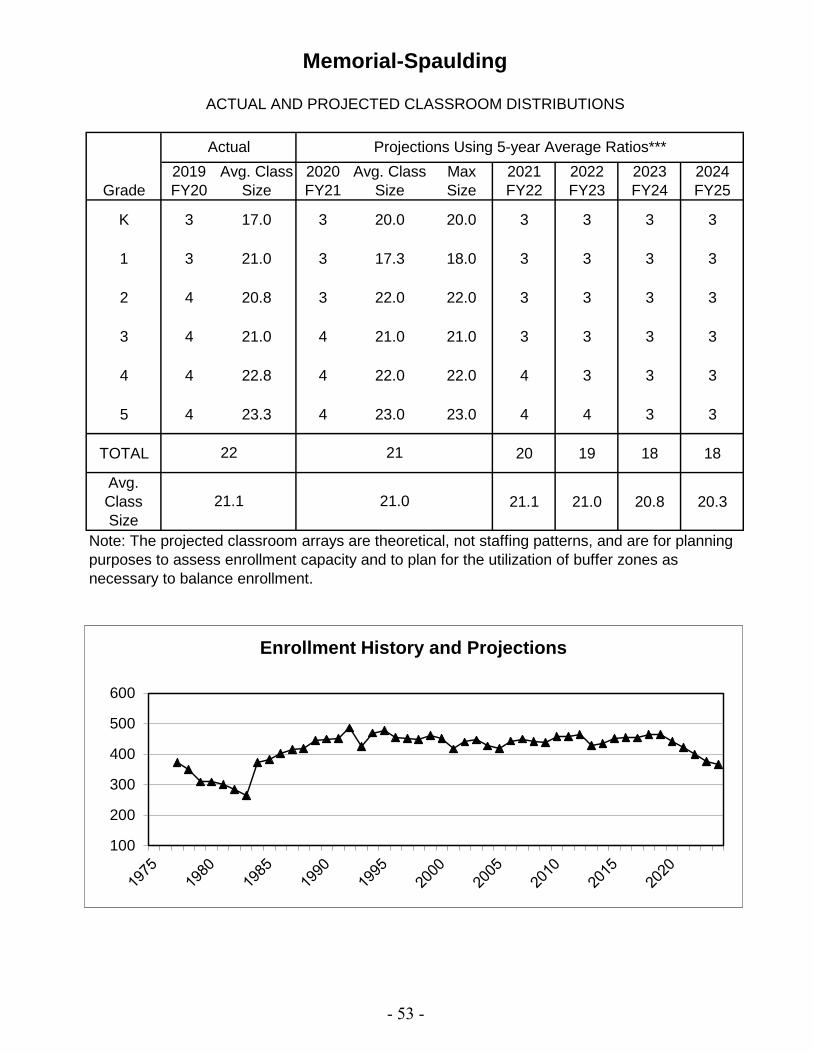
Memorial-Spaulding
2019 Avg. Class 2020 Avg. Class Max 2021 2022 2023 2024Grade FY20 Size FY21 Size Size FY22 FY23 FY24 FY25
K 3 17.0 3 20.0 20.0 3 3 3 3
1 3 21.0 3 17.3 18.0 3 3 3 3
2 4 20.8 3 22.0 22.0 3 3 3 3
3 4 21.0 4 21.0 21.0 3 3 3 3
4 4 22.8 4 22.0 22.0 4 3 3 3
5 4 23.3 4 23.0 23.0 4 4 3 3
TOTAL 20 19 18 18
Avg. Class Size
21.1 21.0 20.8 20.321.1 21.0
Note: The projected classroom arrays are theoretical, not staffing patterns, and are for planning purposes to assess enrollment capacity and to plan for the utilization of buffer zones as necessary to balance enrollment.
Actual Projections Using 5-year Average Ratios***
22 21
ACTUAL AND PROJECTED CLASSROOM DISTRIBUTIONS
100
200
300
400
500
600
Enrollment History and Projections
- 53 -

Peirce
ACTUAL AND PROJECTED ENROLLMENTS BY GRADE
OctoberEnrollment Difference Projections Using 5-year Average Ratios
2018 2019 N % 2020 2021 2022 2023 2024Grade FY19 FY20 FY21 FY22 FY23 FY24 FY25
K 44 43 -1 -2.3% 49 49 47 47 45
1 44 49 5 11.4% 48 54 52 51 50
2 45 47 2 4.4% 50 49 55 52 51
3 43 43 0 0.0% 48 50 49 55 53
4 58 45 -13 -22.4% 43 47 50 49 55
5 37 57 20 54.1% 43 41 45 48 47
TOTAL 271 284* 13 4.8% 281 290 298 302 301*2019 Includes 16 METCO students. Projections include new METCO students for each year.
TEN YEARS OF TOTAL SCHOOL ENROLLMENTS - FIVE PROJECTED
Enrollment Change from % Change fromYear K Total Previous Year Previous Year2010 45 3182011 55 316 -2 -0.6%2012 51 337 21 6.6%2013 46 312 -25 -7.4%2014 48 306 -6 -1.9%2015 41 314 8 2.6%2016 38 299 -15 -4.8%2017 41 276 -23 -7.7%2018 44 271 -5 -1.8%2019 43 284 13 4.8%2020 49 281 -3 -1.1%2021 49 290 9 3.2%2022 47 298 8 2.8%2023 47 302 4 1.3%2024 45 301 -1 -0.3%
Peak enrollment year: 2012, 337 students
- 54 -

Peirce
2019 Avg. Class 2020 Avg. Class Max 2021 2022 2023 2024Grade FY20 Size FY21 Size Size FY22 FY23 FY24 FY25
K 2 21.5 3 16.3 17.0 2 2 2 2
1 2 24.5 2 24.0 24.0 3 3 3 2
2 2 23.5 2 25.0 25.0 2 3 3 3
3 2 21.5 2 24.0 24.0 2 2 3 3
4 2 22.5 2 21.5 22.0 2 2 2 3
5 3 19.0 2 21.5 22.0 2 2 2 2
TOTAL 13 14 15 15
Avg. Class Size
22.3 21.3 20.1 20.1
ACTUAL AND PROJECTED CLASSROOM DISTRIBUTIONS
21.8 21.6
Note: The projected classroom arrays are theoretical, not staffing patterns, and are for planning purposes to assess enrollment capacity and to plan for the utilization of buffer zones as necessary to balance enrollment.
Actual Projections Using 5-year Average Ratios***
13 13
100
200
300
400
500
600
Enrollment History and Projections
- 55 -

Underwood
ACTUAL AND PROJECTED ENROLLMENTS BY GRADE
OctoberEnrollment Difference Projections Using 5-year Average Ratios
2018 2019 N % 2020 2021 2022 2023 2024Grade FY19 FY20 FY21 FY22 FY23 FY24 FY25
K 43 42 -1 -2.3% 40 39 37 38 38
1 40 40 0 0.0% 47 43 43 38 39
2 49 36 -13 -26.5% 39 46 42 41 36
3 45 45 0 0.0% 35 38 45 41 40
4 66 42 -24 -36.4% 46 36 39 46 42
5 47 64 17 36.2% 41 45 35 38 45
TOTAL 290 269* -21 -7.2% 248 247 241 242 240*2019 Includes 13 METCO students. Projections include new METCO students for each year.
TEN YEARS OF TOTAL SCHOOL ENROLLMENTS - FIVE PROJECTED
Enrollment Change from % Change fromYear K Total Previous Year Previous Year2010 49 2822011 49 289 7 2.5%2012 47 310 21 7.3%2013 48 327 17 5.5%2014 62 341 14 4.3%2015 41 326 -15 -4.4%2016 47 313 -13 -4.0%2017 35 284 -29 -9.3%2018 43 290 6 2.1%2019 42 269 -21 -7.2%2020 40 248 -21 -7.8%2021 39 247 -1 -0.4%2022 37 241 -6 -2.4%2023 38 242 1 0.4%2024 38 240 -2 -0.8%
Peak enrollment year: 2014, 341 students
- 56 -

Underwood
2019 Avg. Class 2020 Avg. Class Max 2021 2022 2023 2024Grade FY20 Size FY21 Size Size FY22 FY23 FY24 FY25
K 2 21.0 2 20.0 20.0 2 2 2 2
1 2 20.0 2 23.5 24.0 2 2 2 2
2 2 18.0 2 19.5 20.0 2 2 2 2
3 2 22.5 2 17.5 18.0 2 2 2 2
4 2 21.0 2 23.0 23.0 2 2 2 2
5 3 21.3 2 20.5 21.0 2 2 2 2
TOTAL 12 12 12 12
Avg. Class Size
20.6 20.1 20.2 20.0
ACTUAL AND PROJECTED CLASSROOM DISTRIBUTIONS
20.7 20.7
Note: The projected classroom arrays are theoretical, not staffing patterns, and are for planning purposes to assess enrollment capacity and to plan for the utilization of buffer zones as necessary to balance enrollment.
Actual Projections Using 5-year Average Ratios***
13 12
100
200
300
400
500
600
Enrollment History and Projections
- 57 -

Ward
ACTUAL AND PROJECTED ENROLLMENTS BY GRADE
OctoberEnrollment Difference Projections Using 5-year Average Ratios
2018 2019 N % 2020 2021 2022 2023 2024Grade FY19 FY20 FY21 FY22 FY23 FY24 FY25
K 41 34 -7 -17.1% 35 35 33 35 33
1 39 40 1 2.6% 35 36 36 34 38
2 47 35 -12 -25.5% 41 35 37 37 34
3 51 45 -6 -11.8% 36 42 36 38 38
4 58 47 -11 -19.0% 45 36 41 36 37
5 60 54 -6 -10.0% 47 44 35 41 36
TOTAL 296 255* -41 -13.9% 239 228 218 221 216*2019 Includes 7 METCO students. Projections include new METCO students for each year.
TEN YEARS OF TOTAL SCHOOL ENROLLMENTS - FIVE PROJECTED
Enrollment Change from % Change fromYear K Total Previous Year Previous Year2010 42 2692011 46 278 9 3.3%2012 47 301 23 8.3%2013 43 289 -12 -4.0%2014 46 304 15 5.2%2015 43 304 0 0.0%2016 49 313 9 3.0%2017 35 309 -4 -1.3%2018 41 296 -13 -4.2%2019 34 255 -41 -13.9%2020 35 239 -16 -6.3%2021 35 228 -11 -4.6%2022 33 218 -10 -4.4%2023 35 221 3 1.4%2024 33 216 -5 -2.3%
Peak enrollment year: 2016, 313 students
- 58 -
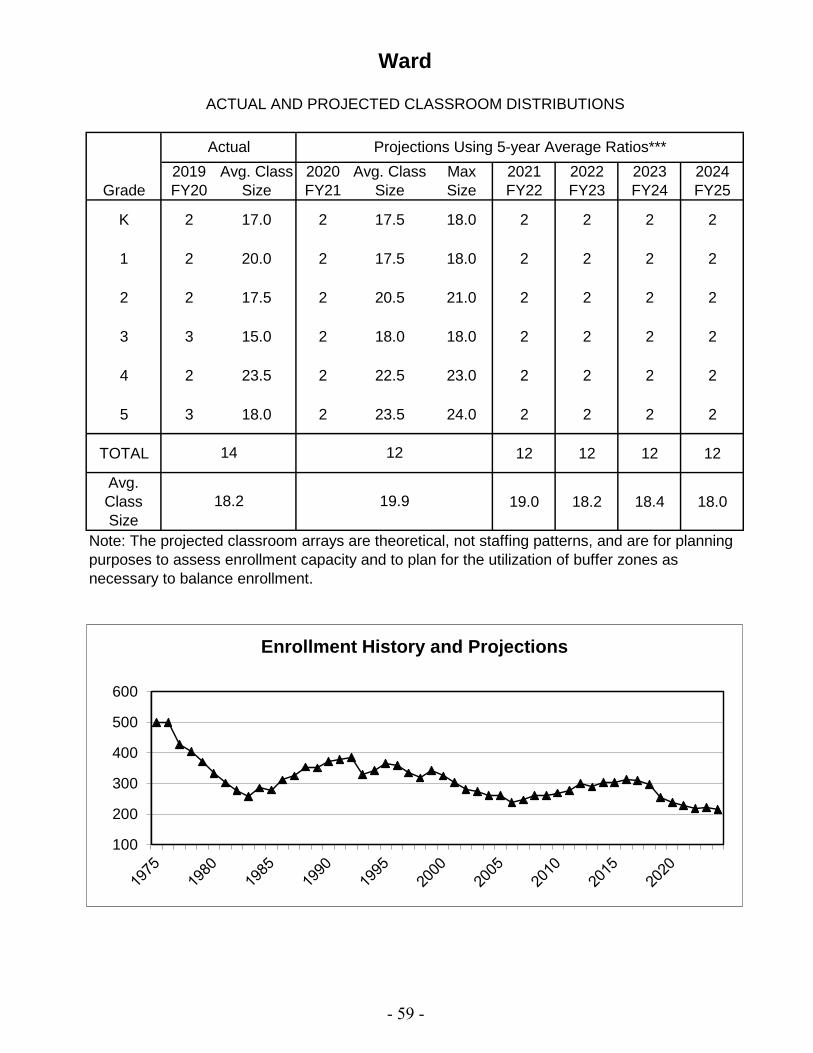
Ward
2019 Avg. Class 2020 Avg. Class Max 2021 2022 2023 2024Grade FY20 Size FY21 Size Size FY22 FY23 FY24 FY25
K 2 17.0 2 17.5 18.0 2 2 2 2
1 2 20.0 2 17.5 18.0 2 2 2 2
2 2 17.5 2 20.5 21.0 2 2 2 2
3 3 15.0 2 18.0 18.0 2 2 2 2
4 2 23.5 2 22.5 23.0 2 2 2 2
5 3 18.0 2 23.5 24.0 2 2 2 2
TOTAL 12 12 12 12
Avg. Class Size
19.0 18.2 18.4 18.0
ACTUAL AND PROJECTED CLASSROOM DISTRIBUTIONS
18.2 19.9
Note: The projected classroom arrays are theoretical, not staffing patterns, and are for planning purposes to assess enrollment capacity and to plan for the utilization of buffer zones as necessary to balance enrollment.
Actual Projections Using 5-year Average Ratios***
14 12
100
200
300
400
500
600
Enrollment History and Projections
- 59 -

Williams
ACTUAL AND PROJECTED ENROLLMENTS BY GRADE
OctoberEnrollment Difference Projections Using 5-year Average Ratios
2018 2019 N % 2020 2021 2022 2023 2024Grade FY19 FY20 FY21 FY22 FY23 FY24 FY25
K 47 38 -9 -19.1% 44 43 42 40 39
1 51 40 -11 -21.6% 40 44 43 42 40
2 42 51 9 21.4% 40 40 44 43 42
3 58 39 -19 -32.8% 49 38 38 42 40
4 37 56 19 51.4% 39 48 37 37 41
5 43 37 -6 -14.0% 53 36 45 35 35
TOTAL 278 261* -17 -6.1% 265 249 249 239 237*2019 Includes 13 METCO students. Projections include new METCO students for each year.
TEN YEARS OF TOTAL SCHOOL ENROLLMENTS - FIVE PROJECTED
Enrollment Change from % Change fromYear K Total Previous Year Previous Year2010 43 2982011 46 302 4 1.3%2012 50 304 2 0.7%2013 45 304 0 0.0%2014 37 292 -12 -3.9%2015 62 290 -2 -0.7%2016 44 293 3 1.0%2017 47 296 3 1.0%2018 47 278 -18 -6.1%2019 38 261 -17 -6.1%2020 44 265 4 1.5%2021 43 249 -16 -6.0%2022 42 249 0 0.0%2023 40 239 -10 -4.0%2024 39 237 -2 -0.8%
Peak enrollment year: 2012, 304 students
- 60 -

Williams
2019 Avg. Class 2020 Avg. Class Max 2021 2022 2023 2024Grade FY20 Size FY21 Size Size FY22 FY23 FY24 FY25
K 2 19.0 2 22.0 22.0 2 2 2 2
1 2 20.0 2 20.0 20.0 2 2 2 2
2 3 17.0 2 20.0 20.0 2 2 2 2
3 2 19.5 2 24.5 25.0 2 2 2 2
4 3 18.7 2 19.5 20.0 2 2 2 2
5 2 18.5 3 17.7 18.0 2 2 2 2
TOTAL 12 12 12 12
Avg. Class Size
20.8 20.8 19.9 19.818.6 20.4
Note: The projected classroom arrays are theoretical, not staffing patterns, and are for planning purposes to assess enrollment capacity and to plan for the utilization of buffer zones as necessary to balance enrollment.
Actual Projections Using 5-year Average Ratios***
14 13
ACTUAL AND PROJECTED CLASSROOM DISTRIBUTIONS
100
200
300
400
500
600
Enrollment History and Projections
- 61 -

Zervas
ACTUAL AND PROJECTED ENROLLMENTS BY GRADE
OctoberEnrollment Difference Projections Using 5-year Average Ratios
2018 2019 N % 2020 2021 2022 2023 2024Grade FY19 FY20 FY21 FY22 FY23 FY24 FY25
K 68 79 11 16.2% 67 68 71 69 69
1 67 76 9 13.4% 93 77 81 82 80
2 86 64 -22 -25.6% 79 96 80 84 85
3 66 83 17 25.8% 68 83 102 85 89
4 74 61 -13 -17.6% 86 70 86 105 88
5 66 71 5 7.6% 65 91 74 91 112
TOTAL 427 434* 7 1.6% 458 485 494 516 523*2019 Includes 16 METCO students. Projections include new METCO students for each year.
TEN YEARS OF TOTAL SCHOOL ENROLLMENTS - FIVE PROJECTED
Enrollment Change from % Change fromYear K Total Previous Year Previous Year2010 62 3492011 40 321 -28 -8.0%2012 60 325 4 1.2%2013 53 317 -8 -2.5%2014 53 309 -8 -2.5%2015 44 308 -1 -0.3%2016 65 337 29 9.4%2017 58 407 70 20.8%2018 68 427 20 4.9%2019 79 434 7 1.6%2020 67 458 24 5.5%2021 68 485 27 5.9%2022 71 494 9 1.9%2023 69 516 22 4.5%2024 69 523 7 1.4%
Peak enrollment year: 2024, 523 students
- 62 -

Zervas
2019 Avg. Class 2020 Avg. Class Max 2021 2022 2023 2024Grade FY20 Size FY21 Size Size FY22 FY23 FY24 FY25
K 4 19.8 4 16.8 17.0 4 4 3 3
1 4 19.0 4 23.3 24.0 4 4 4 4
2 3 21.3 4 19.8 20.0 5 4 4 4
3 4 20.8 3 22.7 23.0 4 5 4 4
4 3 20.3 4 21.5 22.0 3 4 5 4
5 4 17.8 3 21.7 22.0 4 3 4 5
TOTAL 24 24 24 24
Avg. Class Size
20.2 20.6 21.5 21.8
ACTUAL AND PROJECTED CLASSROOM DISTRIBUTIONS
19.7 20.8
Note: The projected classroom arrays are theoretical, not staffing patterns, and are for planning purposes to assess enrollment capacity and to plan for the utilization of buffer zones as necessary to balance enrollment.
Actual Projections Using 5-year Average Ratios***
22 22
100
200
300
400
500
600
Enrollment History and Projections
- 63 -

Bigelow Middle School
ACTUAL AND PROJECTED ENROLLMENTS BY GRADE
OctoberEnrollment Difference Projections Using 5-year Average Ratios
2018 2019 N % 2020 2021 2022 2023 2024Grade FY19 FY20 FY21 FY22 FY23 FY24 FY25
6 170 162 -8 -4.7% 183 147 158 144 1567 157 176 19 12.1% 163 184 148 160 1448 174 156 -18 -10.3% 178 164 186 149 162
Total 501 494 -7 -1.4% 524 495 492 453 462Spec. Ed.** 0 0 0 0.0% 0 0 0 0 0
TOTAL 501 494* -7 -1.4% 524 495 492 453 462*Includes 25 METCO students.**Students who receive special education services outside of the classroom for a significant amount of time (students in K-8 are reported with their grades).
TEN YEARS OF TOTAL SCHOOL ENROLLMENTS
Year Total Enrollment Change from Previous Year
Percent Change
20102011 10 1.9%2012 -2 -0.4%2013 -6 -1.1%2014 -21 -4.0%2015 5 1.0%2016 16 3.1%2017 -4 -0.8%2018 -20 -3.8%2019 -7 -1.4%
Peak enrollment year: 2011, 533 students
523533531
501494
525504509525521
- 64 -

Bigelow Middle School
FIFTH GRADE STUDENTS FROM THE BIGELOW FEEDER SCHOOLS
Elementary 2019-2020School 5th Grade Enrollment
Cabot 0Lincoln-Eliot 62Underwood 64Ward 54Total 180
100200300400500600700800900
1,000
Enrollment History and Projections
- 65 -

Brown Middle School
ACTUAL AND PROJECTED ENROLLMENTS BY GRADE
OctoberEnrollment Difference Projections Using 5-year Average Ratios
2018 2019 N % 2020 2021 2022 2023 2024Grade FY19 FY20 FY21 FY22 FY23 FY24 FY25
6 274 263 -11 -4.0% 288 272 269 249 2567 231 277 46 19.9% 263 289 272 273 2528 239 238 -1 -0.4% 278 265 290 276 277
Total 744 778 34 4.6% 829 826 831 798 785Spec. Ed.** 0 0 0 0 0 0 0 0
TOTAL 744 778* 34 4.6% 829 826 831 798 785*Includes 9 METCO students.**Students who receive special education services outside of the classroom for a significant amount of time (students in K-8 are reported with their grades).
TEN YEARS OF TOTAL SCHOOL ENROLLMENTS
Year Total Enrollment
Change from Previous Year
Percent Change
2010 6662011 677 11 1.7%2012 698 21 3.1%2013 743 45 6.4%2014 738 -5 -0.7%2015 780 42 5.7%2016 774 -6 -0.8%2017 753 -21 -2.7%2018 744 -9 -1.2%2019 778 34 4.6%
Peak enrollment year: 2015, 780 students
- 66 -

Brown Middle School
Elementary 2019-2020School 5th Grade Enrollment
Angier 97Countryside 85Mason-Rice 91Williams 37Total 310
FIFTH GRADE STUDENTS FROM BROWN FEEDER SCHOOLS
100200300400500600700800900
1,000
Enrollment History and Projections
- 67 -
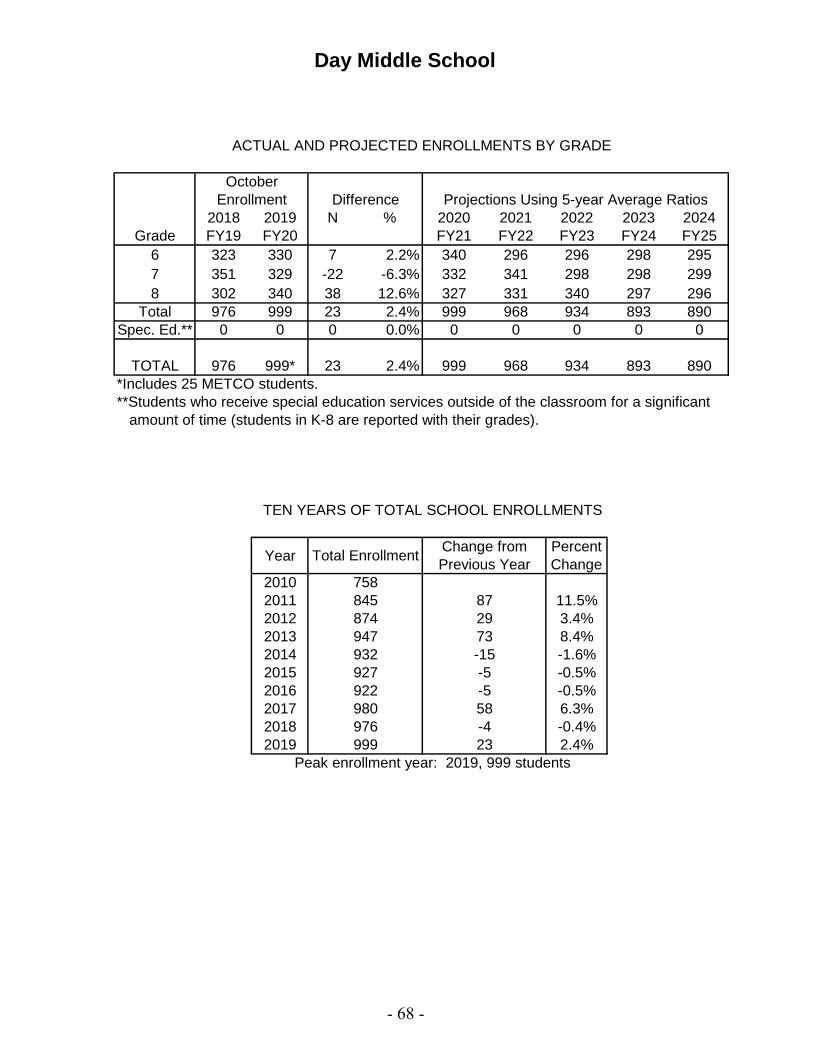
Day Middle School
ACTUAL AND PROJECTED ENROLLMENTS BY GRADE
OctoberEnrollment Difference Projections Using 5-year Average Ratios
2018 2019 N % 2020 2021 2022 2023 2024Grade FY19 FY20 FY21 FY22 FY23 FY24 FY25
6 323 330 7 2.2% 340 296 296 298 2957 351 329 -22 -6.3% 332 341 298 298 2998 302 340 38 12.6% 327 331 340 297 296
Total 976 999 23 2.4% 999 968 934 893 890Spec. Ed.** 0 0 0 0.0% 0 0 0 0 0
TOTAL 976 999* 23 2.4% 999 968 934 893 890*Includes 25 METCO students.**Students who receive special education services outside of the classroom for a significant amount of time (students in K-8 are reported with their grades).
TEN YEARS OF TOTAL SCHOOL ENROLLMENTS
Year Total Enrollment Change from Previous Year
Percent Change
2010 7582011 845 87 11.5%2012 874 29 3.4%2013 947 73 8.4%2014 932 -15 -1.6%2015 927 -5 -0.5%2016 922 -5 -0.5%2017 980 58 6.3%2018 976 -4 -0.4%2019 999 23 2.4%
Peak enrollment year: 2019, 999 students
- 68 -

Day Middle School
Elementary 2019-2020School 5th Grade Enrollment
Burr 70Cabot 72Franklin 81Horace Mann 64Peirce 57Total 344
FIFTH GRADE STUDENTS FROM THE DAY FEEDER SCHOOLS
100200300400500600700800900
1,0001,100
Enrollment History and Projections
- 69 -

Oak Hill Middle School
ACTUAL AND PROJECTED ENROLLMENTS BY GRADE
OctoberEnrollment Difference Projections Using 5-year Average Ratios
2018 2019 N % 2020 2021 2022 2023 2024Grade FY19 FY20 FY21 FY22 FY23 FY24 FY25
6 206 240 34 16.5% 230 225 248 235 2267 193 202 9 4.7% 241 229 226 248 2368 231 190 -41 -17.7% 203 241 231 228 248
Total 630 632 2 0.3% 674 695 705 711 710Spec. Ed.** 0 0 0 0.0% 0 0 0 0 0
TOTAL 630 632* 2 0.3% 674 695 705 711 710*Includes 31 METCO students.**Students who receive special education services outside of the classroom for a significant amount of time (students in K-8 are reported with their grades).
TEN YEARS OF TOTAL SCHOOL ENROLLMENTS
Year Total Enrollment
Change from Previous Year
Percent Change
2010 6032011 612 9 1.5%2012 616 4 0.7%2013 634 18 2.9%2014 632 -2 -0.3%2015 602 -30 -4.7%2016 639 37 6.1%2017 614 -25 -3.9%2018 630 16 2.6%2019 632 2 0.3%
Peak enrollment year: 2016, 639 students
- 70 -

Oak Hill Middle School
FIFTH GRADE STUDENTS FROM THE OAK HILL FEEDER SCHOOLS
Elementary 2019-2020School 5th Grade Enrollment
Bowen 63Memorial-Spaulding 93Zervas 71Total 227
1997-98 marked the opening of Oak Hill Middle School.
100200300400500600700800900
1,000
Enrollment History and Projections
- 71 -

North High School
ACTUAL AND PROJECTED ENROLLMENTS BY GRADE
OctoberEnrollment Difference Projections Using 5-year Average Ratios
2018 2019 N % 2020 2021 2022 2023 2024Grade FY19 FY20 FY21 FY22 FY23 FY24 FY25
9 535 503 -32 -6.0% 524 535 524 556 47310 493 539 46 9.3% 509 529 540 528 55911 509 500 -9 -1.8% 546 516 536 547 53412 541 529 -12 -2.2% 499 545 515 535 546
TOTAL 2,078 2,071 -7 0% 2,078 2,125 2,115 2,166 2,112Post Grads 0 0 0 0 0 0 0 0 0Spec. Ed.* 58 28 -30 -52% 28 28 28 28 28
TOTAL 2,136 2,099** -37 -1.7% 2,106 2,153 2,143 2,194 2,140**Includes 70 METCO students.*Students who receive special education services outside of the classroom for a significant amount of time.
TEN YEARS OF TOTAL SCHOOL ENROLLMENTS
Year Total Enrollment Change from Previous Year
Percent Change
2010 1,8712011 1,877 6 0.3%2012 1,940 63 3.4%2013 2,015 75 3.9%2014 2,060 45 2.2%2015 2,107 47 2.3%2016 2,145 38 1.8%2017 2,165 20 0.9%2018 2,136 -29 -1.3%2019 2,099 -37 -1.7%
Peak enrollment year: 2017, 2165 students
- 72 -

North High School
Middle 2019-2020School 8th Grade Enrollment
Bigelow 156Brown (4%) 10Day 340Total 506
EIGHTH GRADE STUDENTS FROM THE NORTH FEEDER SCHOOLS
500
1,000
1,500
2,000
2,500
3,000
Enrollment History and Projections
- 73 -

South High School
ACTUAL AND PROJECTED ENROLLMENTS BY GRADE
OctoberEnrollment Difference Projections Using 5-year Average Ratios
2018 2019 N % 2020 2021 2022 2023 2024Grade FY19 FY20 FY21 FY22 FY23 FY24 FY25
9 477 494 17 3.6% 442 498 524 543 52110 490 497 7 1.4% 505 451 509 537 55611 490 500 10 2.0% 504 512 458 519 54612 443 491 48 10.8% 499 503 511 459 519
TOTAL 1,900 1,982 82 4% 1,950 1,964 2,002 2,058 2,142Post Grads 0 0 0 0 0 0 0 0 0Spec. Ed.* 11 1 -10 -91% 1 1 1 1 1
TOTAL 1,911 1,983** 72 3.8% 1,951 1,965 2,003 2,059 2,143**Includes 65 METCO students.*Students who receive special education services outside of the classroom for a significant amount of time.
TEN YEARS OF TOTAL SCHOOL ENROLLMENTS
Year Total Enrollment Change from Previous Year
Percent Change
2010 1,7082011 1,691 -17 -1.0%2012 1,721 30 1.8%2013 1,778 57 3.3%2014 1,804 26 1.5%2015 1,798 -6 -0.3%2016 1,851 53 2.9%2017 1,893 42 2.3%2018 1,911 18 1.0%2019 1,983 72 3.8%
Peak enrollment year: 2019, 1983 students
- 74 -

South High School
Middle 2019-2020School 8th Grade Enrollment
Brown (96%) 228OakHill 190Total 418
EIGHTH GRADE STUDENTS FROM THE SOUTH FEEDER SCHOOLS
500
1,000
1,500
2,000
2,500
3,000
Enrollment History and Projections
- 75 -

V. STUDENT EXITS AND ENTRANCES

Enrollment Analysis Report 2019
STUDENT EXITS AND ENTRANCES This section reports on student mobility in the Newton Public Schools due to the movement of students not resulting from grade promotion. The student mobility statistics reported below illuminate the annual cycle of new student entrances and student exits in the district and how net migration can affect total enrollment. In addition, exit and entrance statistics further detail the extent and the type of student mobility changes that are experienced by schools during the course of a full academic year; thus student mobility statistics reported in this section cover the entire 2018-19 school year, in contrast to other statistics in this report, which are reported as of a moment in time (October 1st). The table below displays three years of exit and entrance history. The 2018-19 school year shows a smaller positive net migration than the positive net migration in the previous two years. In 2018-19, new students comprised 6.6% of the total student population (not including new kindergarten enrollments in the fall), while student exits in the same year (not including graduates) made up 6.5% of the total population. The percentage of exits in 2018-19 is similar to the prior year. The percentage of entrances in 2018-19 is smaller than the prior two years.
There are a significant number of students who both enter and exit the Newton Public Schools in a single year. During the 2018-19 school year, 168 students, or 20% of the total entrances, both entered and left the Newton Public Schools. This is an increase from the previous year, when 144 students, or 16.7% of the total entrances, both entered and left the Newton Public Schools. The following table displays both the entrance and exit reasons for these students. The majority of these 168 students enrolled from outside of the country (51%), while the remainder enrolled from outside of Massachusetts, from private school, or from another town in Massachusetts. The majority of these 168 students exited because they moved out of Newton (40%) or moved out of the country (36%), while the remaining students left to attend private school or for other reasons. As displayed in the table, the largest group of entering and exiting students enrolled from outside the country and moved out of the country during 2018-19 (50 students, or 30% of the students who entered and exited; please note that this total does not include foreign exchange students. Foreign exchange students are included in the “other reasons” exit code). This was followed by students who enrolled from outside of Massachusetts and moved out of Newton (24 students, or 14%). This is
Annual Student Mobility 2016-17 2017-18 2018-19Number of Student Exits 757 838 823Percentage of Enrollment 6.0% 6.6% 6.5%Number of Student Entrances 946 864 841Percentage of Enrollment 7.6% 6.8% 6.6%Net In Migration (Out Migration) 189 26 18
- 76 -

Enrollment Analysis Report 2019
a similar pattern to last year’s students who both entered and exited within the 2017-2018 school year.
Student Exit Statistics In 2018-19, a total of 823 students, or 6.5% of the total enrollment, left their schools during or after the close of the academic year, not including graduates. Overall, the greatest number of student exits resulted from students moving out of Newton, although it varied by grade level. Similar to the prior two years, at the elementary and high school levels, the greatest number of student exits resulted from students moving out of Newton, but at the middle school level, the greatest number of exits resulted from students leaving to attend private school. Of the three grade levels, elementary schools saw the most student exits as a percentage of total enrollment (7.7% of elementary enrollment), followed by middle schools (7.3% of middle school enrollment), and high schools (4.3% of high school enrollment), the same pattern as the prior two years. High schools saw a higher percentage of students leaving during the academic school year (58.4% of high school exits) than elementary and middle schools (47.9% and 29.0%, respectively). Elementary schools, however, saw an increase in the percentage of students leaving during the academic school year instead at the end of the academic year, compared to the prior year (47.9% of elementary exits compared to 29.2% in 2017-2018). The following tables provide the total number of exiting students by school and grade level, and by reason for exit. In these tables, the reasons for exit are displayed for exits during Summer 2019, as the majority of exits in the district occur at or after the end of the school year. The number of exits during the 2018-19 school year and the total exits for 2018-19 are provided, as well as total 2017-18 exits for comparison.
Moved out of the Country
Moved out of Newton
Left to Attend Non-
Public School
Left Due to Special
Education Placement
Other Reasons** Total
Enrolled from MA* 6 21 4 7 38Enrolled from outside
of MA 3 24 2 1 30
Enrolled from outside the Country 50 20 5 10 85
Enrolled from Private School 2 3 6 1 3 15
Total 61 68 17 2 20 168
Entered from
Students who both entered and exited in 2018-19
Exited to
*The majority of students in this category have enrolled from another MA community and some have enrolled from an origin that is unknown.
**Other includes non-resident student transfers, home schooled students, students who dropped out, and deceased students.
- 77 -

Enrollment Analysis Report 2019
TABLE 10
School
All 2017-18
Exits
Exits during the
2018-19 School Year
Moved out of the
Country Summer
2019
Moved Out of Newton Summer
2019
Left to Attend
Non-Public School
Summer 2019
Left Due to Special
Education Placement Summer
2019
Left for Other*
Reasons Summer
2019
All 2018-19
ExitsAll Grades 838 373 73 175 163 17 22 823% Total Enrollment 6.6% 2.9% 0.6% 1.4% 1.3% 0.1% 0.2% 6.5%
45.3% 8.9% 21.3% 19.8% 2.1% 2.7% 100.0%% of All 2018-19 Exits
*Other includes non-resident student transfers, home schooled students, students who dropped out, and deceased students.
SUMMARY ALL GRADES2018 - 2019
School
All 2017-18
Exits
Exits during the
2018-19 School Year
Moved out of the
Country Summer
2019
Moved Out of Newton Summer
2019
Left to Attend
Non-Public School
Summer 2019
Left Due to Special
Education Placement Summer
2019
Left for Other*
Reasons Summer
2019
All 2018-19
Exits
Angier 41 16 2 4 3 25
Bowen 32 8 8 14 4 34
Burr 19 17 5 22
Cabot 29 25 1 3 2 31
Countryside 30 20 1 3 3 1 28
Franklin 26 9 9 3 2 23
Horace Mann 26 16 5 1 22
Lincoln-Eliot 41 24 2 4 1 31
Mason-Rice 45 1 2 17 12 1 33
Memorial-Spaulding 28 6 3 5 7 1 22
Peirce 24 7 3 3 12 1 26
Underwood 17 23 2 1 26
Ward 34 9 7 6 15 37
Williams 36 8 5 11 3 1 28
Zervas 35 23 11 7 10 2 2 55
Total 463 212 45 96 78 7 5 443% of Elementary Enrollment 7.9% 3.7% 0.8% 1.7% 1.3% 0.1% 0.1% 7.7%
47.9% 10.2% 21.7% 17.6% 1.6% 1.1% 100.0%% of All 2018-19 Exits
*Other includes non-resident student transfers, home schooled students, students who dropped out, and deceased students.
EXITING ELEMENTARY SCHOOL STUDENTS2018 - 2019
- 78 -

Enrollment Analysis Report 2019
TABLE 11
TABLE 12
School
All 2017-18
Exits
Exits during the
2018-19 School Year
Moved out of the
Country Summer
2019
Moved Out of Newton Summer
2019
Left to Attend
Non-Public School
Summer 2019
Left Due to Special
Education Placement Summer
2019
Left for Other*
Reasons Summer
2019
All 2018-19
Exits
Bigelow 46 11 5 11 4 1 1 33
Brown 62 10 1 8 21 2 2 44
Day 57 21 2 23 24 1 1 72
Oak Hill 45 18 7 9 19 1 4 58
Total 210 60 15 51 68 5 8 207% Middle School Enrollment 7.3% 2.1% 0.5% 1.8% 2.4% 0.2% 0.3% 7.3%
29.0% 7.2% 24.6% 32.9% 2.4% 3.9% 100.0%% of All 2018-19 Exits
*Other includes non-resident student transfers, home schooled students, students who dropped out, and deceased students.
2018 - 2019EXITING MIDDLE SCHOOL STUDENTS
School
All 2017-18
Exits
Exits during the
2018-19 School Year
Moved out of the
Country Summer
2019
Moved Out of Newton Summer
2019
Left to Attend
Non-Public School
Summer 2019
Left Due to Special
Education Placement Summer
2019
Left for Other*
Reasons Summer
2019
All 2018-19
Exits
North High 89 52 6 18 12 2 4 94
South High 76 49 7 10 5 3 5 79
Total 165 101 13 28 17 5 9 173% High School Enrollment 4.1% 2.5% 0.3% 0.7% 0.4% 0.1% 0.2% 4.3%
58.4% 7.5% 16.2% 9.8% 2.9% 5.2% 100.0%% of All 2018-19 Exits*Other includes non-resident student transfers, home schooled students, students who dropped out, and deceased students.
EXITING HIGH SCHOOL STUDENTS2018 - 2019
- 79 -

Enrollment Analysis Report 2019
A three year history of student exits is shown below. In 2018-19, the elementary schools saw a decrease in student exits as a percentage of the grade level enrollment from the prior year, while high schools saw an increase in student exits as a percentage of the grade level enrollment from the prior year.
TABLE 13
School 2016-17 2017-18# %
Change 2018-19# %
Change
Angier 24 41 17 25 -16Bowen 40 32 -8 34 2Burr 30 19 -11 22 3Cabot 27 29 2 31 2Countryside 30 30 0 28 -2Franklin 14 26 12 23 -3Horace Mann 19 26 7 22 -4Lincoln-Eliot 35 41 6 31 -10Mason-Rice 32 45 13 33 -12Memorial-Spaulding 51 28 -23 22 -6Peirce 36 24 -12 26 2Underwood 22 17 -5 26 9Ward 23 34 11 37 3Williams 40 36 -4 28 -8Zervas 20 35 15 55 20Total Elementary 443 463 20 443 -20% Elementary Enrollment 7.6% 7.9% 4.5% 7.7% -4.3%Bigelow 41 46 5 33 -13Brown 59 62 3 44 -18Day 48 57 9 72 15Oak Hill 40 45 5 58 13Total Middle School 188 210 22 207 -3% Middle School Enrollment 6.6% 7.3% 11.7% 7.3% -1.4%North High 71 89 18 94 5South High 55 76 21 79 3Total High School 126 165 39 173 8% High School Enrollment 3.2% 4.1% 31.0% 4.3% 4.8%
Grand Total 757 838 81 823 -15% Total Enrollment 6.0% 6.6% 10.7% 6.5% -1.8%
TOTAL STUDENT EXITSThree Year History
- 80 -

Enrollment Analysis Report 2019
Table 14 provides a history of student exits to private schools at the elementary, middle and high school levels since 2012-13. It includes a breakout of the number and percentage of exits in transition years after the completion of elementary school (grade 5) and middle school (grade 8). In 2018-19, 36.4% of students who left elementary schools to attend private school did so in grade 5, which is lower than the previous two years. Of the students who left their middle school to attend private school, 50% transferred in grade 8, a slight decrease from the previous year.
TABLE 14
12-13 13-14 14-15 15-16 16-17 17-18 18-19All Elementary 98 67 85 84 91 112 99% of Elementary Enrollment 1.7% 2.5% 1.5% 1.5% 1.6% 1.9% 1.7%
Grade 5* 49 36 34 39 39 47 36 % of Elementary exits 50.0% 53.7% 40.0% 46.4% 42.9% 42.0% 36.4%
All Middle School 50 45 67 54 65 77 78% of Middle School Enrollment 1.8% 1.2% 2.4% 1.9% 2.3% 2.7% 2.7%
Grade 8* 26 20 35 22 33 41 39 % of Middle School exits 52.0% 44.4% 52.2% 40.7% 50.8% 53.2% 50.0%
All High School 29 39 45 34 37 42 37% of High School Enrollment 0.8% 0.3% 1.2% 0.9% 0.9% 1.0% 0.9%
Grand Total 177 151 197 172 193 231 214% of Total Enrollment 1.5% 1.2% 1.6% 1.4% 1.5% 1.8% 1.7%
*Statistics on Grade 5 and Grade 8 exits are provided to highlight grade level transition years.
Level Academic Year
HISTORY OF EXITS TO NON-PUBLIC SCHOOLS
- 81 -

Enrollment Analysis Report 2019
Student Entrance Statistics There were 841 students, or 6.6% of total enrollment, who entered Newton Public Schools in 2018-19 who had not been students in the previous academic year, not including kindergarten entrances in the fall. This is a decrease of 23 students from the prior year, when there were 864 student entrances, or 6.8% of total enrollment. The following tables provide the total number of entering students by school and grade level, and by reason for enrollment and/or origin of the enrolled student. In 2018-19, new students who enrolled in Newton Public Schools were most frequently enrolling from private school, although similar numbers of students were enrolling from other communities in Massachusetts, enrolling from outside of Massachusetts, or enrolling from outside the country. Entrances by reason for enrollment are displayed as of October 1, 2018, as the majority of student entrances occur between the end of the prior school year and October 1st. Total entrances as of 2017-18, 2018-19, and October 1, 2019 are included for comparison. Overall, the number of student entrances as of October 1, 2019 is 693 students, slightly higher than last year when there were 662 student entrances as of October 1, 2018 (please note that incoming kindergarten students are not included in these tables).
School
All 2017-18
Entrances
Oct 1 2018 Enrolled from MA*
Oct 1 2018 Enrolled
from outside of
MA
Oct 1 2018 Enrolled
from outside the
Country
Oct 1 2018 Enrolled
from Private School
Additional Entrances through
June 2019
All 2018-19
Entrances
Current Year as of October 1,
2019
All Grades 864 162 162 163 178 176 841 693
% of Total Enrollment 6.8% 1.3% 1.3% 1.3% 1.4% 1.4% 6.6% 5.5%
19.3% 19.3% 19.4% 21.2% 20.9% 100.0%* The majority of students in this category have enrolled from another MA community and some have enrolled from an origin that is unknown.
% of All 2018-19 Entrances
SUMMARY ALL GRADES2018-19 AND 2019-20 ENTRANCES AS OF OCTOBER 1, 2019
- 82 -

Enrollment Analysis Report 2019
TABLE 15
TABLE 16
School
All 2017-18
Entrances
Oct 1 2018 Enrolled from MA*
Oct 1 2018 Enrolled
from outside of
MA
Oct 1 2018 Enrolled
from outside the
Country
Oct 1 2018 Enrolled
from Private School
Additional Entrances through
June 2019
All 2018-19
Entrances
Current Year as of October 1,
2019
Angier 32 6 17 4 7 6 40 18
Bowen 46 3 7 6 1 15 32 31
Burr 24 3 3 2 2 3 13 15
Cabot 33 5 5 3 8 5 26 36
Countryside 41 10 6 4 2 15 37 29
Franklin 14 12 1 4 5 3 25 11
Horace Mann 27 6 1 3 4 4 18 15
Lincoln-Eliot 41 13 4 5 5 17 44 26
Mason-Rice 35 1 6 12 9 3 31 16
Memorial-Spaulding 31 7 10 6 5 5 33 32
Peirce 18 1 2 2 3 4 12 16
Underwood 20 7 10 2 3 5 27 7
Ward 28 2 10 8 3 5 28 12
Williams 28 4 6 5 4 1 20 13
Zervas 59 4 12 5 10 14 45 25
Total 477 84 100 71 71 105 431 302% of Elementary Enrollment 8.2% 1.5% 1.7% 1.2% 1.2% 1.8% 7.4% 5.4%
19.5% 23.2% 16.5% 16.5% 24.4% 100.0%
* The majority of students in this category have enrolled from another MA community and some have enrolled from an origin that is unknown.
ENTERING ELEMENTARY SCHOOL STUDENTS 2018-19 AND 2019-20 ENTRANCES AS OF OCTOBER 1, 2019
% of All 2018-19 Entrances
School
All 2017-18
Entrances
Oct 1 2018 Enrolled from MA*
Oct 1 2018 Enrolled
from outside of
MA
Oct 1 2018 Enrolled
from outside the
Country
Oct 1 2018 Enrolled
from Private School
Additional Entrances through
June 2019
All 2018-19
Entrances
Current Year as of October 1,
2019
Bigelow 39 8 8 6 9 11 42 28
Brown 44 5 13 10 17 10 55 51
Day 37 13 7 9 5 5 39 49
Oak Hill 46 8 8 11 9 7 43 32
Total 166 34 36 36 40 33 179 160% of Middle School Enrollment 5.8% 1.2% 1.3% 1.3% 1.4% 1.2% 6.3% 5.5%
19.0% 20.1% 20.1% 22.3% 18.4% 100.0%
* The majority of students in this category have enrolled from another MA community and some have enrolled from an origin that is unknown.
ENTERING MIDDLE SCHOOL STUDENTS2018-19 AND 2019-20 ENTRANCES AS OF OCTOBER 1, 2019
% of All 2018-19 Entrances
- 83 -

Enrollment Analysis Report 2019
TABLE 17
School
All 2017-18
Entrances
Oct 1 2018 Enrolled from MA*
Oct 1 2018 Enrolled
from outside of
MA
Oct 1 2018 Enrolled
from outside the
Country
Oct 1 2018 Enrolled
from Private School
Additional Entrances through
June 2019
All 2018-19
Entrances
Current Year as of October 1,
2019
North High 114 24 14 18 42 19 117 106
South High 107 20 12 38 25 19 114 125
Total 221 44 26 56 67 38 231 231% of High School Enrollment 5.4% 1.1% 0.6% 1.4% 1.7% 0.9% 5.7% 5.7%
19.0% 11.3% 24.2% 29.0% 16.5% 100.0%
* The majority of students in this category have enrolled from another MA community and some have enrolled from an origin that is unknown.
ENTERING HIGH SCHOOL STUDENTS2018-19 AND 2019-20 ENTRANCES AS OF OCTOBER 1, 2019
% of All 2018-19 Entrances
- 84 -

VI. NON-PUBLIC/PRIVATE SCHOOL STUDENTS

Enrollment Analysis Report 2019
NON-PUBLIC/PRIVATE SCHOOL STUDENTS
This section reports on school-age children residing in Newton who are attending non-public or private schools. A census of non-public school students is conducted each year, as required by Massachusetts law, and provides information on where Newton’s school-age population is attending school outside of Newton Public Schools. This includes private independent schools, private special education schools, other public schools, charter schools, or students who are home schooled. Special education students outplaced by Newton Public Schools are included in the census. The data reported in this section is based on the 2019 non-public school student census conducted in January 2019 during the 2018-19 school year. Based on the 2019 census, 18.8% of the school-age population, or 2,935 students, were enrolled in non-public schools in 2018-19. This is a slight decrease from the previous year, when 18.9% of the school-age population (2,962 students) was enrolled in non-public schools. Figures 1 and 2 display the history of enrollment in non-public schools for Newton residents. These figures show that the number and percentage of the school-age population in Newton enrolled in non-public schools has decreased slightly in 2018-19.
- 85 -

Enrollment Analysis Report 2019
The chart below shows the breakdown of non-public school enrollment by type of school in 2018-19. The majority of the school-age population in Newton that is enrolled in non-public schools is enrolled in private schools in Massachusetts.
The remainder of this section examines non-public school enrollment at the three grade levels and by districted Newton school. The percentage of the school-age population attending non-public schools at the elementary, middle, and high school grade levels over time is illustrated in Figure 3 below. There is a consistent history of higher rates of enrollment in non-public schools at the secondary grade levels (grades 6-12), where approximately 22% of the school-age population is enrolled in non-public schools in 2018-19. At the middle school level, the percentage of students enrolled in non-public schools has increased slightly, from 21.6% in 2017-18 to 22.1%. At the high school level, the percentage of students enrolled in non-public schools has stayed relatively stable at 21.3% in 2018-19. Elementary students continue to be enrolled in non-public schools at a rate between 15% and 16% as they have since 2006.
Special Education
CollaborativeCharter School
Other Public School
Home Schooled
In-State Private School
Out-of-State Private School
<1% <1% <1% 2% 95% 1%
PERCENT OF NON-PUBLIC SCHOOL ENROLLMENT BY TYPE OF SCHOOL
- 86 -

Enrollment Analysis Report 2019
Three additional tables are included in this section. Table 18 displays non-public school enrollment by grade and Table 19 presents this information further delineated by districted school. Table 20 displays the distribution of Newton Public Schools students who are placed out-of-district as of the time of the census due to the special education needs of the students by grade level and districted school. Highlights of these tables are described below:
• The number of students enrolled in non-public schools decreased slightly at the elementary school level, and increased slightly at the middle and high school levels.
• Grade 6 and grade 9 are both transition years in Newton. Grade 6 saw an
increase in the percentage of students enrolled in non-public schools from the prior year (22.3% of 6th graders compared to 19.8% in the prior year). Grade 9 saw a slight decrease in the percentage of students enrolled in non-public schools from the prior year (20.5% of 9th graders compared to 21% in the prior year).
• Enrollment of students with special education placements attending private
schools, special education collaborative programs, or other public schools decreased from 2017-18, from 118 to 114 students, a 3% decrease. For detailed special education enrollment statistics, please refer to Appendix A, Table 6.
- 87 -

Enrollment Analysis Report 2019
K 164 16.2% 163 16.1% -1 -0.6%1 132 12.0% 156 14.7% 24 18.2%2 170 15.0% 141 12.6% -29 -17.1%3 182 14.9% 174 15.2% -8 -4.4%4 200 16.4% 187 15.0% -13 -6.5%5 237 19.4% 210 17.0% -27 -11.4%
Total 1,085 15.7% 1,031 15.1% -54 -5.0%
6 230 19.8% 280 22.3% 50 21.7%7 276 22.5% 238 20.3% -38 -13.8%8 285 22.4% 291 23.5% 6 2.1%
Total 791 21.6% 809 22.1% 18 2.3%
9 260 21.0% 263 20.5% 3 1.2%10 276 21.7% 267 21.1% -9 -3.3%11 270 21.5% 273 21.2% 3 1.1%12 280 21.8% 292 22.4% 12 4.3%
Total 1,086 21.1% 1,095 21.3% 9 0.8%
Grand Total 2,962 18.9% 2,935 18.8% -27 -0.9%
% of School-Age Population
% of School-Age Population
N 2017-18
N 2018-19
Note: Students that are beyond grade 12 are reported as grade 12.
Change from Prior Year (N, %)Grade
TABLE 18
NON-PUBLIC SCHOOL STUDENTS AS PERCENT OFTOTAL SCHOOL-AGE POPULATION
BY GRADE
- 88 -

Enrollment Analysis Report 2019
Elementary District N% of School
Age Population K 1 2 3 4 5 N% of School
Age Population
Angier 81 14.8% 11 15 6 10 16 22 80 13.7%Bowen 104 19.8% 11 13 18 14 17 20 93 19.0%Burr 26 6.3% 8 9 5 5 7 9 43 10.1%Cabot 80 17.0% 14 15 8 12 17 16 82 17.5%Countryside 68 14.2% 12 14 5 20 10 14 75 15.4%Franklin 42 8.8% 10 6 2 5 3 11 37 8.0%Horace Mann 38 8.6% 5 3 3 6 4 9 30 7.0%Lincoln-Eliot 47 11.2% 7 5 7 7 7 3 36 9.0%Mason-Rice 93 15.4% 13 14 11 17 12 13 80 14.1%Memorial-Spaulding 147 24.5% 23 16 21 22 19 17 118 20.3%Peirce 93 25.2% 11 10 15 14 19 20 89 24.7%Underwood 47 14.2% 8 8 6 6 6 3 37 11.3%Ward 122 28.3% 18 16 20 23 26 30 133 31.0%Williams 21 6.6% 2 5 5 5 4 7 28 9.2%Zervas 76 15.7% 10 7 9 8 20 16 70 14.1%Total Elementary 1,085 15.7% 163 156 141 174 187 210 1,031 15.1%
6 7 8Bigelow Middle 131 20.1% 61 35 53 149 22.9%Brown Middle 224 22.9% 71 69 78 218 22.7%Day Middle 229 18.9% 69 73 83 225 18.7%Oak Hill Middle 207 25.2% 79 61 77 217 25.6%Total Middle School 791 21.6% 280 238 291 809 22.1%
9 10 11 12Newton North 491 18.5% 118 113 127 136 494 18.8%Newton South 595 23.9% 145 154 146 156 601 23.9%Total High School 1086 21.1% 263 267 273 292 1095 21.3%
GRAND TOTAL 2,962 18.9% 2,935 18.8%Notes1) Students that are beyond grade 12 are reported as grade 12.
TABLE 19
AS PERCENT OF TOTAL SCHOOL-AGE POPULATION
2018-192018-19 by Grade2017-18
2) Students residing in buffer zones are assigned a districted school according to the attendance percentages of currently enrolled buffer zone resident students.
BY DISTRICTED SCHOOL AND GRADE LEVEL
NON-PUBLIC SCHOOL STUDENTS
- 89 -

Enrollment Analysis Report 2019
Total TotalAs of As of
Elementary 2017-18 PK K 1 2 3 4 5 2018-19
Angier 0 0Bowen 0 1 1 2Burr 0 1 1 2Cabot 0 1 1Countryside 1 1 1Franklin 3 4 4Horace Mann 4 1 1 1 3Lincoln-Eliot 1 1 1Mason-Rice 2 1 1 2Memorial-Spaulding 2 1 1Peirce 0 0Underwood 1 1 1Ward 1 1 1 2Williams 0 0Zervas 0 0Total Elementary 15 0 0 1 0 4 5 10 20
6 7 8Bigelow Middle 3 1 1Brown Middle 8 1 2 3 6Day Middle 8 2 3 5Oak Hill Middle 5 2 2 1 5Total Middle School 24 5 4 8 17
9 10 11 12Newton North 45 8 9 9 21 47Newton South 34 6 4 6 14 30Total High School 79 14 13 15 35 77Grand Total 118 114
Note: Students that are beyond grade 12 are reported as grade 12.
2018-19 Grade
TABLE 20
SPECIAL EDUCATION STUDENTSTUITIONED-OUT TO NON-PUBLIC SCHOOLS
BY DISTRICTED SCHOOL AND GRADE LEVEL
- 90 -

APPENDICES
A. STUDENT POPULATION DETAIL
B. CITY OF NEWTON POPULATION
C. RESIDENTIAL PROPERTY DATA
D. NESDEC’S ENROLLMENT PROJECTIONS VS. NEWTON’S
E. SCHOOL DISTRICTS AND BUFFER ZONES
F. RESIDENTIAL DEVELOPMENT

Enrollment Analysis Report 2019
APPENDIX A STUDENT POPULATION DETAIL
Demographic Information (Table 1) Tables 1A – 1D provide demographic information by school and by grade. Table 1A displays the percentage of 2019-20 enrollments by race/ethnicity for each school and the district. Table 1B displays the percentage of 2019-20 enrollments by race/ethnicity for each grade level.
School
African American/
BlackAsian Hispanic
or Latino
American Indian or Alaska Native
White
Native Hawaiian,
Pacific Islander
Multi-Race, Non-
HispanicAngier 502 3% 14% 5% 0% 70% 0% 8%Bowen 372 5% 26% 8% 0% 53% 0% 8%Burr 366 5% 19% 10% 0.3% 57% 0% 8%Cabot 393 5% 13% 6% 0% 62% 1% 12%Countryside 413 5% 28% 5% 0% 53% 0% 8%Franklin 413 3% 12% 8% 0% 70% 0.7% 7%Horace Mann 391 4% 15% 7% 0% 63% 0% 11%Lincoln-Eliot 362 7% 18% 12% 0% 54% 0% 9%Mason-Rice 446 1% 19% 4% 0% 68% 0% 8%Memorial-Spaulding 465 4% 23% 8% 0% 59% 0% 5%Peirce 284 4% 21% 9% 0% 60% 0% 6%Underwood 269 3% 18% 13% 0% 57% 0% 8%Ward 255 2% 13% 4% 0% 75% 0% 6%Williams 261 5% 34% 8% 0.4% 47% 0% 6%Zervas 434 6% 22% 7% 0.5% 54% 0.5% 10%TOTAL ELEMENTARY 5,626 4% 20% 8% 0.1% 60% 0.1% 8%Bigelow 494 5% 16% 9% 0.2% 63% 0% 7%Brown 778 3% 21% 5% 0.3% 66% 0% 5%Day 999 4% 17% 9% 0.2% 63% 0% 6%Oak Hill 632 6% 26% 5% 0.2% 57% 0.2% 6%TOTAL MIDDLE 2,903 4% 20% 7% 0.2% 63% 0.0% 6%Newton North 2,099 6% 15% 9% 0.3% 62% 0% 7%Newton South 1,983 5% 22% 6% 0% 61% 0% 6%TOTAL HIGH SCHOOL 4,082 6% 18% 8% 0.2% 62% 0% 6%GRAND TOTAL 12,611 5% 19% 8% 0.1% 61% 0.1% 7%
TABLE 1AENROLLMENTS BY RACE/ETHNICITY BY SCHOOL
2019-2020
Percentage of enrollment
TotalEnrollment
FY20
- 91 -

Enrollment Analysis Report 2019
Tables 1C and 1D display the percentage of students who are low income (measured by students qualifying for free or reduced price lunch) and the percentage of students who are economically disadvantaged for 2018-19 and 2019-20. The economically disadvantaged indicator is an indicator that was introduced by the state in 2015 to replace the low income indicator. This indicator was developed because of the introduction of the Community Eligibility Provision to the USDA School Lunch Program that no longer requires the collection of lunch forms by participating districts. The economically disadvantaged indicator includes students who participate in one or more of the following state-administered programs: SNAP (Supplemental Nutrition Assistance Program), TAFDC (Transitional Aid to Families with Dependent Children), DCF (Department of Children and Families’ foster care program), and Medicaid (MassHealth). Both the low income and economically disadvantaged indicators are available in Newton. For 2019-20, the percentages of economically disadvantaged by school and grade are estimated based on the most recent free and reduced price lunch data, as the actual percentages for the current school year are not yet available from the state.
Grade
African American/
BlackAsian Hispanic
or Latino
American Indian or Alaska Native
White
Native Hawaiian,
Pacific Islander
Multi-Race, Non-
HispanicK 825 3% 21% 6% 0.1% 60% 0% 9%1 902 4% 21% 7% 0.1% 60% 0.2% 8%2 918 5% 19% 8% 0% 59% 0.1% 9%3 968 4% 19% 8% 0% 60% 0.1% 8%4 952 4% 20% 8% 0% 61% 0.1% 7%5 1,061 5% 18% 7% 0.2% 62% 0.2% 7%
TOTAL ELEMENTARY 5,626 4% 20% 8% 0.1% 60% 0.1% 8%6 995 5% 22% 6% 0.2% 63% 0% 5%7 984 4% 19% 8% 0.3% 62% 0% 6%8 924 4% 19% 8% 0.1% 63% 0.1% 6%
TOTAL MIDDLE 2,903 4% 20% 7% 0.2% 63% 0.0% 6%9 997 4% 18% 8% 0.2% 63% 0% 7%
10 1,036 6% 20% 8% 0.2% 59% 0% 7%11 1,000 6% 18% 8% 0.3% 62% 0% 6%12 1,049 7% 17% 7% 0% 63% 0% 5%
TOTAL HIGH 4,082 6% 18% 8% 0.2% 62% 0% 6%GRAND TOTAL 12,611 5% 19% 8% 0.1% 61% 0.1% 7%
TotalEnrollment
FY20
Percentage of enrollment
TABLE 1BENROLLMENTS BY RACE/ETHNICITY BY GRADE
2019-2020
Note: Students who receive special education services beyond grade 12 are included with grade 12 in this table.
- 92 -

Enrollment Analysis Report 2019
School
Low IncomeFY19
Low IncomeFY20
% PointChange
Eco. Disadv. FY19
Eco. Disadv. FY20*
% PointChange
Angier 502 7% 8% 1% 5% 5% 0%Bowen 372 12% 12% 0% 6% 10% 4%Burr 366 16% 14% -2% 11% 11% 0%Cabot 393 12% 12% 0% 6% 9% 3%Countryside 413 17% 15% -2% 13% 12% -1%Franklin 413 12% 11% -1% 7% 9% 2%Horace Mann 391 15% 11% -4% 9% 8% -1%Lincoln-Eliot 362 30% 32% 2% 17% 25% 8%Mason-Rice 446 6% 4% -2% 3% 2% -1%Memorial-Spaulding 465 8% 9% 1% 7% 7% 0%Peirce 284 10% 9% -1% 7% 6% -1%Underwood 269 15% 15% 0% 9% 13% 4%Ward 255 5% 7% 2% 3% 6% 3%Williams 261 11% 10% -1% 6% 8% 2%Zervas 434 14% 12% -2% 9% 9% 0%TOTAL ELEMENTARY 5,626 13% 12% -1% 8% 9% 1%Bigelow 494 18% 17% -1% 11% 12% 1%Brown 778 12% 12% 0% 6% 9% 3%Day 999 16% 16% 0% 7% 13% 6%Oak Hill 632 13% 16% 3% 9% 12% 3%TOTAL MIDDLE 2,903 15% 15% 0% 8% 11% 3%Newton North 2,099 19% 17% -2% 12% 12% 0%Newton South 1,983 15% 14% -1% 8% 10% 2%TOTAL HIGH SCHOOL 4,082 17% 15% -2% 10% 11% 1%GRAND TOTAL 12,611 15% 14% -1% 9% 10% 1%
TotalEnrollment
FY20
Percentage of enrollment
*Economically Disadvantaged percentages for FY20 are estimates based on FY20 free and reduced price lunch data.
2019-2020
TABLE 1CENROLLMENTS BY LOW INCOME AND ECONOMICALLY DISADVANTAGED
BY SCHOOL
- 93 -

Enrollment Analysis Report 2019
Grade
Low IncomeFY19
Low IncomeFY20
% PointChange
Eco. Disadv. FY19
Eco. Disadv. FY20*
% PointChange
K 825 9% 11% 2% 7% 10% 3%1 902 13% 11% -2% 8% 9% 1%2 918 13% 14% 1% 8% 12% 4%3 968 12% 12% 0% 7% 8% 1%4 952 12% 12% 0% 6% 9% 3%5 1,061 16% 11% -5% 9% 8% -1%
TOTAL ELEMENTARY 5,626 13% 12% -1% 8% 9% 1%6 995 13% 15% 2% 8% 11% 3%7 984 17% 14% -3% 9% 10% 1%8 924 13% 16% 3% 7% 13% 6%
TOTAL MIDDLE 2,903 15% 15% 0% 8% 11% 3%9 997 17% 12% -5% 9% 9% 0%
10 1,036 18% 16% -2% 11% 11% 0%11 1,000 16% 17% 1% 9% 12% 3%12 1,049 19% 17% -2% 11% 12% 1%
TOTAL HIGH 4,082 17% 15% -2% 10% 11% 1%GRAND TOTAL 12,611 15% 14% -1% 9% 10% 1%
*Economically Disadvantaged percentages for FY20 are estimates based on FY20 free and reduced price lunch data.
TotalEnrollment
FY20
Percentage of enrollment
TABLE 1DENROLLMENTS BY LOW INCOME AND ECONOMICALLY DISADVANTAGED
BY GRADE2019-2020
Note: Students who receive special education services beyond grade 12 are included with grade 12 in this table.
- 94 -

Enrollment Analysis Report 2019
Preschool Enrollment (Table 2) Table 2 displays preschool enrollment in Newton for 2018-19 and 2019-20. Preschool enrollment as of October 1, 2019 is 184 students, a decrease of 29 students from the prior year. The majority of current preschool students (62%) are receiving special education services. Table 2A displays the nature of disability for current preschool students.
Category 2018-19 2019-20 Difference % Change
Role Model Students 72 70 -2 -2.8%Students Receiving Services 141 114 -27 -19.1%TOTAL 213 184 -29 -13.6%
Type of Need
AutismCommunicationDevelopmental Delay (ages 3 to 9 only)EmotionalHealthNeurologicalPhysicalSensory/Hard of Hearing or DeafSensory/Vision Impairment or BlindTypically Developing/Role ModelTOTAL
Number of Students
PRESCHOOL STUDENTSOCTOBER 1, 2019
TABLE 2PRESCHOOL STUDENTS
OCTOBER 1, 2018 AND OCTOBER 1, 2019
TABLE 2A
184
32175701303
701
- 95 -

Enrollment Analysis Report 2019
METCO Enrollment (Table 3) The number of students participating in the METCO Program in the Newton Public Schools as of October 1, 2019 is 424. Of the 424 students, 47% are enrolled in the elementary schools, 21% are at the middle schools, and 32% are at the high schools.
K 1 2 3 4 5Angier 3 2 2 1 2 10Bowen 2 2 3 3 10Burr 4 1 4 3 12Cabot 2 3 3 1 5 14Countryside 3 4 2 2 5 3 19Franklin 2 2 3 1 2 10Horace Mann 5 2 3 2 12Lincoln-Eliot 3 3 2 2 4 5 19Mason-Rice 1 2 1 1 4 9Memorial-Spaulding 3 1 4 6 5 19Peirce 3 5 4 4 16Underwood 2 2 2 1 2 4 13Ward 2 1 2 2 7Williams 1 5 2 3 2 13Zervas 2 3 5 3 1 2 16Total Elementary 21 30 33 41 37 37 199
46.9%
6 7 88 10 7 251 8 913 6 6 2516 8 7 3138 32 20 90
21.2%
9 10 11 1212 17 20 21 7011 15 16 23 6523 32 36 44 135
31.8%424
Grade level as % of all METCO students
TABLE 3
BY SCHOOL AND GRADEGrade
2019-20 METCO ENROLLMENT
School Total
Grand Total
North HighSouth HighTotal High
Total Middle
Grade level as % of all METCO students
Grade level as % of all METCO students
BigelowBrownDayOak Hill
- 96 -

Enrollment Analysis Report 2019
English Language Learners (Tables 4 and 5) Table 4 indicates a decrease of 71 students, or -8.5%, in the number of PK-12 students identified as "English Language Learners" from last year. There are a total of 769 students in the program this year compared to 840 students last year. The English Language Learners population has grown by 453 students, or 143%, since 1990.
Year (as of October 1) Program Enrollment Difference % Change
1990 3161991 390 74 23.4%1992 414 24 6.2%1993 486 72 17.4%1994 468 -18 -3.7%1995 454 -14 -3.0%1996 485 31 6.8%1997 480 -5 -1.0%1998 466 -14 -2.9%1999 509 43 9.2%2000 566 57 11.2%2001 581 15 2.7%2002 551 -30 -5.2%2003 545 -6 -1.1%2004 551 6 1.1%2005 522 -29 -5.3%2006 553 31 5.9%2007 635 82 14.8%2008 650 15 2.4%2009 687 37 5.7%2010 766 79 11.5%2011 783 17 2.2%2012 778 -5 -0.6%2013 911 133 17.1%2014 875 -36 -4.0%2015 827 -48 -5.5%2016 859 32 3.9%2017 881 22 2.6%2018 840 -41 -4.7%2019 769 -71 -8.5%
TABLE 4
1990 - PRESENTENGLISH LANGUAGE LEARNERS
*Starting in 2017, per state requirements, preschool students were screened through the English Language Learners office. Starting in 2018, PK students are included in program enrollment.
- 97 -

Enrollment Analysis Report 2019
Table 5 on the following page shows the number of English Language Learner students by grade level and first language in the current year and the two prior years. The elementary ELL population has decreased by 33 students from last year and the ELL population at the secondary level (grades 6 -12) has decreased by 38 students from last year. Table 5 also shows the number of students in each of the seven largest language groups for this school year and the two prior school years. The students in these groups receive native language support as needed. "Other" languages, including French, Vietnamese, Pushtu/Pashtu, Turkish, and Arabic, among others, represent 21% of the total ELL program enrollment in 2019-20.
- 98 -

Enro
llmen
t Ana
lysi
s Rep
ort
2019
LANG
UAG
EK
-56-
12To
tal
PK
-56-
12To
tal
PK
-56-
12To
tal
PK
-56-
12To
tal
PK
-56-
12To
tal
Chi
nese
(All
Form
s)15
791
248
168
7524
311
-16
-512
967
196
-39
-8-4
7
Spa
nish
6337
100
6548
113
211
1381
3811
916
-10
6
Rus
sian
7810
8878
1694
06
678
1492
0-2
-2
Heb
rew
7025
9542
1860
-28
-7-3
537
1855
-50
-5
Japa
nese
5614
7046
2167
-10
7-3
3816
54-8
-5-1
3
Kor
ean
4310
5336
945
-7-1
-832
1345
-44
0
Por
tugu
ese
3020
5024
2751
-67
130
1545
6-1
2-6
Oth
er11
958
177
115
5216
7-4
-6-1
011
647
163
1-5
-4
TOTA
L61
626
588
157
426
684
0-4
21
-41
541
228
769
-33
-38
-71
*Sta
rting
in 2
017,
per
sta
te re
quire
men
ts, p
resc
hool
stu
dent
s w
ere
scre
ened
thro
ugh
the
Eng
lish
Lang
uage
Lea
rner
s of
fice.
Sta
rting
in 2
018,
PK
stu
dent
s ar
e in
clud
ed in
pro
gram
enr
ollm
ent.
TREN
DS
OVE
R T
HR
EE Y
EAR
S
2018
-19
vs. 2
019-
20
TAB
LE 5
BY
FIR
ST L
ANG
UAG
E AN
D G
RAD
E LE
VEL
2017
-18
vs. 2
018-
19
ENG
LISH
LAN
GU
AGE
LEAR
NER
S
Diffe
renc
eDi
ffere
nce
2018
-19
2017
-18
2019
-20
- 99 -

Enrollment Analysis Report 2019
Students with Special Education Services (Table 6) The following table reports five years of enrollment history of students requiring special education services by placement type and grade level. For all grade levels combined, the percentage of students receiving special education services in the Newton Public Schools this year is 17.3%. This is a decrease of 77 students from last school year. There are fewer special education students at all three grade levels this year. There has been a slight increase in out of district placements as of October 2019 (131 students vs. 126 students in October 2018 vs. 139 students in October 2017). Program placement type is defined according to the time out of the regular classroom environment required by a special education placement. The majority of students with special education services are fully included in the general education classroom, with less than 21% of time spent outside of the classroom. Ten year trends in the distribution of students by special education placement and grade level are illustrated in the graph at the end of the section.
TABLE 6 DISTRIBUTION OF STUDENTS RECEIVING SPECIAL EDUCATION SERVICES
Level 10 20 40* 41* 50* 60* 70* 90*% of Time Outside Classroom <21% 21-60% >60% 100% 100% 100% 100% 100%Elementary 730 50 25 1 14 1 0 0 821 14.5%Middle 411 66 25 3 20 3 0 0 528 18.0%High 544 126 84 27 66 9 0 0 856 20.6%Total 1,685 242 134 31 100 13 0 0 2,205 17.3%
Level 10 20 40* 41* 50* 60* 70* 90*% of Time Outside Classroom <21% 21-60% >60% 100% 100% 100% 100% 100%Elementary 762 36 32 4 9 0 0 0 843 14.6%Middle 420 104 26 1 10 1 0 0 562 19.7%High 579 138 67 29 50 13 1 0 877 21.7%Total 1,761 278 125 34 69 14 1 0 2,282 18.0%
TABLE 6DISTRIBUTION OF STUDENTS RECEIVING SPECIAL EDUCATION SERVICES
**Pre-school students are not included. If Pre-school students (114) were included in this table, the total Special Education population would be 2,319 (18.1%).
October 2019Level of Service
Total Special Education**
% of Total Enrollment
*The Level of Service of "40" is defined as "All ages, in a substantially separate classroom"; "41" and "50" is "All ages, in a Public/Private Separate Day School"; "60" and higher is "All ages, in a Residential School." Tuitioned out students and students in Newton's alternative education programs are included in codes "41" and higher.
**Pre-school students are not included. If Pre-school students (141) were included in this table, the total Special Education population would be 2,423 (18.8%).
October 2018Level of Service
Total Special Education**
% of Total Enrollment
*The Level of Service of "40" is defined as "All ages, in a substantially separate classroom"; "41" and "50" is "All ages, in a Public/Private Separate Day School"; "60" and higher is "All ages, in a Residential School." Tuitioned out students and students in Newton's alternative education programs are included in codes "41" and higher.
- 100 -
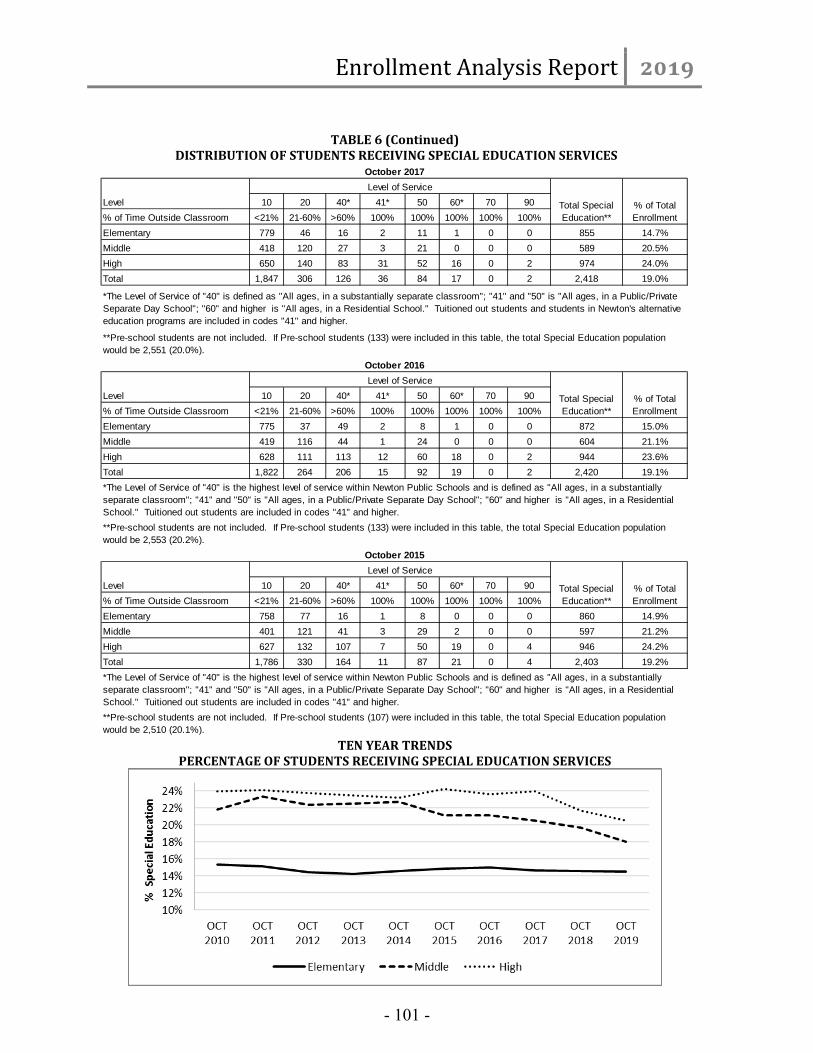
Enrollment Analysis Report 2019
TABLE 6 (Continued)
DISTRIBUTION OF STUDENTS RECEIVING SPECIAL EDUCATION SERVICES
TEN YEAR TRENDS
PERCENTAGE OF STUDENTS RECEIVING SPECIAL EDUCATION SERVICES
Level 10 20 40* 41* 50 60* 70 90% of Time Outside Classroom <21% 21-60% >60% 100% 100% 100% 100% 100%Elementary 779 46 16 2 11 1 0 0 855 14.7%Middle 418 120 27 3 21 0 0 0 589 20.5%High 650 140 83 31 52 16 0 2 974 24.0%Total 1,847 306 126 36 84 17 0 2 2,418 19.0%
Level 10 20 40* 41* 50 60* 70 90% of Time Outside Classroom <21% 21-60% >60% 100% 100% 100% 100% 100%Elementary 775 37 49 2 8 1 0 0 872 15.0%Middle 419 116 44 1 24 0 0 0 604 21.1%High 628 111 113 12 60 18 0 2 944 23.6%Total 1,822 264 206 15 92 19 0 2 2,420 19.1%
Level 10 20 40* 41* 50 60* 70 90% of Time Outside Classroom <21% 21-60% >60% 100% 100% 100% 100% 100%Elementary 758 77 16 1 8 0 0 0 860 14.9%Middle 401 121 41 3 29 2 0 0 597 21.2%High 627 132 107 7 50 19 0 4 946 24.2%Total 1,786 330 164 11 87 21 0 4 2,403 19.2%
**Pre-school students are not included. If Pre-school students (133) were included in this table, the total Special Education population would be 2,553 (20.2%).
October 2016Level of Service
Total Special Education**
% of Total Enrollment
*The Level of Service of "40" is the highest level of service within Newton Public Schools and is defined as "All ages, in a substantially separate classroom"; "41" and "50" is "All ages, in a Public/Private Separate Day School"; "60" and higher is "All ages, in a Residential School." Tuitioned out students are included in codes "41" and higher.
**Pre-school students are not included. If Pre-school students (133) were included in this table, the total Special Education population would be 2,551 (20.0%).
October 2017Level of Service
Total Special Education**
% of Total Enrollment
*The Level of Service of "40" is defined as "All ages, in a substantially separate classroom"; "41" and "50" is "All ages, in a Public/Private Separate Day School"; "60" and higher is "All ages, in a Residential School." Tuitioned out students and students in Newton's alternative education programs are included in codes "41" and higher.
**Pre-school students are not included. If Pre-school students (107) were included in this table, the total Special Education population would be 2,510 (20.1%).
October 2015Level of Service
Total Special Education**
% of Total Enrollment
*The Level of Service of "40" is the highest level of service within Newton Public Schools and is defined as "All ages, in a substantially separate classroom"; "41" and "50" is "All ages, in a Public/Private Separate Day School"; "60" and higher is "All ages, in a Residential School." Tuitioned out students are included in codes "41" and higher.
- 101 -

Enrollment Analysis Report 2019
Non-Resident Students (Table 7) The number of non-resident students attending the Newton Public Schools decreased slightly from last year and is currently 599 students.
Category 2018-19 2019-20 Difference % Change
METCO Program Students 434 424 -10 -2.3%Tuition-In Students 3 3 0 0.0%Hearing Impaired (EDCO) 13 13 0 0.0%Faculty Children 123 124 1 0.8%Approved to Attend* 14 27 13 92.9%Foreign Exchange Student 15 8 -7 -46.7%TOTAL 602 599 -3 -0.5%
TABLE 7NON-RESIDENT STUDENTS
OCTOBER 1, 2018 AND OCTOBER 1, 2019
* Students may be "Approved to Attend" for reasons including status as a homeless student or state ward, or due to another time-limited residency issue.
- 102 -
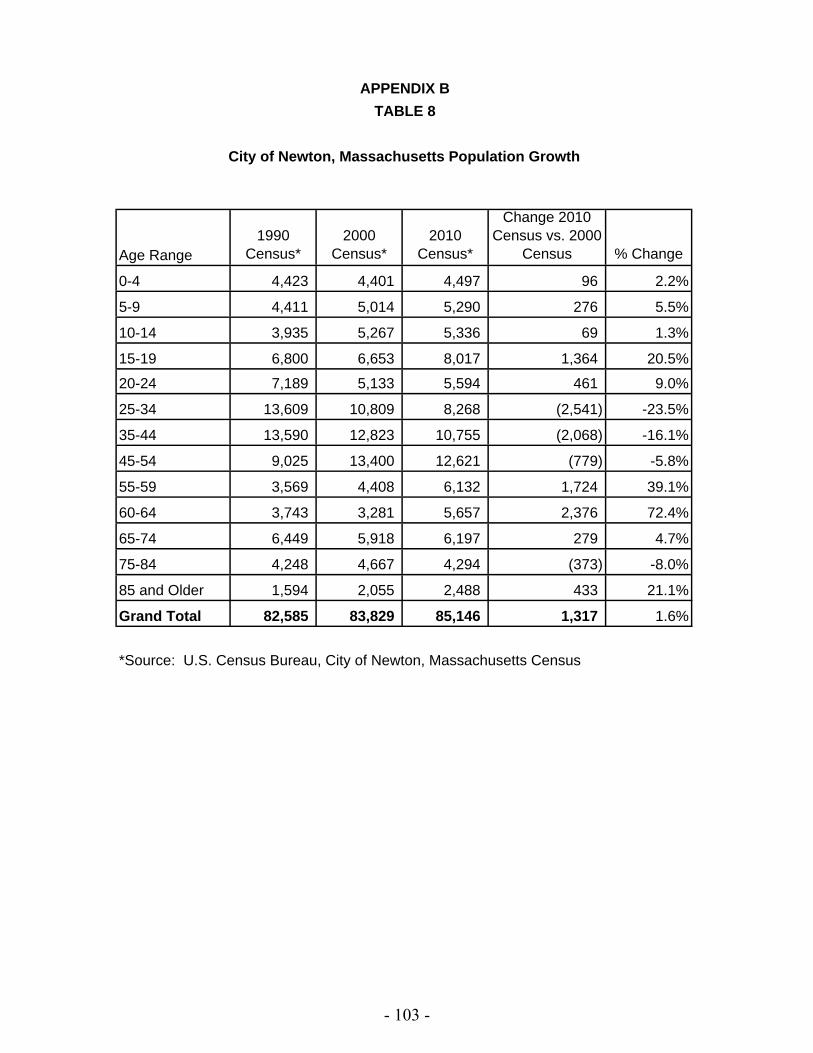
Age Range1990
Census*2000
Census*2010
Census*
Change 2010 Census vs. 2000
Census % Change
0-4 4,423 4,401 4,497 96 2.2%
5-9 4,411 5,014 5,290 276 5.5%
10-14 3,935 5,267 5,336 69 1.3%
15-19 6,800 6,653 8,017 1,364 20.5%
20-24 7,189 5,133 5,594 461 9.0%
25-34 13,609 10,809 8,268 (2,541) -23.5%
35-44 13,590 12,823 10,755 (2,068) -16.1%
45-54 9,025 13,400 12,621 (779) -5.8%
55-59 3,569 4,408 6,132 1,724 39.1%
60-64 3,743 3,281 5,657 2,376 72.4%
65-74 6,449 5,918 6,197 279 4.7%
75-84 4,248 4,667 4,294 (373) -8.0%
85 and Older 1,594 2,055 2,488 433 21.1%
Grand Total 82,585 83,829 85,146 1,317 1.6%
*Source: U.S. Census Bureau, City of Newton, Massachusetts Census
City of Newton, Massachusetts Population Growth
APPENDIX BTABLE 8
- 103 -

School District 2005 2006 2007 2008 2009 2010 2011 2012 2013 2014 2015 2016 2017 2018 2019*
Angier 64 60 71 42 50 45 68 58 70 67 78 84 86 75 46
Angier/Williams 6 7 6 6 9 7 7 7 13 8 4 5 5 4 2
Angier/Zervas 25 25 28 22 8
Bowen 172 142 142 128 144 153 134 165 76 95 62 67 91 72 38
Bowen/Mason-Rice 9 9 8 7 6 6 13 15 18 24 9 9 20 18 11
Bowen/Memorial Spaulding 64 65 54 45 48 47 34
Bowen/Ward 10 24 17 11 17 13 15
Burr 65 41 45 39 45 36 54 55 51 60 47 55 63 46 41
Burr/Williams 9 6 6 3 5 5 6 7 12 6 0 0 0 4 10
Cabot 90 76 77 68 48 81 46 91 82 80 78 67 115 92 49
Cabot/Underwood 3 2 0
Countryside 79 55 69 61 50 66 64 70 61 81 109 86 103 98 60
Countryside/Angier 49 45 59 32 39 33 31 42 35 56 0 0 0 0 0
Countryside/Bowen 13 12 11 12 14 11 10 5 12 12 13 15 12 8 3
Countryside/Zervas 2 2 1 1 1 1 1 1 2 2 0 0 0 0 0
Franklin 62 55 74 45 55 77 66 66 66 97 69 35 43 37 32
Franklin/Burr 5 7 12 8 15 9 5 15 12 17 10 21 8 17 15
Horace Mann 50 43 56 37 38 49 32 52 53 56 41 39 43 65 28
Horace Mann/Cabot 5 1 1 0 0
Horace Mann/Franklin 7 7 4 7 6 9 3 8 4 9 2 12 12 8 7
Horace Mann/Lincoln-Eliot 7 7 11 5 4 4 7 9 13 8 8 7 5 2 2
Lincoln-Eliot 69 77 69 42 43 47 49 62 66 65 59 57 66 63 44
Mason-Rice 65 56 84 69 52 52 50 67 57 71 75 38 49 50 28
Mason-Rice/Ward 15 4 12 11 6 6 4 12 11 12 11 13 17 9 6
Memorial-Spaulding 111 91 92 77 91 100 94 114 98 111 117 108 107 111 69
Memorial-Spaulding/Countryside 3 2 1 3 2 5 4 1 2 4 2 9 14 13 7
Peirce 40 54 59 43 34 39 33 49 47 38 43 45 59 50 42
Peirce/Williams 12 10 9 14 4 10 10 18 13 15 12 8 14 9 13
Underwood 72 65 54 56 56 48 55 76 73 67 76 52 58 59 32
Underwood/Ward 4 0 1 5 0 1 1 2 3 3 2 9 17 7 15
Ward 59 53 56 105 52 40 62 62 54 59 68 62 57 47 38
Williams 35 61 32 21 33 28 31 33 41 41 38 27 57 30 23
Zervas 52 39 52 47 45 45 43 52 46 57 79 79 86 88 54
Zervas/Mason-Rice 1 3 0 1 1 0 2 2 0 1 0 0 0 0 0
Totals 1,227 1,089 1,173 995 948 1,013 985 1,216 1,165 1,311 1,213 1,091 1,304 1,166 772
* Calendar Year 2019 information is from January 1 to October 4, 2019.
APPENDIX C
TABLE 9
CITY OF NEWTON
Residential Property Sales by District January 2005 to September 2019
- 104 -

AP
PEN
DIX
C -
TA
BLE
10
PR
OP
ERTI
ES L
ISTE
D F
OR
SA
LE IN
NEW
TON
, MA
. B
Y E
LEM
ENTA
RY
DIS
TRIC
T
Sch
oo
l D
istr
ict
Nu
mb
er
for
sale
2 B
.R.
3 B
.R.
4 B
.R.
5 B
.R.
6+
B.R
.1 B
.R.
2 B
.R.
3 B
.R.
4 B
.R.
5+
B.R
.S
FC
Angie
r11
24
31
182%
18%
Angie
r/Z
erv
as
71
31
11
71%
29%
Bow
en
17
21
15
61
124%
76%
Bow
en/M
em
oria
l S
pauld
ing
12
210
0%
100%
Bow
en/W
ard
41
12
100%
0%
Burr
83
30
2100%
0%
Cabot
14
17
41
186%
14%
Countr
ysid
e30
15
66
18
360%
40%
Countr
ysid
e /
Bow
en
31
11
67%
33%
Fra
nklin
51
22
60%
40%
Fra
nklin
/Burr
42
11
75%
25%
Hora
ce M
ann
41
12
50%
50%
Hora
ce M
ann/L
incoln
-Elio
t2
20%
100%
Lin
coln
-Elio
t16
23
23
631%
69%
Mason-R
ice
42
11
75%
25%
Mem
oria
l S
pauld
ing
23
22
69
21
183%
17%
Mem
oria
l S
pauld
ing/C
ountr
ysid
e4
11
11
75%
25%
Peirce
10
25
3100%
0%
Underw
ood
11
21
21
545%
55%
Ward
15
13
52
13
60%
40%
Will
iam
s10
32
12
260%
40%
Ze
rvas
10
23
11
11
170%
30%
To
tal
22
41
23
43
24
46
14
28
20
22
361%
39%
La
st Y
ea
r's P
rop
ert
y M
ix*
17
91
21
28
35
35
11
13
23
11
1
Diffe
ren
ce
45
02
15
-11
11
31
5-3
11
2
% D
iffe
ren
ce
20
%
*Last
year's p
ropert
y m
ix in
clu
ded 9
multifam
ily u
nits,
for
an o
vera
ll to
tal of
188 (
not
inclu
ded t
his
year,
as n
o m
ultifam
ily u
nits a
re f
or
sale
at
this
tim
e).
Note
: T
his
data
cam
e f
rom
MLS
Lis
tin
gs o
f re
sid
entia
l pro
pert
ies f
or
sale
in
New
ton,
MA
as o
f N
ovem
ber
2019 a
nd is s
ubje
ct
to c
hange o
n a
daily
basis
.
Only
lis
tin
gs c
lassifie
d a
s "
active"
are
in
clu
ded.
Th
ere
may b
e o
ther
pro
pert
ies f
or
sale
in
New
ton t
hat
are
not
conta
ined o
n t
his
lis
tin
g s
erv
ice.
SIN
GL
E F
AM
ILY
- S
F%
BY
TY
PE
CO
ND
O -
C
- 105 -

NESDEC's Projections vs Newton's Projections
Grades K through 12
LevelFY21
2020-21FY22
2021-22FY23
2022-23FY24
2023-24FY25
2024-25Elementary 5,513 5,471 5,405 5,383 5,349Middle 3,026 2,984 2,962 2,855 2,847High School 4,028 4,089 4,117 4,224 4,254Special Education 29 29 29 29 29Total 12,596 12,573 12,513 12,491 12,479
LevelFY21
2020-21FY22
2021-22FY23
2022-23FY24
2023-24FY25
2024-25Elementary 5,502 5,400 5,265 5,144 5,089Middle 3,027 2,987 2,961 2,847 2,825High School 4,039 4,102 4,132 4,240 4,274Special Education 29 29 29 29 29Total 12,597 12,518 12,387 12,260 12,217
LevelFY21
2020-21FY22
2021-22FY23
2022-23FY24
2023-24FY25
2024-25Elementary 11 71 140 239 260Middle -1 -3 1 8 22High School -11 -13 -15 -16 -20Special Education 0 0 0 0 0Total -1 55 126 231 262
LevelFY21
2020-21FY22
2021-22FY23
2022-23FY24
2023-24FY25
2024-25Kindergarten 837 822 813 806 794
LevelFY21
2020-21FY22
2021-22FY23
2022-23FY24
2023-24FY25
2024-25Kindergarten 843 769 760 722 784
LevelFY21
2020-21FY22
2021-22FY23
2022-23FY24
2023-24FY25
2024-25Kindergarten -6 53 53 84 10*Note: All non-resident students have been added to NESDEC's projections.
Newton's Projections
NESDEC's Projections*
Difference
APPENDIX DTABLE 11
Newton's Projections
NESDEC's Projections*
Difference
Kindergarten Only
- 106 -

AP
PE
ND
IX E
TA
BL
E 1
2
Ele
men
tary
Stu
den
ts b
y D
istr
ict
wit
h B
uff
er
Zo
nes
Octo
ber
2019
Ele
menta
ry D
istr
ict
School A
ttendin
gK
12
34
5T
ota
l
Tota
l S
tudents
in
Dis
tric
t in
clu
din
g
Out-
of-
Assig
ned
Dis
tric
t S
tudents
2019-2
0
% o
f
Dis
tric
t
2019-2
0
% o
f T
ota
l
Stu
dents
2018-1
9
Num
ber
of
Stu
dents
2017-1
8
Num
ber
of
Stu
dents
2016-1
7
Num
ber
of
Stu
dents
Bu
ffer
Zo
nes
AN
GIE
R-W
ILLIA
MS
Angie
r1
71
10
010
36%
0%
93
2
(Stu
dent A
ssig
nm
ent C
hange 2
015-1
6)
Will
iam
s2
33
25
318
64%
0%
22
23
27
(Zone B
oundary
Change)
Su
bto
tal
310
43
53
28
28
100%
1%
31
26
29
AN
GIE
R-Z
ER
VA
SA
ngie
r6
71
78
938
59%
1%
32
28
31
(Stu
dent A
ssig
nm
ent C
hange 2
015-1
6)
Zerv
as
12
61
22
326
41%
0%
18
11
9
(New
Zone)
Su
bto
tal
18
13
29
10
12
64
71
100%
1%
50
39
40
BO
WE
N-C
OU
NT
RY
SID
EB
ow
en
13
33
07
17
40%
0%
17
19
19
Countr
ysid
e4
54
26
526
60%
0%
29
29
38
Su
bto
tal
58
75
612
43
47
100%
1%
46
48
57
BO
WE
N-M
AS
ON
-RIC
EB
ow
en
99
11
59
11
54
50%
1%
60
53
38
(Zone B
oundary
Change 2
016-1
7)
Mason-R
ice
77
97
11
14
55
50%
1%
66
78
11
Su
bto
tal
16
16
20
12
20
25
109
116
100%
2%
126
131
49
BO
WE
N-M
EM
OR
IAL-S
PA
ULD
ING
Bow
en
210
45
97
37
43%
1%
47
41
48
(Expanded in 2
016-1
7)
Mem
orial-S
pauld
ing
910
810
84
49
57%
1%
45
34
6
Su
bto
tal
11
20
12
15
17
11
86
89
100%
2%
92
75
54
BO
WE
N-W
AR
DB
ow
en
11
01
51
960%
0%
15
18
21
Ward
12
21
00
640%
0%
64
3
Su
bto
tal
23
22
51
15
15
100%
0%
21
22
24
BU
RR
-FR
AN
KLIN
Burr
62
44
12
19
20%
0%
18
30
25
(Zone B
oundary
Change 2
018-1
9)
Fra
nklin
11
15
618
12
16
78
80%
1%
90
97
19
Su
bto
tal
17
17
10
22
13
18
97
104
100%
2%
108
127
44
BU
RR
-WIL
LIA
MS
Burr
01
12
13
814%
0%
(Stu
dent A
ssig
nm
ent C
hange 2
018-1
9)
Will
iam
s8
514
510
951
86%
1%
(Zone R
ein
sta
ted)
Su
bto
tal
86
15
711
12
59
61
100%
1%
CA
BO
T-H
OR
AC
E M
AN
NC
abot
10
00
10
229%
0%
25
3
(Zone B
oundary
Change 2
018-1
9)
Hora
ce M
ann
00
11
30
571%
0%
714
14
Su
bto
tal
10
11
40
77
100%
0%
919
17
CA
BO
T-U
ND
ER
WO
OD
Cabot
01
00
00
19%
0%
1
(New
Zone 2
018-1
9)
Underw
ood
20
02
24
10
91%
0%
8
Su
bto
tal
21
02
24
11
11
100%
0%
9
CO
UN
TR
YS
IDE
-ME
MO
RIA
L-S
PA
ULD
ING
Countr
ysid
e3
02
10
17
19%
0%
22
1
Mem
orial-S
pauld
ing
15
93
93
30
81%
1%
29
19
27
Su
bto
tal
45
11
49
437
38
100%
1%
31
21
28
CO
UN
TR
YS
IDE
-ZE
RV
AS
Countr
ysid
e3
26
53
524
60%
0%
22
27
29
(Stu
dent A
ssig
nm
ent C
hange 2
015-1
6)
Zerv
as
23
44
21
16
40%
0%
20
25
9
(Zone B
oundary
Change)
Su
bto
tal
55
10
95
640
43
100%
1%
42
52
38
- 107 -

AP
PE
ND
IX E
TA
BL
E 1
2
Ele
men
tary
Stu
den
ts b
y D
istr
ict
wit
h B
uff
er
Zo
nes
Octo
ber
2019
Ele
menta
ry D
istr
ict
School A
ttendin
gK
12
34
5T
ota
l
Tota
l S
tudents
in
Dis
tric
t in
clu
din
g
Out-
of-
Assig
ned
Dis
tric
t S
tudents
2019-2
0
% o
f
Dis
tric
t
2019-2
0
% o
f T
ota
l
Stu
dents
2018-1
9
Num
ber
of
Stu
dents
2017-1
8
Num
ber
of
Stu
dents
2016-1
7
Num
ber
of
Stu
dents
FR
AN
KLIN
-HO
RA
CE
MA
NN
Fra
nklin
68
513
14
14
60
57%
1%
60
102
21
(Zone B
oundary
Change 2
018-1
9)
Hora
ce M
ann
12
99
57
345
43%
1%
33
44
32
Su
bto
tal
18
17
14
18
21
17
105
105
100%
2%
93
146
53
HO
RA
CE
MA
NN
-LIN
CO
LN
-ELIO
TH
ora
ce M
ann
31
10
01
650%
0%
111
19
(Zone B
oundary
Change 2
018-1
9)
Lin
coln
-Elio
t2
01
30
06
50%
0%
220
18
Su
bto
tal
51
23
01
12
12
100%
0%
331
37
MA
SO
N-R
ICE
-WA
RD
Mason-R
ice
12
13
74
18
58%
0%
22
27
36
Ward
13
12
24
13
42%
0%
20
17
12
Su
bto
tal
25
25
98
31
33
100%
1%
42
44
48
PE
IRC
E-W
ILLIA
MS
Peirce
11
11
97
12
10
60
78%
1%
70
74
80
Will
iam
s2
25
05
317
22%
0%
15
18
19
Su
bto
tal
13
13
14
717
13
77
79
100%
1%
85
92
99
UN
DE
RW
OO
D-W
AR
DU
nderw
ood
77
62
24
28
68%
1%
30
30
4
(Expanded in 2
016-1
7)
Ward
11
14
24
13
32%
0%
17
16
0
Su
bto
tal
88
76
48
41
44
100%
1%
47
46
4
To
tal B
uff
er
Zo
nes
138
148
133
130
158
155
862
903
100%
16%
835
919
621
Reg
ula
r D
istr
icts
AN
GIE
RA
ngie
r58
61
59
78
62
69
387
405
9%
7%
383
354
310
BO
WE
NB
ow
en
38
34
48
43
32
33
228
238
6%
4%
223
242
220
BU
RR
Burr
54
50
65
36
51
59
315
339
8%
6%
329
323
332
CA
BO
TC
abot
57
55
49
51
57
60
329
379
8%
6%
330
337
364
CO
UN
TR
YS
IDE
Countr
ysid
e39
56
49
58
48
59
309
337
8%
6%
302
293
294
FR
AN
KLIN
Fra
nklin
46
33
43
35
26
38
221
241
5%
4%
211
214
378
HO
RA
CE
MA
NN
Hora
ce M
ann
38
46
35
54
48
47
268
328
7%
5%
261
301
310
LIN
CO
LN
-ELIO
TLin
coln
-Elio
t49
61
58
48
40
51
307
342
7%
6%
304
317
298
MA
SO
N-R
ICE
Mason-R
ice
47
42
50
55
57
47
298
304
7%
6%
310
305
344
ME
MO
RIA
L-S
PA
ULD
ING
Mem
orial-S
pauld
ing
36
46
59
64
67
82
354
364
9%
7%
361
370
390
PE
IRC
EP
eirce
26
36
32
26
27
35
182
212
4%
3%
164
169
180
UN
DE
RW
OO
DU
nderw
ood
31
31
26
38
33
49
208
216
5%
4%
223
221
268
WA
RD
Ward
27
32
28
35
41
42
205
209
5%
4%
236
257
271
WIL
LIA
MS
Will
iam
s26
29
20
30
27
18
150
161
4%
3%
216
212
203
ZE
RV
AS
Zerv
as
58
57
49
64
48
58
334
401
8%
6%
327
308
272
To
tal R
eg
ula
r D
istr
icts
630
669
670
715
664
747
4,0
95
4,4
76
100%
76%
4,1
80
4,2
23
4,4
34
Ou
t-o
f-A
ssig
ned
Dis
tric
t S
tud
en
ts32
47
70
79
86
108
422
8%
502
401
480
To
tal S
tud
en
ts800
864
873
924
908
1,0
10
5,3
79
5,3
79
100%
5,5
17
5,5
43
5,5
35
NO
TE
S:
1.)
The fig
ure
s in this
table
are
based o
n p
relim
inary
enro
llments
and a
re d
erived fro
m r
esid
ent stu
dents
only
.
2.)
The fig
ure
s in this
table
do n
ot in
clu
de s
tudents
attendin
g p
rivate
schools
.
- 108 -

Sch
ool:
Feed
s In
to:
2019
2020
2021
2022
2023
2024
2019
2020
2021
2022
2023
2024
Linc
oln-
Elio
tB
igel
ow36
235
935
634
833
431
8U
nder
woo
dB
igel
ow26
924
824
724
124
224
0W
ard
Big
elow
255
239
228
218
221
216
Bur
rD
ay36
635
535
837
136
136
3C
abot
Day
393
407
423
448
466
475
Fran
klin
Day
413
391
390
365
357
355
Hor
ace
Man
nD
ay39
138
937
836
836
936
5P
eirc
eD
ay28
428
129
029
830
230
1
Ang
ier
Bro
wn
502
490
498
488
493
482
Cou
ntry
side
Bro
wn
413
393
387
375
379
382
Mas
on-R
ice
Bro
wn
8985
8077
7777
357
340
320
310
306
307
Will
iam
sB
row
n26
126
524
924
923
923
7B
owen
Oak
Hill
372
371
361
356
346
342
Mem
oria
l-Spa
uldi
ngO
ak H
ill46
544
242
139
937
536
6Ze
rvas
Oak
Hill
434
458
485
494
516
523
Tota
l Ele
men
tary
2,82
22,
754
2,75
02,
734
2,72
92,
710
2,80
42,
759
2,72
12,
671
2,65
42,
639
Big
elow
Nor
th49
452
449
549
245
346
2D
ayN
orth
999
999
968
934
893
890
Bro
wn
Nor
th (4
%);
Sou
th (9
6%)
101
108
107
108
104
102
677
721
719
723
694
683
Oak
Hill
Sou
th63
267
469
570
571
171
0
Tota
l Mid
dle
Scho
ol1,
594
1,63
11,
570
1,53
41,
450
1,45
41,
309
1,39
51,
414
1,42
81,
405
1,39
3
New
ton
Nor
th2,
099
2,10
62,
153
2,14
32,
194
2,14
0N
ewto
n S
outh
1,98
31,
951
1,96
52,
003
2,05
92,
143
Tota
l All
Gra
de L
evel
s6,
515
6,49
16,
473
6,41
16,
373
6,30
46,
096
6,10
56,
100
6,10
26,
118
6,17
5C
hang
e fro
m P
rior Y
ear
-24
-18
-62
-38
-69
9-5
216
57%
Cha
nge
-0.4
%-0
.3%
-1.0
%-0
.6%
-1.1
%0.
1%-0
.1%
0.0%
0.3%
0.9%
Diff
eren
ce b
etw
een
Nor
th a
nd S
outh
116
155
188
140
135
-3
New
ton
Sout
h Fe
edin
g Sc
hool
sN
ewto
n N
orth
Fee
ding
Sch
ools
APPE
ND
IX E
TAB
LE 1
3
Tota
l Enr
ollm
ent b
y H
igh
Scho
ol F
eede
r Pat
tern
s
- 109 -

ANGIER
WARD
BURR
CABOT
PEIRCE
ZERVAS
MEMORIAL-SPAULDING
WILLIAMS
BOWEN
COUNTRYSIDE
FRANKLIN
UNDERWOOD
HORACE MANN
MASON-RICE
LINCOLN-ELIOT
BEACON ST
WAL
NU
T S
T
CENTRE ST
COMMONWEALTH AVE
BOYLSTON ST
CH
EST
NU
T ST
DEDHAM ST
GR
OVE
ST
WAS
HIN
GTO
N S
T
WARD ST
PAR
KER
ST
WATERTOWN ST
AUBURN ST
LOW
ELL
AVE
DUDLEY RD
WIN
CH
ESTE
R S
T
MILL ST
HOMER ST
ELLIO
T ST
CABOT STAUSTIN STC
HE
RR
Y ST
QUINOBEQUIN RD
HAMMOND ST
LANG
LEY RD
ADAMS ST
DERBY ST
WAV
ERLE
Y AV
E
NAHANTON ST
CALIFORNIA ST
BROOKLINE ST
WOODWARD ST
PEARL ST
LEXI
NG
TON
ST
NEED
HAM
ST
NEWTONVILLE AVE
WAL
THAM
ST
GR
ANT
AVE
SPIE
RS RD
VINE ST
WIS
WAL
L RD
CONCORD ST
ALBEMARLE RD
NORTH ST
NONANTUM RD
AUBURNDALE AVE
HAMMOND POND PKW
Y
GREENWOOD S
T
VALENTINE ST
KENRICK ST
OAK ST
TREMONT ST
LINCOLN ST
JAC
KSO
N R
D
SARGENT ST
RT 9 RAMPFLORENCE ST
CRAFTS ST
LAGRANGE S
T
RIVER ST
SAW M
ILL B
ROOK PKW
Y
COLL
EGE
RD
CYPRESS ST
LYMAN ST
ST J
AMES
ST
WALN
UT S
T
Elementary School Districts
0.5 0 0.5 1 1.5 20.25 MilesCITY OF NEWTON, MASSACHUSETTSMayor - Ruthanne Fuller
City of Newton, Massachusetts
Map Date: December 10, 2019
LegendElementary Schools
ANGIER
BOWEN
BURR
CABOT
COUNTRYSIDE
FRANKLIN
HORACE MANN
LINCOLN-ELIOT
MASON-RICE
MEMORIAL-SPAULDING
PEIRCE
UNDERWOOD
WARD
WILLIAMS
ZERVAS
Elementary School Buffer Zones
Appendix E - Exhibit 14
(Map 1 of 3)
- 110 -

DAY
OAK HILL
BROWN
BIGELOW
NONANTUM RDDERBY ST
GRO
VE S
T
LANGLEY RD
CRAFTS ST
WARD ST
TREMONT ST
WIN
CH
ESTER ST
CH
ESTN
UT
ST
WOODWARD ST
SAW MILL
BROOK PKWY
VALENTINE ST
PEARL ST
RIVER ST
WAS
HING
TON
ST
HAM
MO
ND
PON
D
PKWY
CONCORD ST
FLORENCE ST
ELLIOT
ST
CH
ERR
Y ST
HAMMOND ST
GRANT A
VE
CEN
TRE
ST
VAN
ROOSEN RD
LYMAN ST
RT 9RAMP
DEDHAM ST
CYPR
ESS
ST
OAK ST
QUINOBEQUIN RD
RT 9RAMP
BROOKLINE ST
AUBURNDALE AVE
ADAMS ST
CEN
TRE
ST
CENTRAL
ST
RT 9RAMP
GREENWOOD S
T
COMMONWEALTH
AVE
CABOT ST
WALTHAM
ST
RT 9 RAMP
WASHINGTON ST
SARGENTST
CEN
TRE
ST
WAV
ERLE
Y AV
E
LINCOLN ST
CENTRE
AVE
HAMM
OND POND PKW
Y
PARK S
T
NEED
HAM
ST
PAR
KER
ST
HOMER ST
SAR
GE
NT
ST
BOYLSTON ST
LEXIN
GTON ST JAC
KS
ON
RD
COMMONWEALTH AVE
ELLIOT ST
COMMONWEALTH
AVE
WAL
THAM
ST
AUBURN ST
SPIE
RS RD
ALBEMARLE RD
WALN
UT ST
VINE ST
CALIFORNIA ST
HIGHLAND
ST
DEDHAM ST
MILL ST
CENTRESTWASHINGTON ST
WIS
WAL
L RD
BOYLSTON STRT 9RAMP
ST J
AMES
ST
KENRICK ST
WATERTOWN ST
ALBE
MAR
LE R
D
DU
DLE
Y R
D
PAR
K ST
NEWTONVILLE AVE
LOW
ELL
AV
E
LAGRAN
GE ST
WAL
NU
T S
T
SUM
NE
RST
CO
LLEG
E R
D
RT 9RAMP
BOYLSTON ST
NO
RTH
ST
WILLO
W
ST
BEACON ST
NAHANTON ST
AUSTIN ST
DayMiddleSchool
BigelowMiddleSchool
Oak HillMiddleSchool
BrownMiddleSchool
Middle School Districts
0.5 0 0.5 1 1.5 20.25 MilesCITY OF NEWTON, MASSACHUSETTSMayor - Ruthanne Fuller
City of Newton, Massachusetts
Map Date: December 10, 2019
Legend
Middle Schools
BIGELOW
BROWN
DAY
OAK HILL
Middle School Buffer Areas
Appendix E - Exhibit 14
(Map 2 of 3)
- 111 -
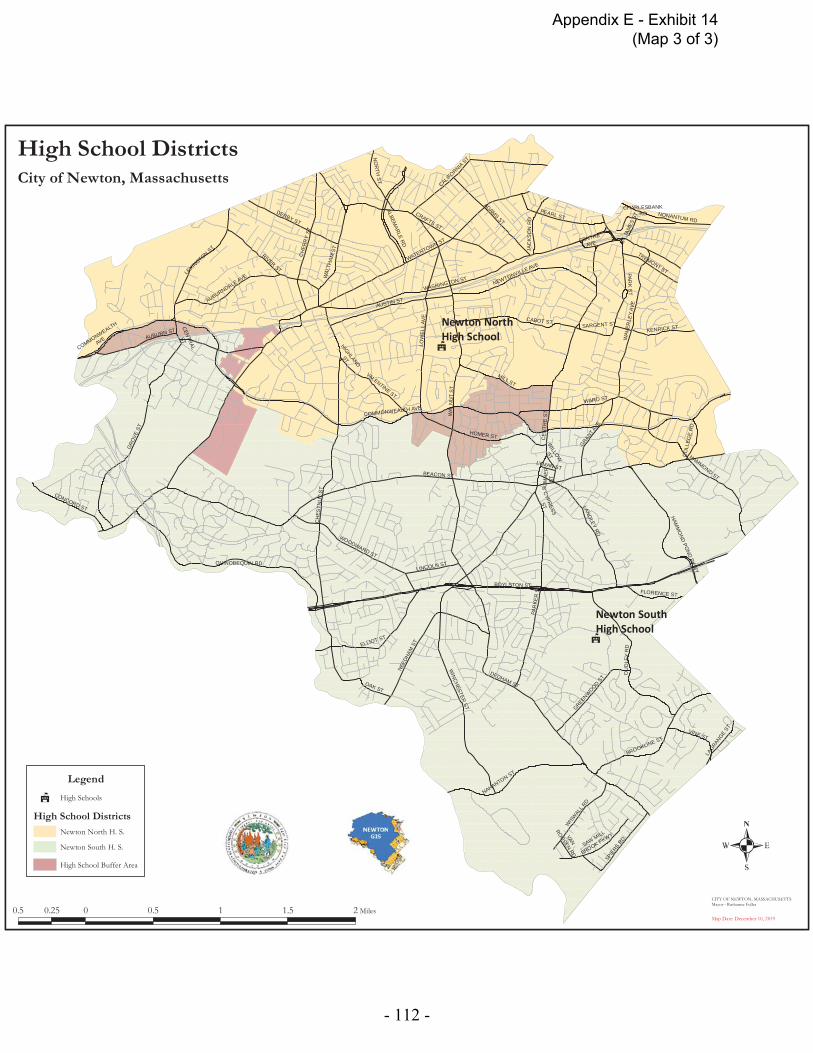
NONANTUM RDDERBY ST
GRO
VE S
T
LANGLEY RD
CRAFTS ST
WARD ST
TREMONT ST
WIN
CH
ESTER ST
CH
ESTN
UT
ST
WOODWARD ST
SAW MILL
BROOK PKWY
VALENTINE ST
PEARL ST
RIVER ST
CONCORD ST
FLORENCE ST
CH
ERR
Y ST
HAMMOND ST
GRANT A
VE
VAN
ROOSEN RD
LYMAN ST
PAR
KER
ST
CYPR
ESS
ST
OAK ST
QUINOBEQUIN RD
BROOKLINE ST
AUBURNDALE AVE
ADAMS ST
CENTRAL
ST
GREENWOOD S
T
COMMONWEALTH
AVE
CABOT ST
WASHINGTON ST
SARGENT ST
CEN
TRE
ST
WAV
ERLE
Y AV
E
LINCOLN ST
CENTRE
AVE
HAMM
OND PO
ND PKWY
PARK S
T
NEED
HAM
ST
HOMER ST
LEXIN
GTON ST JAC
KS
ON
RD
COMMONWEALTH AVE
ELLIOT ST
WAL
THAM
ST
AUBURN ST
SPIE
RS RD
ALBEMARLE RD
VINE ST
CALIFORNIA ST
CHARLESBANKRD
HIGHLAND
ST
DEDHAM ST
MILL ST
WIS
WAL
L RD
BOYLSTON ST
ST J
AMES
ST
KENRICK ST
WATERTOWN ST
DU
DLE
Y R
D
NEWTONVILLE AVE
LOW
ELL
AV
E
LAGRAN
GE ST
WAL
NU
T S
T
SUM
NE
RST
CO
LLEG
E R
D
NO
RTH
ST
WILLO
W
ST
BEACON ST
NAHANTON ST
AUSTIN ST
Newton SouthHigh School
Newton NorthHigh School
High School Districts
0.5 0 0.5 1 1.5 20.25 Miles
CITY OF NEWTON, MASSACHUSETTSMayor - Ruthanne Fuller
City of Newton, Massachusetts
Map Date: December 10, 2019
Legend
High Schools
High School Districts
Newton North H. S.
Newton South H. S.
High School Buffer Area
Appendix E - Exhibit 14
(Map 3 of 3)
- 112 -

Enrollment Analysis Report 2019
Proposed Residential Development Projections
Frequently Asked Questions
1. Why do we need to know how many students may reside in proposed residential developments in future years?
Enrollment projections for proposed residential developments are useful for decision-making and planning, especially in light of proposed residential development growth in Newton. Carefully crafted, presented and interpreted projections are a key first step in the planning process. The district is then able to plan the budgets, including capital improvements, classroom space requirements, sufficient teacher workforce and staffing, instructional materials, and transportation, among other things. Accurate projections alert the district to changes in school population to allow for needed adjustments.
2. How complex are the projection methods?
Similar to our enrollment projection procedures, our proposed residential development projections are somewhat complex, but, like most statistical methods, they can be explained and replicated. Our methodology is explained in more detail later in this section. All projections in this analysis, including the proposed residential development projections, are based on underlying assumptions that use historical school enrollment to capture trends and patterns specific to Newton.
3. Which proposed residential developments are included?
Historically, we have only included permitted residential developments in our projections; developments that were not permitted were not included, as it is possible that the permit process may encounter challenges. We have always consulted with the Planning Department at the City of Newton to discuss all permitted and potential residential developments to ensure we are including the most updated information in projections. Beginning in 2019, we are including all residential developments that have received a special permit or a building permit in our projections.
4. What methodology is utilized in Newton?
Student generation ratios (or SGRs) are utilized in Newton to project the number of students that will reside in a proposed residential development. An SGR is a ratio that estimates the number of students arising from one unit within a development. SGRs can be utilized to estimate the number of students in different ways; for example, an average development SGR can estimate the number of students from an entire development, or a specific unit-type SGR can estimate the number of students from a particular unit-type (i.e., an SGR for one bedroom units can estimate the number of students that will reside in one bedroom units in a development).
Prior to November 2018, we utilized the SGRs by unit type that occurred historically at the three largest residential developments in Newton at that time (Avalon Newton Highlands, Avalon at Chestnut Hill, and Arborpoint at Woodland Station). In November
- 113 -

Enrollment Analysis Report 2019
2018, we utilized a new interim methodology due to the increase in proposed residential developments in Newton. This interim methodology was evaluated in 2019 and revised for this report, as described below.
Our current methodology utilizes three different methods of estimating SGRs for proposed residential developments, and then averages the student estimates from these three methods for our final student estimate. We use three different methods of estimating SGRs because each method has benefits and potential issues; the inclusion of the three methods helps mitigate the potential issues associated with each method. It is important to note that these are estimates, in the same way that our enrollment projections are estimates. Many factors go into a family’s decision to reside in a development in Newton; however, the estimates that we are providing in this analysis incorporate Newton’s history of enrollment from residential developments. The three different methods are described below.
Method 1: This method is similar to the method utilized prior to November 2018. Method 1 uses the average SGR by unit type observed at the three large developments to date in Newton (Avalon Newton Highlands, Avalon at Chestnut Hill, and Arborpoint at Woodland Station). These average SGRs by unit type are multiplied by the number of units for that unit type in the proposed development to estimate the number of students who will reside in those units. For example, the average SGR for market rate 2 bedrooms at the three large developments (0.214) is multiplied by the number of market rate 2 bedrooms in the proposed development; this yields the estimate for the number of students who will reside in market rate 2 bedrooms in that development. The benefit of this method is that it provides differentiated SGRs by market rate and affordable units. A potential issue with this method is that it only utilizes the history of three large developments in Newton. The average SGR by unit type used in method 1 is displayed below (the average of the 3 largest is utilized for method 1; the SGRs for each individual development included in this average are included for reference).
Method 2: This method utilizes data from all occupied apartment buildings in Newton with fifteen or more units that are classified as apartments or mixed use by the Newton Assessor’s Office (buildings classified as tax exempt or congregate housing are not included). Apartments or mixed use buildings that have had very few students residing in them in the past five years are also not included (we exclude existing buildings with an actual average five-year SGR of less than 0.1 in our calculations for method 2, although they are displayed in Tables 15 and 16 for reference). The average number of students residing in the buildings that meet these criteria over the past five years is utilized to estimate an overall development SGR for proposed developments. To do this, the actual SGR for each occupied building (using five-year averages of both public school students and private school students who reside in the building and the number of units in the building) and the average number of bedrooms for each occupied
Studio 1BR-M 2BR-M 3BR-M Stu-A 1BR-A 2BR-A 3BR-AAvg. 3 Largest 0.000 0.000 0.214 0.800 0.000 0.000 1.018 2.792Avalon NH 0.000 0.000 0.192 0.740 0.000 0.000 0.914 2.579Avalon CH 0.000 0.000 0.193 0.731 0.000 0.000 0.922 2.548Arborpoint 0.000 0.000 0.258 0.929 0.000 0.000 1.219 3.250
SGR by BedroomDifferentiated by Market and Affordable Rate Units
- 114 -

Enrollment Analysis Report 2019
building is calculated. We average these actual SGRs and the average number of bedrooms for all occupied buildings. Then, we calculate the average SGR per 1 bedroom for all occupied buildings (this is the average SGR for all occupied buildings divided by the average number of bedrooms for all occupied buildings); we call this result the multiplier. For new residential developments, we then multiply the average number of bedrooms for the new development by the multiplier. This yields an estimated overall SGR for the new residential development based on prior experience in Newton’s apartment buildings. This estimated SGR is then multiplied by number of each unit type to estimate the number of students who will reside in those units. The benefit of this method is that it incorporates the history of all existing buildings in Newton that meet our criteria. It can also be used when the distribution of bedroom types for a development is not yet known. A potential issue with this method is that it does not differentiate by unit type (bedroom count or market rate versus affordable). The average number of bedrooms, average SGR, and the multiplier utilized for method 2 in the 2019 calculations are displayed below.
Please note that the unit mix by market rate and affordable is not available for all existing buildings. For buildings where this breakdown is not available, all units are assumed to be market rate.
Method 3: This method utilizes the estimated overall SGR for a proposed development from method 2 and weights it by unit type (based on bedroom count). The weights that are used come from an external consultant’s analysis of the American Community Survey PUMS data (Public Use Microdata Sample) in Newton. The PUMS data provides information about individuals and housing types in Newton; the weights indicate the patterns of students residing in different unit types in Newton. These weights indicate that a larger portion of students reside in 2 bedroom units as compared to studios, 1 bedroom, or 3 or more bedrooms. The weighted estimated SGR by unit type (based on bedroom count) is then multiplied by the number of each unit type in the development to estimate the number of students who will reside in those units. The benefit of this method is that it incorporates the history of all existing buildings in Newton that meet our criteria and it differentiates by the unit type (based on bedroom count). A potential issue with this method is that it does not differentiate between market rate and affordable units. The weights that are utilized in method 3 are displayed below.
Average # of bedrooms 1.6656Average SGR 0.3118Multiplier 0.1872
All Occupied buildings
Building size Studio 1BR-M 2BR-M 3BR-M Stu-A 1BR-A 2BR-A 3BR-A5-9 Units 25% 16% 180% 138% 25% 16% 180% 138%10-19 Units 23% 16% 192% 116% 23% 16% 192% 116%20+ Units 29% 17% 203% 90% 29% 17% 203% 90%
Weighting by Unit Type (based on PUMS data)
- 115 -
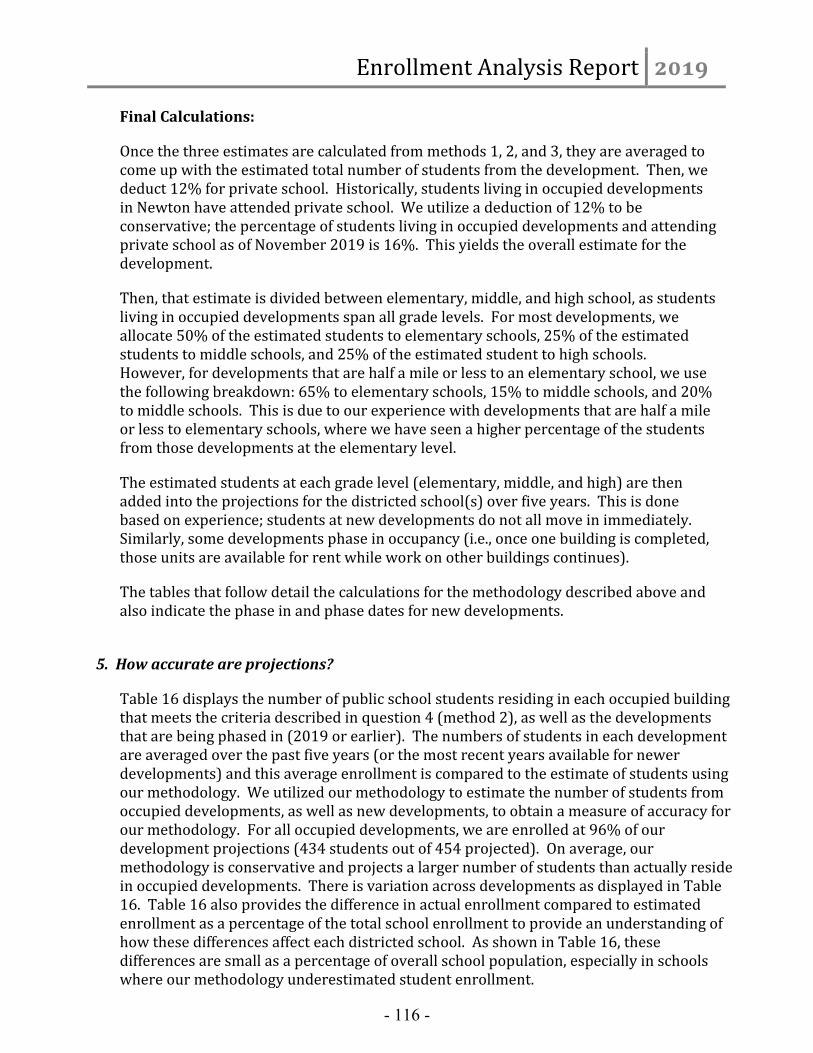
Enrollment Analysis Report 2019
Final Calculations:
Once the three estimates are calculated from methods 1, 2, and 3, they are averaged to come up with the estimated total number of students from the development. Then, we deduct 12% for private school. Historically, students living in occupied developments in Newton have attended private school. We utilize a deduction of 12% to be conservative; the percentage of students living in occupied developments and attending private school as of November 2019 is 16%. This yields the overall estimate for the development.
Then, that estimate is divided between elementary, middle, and high school, as students living in occupied developments span all grade levels. For most developments, we allocate 50% of the estimated students to elementary schools, 25% of the estimated students to middle schools, and 25% of the estimated student to high schools. However, for developments that are half a mile or less to an elementary school, we use the following breakdown: 65% to elementary schools, 15% to middle schools, and 20% to middle schools. This is due to our experience with developments that are half a mile or less to elementary schools, where we have seen a higher percentage of the students from those developments at the elementary level.
The estimated students at each grade level (elementary, middle, and high) are then added into the projections for the districted school(s) over five years. This is done based on experience; students at new developments do not all move in immediately. Similarly, some developments phase in occupancy (i.e., once one building is completed, those units are available for rent while work on other buildings continues).
The tables that follow detail the calculations for the methodology described above and also indicate the phase in and phase dates for new developments.
5. How accurate are projections?
Table 16 displays the number of public school students residing in each occupied building that meets the criteria described in question 4 (method 2), as well as the developments that are being phased in (2019 or earlier). The numbers of students in each development are averaged over the past five years (or the most recent years available for newer developments) and this average enrollment is compared to the estimate of students using our methodology. We utilized our methodology to estimate the number of students from occupied developments, as well as new developments, to obtain a measure of accuracy for our methodology. For all occupied developments, we are enrolled at 96% of our development projections (434 students out of 454 projected). On average, our methodology is conservative and projects a larger number of students than actually reside in occupied developments. There is variation across developments as displayed in Table 16. Table 16 also provides the difference in actual enrollment compared to estimated enrollment as a percentage of the total school enrollment to provide an understanding of how these differences affect each districted school. As shown in Table 16, these differences are small as a percentage of overall school population, especially in schools where our methodology underestimated student enrollment.
- 116 -

Enrollment Analysis Report 2019
6. How often are the projections revised?
As mentioned previously, these projections are estimates and should be interpreted as such. Our methodology utilizes our past history with residential developments in the same way that our overall enrollment methodology utilizes our past history. Because we utilize our past history to make these estimates, we revise our projections for residential development enrollment yearly as new enrollment information becomes available. This allows us to capture shifts in trends of families residing in these developments; if we did not revise our projections, any changes in the way in which families are choosing to reside in residential developments would not be captured in our estimates. Because we use each new year of history in our estimates, the projections shift from year to year as well. This allows us to utilize the most current information for planning purposes in the same way that we use the most current information for planning purposes in overall enrollment projections.
- 117 -

APPE
ND
IX F
- Ta
ble
15Es
timat
ed E
nrol
lmen
t of
Exi
stin
g an
d Pr
opos
edR
esid
entia
l Dev
elop
men
t
NO
V-20
19
~Bui
ldin
g is
om
itted
from
cal
cula
tions
in M
etho
d 2
due
to lo
w a
ctua
l SG
R.
Oct
-19
Proj
ect S
tatu
sS
tudi
o1B
R-M
2BR
-M3B
R-M
St-A
1BR
-A2B
R-A
3BR
-AAv
g SG
R
(NPS
)%
Af
ford
able
Avg
# BR
s
Abl
emar
le G
arde
ns~
1980
Occ
upie
dN
/A#
Uni
ts0
240
00
00
024
# S
tude
nts
Pro
ject
ed M
etho
d 1
00
00
00
00
0#
Stu
dent
s P
roje
cted
Met
hod
20
40
00
00
04
# S
tude
nts
Pro
ject
ed M
etho
d 3
01
00
00
00
1To
tal #
Stu
dent
s - A
vera
ge o
f 3 M
etho
ds0
20
00
00
02
Less
: P
rivat
e S
choo
l (12
%)
00
00
00
00
0To
tal i
mpa
ct o
n di
stric
ted
scho
ols
02
00
00
00
2
175
Ada
ms
Stre
et19
76O
ccup
ied
N/A
# U
nits
122
80
00
00
31#
Stu
dent
s P
roje
cted
Met
hod
10
02
00
00
02
# S
tude
nts
Pro
ject
ed M
etho
d 2
05
20
00
00
7#
Stu
dent
s P
roje
cted
Met
hod
30
14
00
00
05
Tota
l # S
tude
nts
- Ave
rage
of 3
Met
hods
02
20
00
00
4Le
ss:
Priv
ate
Sch
ool (
12%
)0
00
00
00
00
Tota
l im
pact
on
dist
ricte
d sc
hool
s0
22
00
00
04
Ava
lon
at N
ewto
n H
ighl
ands
20
00O
ccup
ied
N/A
# U
nits
072
104
450
2434
1529
4#
Stu
dent
s P
roje
cted
Met
hod
10
022
360
035
4213
5#
Stu
dent
s P
roje
cted
Met
hod
20
2537
160
812
510
3#
Stu
dent
s P
roje
cted
Met
hod
30
474
140
124
512
2To
tal #
Stu
dent
s - A
vera
ge o
f 3 M
etho
ds0
1044
220
324
1712
0Le
ss:
Priv
ate
Sch
ool (
12%
)0
-1-5
-30
0-3
-2-1
4To
tal i
mpa
ct o
n di
stric
ted
scho
ols
09
3919
03
2115
106
Ava
lon
at C
hest
nut H
ill20
02O
ccup
ied
N/A
# U
nits
527
9337
08
259
204
# S
tude
nts
Pro
ject
ed M
etho
d 1
00
2030
00
2525
100
# S
tude
nts
Pro
ject
ed M
etho
d 2
210
3514
03
93
76#
Stu
dent
s P
roje
cted
Met
hod
31
271
120
119
310
9To
tal #
Stu
dent
s - A
vera
ge o
f 3 M
etho
ds1
442
190
118
1095
Less
: P
rivat
e S
choo
l (12
%)
00
-5-2
00
-2-1
-10
Tota
l im
pact
on
dist
ricte
d sc
hool
s1
437
170
116
985
Arb
orpo
int W
oodl
and
Stat
ion
2004
Occ
upie
dN
/A#
Uni
ts0
6077
70
1519
218
0#
Stu
dent
s P
roje
cted
Met
hod
10
017
60
019
648
# S
tude
nts
Pro
ject
ed M
etho
d 2
018
242
05
61
56#
Stu
dent
s P
roje
cted
Met
hod
30
348
20
112
167
Tota
l # S
tude
nts
- Ave
rage
of 3
Met
hods
07
303
02
123
57Le
ss:
Priv
ate
Sch
ool (
12%
)0
-1-4
00
0-1
0-6
Tota
l im
pact
on
dist
ricte
d sc
hool
s0
626
30
211
351
0.36
021
%2.
00
0.27
220
%1.
63
106
102
-4
8573
-12
5149
-2
1.23
4
Dev
elop
men
t Nam
e (U
nits
≥15
)
Firs
t Ye
ar/
Year
B
uilt
Fully
Ph
ased
In
Tota
l #
Add
ed to
Pr
ojec
tions
# U
nits
by
Type
Tota
l
0.34
725
%1.
88
Tota
l Es
timat
ed
NPS
St
uden
ts
Actu
al A
vg #
N
PS
Stud
ents
Actu
al to
Es
timat
ed
Diff
eren
ce
Stat
istic
s
0.19
40%
0.00
00%
1.00
20
-2
62
- 118 -

APPE
ND
IX F
- Ta
ble
15Es
timat
ed E
nrol
lmen
t of
Exi
stin
g an
d Pr
opos
edR
esid
entia
l Dev
elop
men
t
NO
V-20
19
~Bui
ldin
g is
om
itted
from
cal
cula
tions
in M
etho
d 2
due
to lo
w a
ctua
l SG
R.
Oct
-19
Proj
ect S
tatu
sS
tudi
o1B
R-M
2BR
-M3B
R-M
St-A
1BR
-A2B
R-A
3BR
-AAv
g SG
R
(NPS
)%
Af
ford
able
Avg
# BR
sD
evel
opm
ent N
ame
(Uni
ts ≥
15)
Firs
t Ye
ar/
Year
B
uilt
Fully
Ph
ased
In
Tota
l #
Add
ed to
Pr
ojec
tions
# U
nits
by
Type
Tota
lTo
tal
Estim
ated
N
PS
Stud
ents
Actu
al A
vg #
N
PS
Stud
ents
Actu
al to
Es
timat
ed
Diff
eren
ce
Stat
istic
s
77 B
eaco
nwoo
d R
oad~
1986
Occ
upie
dN
/A#
Uni
ts0
183
00
00
021
# S
tude
nts
Pro
ject
ed M
etho
d 1
00
10
00
00
1#
Stu
dent
s P
roje
cted
Met
hod
20
41
00
00
05
# S
tude
nts
Pro
ject
ed M
etho
d 3
01
10
00
00
2To
tal #
Stu
dent
s - A
vera
ge o
f 3 M
etho
ds0
21
00
00
03
Less
: P
rivat
e S
choo
l (12
%)
00
00
00
00
0To
tal i
mpa
ct o
n di
stric
ted
scho
ols
02
10
00
00
3
457
Cen
tre
Stre
et~
1958
Occ
upie
dN
/A#
Uni
ts2
185
00
00
025
# S
tude
nts
Pro
ject
ed M
etho
d 1
00
10
00
00
1#
Stu
dent
s P
roje
cted
Met
hod
20
41
00
00
05
# S
tude
nts
Pro
ject
ed M
etho
d 3
01
20
00
00
3To
tal #
Stu
dent
s - A
vera
ge o
f 3 M
etho
ds0
11
00
00
02
Less
: P
rivat
e S
choo
l (12
%)
00
00
00
00
0To
tal i
mpa
ct o
n di
stric
ted
scho
ols
01
10
00
00
2
5 C
harle
sban
k R
oad
1948
Occ
upie
dN
/A#
Uni
ts0
118
00
00
019
# S
tude
nts
Pro
ject
ed M
etho
d 1
00
40
00
00
4#
Stu
dent
s P
roje
cted
Met
hod
20
07
00
00
07
# S
tude
nts
Pro
ject
ed M
etho
d 3
00
130
00
00
13To
tal #
Stu
dent
s - A
vera
ge o
f 3 M
etho
ds0
08
00
00
08
Less
: P
rivat
e S
choo
l (12
%)
00
-10
00
00
-1To
tal i
mpa
ct o
n di
stric
ted
scho
ols
00
70
00
00
7
The
Che
stnu
t Hill
Apa
rtm
ents
~18
80O
ccup
ied
N/A
# U
nits
322
31
00
00
29#
Stu
dent
s P
roje
cted
Met
hod
10
01
10
00
02
# S
tude
nts
Pro
ject
ed M
etho
d 2
14
10
00
00
6#
Stu
dent
s P
roje
cted
Met
hod
30
11
00
00
02
Tota
l # S
tude
nts
- Ave
rage
of 3
Met
hods
02
10
00
00
3Le
ss:
Priv
ate
Sch
ool (
12%
)0
00
00
00
00
Tota
l im
pact
on
dist
ricte
d sc
hool
s0
21
00
00
03
2300
Com
mon
wea
lth19
75O
ccup
ied
N/A
# U
nits
06
480
00
00
54#
Stu
dent
s P
roje
cted
Met
hod
10
010
00
00
010
# S
tude
nts
Pro
ject
ed M
etho
d 2
02
170
00
00
19#
Stu
dent
s P
roje
cted
Met
hod
30
034
00
00
034
Tota
l # S
tude
nts
- Ave
rage
of 3
Met
hods
01
200
00
00
21Le
ss:
Priv
ate
Sch
ool (
12%
)0
0-2
00
00
0-2
Tota
l im
pact
on
dist
ricte
d sc
hool
s0
118
00
00
019
1-1
0.04
00%
1.12
2
0.61
10%
1.89
1933
14
0.00
00%
1.14
30
-3
0.00
00%
1.07
30
-3
0.42
10%
1.95
78
1
- 119 -

APPE
ND
IX F
- Ta
ble
15Es
timat
ed E
nrol
lmen
t of
Exi
stin
g an
d Pr
opos
edR
esid
entia
l Dev
elop
men
t
NO
V-20
19
~Bui
ldin
g is
om
itted
from
cal
cula
tions
in M
etho
d 2
due
to lo
w a
ctua
l SG
R.
Oct
-19
Proj
ect S
tatu
sS
tudi
o1B
R-M
2BR
-M3B
R-M
St-A
1BR
-A2B
R-A
3BR
-AAv
g SG
R
(NPS
)%
Af
ford
able
Avg
# BR
sD
evel
opm
ent N
ame
(Uni
ts ≥
15)
Firs
t Ye
ar/
Year
B
uilt
Fully
Ph
ased
In
Tota
l #
Add
ed to
Pr
ojec
tions
# U
nits
by
Type
Tota
lTo
tal
Estim
ated
N
PS
Stud
ents
Actu
al A
vg #
N
PS
Stud
ents
Actu
al to
Es
timat
ed
Diff
eren
ce
Stat
istic
s
2340
Com
mon
wea
lth19
70O
ccup
ied
N/A
# U
nits
024
320
00
00
56#
Stu
dent
s P
roje
cted
Met
hod
10
07
00
00
07
# S
tude
nts
Pro
ject
ed M
etho
d 2
07
90
00
00
16#
Stu
dent
s P
roje
cted
Met
hod
30
119
00
00
020
Tota
l # S
tude
nts
- Ave
rage
of 3
Met
hods
03
120
00
00
15Le
ss:
Priv
ate
Sch
ool (
12%
)0
0-1
00
00
0-1
Tota
l im
pact
on
dist
ricte
d sc
hool
s0
311
00
00
014
Con
cord
Str
eet A
part
men
ts19
74O
ccup
ied
N/A
# U
nits
212
160
00
00
30#
Stu
dent
s P
roje
cted
Met
hod
10
03
00
00
03
# S
tude
nts
Pro
ject
ed M
etho
d 2
13
40
00
00
8#
Stu
dent
s P
roje
cted
Met
hod
30
19
00
00
010
Tota
l # S
tude
nts
- Ave
rage
of 3
Met
hods
01
60
00
00
7Le
ss:
Priv
ate
Sch
ool (
12%
)0
0-1
00
00
0-1
Tota
l im
pact
on
dist
ricte
d sc
hool
s0
15
00
00
06
Cur
tis A
rms
Apa
rtm
ents
1969
Occ
upie
dN
/A#
Uni
ts0
044
00
00
044
# S
tude
nts
Pro
ject
ed M
etho
d 1
00
90
00
00
9#
Stu
dent
s P
roje
cted
Met
hod
20
016
00
00
016
# S
tude
nts
Pro
ject
ed M
etho
d 3
00
330
00
00
33To
tal #
Stu
dent
s - A
vera
ge o
f 3 M
etho
ds0
020
00
00
020
Less
: P
rivat
e S
choo
l (12
%)
00
-20
00
00
-2To
tal i
mpa
ct o
n di
stric
ted
scho
ols
00
180
00
00
18
Farw
ell S
tree
t Apa
rtm
ents
1983
Occ
upie
dN
/A#
Uni
ts0
023
00
00
023
# S
tude
nts
Pro
ject
ed M
etho
d 1
00
50
00
00
5#
Stu
dent
s P
roje
cted
Met
hod
20
09
00
00
09
# S
tude
nts
Pro
ject
ed M
etho
d 3
00
170
00
00
17To
tal #
Stu
dent
s - A
vera
ge o
f 3 M
etho
ds0
010
00
00
010
Less
: P
rivat
e S
choo
l (12
%)
00
-10
00
00
-1To
tal i
mpa
ct o
n di
stric
ted
scho
ols
00
90
00
00
9
Flor
ence
Par
k A
part
men
ts19
95O
ccup
ied
N/A
# U
nits
114
40
00
00
19#
Stu
dent
s P
roje
cted
Met
hod
10
01
00
00
01
# S
tude
nts
Pro
ject
ed M
etho
d 2
03
10
00
00
4#
Stu
dent
s P
roje
cted
Met
hod
30
02
00
00
02
Tota
l # S
tude
nts
- Ave
rage
of 3
Met
hods
01
10
00
00
2Le
ss:
Priv
ate
Sch
ool (
12%
)0
00
00
00
00
Tota
l im
pact
on
dist
ricte
d sc
hool
s0
11
00
00
02
0.47
70%
2.00
1821
3
0.48
20%
1.57
1427
13
0.10
00%
1.47
63
-3
0.43
50%
2.00
910
1
0.21
10%
1.16
24
2
- 120 -

APPE
ND
IX F
- Ta
ble
15Es
timat
ed E
nrol
lmen
t of
Exi
stin
g an
d Pr
opos
edR
esid
entia
l Dev
elop
men
t
NO
V-20
19
~Bui
ldin
g is
om
itted
from
cal
cula
tions
in M
etho
d 2
due
to lo
w a
ctua
l SG
R.
Oct
-19
Proj
ect S
tatu
sS
tudi
o1B
R-M
2BR
-M3B
R-M
St-A
1BR
-A2B
R-A
3BR
-AAv
g SG
R
(NPS
)%
Af
ford
able
Avg
# BR
sD
evel
opm
ent N
ame
(Uni
ts ≥
15)
Firs
t Ye
ar/
Year
B
uilt
Fully
Ph
ased
In
Tota
l #
Add
ed to
Pr
ojec
tions
# U
nits
by
Type
Tota
lTo
tal
Estim
ated
N
PS
Stud
ents
Actu
al A
vg #
N
PS
Stud
ents
Actu
al to
Es
timat
ed
Diff
eren
ce
Stat
istic
s
Gro
ve S
tree
t, 26
4-29
019
75O
ccup
ied
N/A
# U
nits
1630
800
00
00
126
# S
tude
nts
Pro
ject
ed M
etho
d 1
00
170
00
00
17#
Stu
dent
s P
roje
cted
Met
hod
25
823
00
00
036
# S
tude
nts
Pro
ject
ed M
etho
d 3
11
460
00
00
48To
tal #
Stu
dent
s - A
vera
ge o
f 3 M
etho
ds2
329
00
00
034
Less
: P
rivat
e S
choo
l (12
%)
00
-30
00
00
-3To
tal i
mpa
ct o
n di
stric
ted
scho
ols
23
260
00
00
31
17 H
erric
k R
oad~
1930
Occ
upie
dN
/A#
Uni
ts0
155
60
00
026
# S
tude
nts
Pro
ject
ed M
etho
d 1
00
15
00
00
6#
Stu
dent
s P
roje
cted
Met
hod
20
52
20
00
09
# S
tude
nts
Pro
ject
ed M
etho
d 3
01
32
00
00
6To
tal #
Stu
dent
s - A
vera
ge o
f 3 M
etho
ds0
22
30
00
07
Less
: P
rivat
e S
choo
l (12
%)
00
00
00
00
0To
tal i
mpa
ct o
n di
stric
ted
scho
ols
02
23
00
00
7
392-
396
Lang
ley
1970
Occ
upie
dN
/A#
Uni
ts2
1315
00
00
030
# S
tude
nts
Pro
ject
ed M
etho
d 1
00
30
00
00
3#
Stu
dent
s P
roje
cted
Met
hod
21
34
00
00
08
# S
tude
nts
Pro
ject
ed M
etho
d 3
01
80
00
00
9To
tal #
Stu
dent
s - A
vera
ge o
f 3 M
etho
ds0
15
00
00
06
Less
: P
rivat
e S
choo
l (12
%)
00
-10
00
00
-1To
tal i
mpa
ct o
n di
stric
ted
scho
ols
01
40
00
00
5
402-
404
Lang
ley
1986
Occ
upie
dN
/A#
Uni
ts0
115
00
00
016
# S
tude
nts
Pro
ject
ed M
etho
d 1
00
30
00
00
3#
Stu
dent
s P
roje
cted
Met
hod
20
05
00
00
05
# S
tude
nts
Pro
ject
ed M
etho
d 3
00
100
00
00
10To
tal #
Stu
dent
s - A
vera
ge o
f 3 M
etho
ds0
06
00
00
06
Less
: P
rivat
e S
choo
l (12
%)
00
-10
00
00
-1To
tal i
mpa
ct o
n di
stric
ted
scho
ols
00
50
00
00
5
89 L
exin
gton
Str
eet
1970
Occ
upie
dN
/A#
Uni
ts2
412
00
00
018
# S
tude
nts
Pro
ject
ed M
etho
d 1
00
30
00
00
3#
Stu
dent
s P
roje
cted
Met
hod
21
13
00
00
05
# S
tude
nts
Pro
ject
ed M
etho
d 3
00
70
00
00
7To
tal #
Stu
dent
s - A
vera
ge o
f 3 M
etho
ds0
04
00
00
04
Less
: P
rivat
e S
choo
l (12
%)
00
00
00
00
0To
tal i
mpa
ct o
n di
stric
ted
scho
ols
00
40
00
00
4
510
5
53
-2
3143
120.
341
0%1.
51
0.33
30%
1.43
0.18
80%
1.94
0.11
10%
1.56
42
-2
0.03
80%
1.65
71
-6
- 121 -

APPE
ND
IX F
- Ta
ble
15Es
timat
ed E
nrol
lmen
t of
Exi
stin
g an
d Pr
opos
edR
esid
entia
l Dev
elop
men
t
NO
V-20
19
~Bui
ldin
g is
om
itted
from
cal
cula
tions
in M
etho
d 2
due
to lo
w a
ctua
l SG
R.
Oct
-19
Proj
ect S
tatu
sS
tudi
o1B
R-M
2BR
-M3B
R-M
St-A
1BR
-A2B
R-A
3BR
-AAv
g SG
R
(NPS
)%
Af
ford
able
Avg
# BR
sD
evel
opm
ent N
ame
(Uni
ts ≥
15)
Firs
t Ye
ar/
Year
B
uilt
Fully
Ph
ased
In
Tota
l #
Add
ed to
Pr
ojec
tions
# U
nits
by
Type
Tota
lTo
tal
Estim
ated
N
PS
Stud
ents
Actu
al A
vg #
N
PS
Stud
ents
Actu
al to
Es
timat
ed
Diff
eren
ce
Stat
istic
s
145
Lexi
ngto
n St
reet
1990
Occ
upie
dN
/A#
Uni
ts0
618
00
00
024
# S
tude
nts
Pro
ject
ed M
etho
d 1
00
40
00
00
4#
Stu
dent
s P
roje
cted
Met
hod
20
26
00
00
08
# S
tude
nts
Pro
ject
ed M
etho
d 3
00
120
00
00
12To
tal #
Stu
dent
s - A
vera
ge o
f 3 M
etho
ds0
17
00
00
08
Less
: P
rivat
e S
choo
l (12
%)
00
-10
00
00
-1To
tal i
mpa
ct o
n di
stric
ted
scho
ols
01
60
00
00
7
155
Lexi
ngto
n St
reet
1970
Occ
upie
dN
/A#
Uni
ts2
2228
00
00
052
# S
tude
nts
Pro
ject
ed M
etho
d 1
00
60
00
00
6#
Stu
dent
s P
roje
cted
Met
hod
21
68
00
00
015
# S
tude
nts
Pro
ject
ed M
etho
d 3
01
160
00
00
17To
tal #
Stu
dent
s - A
vera
ge o
f 3 M
etho
ds0
210
00
00
012
Less
: P
rivat
e S
choo
l (12
%)
00
-10
00
00
-1To
tal i
mpa
ct o
n di
stric
ted
scho
ols
02
90
00
00
11
181
Lexi
ngto
n St
reet
~19
70O
ccup
ied
N/A
# U
nits
216
120
00
00
30#
Stu
dent
s P
roje
cted
Met
hod
10
03
00
00
03
# S
tude
nts
Pro
ject
ed M
etho
d 2
04
30
00
00
7#
Stu
dent
s P
roje
cted
Met
hod
30
16
00
00
07
Tota
l # S
tude
nts
- Ave
rage
of 3
Met
hods
02
40
00
00
6Le
ss:
Priv
ate
Sch
ool (
12%
)0
00
00
00
00
Tota
l im
pact
on
dist
ricte
d sc
hool
s0
24
00
00
06
199
Lexi
ngto
n St
reet
~19
78O
ccup
ied
N/A
# U
nits
014
60
00
00
20#
Stu
dent
s P
roje
cted
Met
hod
10
01
00
00
01
# S
tude
nts
Pro
ject
ed M
etho
d 2
03
10
00
00
4#
Stu
dent
s P
roje
cted
Met
hod
30
13
00
00
04
Tota
l # S
tude
nts
- Ave
rage
of 3
Met
hods
01
20
00
00
3Le
ss:
Priv
ate
Sch
ool (
12%
)0
00
00
00
00
Tota
l im
pact
on
dist
ricte
d sc
hool
s0
12
00
00
03
8-14
Mt I
da S
tree
t~19
38O
ccup
ied
N/A
# U
nits
011
50
00
00
16#
Stu
dent
s P
roje
cted
Met
hod
10
01
00
00
01
# S
tude
nts
Pro
ject
ed M
etho
d 2
03
10
00
00
4#
Stu
dent
s P
roje
cted
Met
hod
30
02
00
00
02
Tota
l # S
tude
nts
- Ave
rage
of 3
Met
hods
01
10
00
00
2Le
ss:
Priv
ate
Sch
ool (
12%
)0
00
00
00
00
Tota
l im
pact
on
dist
ricte
d sc
hool
s0
11
00
00
02
0.16
70%
1.75
0.03
30%
1.33
0.05
00%
1.31
21
-2
30
-3
74
-3
0.13
50%
1.50
117
-4
61
-5
0.00
00%
1.30
- 122 -

APPE
ND
IX F
- Ta
ble
15Es
timat
ed E
nrol
lmen
t of
Exi
stin
g an
d Pr
opos
edR
esid
entia
l Dev
elop
men
t
NO
V-20
19
~Bui
ldin
g is
om
itted
from
cal
cula
tions
in M
etho
d 2
due
to lo
w a
ctua
l SG
R.
Oct
-19
Proj
ect S
tatu
sS
tudi
o1B
R-M
2BR
-M3B
R-M
St-A
1BR
-A2B
R-A
3BR
-AAv
g SG
R
(NPS
)%
Af
ford
able
Avg
# BR
sD
evel
opm
ent N
ame
(Uni
ts ≥
15)
Firs
t Ye
ar/
Year
B
uilt
Fully
Ph
ased
In
Tota
l #
Add
ed to
Pr
ojec
tions
# U
nits
by
Type
Tota
lTo
tal
Estim
ated
N
PS
Stud
ents
Actu
al A
vg #
N
PS
Stud
ents
Actu
al to
Es
timat
ed
Diff
eren
ce
Stat
istic
s
129
Nor
th S
tree
t19
75O
ccup
ied
N/A
# U
nits
041
470
00
00
88#
Stu
dent
s P
roje
cted
Met
hod
10
010
00
00
010
# S
tude
nts
Pro
ject
ed M
etho
d 2
012
130
00
00
25#
Stu
dent
s P
roje
cted
Met
hod
30
227
00
00
029
Tota
l # S
tude
nts
- Ave
rage
of 3
Met
hods
05
170
00
00
22Le
ss:
Priv
ate
Sch
ool (
12%
)0
-1-2
00
00
0-3
Tota
l im
pact
on
dist
ricte
d sc
hool
s0
415
00
00
019
40 P
ark
Stre
et19
45O
ccup
ied
N/A
# U
nits
311
110
00
00
25#
Stu
dent
s P
roje
cted
Met
hod
10
02
00
00
02
# S
tude
nts
Pro
ject
ed M
etho
d 2
13
30
00
00
7#
Stu
dent
s P
roje
cted
Met
hod
30
06
00
00
06
Tota
l # S
tude
nts
- Ave
rage
of 3
Met
hods
01
40
00
00
5Le
ss:
Priv
ate
Sch
ool (
12%
)0
00
00
00
00
Tota
l im
pact
on
dist
ricte
d sc
hool
s0
14
00
00
05
230
Wal
nut S
tree
t~19
30O
ccup
ied
N/A
# U
nits
1029
70
00
00
46#
Stu
dent
s P
roje
cted
Met
hod
10
02
00
00
02
# S
tude
nts
Pro
ject
ed M
etho
d 2
25
10
00
00
8#
Stu
dent
s P
roje
cted
Met
hod
31
12
00
00
04
Tota
l # S
tude
nts
- Ave
rage
of 3
Met
hods
12
20
00
00
5Le
ss:
Priv
ate
Sch
ool (
12%
)0
00
00
00
00
Tota
l im
pact
on
dist
ricte
d sc
hool
s1
22
00
00
05
337
Was
hing
ton
Stre
et~
1920
Occ
upie
dN
/A#
Uni
ts9
54
00
00
018
# S
tude
nts
Pro
ject
ed M
etho
d 1
00
10
00
00
1#
Stu
dent
s P
roje
cted
Met
hod
21
11
00
00
03
# S
tude
nts
Pro
ject
ed M
etho
d 3
00
10
00
00
1To
tal #
Stu
dent
s - A
vera
ge o
f 3 M
etho
ds0
01
00
00
01
Less
: P
rivat
e S
choo
l (12
%)
00
00
00
00
0To
tal i
mpa
ct o
n di
stric
ted
scho
ols
00
10
00
00
1
Wes
broo
k A
part
men
ts~
1947
Occ
upie
dN
/A#
Uni
ts0
2015
00
00
035
# S
tude
nts
Pro
ject
ed M
etho
d 1
00
30
00
00
3#
Stu
dent
s P
roje
cted
Met
hod
20
54
00
00
09
# S
tude
nts
Pro
ject
ed M
etho
d 3
01
80
00
00
9To
tal #
Stu
dent
s - A
vera
ge o
f 3 M
etho
ds0
25
00
00
07
Less
: P
rivat
e S
choo
l (12
%)
00
-10
00
00
-1To
tal i
mpa
ct o
n di
stric
ted
scho
ols
02
40
00
00
6
0.00
00%
1.43
60
-6
0.14
50%
1.53
1913
-6
0.04
30%
0.93
52
-3
10
-10.
000
0%0.
72
0.28
00%
1.32
57
2
- 123 -

APPE
ND
IX F
- Ta
ble
15Es
timat
ed E
nrol
lmen
t of
Exi
stin
g an
d Pr
opos
edR
esid
entia
l Dev
elop
men
t
NO
V-20
19
~Bui
ldin
g is
om
itted
from
cal
cula
tions
in M
etho
d 2
due
to lo
w a
ctua
l SG
R.
Oct
-19
Proj
ect S
tatu
sS
tudi
o1B
R-M
2BR
-M3B
R-M
St-A
1BR
-A2B
R-A
3BR
-AAv
g SG
R
(NPS
)%
Af
ford
able
Avg
# BR
sD
evel
opm
ent N
ame
(Uni
ts ≥
15)
Firs
t Ye
ar/
Year
B
uilt
Fully
Ph
ased
In
Tota
l #
Add
ed to
Pr
ojec
tions
# U
nits
by
Type
Tota
lTo
tal
Estim
ated
N
PS
Stud
ents
Actu
al A
vg #
N
PS
Stud
ents
Actu
al to
Es
timat
ed
Diff
eren
ce
Stat
istic
s
55 W
yman
Str
eet
1945
Occ
upie
dN
/A#
Uni
ts0
015
00
00
015
# S
tude
nts
Pro
ject
ed M
etho
d 1
00
30
00
00
3#
Stu
dent
s P
roje
cted
Met
hod
20
06
00
00
06
# S
tude
nts
Pro
ject
ed M
etho
d 3
00
110
00
00
11To
tal #
Stu
dent
s - A
vera
ge o
f 3 M
etho
ds0
07
00
00
07
Less
: P
rivat
e S
choo
l (12
%)
00
-10
00
00
-1To
tal i
mpa
ct o
n di
stric
ted
scho
ols
00
60
00
00
6
Cou
rt S
tree
t, 75
-83
2016
2021
Phas
e in
15E
st.
# U
nits
03
232
01
61
36#
Stu
dent
s P
roje
cted
Met
hod
10
05
20
06
316
# S
tude
nts
Pro
ject
ed M
etho
d 2
01
81
00
20
12#
Stu
dent
s P
roje
cted
Met
hod
30
017
10
04
022
Tota
l # S
tude
nts
- Ave
rage
of 3
Met
hods
00
101
00
41
16Le
ss:
Priv
ate
Sch
ool (
12%
)0
0-1
00
00
0-1
Tota
l im
pact
on
dist
ricte
d sc
hool
s0
09
10
04
115
Kes
sele
r Woo
ds20
1820
23Ph
ase
in23
Est
.#
Uni
ts0
2946
00
58
088
# S
tude
nts
Pro
ject
ed M
etho
d 1
00
100
00
80
18#
Stu
dent
s P
roje
cted
Met
hod
20
914
00
22
027
# S
tude
nts
Pro
ject
ed M
etho
d 3
01
280
00
50
34To
tal #
Stu
dent
s - A
vera
ge o
f 3 M
etho
ds0
317
00
15
026
Less
: P
rivat
e S
choo
l (12
%)
00
-20
00
-10
-3To
tal i
mpa
ct o
n di
stric
ted
scho
ols
03
150
01
40
23
Aus
tin S
tree
t20
1920
24Ph
ase
in18
Est
.#
Uni
ts0
2229
00
710
068
# S
tude
nts
Pro
ject
ed M
etho
d 1
00
60
00
100
16#
Stu
dent
s P
roje
cted
Met
hod
20
69
00
23
020
# S
tude
nts
Pro
ject
ed M
etho
d 3
01
170
00
60
24To
tal #
Stu
dent
s - A
vera
ge o
f 3 M
etho
ds0
211
00
16
020
Less
: P
rivat
e S
choo
l (12
%)
00
-10
00
-10
-2To
tal i
mpa
ct o
n di
stric
ted
scho
ols
02
100
01
50
18
Was
hing
ton
Plac
e20
20C
onst
ruct
ion
30E
st.
# U
nits
1348
404
017
162
140
# S
tude
nts
Pro
ject
ed M
etho
d 1
00
93
00
166
34#
Stu
dent
s P
roje
cted
Met
hod
23
1310
10
44
136
# S
tude
nts
Pro
ject
ed M
etho
d 3
12
211
01
80
34To
tal #
Stu
dent
s - A
vera
ge o
f 3 M
etho
ds1
513
20
29
234
Less
: P
rivat
e S
choo
l (12
%)
0-1
-20
00
-10
-4To
tal i
mpa
ct o
n di
stric
ted
scho
ols
14
112
02
82
30
23-
-
15
0.21
425
%1.
39
0.26
515
%1.
61
0.26
525
%1.
57
30-
-
-22
%1.
97
0.21
30%
2.00
0.41
7
18-
--
63
-2
- 124 -

APPE
ND
IX F
- Ta
ble
15Es
timat
ed E
nrol
lmen
t of
Exi
stin
g an
d Pr
opos
edR
esid
entia
l Dev
elop
men
t
NO
V-20
19
~Bui
ldin
g is
om
itted
from
cal
cula
tions
in M
etho
d 2
due
to lo
w a
ctua
l SG
R.
Oct
-19
Proj
ect S
tatu
sS
tudi
o1B
R-M
2BR
-M3B
R-M
St-A
1BR
-A2B
R-A
3BR
-AAv
g SG
R
(NPS
)%
Af
ford
able
Avg
# BR
sD
evel
opm
ent N
ame
(Uni
ts ≥
15)
Firs
t Ye
ar/
Year
B
uilt
Fully
Ph
ased
In
Tota
l #
Add
ed to
Pr
ojec
tions
# U
nits
by
Type
Tota
lTo
tal
Estim
ated
N
PS
Stud
ents
Actu
al A
vg #
N
PS
Stud
ents
Actu
al to
Es
timat
ed
Diff
eren
ce
Stat
istic
s
429
Che
rry
Stre
et20
20C
onst
ruct
ion
6E
st.
# U
nits
01
90
00
30
13#
Stu
dent
s P
roje
cted
Met
hod
10
02
00
03
05
# S
tude
nts
Pro
ject
ed M
etho
d 2
00
30
00
10
4#
Stu
dent
s P
roje
cted
Met
hod
30
06
00
02
08
Tota
l # S
tude
nts
- Ave
rage
of 3
Met
hods
00
40
00
20
6Le
ss:
Priv
ate
Sch
ool (
12%
)0
00
00
00
00
Tota
l im
pact
on
dist
ricte
d sc
hool
s0
04
00
02
06
392-
404
Lang
ley
Roa
d20
20C
onst
ruct
ion
1E
st.
# U
nits
57
40
12
10
20#
Stu
dent
s P
roje
cted
Met
hod
10
01
00
01
02
# S
tude
nts
Pro
ject
ed M
etho
d 2
11
10
00
00
3#
Stu
dent
s P
roje
cted
Met
hod
30
01
00
00
01
Tota
l # S
tude
nts
- Ave
rage
of 3
Met
hods
00
10
00
00
1Le
ss:
Priv
ate
Sch
ool (
12%
)0
00
00
00
00
Tota
l im
pact
on
dist
ricte
d sc
hool
s0
01
00
00
01
200-
230
Boy
lsto
n (C
hest
nut H
ill P
ha
2022
Spec
ial P
erm
it27
Est
.#
Uni
ts0
3451
00
69
010
0#
Stu
dent
s P
roje
cted
Met
hod
10
011
00
09
020
# S
tude
nts
Pro
ject
ed M
etho
d 2
010
150
02
30
30#
Stu
dent
s P
roje
cted
Met
hod
30
231
00
05
038
Tota
l # S
tude
nts
- Ave
rage
of 3
Met
hods
04
190
01
60
30Le
ss:
Priv
ate
Sch
ool (
12%
)0
0-2
00
0-1
0-3
Tota
l im
pact
on
dist
ricte
d sc
hool
s0
417
00
15
027
Mel
rose
Str
eet,
283
2022
Spec
ial P
erm
it5
Est
.
# U
nits
05
90
01
10
16#
Stu
dent
s P
roje
cted
Met
hod
10
02
00
01
03
# S
tude
nts
Pro
ject
ed M
etho
d 2
02
30
00
00
5#
Stu
dent
s P
roje
cted
Met
hod
30
05
00
01
06
Tota
l # S
tude
nts
- Ave
rage
of 3
Met
hods
01
30
00
10
5Le
ss:
Priv
ate
Sch
ool (
12%
)0
00
00
00
00
Tota
l im
pact
on
dist
ricte
d sc
hool
s0
13
00
01
05
189
Ada
ms
Stre
et20
24Sp
ecia
l Per
mit
4E
st.
# U
nits
02
53
00
20
12#
Stu
dent
s P
roje
cted
Met
hod
10
01
20
02
05
# S
tude
nts
Pro
ject
ed M
etho
d 2
01
21
00
10
5#
Stu
dent
s P
roje
cted
Met
hod
30
04
10
01
06
Tota
l # S
tude
nts
- Ave
rage
of 3
Met
hods
00
21
00
10
4Le
ss:
Priv
ate
Sch
ool (
12%
)0
00
00
00
00
Tota
l im
pact
on
dist
ricte
d sc
hool
s0
02
10
01
04
0.27
015
%1.
60
0.43
6
0.05
0
1.92
23%
20%
0.95
1-
-
13%
1.63
--
5
0.33
317
%2.
08
4
--
0.31
3
27-
--6
-
- 125 -

APPE
ND
IX F
- Ta
ble
15Es
timat
ed E
nrol
lmen
t of
Exi
stin
g an
d Pr
opos
edR
esid
entia
l Dev
elop
men
t
NO
V-20
19
~Bui
ldin
g is
om
itted
from
cal
cula
tions
in M
etho
d 2
due
to lo
w a
ctua
l SG
R.
Oct
-19
Proj
ect S
tatu
sS
tudi
o1B
R-M
2BR
-M3B
R-M
St-A
1BR
-A2B
R-A
3BR
-AAv
g SG
R
(NPS
)%
Af
ford
able
Avg
# BR
sD
evel
opm
ent N
ame
(Uni
ts ≥
15)
Firs
t Ye
ar/
Year
B
uilt
Fully
Ph
ased
In
Tota
l #
Add
ed to
Pr
ojec
tions
# U
nits
by
Type
Tota
lTo
tal
Estim
ated
N
PS
Stud
ents
Actu
al A
vg #
N
PS
Stud
ents
Actu
al to
Es
timat
ed
Diff
eren
ce
Stat
istic
s
182
Cal
iforn
ia S
tree
t20
22Sp
ecia
l Per
mit
9E
st.
# U
nits
00
134
01
11
20#
Stu
dent
s P
roje
cted
Met
hod
10
03
30
01
310
# S
tude
nts
Pro
ject
ed M
etho
d 2
00
52
00
00
7#
Stu
dent
s P
roje
cted
Met
hod
30
011
10
01
013
Tota
l # S
tude
nts
- Ave
rage
of 3
Met
hods
00
62
00
11
10Le
ss:
Priv
ate
Sch
ool (
12%
)0
0-1
00
00
0-1
Tota
l im
pact
on
dist
ricte
d sc
hool
s0
05
20
01
19
Nor
thla
nd (N
eedh
am S
tree
t)20
23Sp
ecia
l Per
mit
165
Est
.#
Uni
ts68
303
272
3412
5748
680
0#
Stu
dent
s P
roje
cted
Met
hod
10
058
270
049
1715
1#
Stu
dent
s P
roje
cted
Met
hod
218
7971
93
1513
221
0#
Stu
dent
s P
roje
cted
Met
hod
35
1314
58
13
261
202
Tota
l # S
tude
nts
- Ave
rage
of 3
Met
hods
831
9115
16
297
188
Less
: P
rivat
e S
choo
l (12
%)
-1-4
-11
-20
-1-3
-1-2
3To
tal i
mpa
ct o
n di
stric
ted
scho
ols
727
8013
15
266
165
Riv
ersi
de S
tatio
n20
24SP
App
licat
ion
N/A
Est
.#
Uni
ts34
243
143
127
4929
752
4#
Stu
dent
s P
roje
cted
Met
hod
10
031
100
030
2091
# S
tude
nts
Pro
ject
ed M
etho
d 2
860
353
212
72
129
# S
tude
nts
Pro
ject
ed M
etho
d 3
210
723
12
152
107
Tota
l # S
tude
nts
- Ave
rage
of 3
Met
hods
323
465
15
178
108
Less
: P
rivat
e S
choo
l (12
%)
0-3
-6-1
0-1
-2-1
-14
Tota
l im
pact
on
dist
ricte
d sc
hool
s3
2040
41
415
794
0.45
015
%2.
20
0.20
615
%1.
40
0.17
918
%1.
32
9-
-
165
--
94-
-
- 126 -

APPE
ND
IX F
- Ta
ble
16Ac
tual
Enr
ollm
ent
for E
xist
ing
Com
plex
esN
OV-
2019
*Bui
ldin
g is
0.5
mile
s or
less
from
an
elem
enta
ry s
choo
l.
Leve
lO
ct-1
5 #
Oct
-16
#O
ct-1
7 #
Oct
-18
#O
ct-1
9 #
Avg
. #%
Est
imat
ed #
Act
ual t
o E
stim
ated
D
iff.
Diff
. as
% o
f S
choo
l E
nrol
l.
Abl
emar
le G
arde
ns19
80E
S D
istri
ct: H
orac
e M
ann
ES
00
00
00
N/A
1-1
N/A
MS
Dis
trict
: Day
MS
00
00
00
N/A
1-1
N/A
HS
Dis
trict
: Nor
thH
S0
00
00
0N
/A0
0N
/ATo
tal
00
00
00
N/A
2-2
N/A
175
Ada
ms
Stre
et19
76E
S D
istri
ct: L
inco
ln-E
liot
ES
32
54
23
50%
21
0.28
%M
S D
istri
ct: B
igel
owM
S4
11
03
233
%1
10.
20%
HS
Dis
trict
: Nor
thH
S1
21
21
117
%1
00.
00%
Tota
l8
57
66
610
0%4
20.
07%
Ava
lon
at N
ewto
n H
ighl
ands
20
00E
S D
istri
ct: C
ount
rysi
de/Z
erva
sE
S45
4357
4443
4645
%52
-6-0
.74%
MS
Dis
trict
: Bro
wn/
Oak
Hill
MS
2822
1926
2624
24%
27-3
-0.1
8%H
S D
istri
ct: S
outh
HS
3337
3232
2632
31%
275
0.26
%To
tal
106
102
108
102
9510
210
0%10
6-4
-0.0
9%
Ava
lon
at C
hest
nut H
ill20
02E
S D
istri
ct: B
owen
/Mem
oria
l-Spa
uldi
ngE
S30
3333
3932
3346
%43
-10
-1.1
0%M
S D
istri
ct: O
ak H
illM
S16
2122
1813
1825
%21
-3-0
.48%
HS
Dis
trict
: Sou
thH
S15
1725
2528
2230
%21
10.
05%
Tota
l61
7180
8273
7310
0%85
-12
-0.3
4%
Arb
orpo
int W
oodl
and
Stat
ion
2004
ES
Dis
trict
: Pei
rce/
Will
iam
sE
S29
2630
2424
2755
%25
20.
35%
MS
Dis
trict
: Day
/Bro
wn
MS
139
56
88
16%
13-5
-0.2
9%H
S D
istri
ct: N
orth
/Sou
thH
S11
1316
1616
1429
%13
10.
02%
Tota
l53
4851
4648
4910
0%51
-2-0
.03%
77 B
eaco
nwoo
d R
oad
1986
ES
Dis
trict
: Zer
vas
ES
00
00
00
N/A
1-1
N/A
MS
Dis
trict
: Oak
Hill
MS
00
00
00
N/A
1-1
N/A
HS
Dis
trict
: Sou
thH
S0
00
00
0N
/A1
-1N
/ATo
tal
00
00
00
N/A
3-3
N/A
457
Cen
tre
Stre
et*
1958
ES
Dis
trict
: Und
erw
ood
ES
11
10
01
100%
10
0.00
%M
S D
istri
ct: B
igel
owM
S0
00
00
00%
00
0.00
%H
S D
istri
ct: N
orth
HS
00
00
00
0%1
-1-0
.05%
Tota
l1
11
00
110
0%2
-1-0
.03%
Dev
elop
men
t Nam
e (U
nits
≥15
)
Firs
t Ye
ar/
Year
B
uilt
#NPS
Stu
dent
s En
rolle
d:A
ctua
l to
Estim
ated
Com
paris
on
- 127 -

APPE
ND
IX F
- Ta
ble
16Ac
tual
Enr
ollm
ent
for E
xist
ing
Com
plex
esN
OV-
2019
*Bui
ldin
g is
0.5
mile
s or
less
from
an
elem
enta
ry s
choo
l.
Leve
lO
ct-1
5 #
Oct
-16
#O
ct-1
7 #
Oct
-18
#O
ct-1
9 #
Avg
. #%
Est
imat
ed #
Act
ual t
o E
stim
ated
D
iff.
Diff
. as
% o
f S
choo
l E
nrol
l.
Dev
elop
men
t Nam
e (U
nits
≥15
)
Firs
t Ye
ar/
Year
B
uilt
#NPS
Stu
dent
s En
rolle
d:A
ctua
l to
Estim
ated
Com
paris
on
5 C
harle
sban
k R
oad
1948
ES
Dis
trict
: Und
erw
ood
ES
86
65
66
75%
33
1.01
%M
S D
istri
ct: B
igel
owM
S2
10
00
113
%2
-1-0
.20%
HS
Dis
trict
: Nor
thH
S3
20
11
113
%2
-1-0
.05%
Tota
l13
96
67
810
0%7
10.
03%
The
Che
stnu
t Hill
Apa
rtm
ents
*18
80E
S D
istri
ct: W
ard
ES
00
00
20
N/A
2-2
N/A
MS
Dis
trict
: Big
elow
MS
00
00
00
N/A
00
N/A
HS
Dis
trict
: Nor
thH
S1
10
00
0N
/A1
-1N
/ATo
tal
11
00
20
N/A
3-3
N/A
2300
Com
mon
wea
lth19
75E
S D
istri
ct: W
illia
ms/
Bur
rE
S26
2719
2318
2370
%9
142.
08%
MS
Dis
trict
: Bro
wn/
Day
MS
64
64
55
15%
50
0.00
%H
S D
istri
ct: S
outh
/Nor
thH
S4
64
65
515
%5
00.
00%
Tota
l36
3729
3328
3310
0%19
140.
22%
2340
Com
mon
wea
lth19
70E
S D
istri
ct: W
illia
ms/
Bur
rE
S17
1211
2018
1659
%6
101.
48%
MS
Dis
trict
: Bro
wn/
Day
MS
56
78
56
22%
42
0.12
%H
S D
istri
ct: S
outh
/Nor
thH
S6
54
66
519
%4
10.
02%
Tota
l28
2322
3429
2710
0%14
130.
20%
Con
cord
Str
eet A
part
men
ts19
74E
S D
istri
ct: A
ngie
rE
S1
12
01
133
%3
-2-0
.43%
MS
Dis
trict
: Bro
wn
MS
00
02
21
33%
2-1
-0.1
3%H
S D
istri
ct: S
outh
HS
11
11
01
33%
10
0.00
%To
tal
22
33
33
100%
6-3
-0.1
0%
Cur
tis A
rms
Apa
rtm
ents
1969
ES
Dis
trict
: Hor
ace
Man
nE
S13
129
77
1048
%8
20.
49%
MS
Dis
trict
: Day
MS
34
56
85
24%
50
0.00
%H
S D
istri
ct: N
orth
HS
77
58
56
29%
51
0.05
%To
tal
2323
1921
2021
100%
183
0.09
%
Farw
ell S
tree
t Apa
rtm
ents
1983
ES
Dis
trict
: Hor
ace
Man
nE
S6
23
88
550
%5
00.
00%
MS
Dis
trict
: Day
MS
31
22
12
20%
20
0.00
%H
S D
istri
ct: N
orth
HS
23
23
33
30%
21
0.05
%To
tal
116
713
1210
100%
91
0.03
%
- 128 -
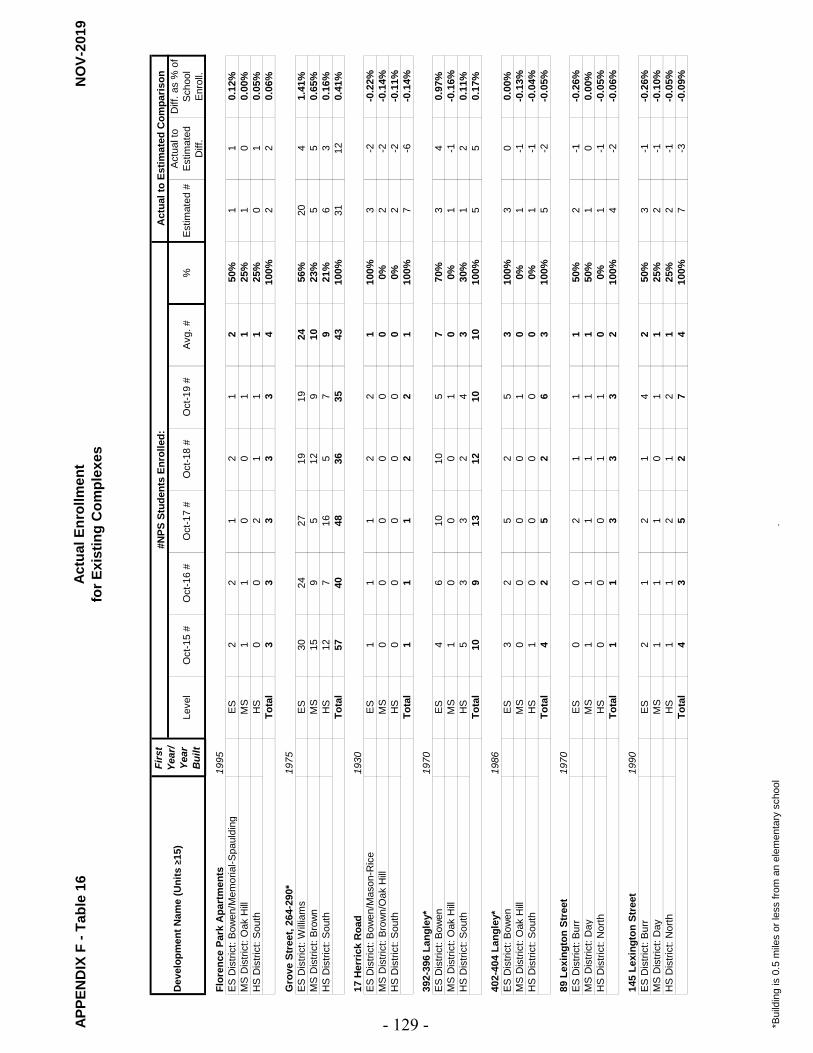
APPE
ND
IX F
- Ta
ble
16Ac
tual
Enr
ollm
ent
for E
xist
ing
Com
plex
esN
OV-
2019
*Bui
ldin
g is
0.5
mile
s or
less
from
an
elem
enta
ry s
choo
l.
Leve
lO
ct-1
5 #
Oct
-16
#O
ct-1
7 #
Oct
-18
#O
ct-1
9 #
Avg
. #%
Est
imat
ed #
Act
ual t
o E
stim
ated
D
iff.
Diff
. as
% o
f S
choo
l E
nrol
l.
Dev
elop
men
t Nam
e (U
nits
≥15
)
Firs
t Ye
ar/
Year
B
uilt
#NPS
Stu
dent
s En
rolle
d:A
ctua
l to
Estim
ated
Com
paris
on
Flor
ence
Par
k A
part
men
ts19
95E
S D
istri
ct: B
owen
/Mem
oria
l-Spa
uldi
ngE
S2
21
21
250
%1
10.
12%
MS
Dis
trict
: Oak
Hill
MS
11
00
11
25%
10
0.00
%H
S D
istri
ct: S
outh
HS
00
21
11
25%
01
0.05
%To
tal
33
33
34
100%
22
0.06
%
Gro
ve S
tree
t, 26
4-29
0*19
75E
S D
istri
ct: W
illia
ms
ES
3024
2719
1924
56%
204
1.41
%M
S D
istri
ct: B
row
nM
S15
95
129
1023
%5
50.
65%
HS
Dis
trict
: Sou
thH
S12
716
57
921
%6
30.
16%
Tota
l57
4048
3635
4310
0%31
120.
41%
17 H
erric
k R
oad
1930
ES
Dis
trict
: Bow
en/M
ason
-Ric
eE
S1
11
22
110
0%3
-2-0
.22%
MS
Dis
trict
: Bro
wn/
Oak
Hill
MS
00
00
00
0%2
-2-0
.14%
HS
Dis
trict
: Sou
thH
S0
00
00
00%
2-2
-0.1
1%To
tal
11
12
21
100%
7-6
-0.1
4%
392-
396
Lang
ley*
1970
ES
Dis
trict
: Bow
enE
S4
610
105
770
%3
40.
97%
MS
Dis
trict
: Oak
Hill
MS
10
00
10
0%1
-1-0
.16%
HS
Dis
trict
: Sou
thH
S5
33
24
330
%1
20.
11%
Tota
l10
913
1210
1010
0%5
50.
17%
402-
404
Lang
ley*
1986
ES
Dis
trict
: Bow
enE
S3
25
25
310
0%3
00.
00%
MS
Dis
trict
: Oak
Hill
MS
00
00
10
0%1
-1-0
.13%
HS
Dis
trict
: Sou
thH
S1
00
00
00%
1-1
-0.0
4%To
tal
42
52
63
100%
5-2
-0.0
5%
89 L
exin
gton
Str
eet
1970
ES
Dis
trict
: Bur
rE
S0
02
11
150
%2
-1-0
.26%
MS
Dis
trict
: Day
MS
11
11
11
50%
10
0.00
%H
S D
istri
ct: N
orth
HS
00
01
10
0%1
-1-0
.05%
Tota
l1
13
33
210
0%4
-2-0
.06%
145
Lexi
ngto
n St
reet
1990
ES
Dis
trict
: Bur
rE
S2
12
14
250
%3
-1-0
.26%
MS
Dis
trict
: Day
MS
11
10
11
25%
2-1
-0.1
0%H
S D
istri
ct: N
orth
HS
11
21
21
25%
2-1
-0.0
5%To
tal
43
52
74
100%
7-3
-0.0
9%
- 129 -

APPE
ND
IX F
- Ta
ble
16Ac
tual
Enr
ollm
ent
for E
xist
ing
Com
plex
esN
OV-
2019
*Bui
ldin
g is
0.5
mile
s or
less
from
an
elem
enta
ry s
choo
l.
Leve
lO
ct-1
5 #
Oct
-16
#O
ct-1
7 #
Oct
-18
#O
ct-1
9 #
Avg
. #%
Est
imat
ed #
Act
ual t
o E
stim
ated
D
iff.
Diff
. as
% o
f S
choo
l E
nrol
l.
Dev
elop
men
t Nam
e (U
nits
≥15
)
Firs
t Ye
ar/
Year
B
uilt
#NPS
Stu
dent
s En
rolle
d:A
ctua
l to
Estim
ated
Com
paris
on
155
Lexi
ngto
n St
reet
1970
ES
Dis
trict
: Bur
rE
S2
32
42
343
%5
-2-0
.51%
MS
Dis
trict
: Day
MS
21
00
11
14%
3-2
-0.2
1%H
S D
istri
ct: N
orth
HS
22
44
33
43%
30
0.00
%To
tal
66
68
67
100%
11-4
-0.1
1%
181
Lexi
ngto
n St
reet
*19
70E
S D
istri
ct: B
urr
ES
22
11
01
100%
4-3
-0.7
7%M
S D
istri
ct: D
ayM
S0
00
01
00%
1-1
-0.1
0%H
S D
istri
ct: N
orth
HS
00
00
10
0%1
-1-0
.05%
Tota
l2
21
12
110
0%6
-5-0
.14%
199
Lexi
ngto
n St
reet
*19
78E
S D
istri
ct: B
urr
ES
00
00
10
N/A
1-1
N/A
MS
Dis
trict
: Day
MS
00
00
00
N/A
1-1
N/A
HS
Dis
trict
: Nor
thH
S0
00
00
0N
/A1
-1N
/ATo
tal
00
00
10
N/A
3-3
N/A
8-14
Mt I
da S
tree
t*19
38E
S D
istri
ct: U
nder
woo
dE
S0
00
00
00%
2-2
-0.6
8%M
S D
istri
ct: B
igel
owM
S0
10
00
00%
00
0.04
%H
S D
istri
ct: N
orth
HS
02
10
01
100%
01
0.03
%To
tal
03
10
01
100%
2-1
-0.0
4%
129
Nor
th S
tree
t19
75E
S D
istri
ct: H
orac
e M
ann
ES
65
56
86
47%
9-3
-0.7
4%M
S D
istri
ct: D
ayM
S1
33
44
323
%5
-2-0
.21%
HS
Dis
trict
: Nor
thH
S5
32
45
430
%5
-1-0
.06%
Tota
l12
1110
1417
1310
0%19
-6-0
.18%
40 P
ark
Stre
et*
1945
ES
Dis
trict
: Und
erw
ood
ES
85
35
25
76%
32
0.68
%M
S D
istri
ct: B
igel
owM
S0
03
20
115
%1
00.
00%
HS
Dis
trict
: Nor
thH
S0
01
11
19%
10
-0.0
2%To
tal
85
78
37
100%
52
0.05
%
230
Wal
nut S
tree
t19
30E
S D
istri
ct: C
abot
ES
22
12
12
100%
3-1
-0.2
5%M
S D
istri
ct: D
ayM
S0
00
00
00%
1-1
-0.1
0%H
S D
istri
ct: N
orth
HS
00
10
10
0%1
-1-0
.03%
Tota
l2
22
22
210
0%5
-3-0
.07%
- 130 -

APPE
ND
IX F
- Ta
ble
16Ac
tual
Enr
ollm
ent
for E
xist
ing
Com
plex
esN
OV-
2019
*Bui
ldin
g is
0.5
mile
s or
less
from
an
elem
enta
ry s
choo
l.
Leve
lO
ct-1
5 #
Oct
-16
#O
ct-1
7 #
Oct
-18
#O
ct-1
9 #
Avg
. #%
Est
imat
ed #
Act
ual t
o E
stim
ated
D
iff.
Diff
. as
% o
f S
choo
l E
nrol
l.
Dev
elop
men
t Nam
e (U
nits
≥15
)
Firs
t Ye
ar/
Year
B
uilt
#NPS
Stu
dent
s En
rolle
d:A
ctua
l to
Estim
ated
Com
paris
on
337
Was
hing
ton
Stre
et19
20E
S D
istri
ct: L
inco
ln-E
liot
ES
00
00
00
N/A
1-1
N/A
MS
Dis
trict
: Big
elow
MS
00
00
00
N/A
00
N/A
HS
Dis
trict
: Nor
thH
S0
00
00
0N
/A0
0N
/ATo
tal
00
00
00
N/A
1-1
N/A
Wes
broo
k A
part
men
ts*
1947
ES
Dis
trict
: Und
erw
ood
ES
00
00
00
N/A
4-4
-1.3
5%M
S D
istri
ct: B
igel
owM
S0
00
00
0N
/A1
-1-0
.20%
HS
Dis
trict
: Nor
thH
S0
00
00
0N
/A1
-1-0
.05%
Tota
l0
00
00
0N
/A6
-6-0
.20%
55 W
yman
Str
eet*
1945
ES
Dis
trict
: Ang
ier
ES
02
44
33
100%
4-1
-0.2
2%M
S D
istri
ct: B
row
nM
S0
00
01
00%
1-1
-0.1
0%H
S D
istri
ct: S
outh
HS
00
00
00
0%1
-1-0
.05%
Tota
l0
24
44
310
0%6
-3-0
.09%
Cou
rt S
tree
t, 75
-83
2016
ES
Dis
trict
: Cab
otE
S0
00
00
0%7
-7-1
.77%
MS
Dis
trict
: Day
MS
00
12
133
%4
-3-0
.31%
HS
Dis
trict
: Nor
thH
S0
03
32
67%
4-2
-0.0
9%To
tal
00
45
310
0%15
-12
-0.3
4%
Kes
sele
r Woo
ds20
18
ES
Dis
trict
: Mem
oria
l-Spa
uldi
ngE
S0
32
40%
11-9
-1.9
7%M
S D
istri
ct: O
ak H
illM
S0
42
40%
6-4
-0.6
4%H
S D
istri
ct: S
outh
HS
01
120
%6
-5-0
.26%
Tota
l0
85
100%
23-1
8-0
.61%
Aus
tin S
tree
t20
19E
S D
istri
ct: C
abot
ES
22
100%
8-6
-1.5
2%M
S D
istri
ct: D
ayM
S0
00%
5-5
-0.5
2%H
S D
istri
ct: N
orth
HS
00
0%5
-5-0
.23%
Tota
l2
210
0%18
-16
-0.4
6%
- 131 -