Embed Size (px)
Citation preview

Citation: Irwin, Véronique.2020. “Selective EnrollmentPublic Schools and District-LevelAchievement Outcomes from3rd to 8th Grade.” SociologicalScience 7: 100-127.Received: September 24, 2019Accepted: February 27, 2020Published: April 2, 2020Editor(s): Jesper Sørensen, KimWeedenDOI: 10.15195/v7.a5Copyright: c© 2020 The Au-thor(s). This open-access articlehas been published under a Cre-ative Commons Attribution Li-cense, which allows unrestricteduse, distribution and reproduc-tion, in any form, as long as theoriginal author and source havebeen credited.cb
Selective Enrollment Public Schools and District-Level Achievement Outcomes from 3rd to 8th GradeVéronique Irwin
University of California, Berkeley
Abstract: Fierce local debates throughout the United States surround the equity of admittingstudents to public schools using academic criteria. Although research has evaluated the centralassumption of these debates—that Selective Enrollment Public (SEP) schools enhance the welfareof students who attend them—none has addressed the district-level outcomes associated withthese schools. This is important because the selectivity and scope of SEP schools produce tieredschool systems (SEP districts). This district-level process, in turn, calls for an analysis of district-level achievement outcomes. To address this gap, I compile an original list of SEP schools usingan innovative web scraping procedure. I combine these data with newly available district-levelmeasures of third to eighth grade achievement from the Stanford Education Data Archive. Analysesfollow a difference-in-differences design, using grade level as the longitudinal dimension. Thisapproach facilitates a falsification test, using future treated districts, to reject spurious causation. Ifind evidence of overall slower growth in mean math achievement in SEP districts and for white, black,and Latinx racial/ethnic groups separately. SEP districts also see an increase in the white–Latinxmath achievement gap. This work highlights the importance of considering SEP schools as part of adifferentiated school system.
Keywords: Selective Enrollment Public schools; student differentiation; selectivity; scope; difference-in-differences
IN March 2019, news broke of wealthy parents going to extreme lengths to ille-gally secure their children admission to prestigious colleges, inciting national
outrage about the entitlement of the ultrarich, and—through this shared outrage—demonstrating the importance all parents place on providing their children the besteducation. Although this highly publicized case focused on college admissions,similar pressures exist at the primary and secondary levels. In many medium andlarge school districts throughout the United States, this means securing a seat in aSelective Enrollment Public (SEP) school. In fact, just a few months prior to the “ad-missions scandal,” one of the nation’s best-known SEP schools, Boston Latin School,made headlines in the Boston Globe. The school was featured as part of a seriescalled the “Valedictorians Project,” which documented the untapped potential ofBoston’s public high school valedictorians—with the exception, that is, of graduatesof the city’s SEP schools. The report described a two-tiered system, in which blackand Latinx children overwhelmingly find themselves in schools where even vale-dictorians are told that their achievements “didn’t mean much compared to kids at[the SEP school,] Latin,” (Gay 2019). Concern about this inequity—in Boston and inother cities with SEP schools—manifests in debates about the racial justice of usingacademic admissions procedures to determine access to the district’s best schools(e.g., Ebbert 2016; Irizarry 2017; Rey 2017). The implicit assumption in these de-
100
Irwin SEP Schools and Math Achievement
bates is that access to SEP schools will enhance the well-being of underrepresentedstudents who gain admissions.
Lost in this debate, however, is any consideration of the broader distributionalconsequences of having SEP schools in a district at all. Indeed, insofar as admissionsprocesses shape the composition of SEP schools, they also shape the compositionof traditional public schools throughout the district. SEP schools may therefore bean important element of district organization in determining the distribution ofeducational opportunities and outcomes districtwide. Yet we lack an understandingof what effect, if any, SEP schools have on achievement outcomes throughout thedistrict. Thus, this article asks: Do traditional public districts with SEP schools(i.e., SEP districts) produce different (1) overall levels of achievement growth or(2) inequality of achievement than non-SEP districts? And, given the documentedconcerns around equity in access, (3) do these effects differ for students of differentracial/ethnic backgrounds? By focusing on district-level outcomes, this articlemoves beyond a micro-level understanding of the effects of between-school studentdifferentiation on the individual students and families who actively participate inschool choice, in order to evaluate the meso-level impact of district organization onachievement outcomes.
To date, data limitations have prevented any such analysis. No existing dataset on the universe of U.S. public schools gathers data on selective assignmentprocedures. Thus, I use an innovative web scraping technique to produce anoriginal data set of SEP schools and the SEP districts that house them throughoutthe United States. These data are then combined with newly available nationalachievement data from the Stanford Education Data Archive (SEDA; Reardon et al.2018). From SEDA, I draw on measures of district-level mean math achievementfrom third to eighth grade to evaluate achievement growth, as well as standarddeviation of math achievement and racial achievement gaps in math as measures ofinequality. Together, these data provide the unique ability to assess the role of SEPschools in shaping districts’ overall ecology of educational opportunity.
Analyses employ a difference-in-differences (DiD) design, using grade level asthe longitudinal dimension, in order to maximize the analytical leverage availablefrom SEDA. Accordingly, the “treated” sample consists of 30 SEP districts that beginoffering SEP schools between fourth and eighth grade, to allow for a third grade“pretreatment” observation. To evaluate whether the “dosage” of treatment mattersand leverage the variation in these districts, I test for differences not only betweenSEP and non-SEP districts but between districts with different prevalence of SEPschools between fourth and eighth grade. Overall, I find that districtwide mathachievement growth is slower in SEP districts than non-SEP districts. This resultholds for white, black, and Latinx students, but not for Asian students. Additionally,I test the effect of SEP schools on district-level inequality of achievement usingmeasures of standard deviation of achievement, as an indicator of total variance, aswell as racial achievement gaps. Findings for each of these outcomes is mixed: Ifind marginal evidence of an increase in standard deviation only when using thedose treatment specifications, and I find evidence of an increase in race/ethnicachievement gaps only between white and Latinx students, not white and blackstudents.
sociological science | www.sociologicalscience.com 101 April 2020 | Volume 7
Irwin SEP Schools and Math Achievement
The remainder of the article is organized as follows. First, I introduce keyelements of Sørensen’s (1970) framework of student differentiation in order tosituate SEP schools in the landscape of U.S. public education. I then briefly discusswhat is known about SEP schools from the existing literature, which has focusedon the effect of SEP schools on enrolled students. Next, I turn to research onthe effects of between-school student differentiation on systemwide outcomes, inorder to generate hypotheses for the subsequent analyses. This is followed by adiscussion of my data collection procedure, secondary data from SEDA, and mydifference-in-differences modeling approach. I then present results, before turningto a discussion, which highlights the questions that remain about mechanismsinvolved in this process.
Academic Differentiation and the Place of SelectiveEnrollment Public Schools
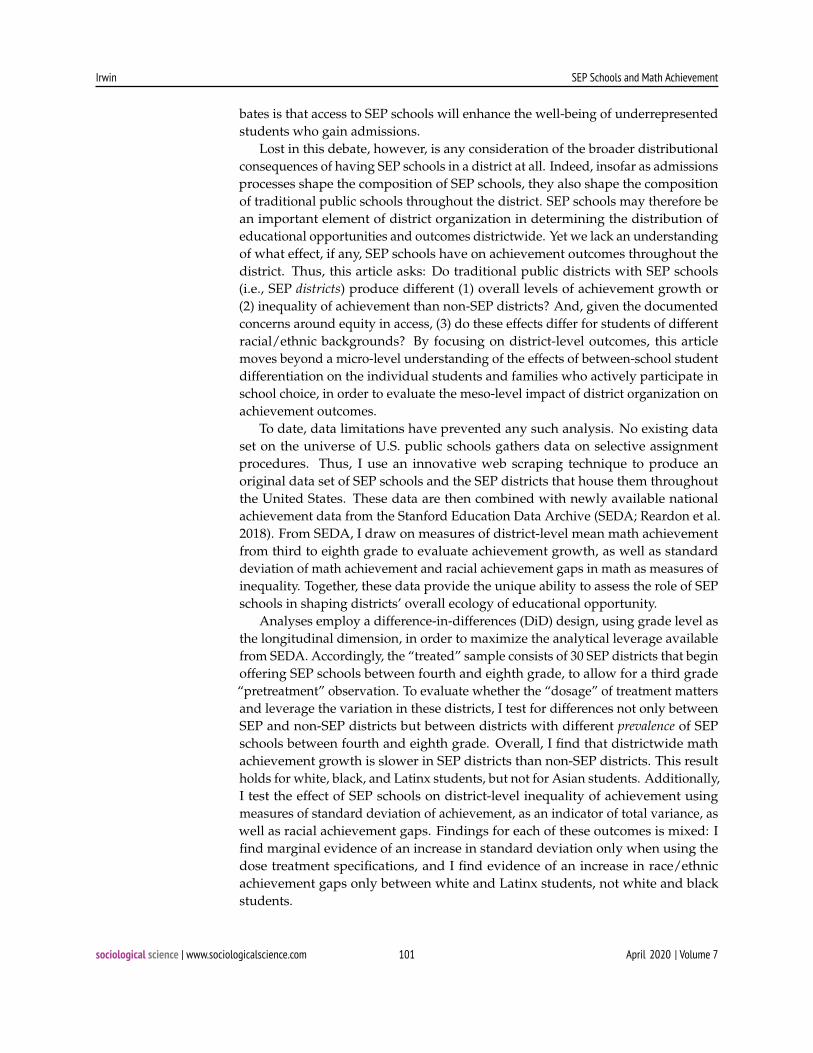
Student differentiation refers to the practice of sorting students into subgroups forinstructional purposes. The effect of student differentiation on achievement is thesubject of longstanding and unsettled debate in the sociology of education. Sørensen(1970) argued that one reason for this is the inadequacy of theory to identify specificmechanisms through which differentiation might have its effect. He thereforetheorized several dimensions of differentiation. In defining SEP schools, I aminterested specifically in two dimensions of student differentiation: (1) selectivity ofassignment procedures and (2) scope.1
SEP schools are unique in the public school sector in the United States in thatthey are both (1) selective in their assignment procedures and (2) high in scope. Se-lectivity refers to the degree of homogeneity the assignment procedure is intendedto produce in terms of students’ demonstrated performance or preparation. Scoperefers to the extent to which differentiation confines students to educational spacesshared only by students of the same educational subgroup. In other words, a schoolis more selective when the assignment procedure is enforced by gatekeepers on thebasis of academic criteria as opposed to student interest,2 and scope is higher whendifferentiation occurs at the level of the school rather than the classroom. Figure 1illustrates the position of several forms of student differentiation in the contextof public school choice, along these two dimensions. Specifically, SEP schools aredefined here as full schools, not within-school tracks or programs, that engage in re-ciprocal, that is, selective, choice on the basis of academic criteria.3 SEP schools rangein their level of selectivity, from requiring basic proficiency to gifted identification,and utilize admissions criteria that might include prior grades, writing samples,standardized testing, and/or specialized admissions exams. Although many SEPschools use a pure ranked admissions procedure, others enter all academicallyeligible students into a lottery.
Put simply, the “sector” of schools covered here is not a homogenous one, andit encompasses many kinds of learning environments.4 For analytic purposes,however, I restrict the definition of SEP schools to schools that are funded andmanaged by a central, “traditional” public school district (i.e., districts that include
sociological science | www.sociologicalscience.com 102 April 2020 | Volume 7
Irwin SEP Schools and Math Achievement
Figure 1: Defining SEP schools.
other traditional public schools with neighborhood-based catchment areas). This isessential to allow for the analysis of systemwide (here, district-level) achievementoutcomes. Students from throughout the district compete for admissions, andthe “brightest” students gain admission to the best schools, whereas the rest arerelegated to neighborhood schools. This results in a clearly tiered system, bolsteredby the guise of meritocracy, which might reasonably shape not only peer groupsbut also student exposure to expectations and resources throughout the district, keymechanisms theorized by Sørensen in the relationship between differentiation andstudent achievement. It is these whole districts, which I refer to as SEP districts, thatconstitute the educational systems of interest in the analyses below.
Selective Schools: Effects on Enrolled Students andRemaining Questions
Although no research has specifically studied SEP districts as such, there is atradition of research that investigates the impacts of academically selective schoolson the students they serve. Below, I summarize the key findings of this literature inorder to highlight the gaps that remain in our understanding of how these schoolsmay shape achievement throughout the broader education systems of which theyare a part.
One aim of academically selective schooling options, such as SEP schools, isunquestionably to enhance the potential of high-ability students. However, researchhas long complicated the notion that elite schools produce positive effects for theirstudents in terms of academic self-concept (Marsh 1988; Marsh and Hau 2003),
sociological science | www.sociologicalscience.com 103 April 2020 | Volume 7
Irwin SEP Schools and Math Achievement
attainment (Attewell 2001; Davis 1966; Espenshade, Hale, and Chung 2005), orachievement (Abdulkadiroglu, Angris, and Pathak 2014; Allensworth et al. 2016;Dobbie and Fryer, Jr. 2011). By definition, only a small proportion of students at anyschool can be “top of the class.” Research shows that occupying lower positionsin elite institutions—or being a “small frog in a large pond” (Davis 1966) can havenegative consequences for high-achieving students. For example, (relatively) lower-performing students in extremely high-performing settings are less likely to takeAdvanced Placement (AP) classes in high school (Attewell 2001) and tend to applyto lower-prestige jobs after college than students of similar demonstrated abilityin average institutions (Davis 1966). This, of course, is in addition to the fact thatclass rank itself can be of structural importance, as it is often considered duringthe admissions process at selective universities (e.g., Stevens 2007). As a result, thebenefits of attending “star” schools reflect a winner-take-all phenomenon wherebybenefits may only accrue to a very small number of students (Attewell 2001; Frankand Cook 1995).
More recently, scholars have conducted rigorous studies of the achievementeffects of public “exam schools”5 in Boston (Abdulkadiroglu et al. 2014), NewYork City (Abdulkadiroglu et al. 2014; Dobbie and Fryer, Jr. 2011), and Chicago(Allensworth et al. 2016) and grammar schools in the United Kingdom (Clark 2007).Using regression discontinuity designs, these studies find no important effect ofSEP schools on high school achievement among marginally admitted students. Itis important to consider, however, that marginally admitted SEP students may bethe least likely to benefit from SEP schools, not only in SEP schools themselvesbut throughout SEP districts. First, the fact that marginal admissions winners donot benefit from SEP schools by no means suggests that the same is true of the topachievers in these schools.6 Additionally, average-achieving students who get theopportunity to shine in traditional public schools because of the departure of SEPstudents may benefit from their relative star status. Importantly, such an effectwould also make it less likely to observe a relative advantage for marginally admittedSEP students, even if their outcomes do improve. Together, these possibilities raisethe question not only of SEP school effects on non–marginally admitted students,but of spillover effects at other schools throughout the district. The current articletherefore contributes to the growing body of research on SEP schools by offeringthe first evaluation of the districtwide effects of SEP schools.
To situate this contribution, I turn next to research on the system-level effects ofhigh scope (i.e., between-school) differentiation in the United States and selectivedifferentiation abroad to generate hypotheses for achievement outcomes in SEPdistricts in the United States.
Systemwide Effects of High-Scope Differentiation
No existing research, to my knowledge, has examined district-level effects of high-scope selective student differentiation in the United States. However, the prolif-eration of charter schools has motivated research on the effect of “competition”on traditional public school students. By law, charter schools are generally for-bidden from using academic criteria in their assignment procedures,7 but they
sociological science | www.sociologicalscience.com 104 April 2020 | Volume 7
Irwin SEP Schools and Math Achievement
produce between-school (high-scope) differentiation on the basis of organizational,instructional, or disciplinary preferences. Research has evaluated what effect char-ter “competition” has on traditional public districts, but evidence is mixed, withstudies finding positive (Booker et al. 2008; Jinnai 2014), negative (Ni 2009), or null(Zimmer and Buddin 2009) effects. Although these studies take the important stepof testing system-level outcomes, they face geographic limitations because charterschools typically constitute their own “district” and do not have strict geographicattendance boundaries. This makes it difficult to define the differentiated system ofwhich they are a part and is likely a contributing factor in producing such equivocalfindings.
In contrast to the charter literature, which is challenged by a lack of clear schoolsystem boundaries, stratification researchers evaluate the effect of selective schoolsystem differentiation at the national level, thereby precluding this issue. Scholarsin this field find that differentiated school systems are more likely to (re)produceinequality (Hanushek and Wößmann 2006; Pfeffer 2012; van de Werfhorst and Mijs2010) while also producing some evidence of lower average achievement (Hanushekand Wößmann 2006; Pfeffer 2012). Furthermore, studies find that the more rigidlysystems are differentiated, that is, the more difficult it is to switch between tracksonce sorted (Pfeffer 2008), and the earlier differentiation happens (Horn 2009), thegreater the inequality.
SEP districts can be considered relatively rigid in the American context becauseearning access to the top “track” in these districts is not a matter of changingclasses within a single comprehensive school, but rather of gaining admissions to aSEP school in a specific grade. Although SEP districts are certainly not as rigidlydifferentiated as countries like Germany8 (e.g., West and Nikolai 2013), for instance,they nevertheless present a contrast to what is otherwise considered a relativelyopen system throughout the United States. Based on this literature, then, we mightexpect SEP districts to demonstrate (1) higher inequality and (2) similar or perhapssomewhat lower levels of achievement than non-SEP districts.
Data and Analysis
Until now, the ability to answer the questions posed in this article has been limitedby two key data constraints: (1) the need for nationwide and nationally normeddistrict-level achievement data and (2) the need to identify SEP districts and schools.The first requirement has recently been met by SEDA, which normalizes annualstandardized test performance for students in grades 3 through 8 across districtsthroughout the United States. I personally address the second data requirement bygenerating an original list of SEP districts, which is the first of its kind to systemati-cally include primary schools, making it compatible with the SEDA achievementdata. With these data, I estimate DiD analyses of district-level average math achieve-ment and inequality of achievement between third and eighth grade, in SEP versusnon-SEP districts.
sociological science | www.sociologicalscience.com 105 April 2020 | Volume 7
Irwin SEP Schools and Math Achievement
SEP Districts and Schools: Independent Variable andSample Identification
No formal list of Selective Enrollment Public schools exists. Information regardingpublic school admissions criteria is not collected by the Common Core of Data (CCD)or Civil Rights Data Collection (CRDC), and the one national survey that collectsthis information—the Schools and Staffing Survey (SASS)—has a small sample andinsufficient detail for my purposes. Finn and Hockett (2012) begin the work ofdeveloping such a list but only include schools that grant high school diplomas.Thus, I collected original data and compiled my own list of SEP schools spanningthe full kindergarten to 12th grade range. To do this, I used the programminglanguage Python to conduct a systematic search for SEP schools by web scrapingpublic school district websites for information regarding admissions procedures.In order to limit my search to a feasible number of districts, I cast my originalnet to include the 400 largest school districts in the country, which serve at least20,000 students and can therefore a priori support high-scope (between-school)differentiation at both the primary and secondary levels. I then tested for saturationof my search in two ways: (1) first by expanding my list of districts to those with asfew as 12,000 students but with at least one magnet school (as a signal of a favorablepolicy environment towards between-school differentiation) and (2) by drawing onlists of member institutions from the International Baccalaureate (IB) organizationand the National Consortium of Specialized STEM Schools (NCSSS).
Before beginning the formal web scrape, I manually searched through approxi-mately 50 district websites to develop a sense of the language used to describe andprovide information about SEP schools. The web scrape then proceeded in threesteps. First, beginning from the home page of each district or school, I used thePython package BeautifulSoup to collect all of the links on the page and keep allthose that were internal to the site. I then used this expanded list of web pages andrepeated the procedure of extracting links, excluding duplicates. Second, I tookthis completed list of URLs and again used BeautifulSoup to search through them.This time, I searched the text on each page for a set of roughly 30 key words, suchas “admission,” “application,” “gifted,” and “entrance exam,” developed duringthe initial manual search (see Appendix A in the online supplement for full list ofkeywords). Finally, I exported the list of URLs for the pages with at least one keyword and searched through these web pages for evidence of SEP schools. Duringthis step, I extracted more than 400 documents, including primarily school choicehandbooks, statements of admissions procedures, and actual application materials,and qualitatively coded this information, as well as each relevant web page, forevidence of SEP schools.
As I combed through the district web pages that were flagged by my scrapingprocedure, I referenced Finn and Hockett’s (2012) list of exam schools,9 as well asschools reported by the CRDC to enroll at least 75 percent of their students in giftedprogramming. This served to draw my attention to places where my scrape mayhave failed and triggered me to make adjustments to the program. After fine-tuningmy search procedure using the original list of 400 districts serving at least 20,000students, I identified 87 districts with at least one SEP school. Following this, the
sociological science | www.sociologicalscience.com 106 April 2020 | Volume 7

Irwin SEP Schools and Math Achievement
saturation checks for medium size (12,000+) magnet districts and IB/NCSSS schoolsproduced only an additional three SEP districts to my list.
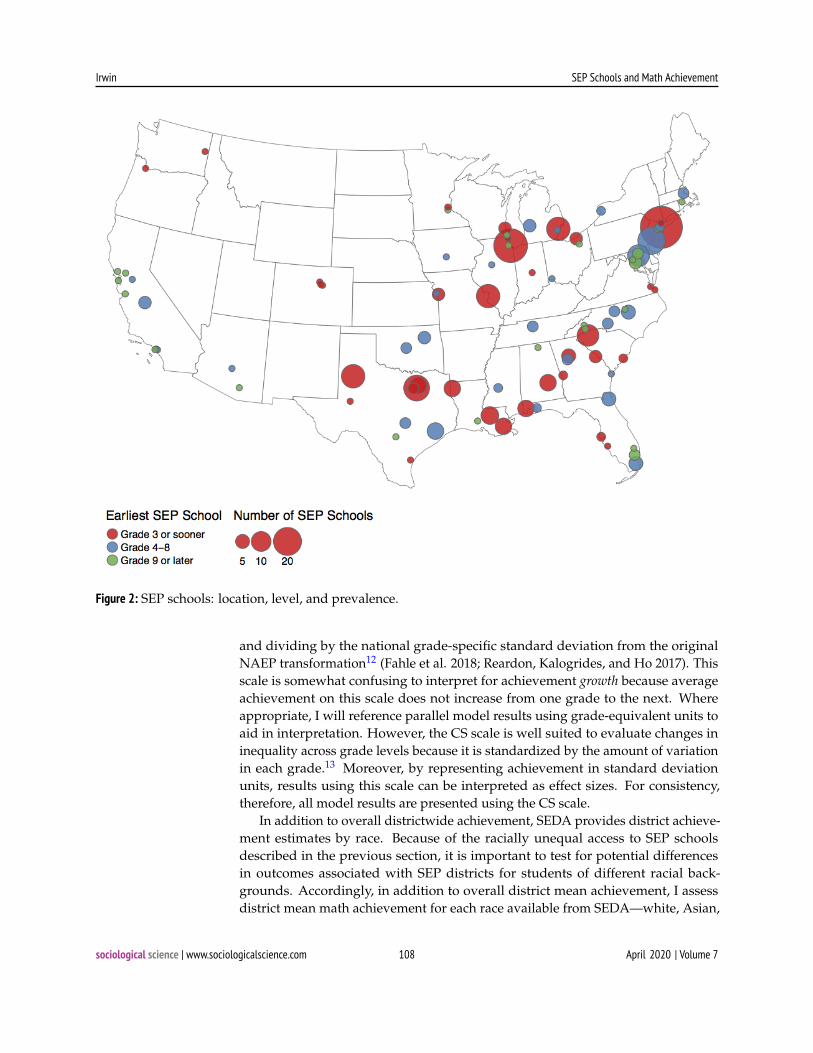
In total, this approach resulted in the identification of 370 SEP schools at allgrade levels across 90 districts. In light of the existing research, which focuses onhigh schools, it is noteworthy that my search identified a near-equal split betweenprimary and secondary SEP schools. SEP district locations and the grade level atwhich they are first offered are depicted in Figure 2. The average (median) SEPdistrict offers two SEP schools, at least one of which begins by fifth grade.10 There isa noticeable absence of SEP schools in the Great Plains and Mountain West, but thisis not surprising. Because schools in these regions often serve very large areas, anddistricts themselves may contain very few schools, the feasibility of between-schooldifferentiation is likely to be extremely limited. With this exception, SEP schoolsare geographically widespread throughout the country. This provides sufficient“treated” cases, as well as a reasonable pool of comparison districts, in the third toeighth grade range covered by SEDA.
The following analyses include 30 SEP districts that offer their first selectiveschool options between fourth and eighth grade, depicted in blue in Figure 2. Thesedistricts begin the “treatment” of high-scope selective differentiation for the firsttime during the grade range for which SEDA, discussed below, provides achieve-ment data.11 Across these schools, the population of SEP school students is 32percent white, 33 percent black, 16 percent Latinx, and 14 percent Asian. It is impor-tant to note, however, that although this appears to indicate an overrepresentationof black students relative to the national public school population, black studentsare actually underrepresented in SEP schools by 15 percent on average relative tothe student population in their home district. Latinx students are underrepresentedby 32 percent. By contrast, white students are overrepresented by 41 percent andAsian students by 167 percent. This reinforces local news reporting of underrep-resentation of black and Latinx students in SEP schools and suggests the need toinvestigate the possibility of differential districtwide achievement effects of SEPschools for students of different racial/ethnic backgrounds.
SEDA: Dependent Variable and Controls
The key dependent variables utilized here come from the district-level achievementmeasures in SEDA version 2.1 (Reardon et al. 2018). Every district in the UnitedStates is required to test students annually in grades 3 through 8 in math and En-glish/Language Arts (ELA) and report this achievement in the national EdFacts datasystem; however, states establish their own tests and proficiency levels. Reardonand colleagues compile district-level data from these tests (for 2009 to 2015) andbenchmark these against the National Assessment of Educational Progress (NAEP)by state, in order to create measures that are comparable for districts across states.This requires transforming achievement on state tests, which are often reportedas coarse proficiency categories, onto the continuous NAEP scale to generate esti-mates of both mean and standard deviation of achievement. After benchmarking toNAEP, SEDA then scales these estimates for interpretability. The following analysesuse the Cohort Standardized (CS) scale, which is calculated by mean-centering
sociological science | www.sociologicalscience.com 107 April 2020 | Volume 7
Irwin SEP Schools and Math Achievement
Figure 2: SEP schools: location, level, and prevalence.
and dividing by the national grade-specific standard deviation from the originalNAEP transformation12 (Fahle et al. 2018; Reardon, Kalogrides, and Ho 2017). Thisscale is somewhat confusing to interpret for achievement growth because averageachievement on this scale does not increase from one grade to the next. Whereappropriate, I will reference parallel model results using grade-equivalent units toaid in interpretation. However, the CS scale is well suited to evaluate changes ininequality across grade levels because it is standardized by the amount of variationin each grade.13 Moreover, by representing achievement in standard deviationunits, results using this scale can be interpreted as effect sizes. For consistency,therefore, all model results are presented using the CS scale.
In addition to overall districtwide achievement, SEDA provides district achieve-ment estimates by race. Because of the racially unequal access to SEP schoolsdescribed in the previous section, it is important to test for potential differencesin outcomes associated with SEP districts for students of different racial back-grounds. Accordingly, in addition to overall district mean achievement, I assessdistrict mean math achievement for each race available from SEDA—white, Asian,
sociological science | www.sociologicalscience.com 108 April 2020 | Volume 7
Irwin SEP Schools and Math Achievement
black, and Latinx—separately. I also examine inequality using SEDA’s measuresof white–black and white–Latinx math achievement gaps, which are constructedby differencing race-specific mean achievement. Descriptive statistics for thesevariables (pretreatment) are presented in Table 1.
Analytic Approach: Difference-in-Differences for Math Achievement
This article evaluates the effect of SEP schools on district-level mean and standarddeviation of math achievement. I focus on math achievement for three reasons.First, math is a better indicator of the effect of school interventions because mathis learned primarily in school, whereas language acquisition and reading skillsare more heavily reinforced in the home (Bryk and Raudenbush 1988; Burkam etal. 2004; Murnane 1975; Parcel and Dufur 2001). This is reflected in the fact thatsummer losses tend to be greater in math than in reading, and this is increasinglytrue as students progress through school (see Cooper et al. 1996 for review). Giventhe potentially diffuse effects of SEP schools on achievement throughout a district,it is prudent to focus on an outcome that is more tightly coupled with schooling.Second, over the period from third to eighth grade, math instruction itself alsobecomes more differentiated, with students progressing at different speeds—and indifferent learning groups—through subject areas like General Math, Pre-Algebra,Algebra, or even Geometry by the end of eighth grade. Although differentiation inEnglish/Language Arts certainly occurs, this tracking primarily distinguishes thepacing of classes—between “regular,” “honors,” or Gifted, for example—as opposedto distinct curricular content. Given the structure of these subjects during the focalgrade levels for the present analyses, then, we might expect SEP schools to exert amore direct influence on the organization of math instruction.14
To evaluate the relationship between district-level selective differentiation andstudent achievement outcomes in math, I deploy a DiD design using grade levelas the longitudinal dimension. DiD analyses compare the difference betweentreated and control units before treatment (the first difference) to their differenceafter treatment (the second difference) to estimate whether the change (if any) inthe treated units is distinguishable from that of the control units and thereforeattributable to treatment. Typically, treatments pertaining to policy changes ormedical trials, for example, begin in a particular month or year, such that the periods“pre” and “post” treatment are defined by standard time. This is not possible for thepresent analyses because the SEDA data are too new to measure achievement beforeSEP schools were founded. Instead, I use grade as the longitudinal dimension. Forthe case of SEP schools, I argue that this approach actually offers some advantagesover the traditional design. First, SEP schools are not the product of a targeted policyintervention that took effect in a single year, meaning that the particular temporalcontexts of their founding could have different implications for their immediateimpacts across districts. Moreover, whereas traditional longitudinal designs offer asingle observation of the point of treatment, using grade level as the longitudinaldimension means that I observe the transition into treatment up to seven times foreach SEP district in SEDA, which provides achievement data from 2009 to 2015. Byaveraging grade-level achievement across years, I am able to greatly reduce the
sociological science | www.sociologicalscience.com 109 April 2020 | Volume 7

Irwin SEP Schools and Math Achievement
Table 1: Pretreatment (third grade) dependent variables, averaged 2009 to 2015.
Range Non-SEP SEP Total
n 755 30 785Dependent variables, pretreatment (third grade)Mean achievementAll −1.310 1.127 −0.030 −0.209 −0.037White (n = 744) −0.801 1.259 0.247 0.195 0.245Black (n = 626) −1.189 0.286 −0.424 −0.502 −0.428Latinx (n = 739) −1.107 0.564 −0.260 −0.293 −0.261Asian (n = 539) −0.947 1.776 0.479 0.385 0.474Inequality of achievementStandard deviation 0.777 1.324 0.967 0.979 0.967White–black gap (n = 612) 0.097 1.680 0.693 0.698 0.693White–Latinx gap (n = 708) −0.108 1.434 0.506 0.488 0.506
Note: Non-SEP districts signifies all comparison districts, including future SEP districts.
risk that results are influenced by idiosyncratic shocks. Models, described below,therefore include one pretreatment (third grade) and one posttreatment (eighthgrade) observation per district.15
Drawing on the grade-level variation in the provision of SEP schools, I definethree treatment measures. First, I model treatment as a binary indicator of SEPdistrict status, where 1 indicates at least one SEP school present in the district duringthe observation period and 0 indicates none. Districts are only considered treatedif they offer their first SEP schools between fourth and eighth grade (n = 30), sothat third grade functions as a true pretreatment observation for all districts inthe analytic sample. Then, to test whether the “dosage” of treatment is important,I leverage the fact that different districts begin to offer SEP schools at differentgrade levels, and with greater or lesser prevalence. I operationalize the dosage oftreatment in two ways: (1) the number of grades between fourth and eighth withat least one SEP school, ranging from zero to five, and (2) the percentage of fourthto eighth grade students throughout the district enrolled in a SEP school (with aninterquartile range of 2 to 7 percent), based on enrollment data from the CRDC.In an ordinary least squares (OLS) regression framework, the effect of interest isoperationalized as the interaction between the relevant treatment measure andgrade level, as represented by β3 in the following equation.
Yig = α + βX ig + β1 postg + β2SEP_Disti + β3(SEPDisti × postg
)+ εig (1)
where Yig is the achievement outcome for district i in grade g; α is the intercept,which can be interpreted as the expected achievement outcome in third grade incomparison (i.e., non-SEP) districts; X ig is a set of mean-centered district- (grade-)level covariates; postg is an indicator for whether the observation occurs in eighthgrade (equal to 1 in eighth grade, 0 in third); SEP_Disti is one of three measures ofthe existence/prevalence of SEP schools in the given district, described above, andtakes on the same value in third and eighth grade for each district; and εig is the
sociological science | www.sociologicalscience.com 110 April 2020 | Volume 7
Irwin SEP Schools and Math Achievement
Huber–White heteroscedasticity-robust error term, clustered at the district level toaccount for nonindependence of errors at this level.16
Identification of a treatment effect in these models rests on the assumption that,in the absence of treatment, treated and control units would follow parallel trends.I address this assumption by carefully considering the definition of my treatmentand comparison groups. For the comparison group, I restrict to “peer” districts byincluding only districts with some form of (nonselective) high-scope differentiation,which I define as districts with at least five schools serving students in each gradebetween grades 4 and 8, at least one of which is a traditional magnet or charter.There are 772 such districts with math achievement data from SEDA. These districtspresent an analytically useful comparison group because they are most similar insize and structure to SEP districts. In this way, I am comparing SEP districts withthe districts they would be most likely to resemble in the absence of SEP schools.Although this necessarily limits the purview of the analysis and the conclusionsthat can be drawn from it, I argue that these bounds strategically sharpen the test ofthe mechanisms of interest—the scope and selectivity of student differentiation—intwo important ways. First, it avoids comparing SEP districts with districts thatlogically cannot support high-scope (between-school) differentiation by virtue oftheir small size.17 And second, by restricting the comparison sample to districtswith intradistrict school choice, I focus my analysis specifically on the selectivity ofhigh-scope differentiation.18
Still, selecting a strong comparison group does not fully address the assumptionof parallel trends. To this end, as mentioned above, I omit districts that beginoffering SEP schools before or during third grade. This reduces the likelihood ofdivergent trends emerging prior to the observation period—at least as a function oftreatment—but does not permit an empirical test of this assumption because of thelack of achievement data prior to third grade. Instead, I draw on the variation in thegrade level of treatment to generate a falsification test. Several SEP districts in mydata offer SEP schools for the first time during or after ninth grade. This means that,during the fourth to eighth grade observation window for the current analysis, thesedistricts are operating under a pretreatment district structure. Because these districtsare likely to be the most similar to the analytic treatment sample, they offer usefulleverage to evaluate the assumption that it is treatment itself, not the predispositionor preparation for treatment, that produces divergent trends between SEP districtsand comparison districts. Thus, in addition to the 30 treated SEP districts, analysesbelow include 22 future SEP districts. These future SEP districts enter the modelas an additional set of DiD terms, as expressed in Equation (2) below. In thissetup, the falsification test asks whether future SEP districts differ from non-SEPcomparison districts over the treatment period. In other words, confidence in theeffect measured by β3 is enhanced if β5 is not statistically significant.
Yig = α + βX ig + β1 postg + β2SEPDisti + β3(SEPDisti × postg
)+
β4FutureSEP_Disti + β5(FutureSEPDisti × postg) + εig(2)
Finally, each model includes a set of control variables (X ig), shown in Table 2.Control variables are the same in all models, with the exception of measures of
sociological science | www.sociologicalscience.com 111 April 2020 | Volume 7

Irwin SEP Schools and Math Achievement
Table 2: Control variables with third grade (pretreatment) descriptive statistics.
Data source Range Non-SEP SEP Totaln 755 30 785
Total expenditures (log) SEDA 8.742 10.488 9.307 9.391 9.310Total teachers (log) SEDA 4.137 10.303 6.750 7.949 6.796% free or reduced lunch (0–1) SEDA 0.038 0.962 0.490 0.656 0.496% black students (0–1) SEDA 0.000 0.978 0.160 0.366 0.168% Latinx students (0–1) SEDA 0.002 0.997 0.315 0.301 0.315% of students in charters (0–1) SEDA 0.000 0.500 0.180 0.252 0.18350/10 income ratio SEDA 1.731 9.925 3.820 4.165 3.834Urban (0/1) SEDA 0 1 0.405 0.800 0.420Rural (0/1) SEDA 0 1 0.113 0.000 0.108% of school-age children who are foreign born(0–1)
EDGE 0.000 0.202 0.047 0.062 0.047
% of school-age children in female-headedhouseholds
EDGE 0.009 0.646 0.283 0.373 0.287
% of school-age children in owner-occupiedhomes
EDGE 0.129 0.905 0.596 0.499 0.593
Average value of owner-occupied homes (log) EDGE 10.469 13.816 12.151 11.947 12.143Total school-age population (log) SEDA 6.913 13.559 9.870 11.089 9.917% of white 5–17-year-olds in poverty SEDA 0.000 0.579 0.124 0.163 0.125White 50/10 income ratio SEDA 1.098 17.680 3.649 4.039 3.664% of black 5–17-year-olds in poverty SEDA 0.000 1.000 0.300 0.359 0.302Black 50/10 income ratio SEDA 1.044 35.041 4.536 4.700 4.543% of Latinx 5–17-year-olds in poverty SEDA 0.000 1.000 0.284 0.356 0.286Latinx 50/10 income ratio SEDA 1.049 21.002 3.652 3.336 3.640Number of charters in geographic district SEDA 0.000 223.286 3.946 20.171 4.566
Note: In districts where schools offer “community coverage” for school lunches, meaning that 100 percent of students areprovided free lunches, SEDA imputes the percentage that would be eligible based on traditional eligibility requirements.
poverty and socioeconomic inequality, for which race-specific measures are usedin the models for race-specific district mean achievement. I include both percentblack and percent Latinx in all models to account for the percent of students fromracial/ethnic backgrounds that tend to be underserved by SEP schools (r = –0.347in analytic sample). Control variables from Census Education Demographic andGeographic Estimates (EDGE) are estimates for all school-aged children, regardlessof public enrollment status. This is useful because families’ choice to opt into orout of public schools may be influenced by whether the district offers SEP schools.All control variables are mean-centered in the models, besides urbanicity, which iscomposed of a set of binary variables (the reference category is suburban). Accord-ingly, model intercepts can be interpreted as the third grade math achievement in a(suburban) district with average characteristics.19
Where there is an insufficient number of students (fewer than 20) with reportedtest data, SEDA does not provide race-specific achievement data. This results in adifferent number of observations in models for different racial groups. Furthermore,SEDA does not produce the race-specific poverty and socioeconomic segregationcontrol measures for Asian students, so I rely on the full district measures for thisgroup. Finally, of the 772 comparison districts with math achievement data, 17 are
sociological science | www.sociologicalscience.com 112 April 2020 | Volume 7
Irwin SEP Schools and Math Achievement
missing covariate data and are dropped from the analytic sample. No SEP districtsare missing covariate data, resulting in a final analytic sample of 785 districts.
Results
Before turning to model results, I present a graphical depiction of grade-level mathachievement from third to eighth grade to establish the empirical phenomenon tobe explained. Figure 3 shows the raw (i.e., uncontrolled) trend in average mathachievement in SEP districts that begin offering SEP schools in fifth, sixth, or seventhgrade,20 as well as comparison districts. Overall, achievement in both SEP andcomparison districts appears relatively low (below zero on a mean-centered scale)and appears to be trending downward (in relative terms). Note that this trenddoes not imply negative absolute growth from one grade level to the next.21 Anadditional trend line is provided for smaller and/or undifferentiated districts (i.e.,“other” districts that are omitted from the analytic sample). This additional trendline demonstrates that, although comparison districts in the analytic sample arerelatively low achieving, their math achievement trajectory parallels that of districtsthroughout the United States. In other words, the apparent downward achievementtrend is an artifact of the SEDA scaling22 rather than a strange feature the analyticsample. The importance of Figure 3 lies in the relationship between these trendlines, not the specific slope of any individual line.
With this in mind, Figure 3 depicts relatively large drops in mean achievementat the grade level when SEP schools are first offered, with generally (but not always)flatter slopes at other grade levels. This could in part reflect an effect of schooltransitions, as research has shown that achievement tends to suffer initially whenstudents enter a new school, before bouncing back (Grigg 2012). However, althoughnearly all students in the United States experience a school transition between thirdand eighth grade, the overall math achievement trend is steeper and more negativein SEP districts than in comparison districts on average across grade levels, asillustrated by the green line. Furthermore, the orange line plots the best fit trendonly for district-grades in which SEP schools are not yet offered.23 This line showsthat before SEP districts begin to offer SEP schools, their achievement follows a verysimilar trend to comparison districts on average. This suggests that SEP schoolsmay indeed be implicated in the lower average math achievement growth in thesedistricts. By controlling for district characteristics and considering the prevalence ofSEP schools, the DiD regression models, below, further test whether this divergencein district math achievement is associated with the provision of SEP schools.
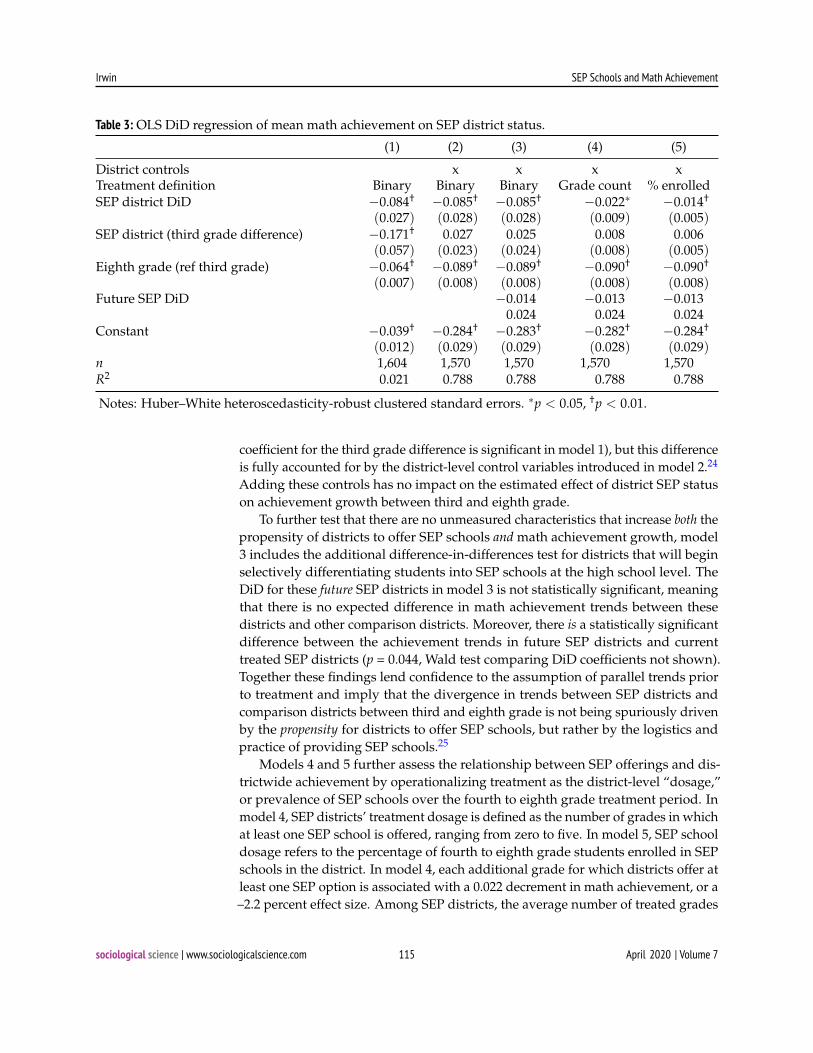
In each table below, the coefficient of interest is called “SEP District DiD.” Thisis the interaction term between a district’s SEP treatment status (or dosage) andwhether the observed achievement level is measured “pre” (third grade = 0) or “post”(eighth grade = 1) treatment. This is the additional difference between SEP andnon-SEP districts that arises between third and eighth grade, beyond any differencethat might have existed in third grade. Table 3 also includes coefficients for (1)the main effect of SEP district treatment status/dosage, which can be interpretedas the difference between treated and comparison districts in third grade, and (2)an indicator for eighth grade (third grade = 0, eighth grade = 1), which can be
sociological science | www.sociologicalscience.com 113 April 2020 | Volume 7

Irwin SEP Schools and Math Achievement
Figure 3: Grade-level achievement in SEP districts versus other districts. Note: For pretreatment SEP districtsample, the sample size at each grade level is as follows: third = 30, fourth = 27, fifth = 22, sixth = 8, seventh= 3.
interpreted as the expected change in non-SEP districts between third and eighthgrade. These coefficients are omitted from subsequent tables for brevity. Results forthe falsification test are represented as the coefficient for future SEP DiD.
Slowing Growth in SEP Districts
First, I examine the association between high-scope selective differentiation andachievement growth at the district level. Model 1 shows the uncontrolled modelwhere SEP district treatment is operationalized as a binary status. In this naïvemodel, the DiD coefficient is –0.084. Recall that, because achievement is measured instandard deviation units, this represents a –8.4 percent effect size. This translates tothe equivalent of nearly half a grade level less growth over the third to eighth gradeperiod in SEP districts relative to non-SEP districts (see Appendix B in the onlinesupplement for results using SEDA’s grade-equivalent scale). There is evidencethat SEP districts tend to be different from non-SEP districts prior to treatment (the
sociological science | www.sociologicalscience.com 114 April 2020 | Volume 7
Irwin SEP Schools and Math Achievement
Table 3: OLS DiD regression of mean math achievement on SEP district status.
(1) (2) (3) (4) (5)
District controls x x x xTreatment definition Binary Binary Binary Grade count % enrolledSEP district DiD −0.084† −0.085† −0.085† −0.022∗ −0.014†
(0.027) (0.028) (0.028) (0.009) (0.005)SEP district (third grade difference) −0.171† 0.027 0.025 0.008 0.006
(0.057) (0.023) (0.024) (0.008) (0.005)Eighth grade (ref third grade) −0.064† −0.089† −0.089† −0.090† −0.090†
(0.007) (0.008) (0.008) (0.008) (0.008)Future SEP DiD −0.014 −0.013 −0.013
0.024 0.024 0.024Constant −0.039† −0.284† −0.283† −0.282† −0.284†
(0.012) (0.029) (0.029) (0.028) (0.029)n 1,604 1,570 1,570 1,570 1,570R2 0.021 0.788 0.788 0.788 0.788
Notes: Huber–White heteroscedasticity-robust clustered standard errors. ∗p < 0.05, †p < 0.01.
coefficient for the third grade difference is significant in model 1), but this differenceis fully accounted for by the district-level control variables introduced in model 2.24
Adding these controls has no impact on the estimated effect of district SEP statuson achievement growth between third and eighth grade.
To further test that there are no unmeasured characteristics that increase both thepropensity of districts to offer SEP schools and math achievement growth, model3 includes the additional difference-in-differences test for districts that will beginselectively differentiating students into SEP schools at the high school level. TheDiD for these future SEP districts in model 3 is not statistically significant, meaningthat there is no expected difference in math achievement trends between thesedistricts and other comparison districts. Moreover, there is a statistically significantdifference between the achievement trends in future SEP districts and currenttreated SEP districts (p = 0.044, Wald test comparing DiD coefficients not shown).Together these findings lend confidence to the assumption of parallel trends priorto treatment and imply that the divergence in trends between SEP districts andcomparison districts between third and eighth grade is not being spuriously drivenby the propensity for districts to offer SEP schools, but rather by the logistics andpractice of providing SEP schools.25
Models 4 and 5 further assess the relationship between SEP offerings and dis-trictwide achievement by operationalizing treatment as the district-level “dosage,”or prevalence of SEP schools over the fourth to eighth grade treatment period. Inmodel 4, SEP districts’ treatment dosage is defined as the number of grades in whichat least one SEP school is offered, ranging from zero to five. In model 5, SEP schooldosage refers to the percentage of fourth to eighth grade students enrolled in SEPschools in the district. In model 4, each additional grade for which districts offer atleast one SEP option is associated with a 0.022 decrement in math achievement, or a–2.2 percent effect size. Among SEP districts, the average number of treated grades
sociological science | www.sociologicalscience.com 115 April 2020 | Volume 7
Irwin SEP Schools and Math Achievement
is three (i.e., SEP schools begin in sixth grade), meaning that this translates to anaverage expected decrement of 0.066, or the equivalent of approximately one-thirdof a grade level of learning (see model B3 in the online supplement). Similarly,model 5 estimates a growth penalty of 0.014 standardized achievement units foreach additional percentage of fourth to eighth grade students enrolled in a SEPschool. With an average SEP school enrollment of 4.77 percent in SEP districts, thisagain equates to an average effect size of –6.6 percent.
Overall, the estimated DiD coefficient for SEP districts is quite consistent acrossmodels in Table 3. However, note that although this increases confidence in therobustness of the result, it does not necessarily imply that SEP school dosage exertsa truly linear effect. Because of the relatively small number of treated districts (30),it is difficult to interrogate these relationships in detail. One possibility is that thesepatterns reflect a “tipping point” rather than a linear effect. For instance, estimatedeffects may be driven by districts with above-average prevalence of SEP schools(i.e., fourth to eighth grade district enrollment of 5 percent or higher). Additionalregressions, not shown, suggest that this may be the case. Such an effect is moredifficult to evaluate for the grade level of differentiation, because of clustering oftreatment onset at sixth grade. Nevertheless, these findings present a high degreeof confidence that a relationship exists between district provision of SEP schoolsand overall math achievement.
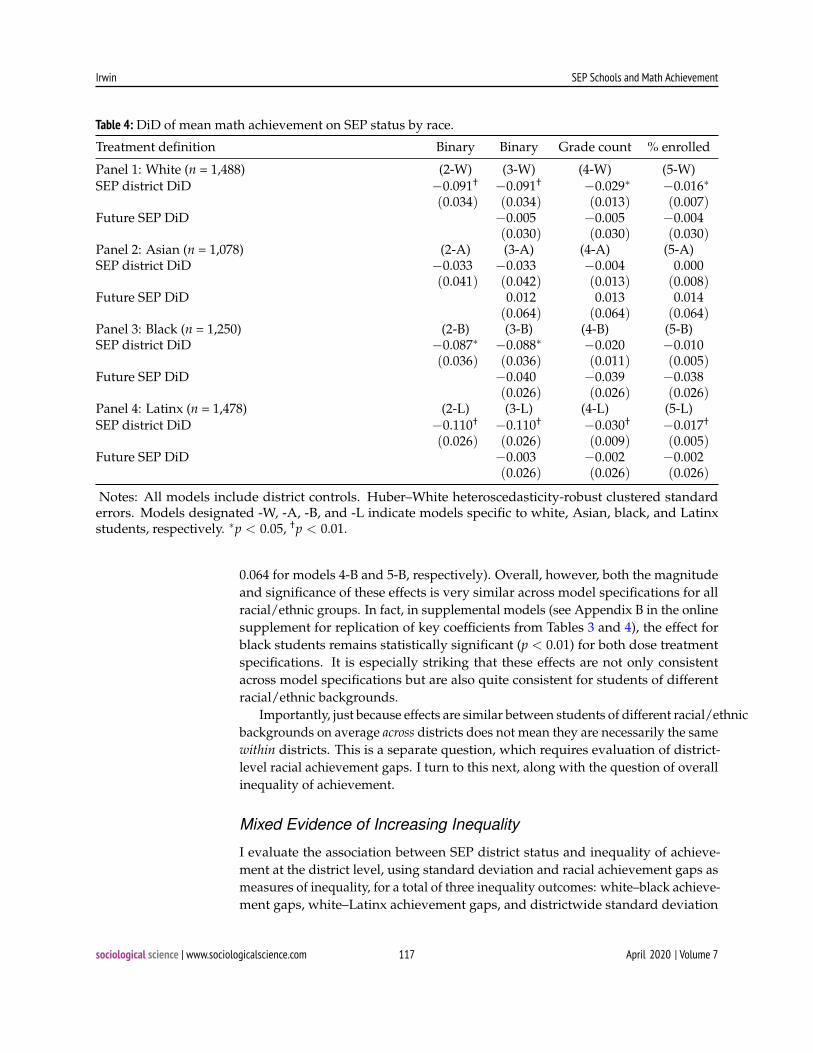
Race-Specific Achievement
Next, I test whether this effect differs by race. Each panel in Table 4 parallels models2 to 5 from Table 3 for a different racial/ethnic group. Where relevant, I will referto these models collectively as race-specific (RS) models. Models 2-W, 2-B, and2-L show that the provision of SEP schools is associated with lower levels of mathachievement growth for white, black, and Latinx students. The substantive story isthe same for each of these three racial/ethnic groups, although the relative effectsize appears somewhat larger for Latinx students (11 percent, compared with about9 percent for white and black students). Model 2-A shows no observed effect of SEPdistrict status on the math achievement of Asian students.
Like the pooled race models, models 3-RS include a second DiD test for districtsthat offer SEP school beginning in high school. Again, the coefficients for the futureSEP DiD are not significant. This suggests that it is unlikely that some predispositiontowards selective differentiation is spuriously driving the findings in this analysis.One important caveat is that, although the DiD for future SEP districts is not itselfsignificant for black students, it is also not statistically distinguishable from thetreated SEP DiD. This may suggest that some part of the achievement penalty forblack students in SEP districts begins to arise prior to treatment. I will return to thispossibility in the discussion.
Models 4-RS and 5-RS test the operationalization of treatment as continuousindicators of the prevalence of SEP schools throughout the district. For whiteand Latinx students, the average implied treatment effect over the third to eighthgrade period remains consistent and statistically significant. For black students, theestimated effect falls just below traditional levels of significance (p = 0.057 and p =
sociological science | www.sociologicalscience.com 116 April 2020 | Volume 7
Irwin SEP Schools and Math Achievement
Table 4: DiD of mean math achievement on SEP status by race.
Treatment definition Binary Binary Grade count % enrolled
Panel 1: White (n = 1,488) (2-W) (3-W) (4-W) (5-W)SEP district DiD −0.091† −0.091† −0.029∗ −0.016∗
(0.034) (0.034) (0.013) (0.007)Future SEP DiD −0.005 −0.005 −0.004
(0.030) (0.030) (0.030)Panel 2: Asian (n = 1,078) (2-A) (3-A) (4-A) (5-A)SEP district DiD −0.033 −0.033 −0.004 0.000
(0.041) (0.042) (0.013) (0.008)Future SEP DiD 0.012 0.013 0.014
(0.064) (0.064) (0.064)Panel 3: Black (n = 1,250) (2-B) (3-B) (4-B) (5-B)SEP district DiD −0.087∗ −0.088∗ −0.020 −0.010
(0.036) (0.036) (0.011) (0.005)Future SEP DiD −0.040 −0.039 −0.038
(0.026) (0.026) (0.026)Panel 4: Latinx (n = 1,478) (2-L) (3-L) (4-L) (5-L)SEP district DiD −0.110† −0.110† −0.030† −0.017†
(0.026) (0.026) (0.009) (0.005)Future SEP DiD −0.003 −0.002 −0.002
(0.026) (0.026) (0.026)
Notes: All models include district controls. Huber–White heteroscedasticity-robust clustered standarderrors. Models designated -W, -A, -B, and -L indicate models specific to white, Asian, black, and Latinxstudents, respectively. ∗p < 0.05, †p < 0.01.
0.064 for models 4-B and 5-B, respectively). Overall, however, both the magnitudeand significance of these effects is very similar across model specifications for allracial/ethnic groups. In fact, in supplemental models (see Appendix B in the onlinesupplement for replication of key coefficients from Tables 3 and 4), the effect forblack students remains statistically significant (p < 0.01) for both dose treatmentspecifications. It is especially striking that these effects are not only consistentacross model specifications but are also quite consistent for students of differentracial/ethnic backgrounds.
Importantly, just because effects are similar between students of different racial/ethnicbackgrounds on average across districts does not mean they are necessarily the samewithin districts. This is a separate question, which requires evaluation of district-level racial achievement gaps. I turn to this next, along with the question of overallinequality of achievement.
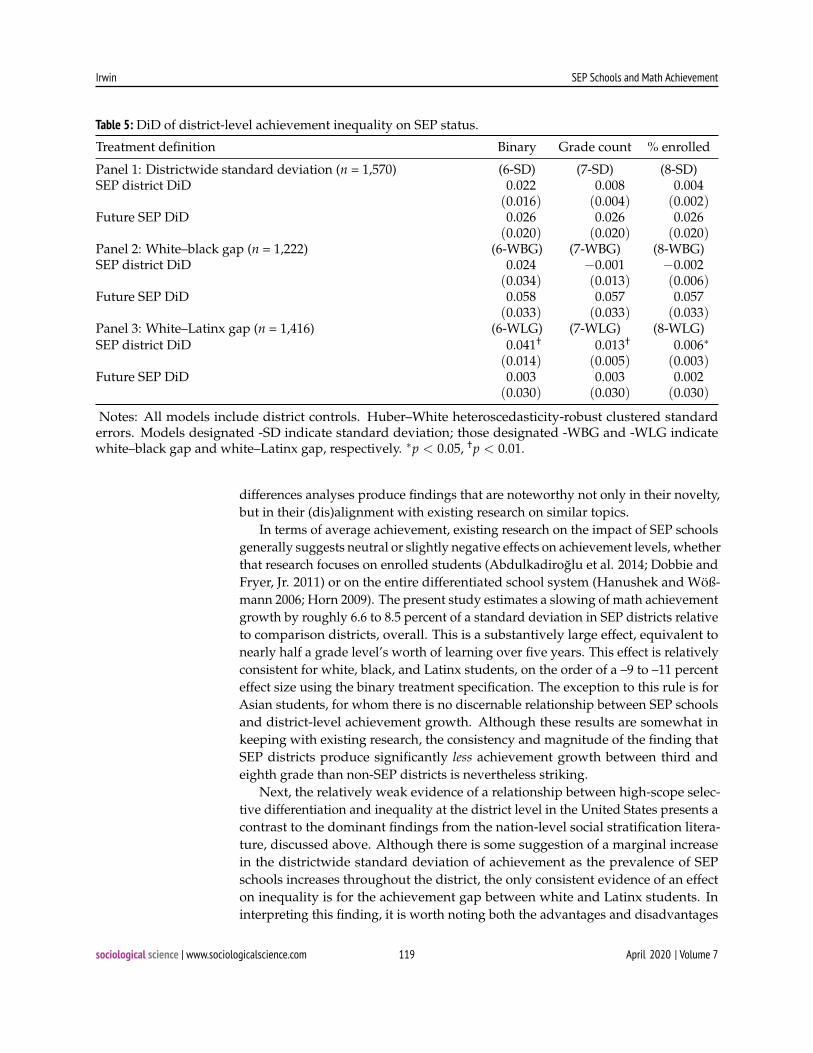
Mixed Evidence of Increasing Inequality
I evaluate the association between SEP district status and inequality of achieve-ment at the district level, using standard deviation and racial achievement gaps asmeasures of inequality, for a total of three inequality outcomes: white–black achieve-ment gaps, white–Latinx achievement gaps, and districtwide standard deviation
sociological science | www.sociologicalscience.com 117 April 2020 | Volume 7
Irwin SEP Schools and Math Achievement
of achievement. As a reminder, the scale used for these analyses is standardizedby the national grade-level standard deviation and therefore accounts for the totalamount of variation at each grade. Again, Table 5 includes models using both thebinary status and dose treatment measures of district provision of SEP schools.
Overall, findings regarding the association between SEP schools and district-level inequality of achievement are quite mixed. There is no evidence of an effectof SEP schools on standard deviation of achievement using the binary treatmentspecification in model 6-SD. However, there is marginal evidence of an increasein inequality when using the dose specifications. Model 7-SD predicts an averageeffect size of 2.4 percent (0.008 × 3), whereas model 8-SD predicts an average effectsize of 1.7 percent (0.003 × 4.77). These effects are relatively small compared withthe effects on average achievement and, again, achieve only marginal significance(p = 0.068 and p = 0.072, respectively). Nevertheless, it is interesting to note thedifference from Table 3, where greater significance was achieved using the binarythan the dose treatment specifications. This could suggest that the appropriatefunctional form (and perhaps the relevant mechanisms) are different for standarddeviation of achievement than for average achievement.
Additionally, there is mixed evidence of worsening racial/ethnic gaps. There isevidence that the achievement gap between white and Latinx students increasesbetween third and eighth grade in SEP districts relative to comparison districts.This effect is moderate in magnitude, on the order of a 4 percent effect size onaverage based on results from both model 6-WLG and 7-WLG. The average effectappears somewhat smaller, at about 2.9 percent (0.006 × 4.77) in model 8-WLG.For white and black students, by contrast, there is no evidence of a change in theachievement gap in SEP districts relative to comparison districts between thirdand eighth grade. Not only is the DiD nonsignificant, but the point estimate isactually negative (but essentially zero) in the dose treatment models. However, thefuture SEP DiD for black students is marginally significant (p = 0.079 to 0.087 acrosswhite–black achievement gap models) and positive. Although not too much shouldbe made of these coefficients themselves, this does suggest the need for cautionin interpreting results causally for black students and to consider the potential foreffects of “preparing” for differentiation, particularly for these students.
Discussion
This study is motivated by the fact that, to the extent that selective assignmentprocedures shape the educational experiences of students in SEP schools, theyalso shape the educational experiences of the students shut out of them. Ratherthan isolated institutions then, it is important to consider SEP schools as part ofa selectively differentiated school system—a SEP district. Accordingly, the intentof this article is to evaluate district-level achievement outcomes associated withhigh-scope (i.e., between-school) selective differentiation, rather than the effectof SEP schools on enrolled (or excluded) students separately. This question isnewly answerable by combining the district-level data available from SEDA withthe original list of SEP schools and SEP districts compiled here. Difference-in-
sociological science | www.sociologicalscience.com 118 April 2020 | Volume 7
Irwin SEP Schools and Math Achievement
Table 5: DiD of district-level achievement inequality on SEP status.
Treatment definition Binary Grade count % enrolled
Panel 1: Districtwide standard deviation (n = 1,570) (6-SD) (7-SD) (8-SD)SEP district DiD 0.022 0.008 0.004
(0.016) (0.004) (0.002)Future SEP DiD 0.026 0.026 0.026
(0.020) (0.020) (0.020)Panel 2: White–black gap (n = 1,222) (6-WBG) (7-WBG) (8-WBG)SEP district DiD 0.024 −0.001 −0.002
(0.034) (0.013) (0.006)Future SEP DiD 0.058 0.057 0.057
(0.033) (0.033) (0.033)Panel 3: White–Latinx gap (n = 1,416) (6-WLG) (7-WLG) (8-WLG)SEP district DiD 0.041† 0.013† 0.006∗
(0.014) (0.005) (0.003)Future SEP DiD 0.003 0.003 0.002
(0.030) (0.030) (0.030)
Notes: All models include district controls. Huber–White heteroscedasticity-robust clustered standarderrors. Models designated -SD indicate standard deviation; those designated -WBG and -WLG indicatewhite–black gap and white–Latinx gap, respectively. ∗p < 0.05, †p < 0.01.
differences analyses produce findings that are noteworthy not only in their novelty,but in their (dis)alignment with existing research on similar topics.
In terms of average achievement, existing research on the impact of SEP schoolsgenerally suggests neutral or slightly negative effects on achievement levels, whetherthat research focuses on enrolled students (Abdulkadiroglu et al. 2014; Dobbie andFryer, Jr. 2011) or on the entire differentiated school system (Hanushek and Wöß-mann 2006; Horn 2009). The present study estimates a slowing of math achievementgrowth by roughly 6.6 to 8.5 percent of a standard deviation in SEP districts relativeto comparison districts, overall. This is a substantively large effect, equivalent tonearly half a grade level’s worth of learning over five years. This effect is relativelyconsistent for white, black, and Latinx students, on the order of a –9 to –11 percenteffect size using the binary treatment specification. The exception to this rule is forAsian students, for whom there is no discernable relationship between SEP schoolsand district-level achievement growth. Although these results are somewhat inkeeping with existing research, the consistency and magnitude of the finding thatSEP districts produce significantly less achievement growth between third andeighth grade than non-SEP districts is nevertheless striking.
Next, the relatively weak evidence of a relationship between high-scope selec-tive differentiation and inequality at the district level in the United States presents acontrast to the dominant findings from the nation-level social stratification litera-ture, discussed above. Although there is some suggestion of a marginal increasein the districtwide standard deviation of achievement as the prevalence of SEPschools increases throughout the district, the only consistent evidence of an effecton inequality is for the achievement gap between white and Latinx students. Ininterpreting this finding, it is worth noting both the advantages and disadvantages
sociological science | www.sociologicalscience.com 119 April 2020 | Volume 7

Irwin SEP Schools and Math Achievement
of the present analyses relative to existing work. On the one hand, unlike thestratification literature, whose units of analysis are whole countries with distincteducational regimes, the present analysis has the advantage of observing SEP andnon-SEP districts within same states. This may allow the current study to betteraccount for other policies considered important to student achievement, such astesting standards and the inclusivity of (public) postsecondary education (Ayalonand Gamoran 2000; Kerckhoff 2001). On the other hand, the present study maybe limited by the fact that SEDA’s estimates of standard deviation rely heavilyon coarse proficiency categories, which might obscure achievement differencesat the extreme. Estimates of standard deviation may therefore be conservative.In other words, although these estimates present important improvements overexisting work, they also face important limitations that warrant investigation infuture research.
Another point of consideration around the analysis of inequality is that themeasures used here, particularly standard deviation of achievement, may obscuredifferences in the meaning of inequality in districts that have different average levelsof achievement. For instance, if mean achievement is high, then a relatively highstandard deviation may not in itself be “bad,” as it may simply imply exceptionallyhigh achievement among students at the top of the distribution. Similarly, the samewhite–minority achievement gap would signify different educational experiences ina district where average-achieving white students perform at the national averagecompared with one where they perform a full grade level above the mean. UsingSEDA’s standardized scaling helps to address issues of comparability by adjustingeach dependent variable using national grade-level standard deviations, but it doesnot address differences in districts’ average levels of achievement. Yet, even withthese differences and limitations, there is strong evidence of growing inequalitybetween white and Latinx students in SEP districts relative to non-SEP districts.Given that mean achievement is simultaneously decreasing in SEP districts, it isunlikely that this inequality could be characterized as a “good” thing.
These findings were produced with a unique DiD design that uses grade levelas the longitudinal dimension. This was a useful approach to extract analyticleverage from the data but also raised potential concerns based on the inabilityto evaluate pretreatment trends. This is important because a divergence betweenSEP and non-SEP districts prior to treatment might suggest unobserved differencesin districts that have the propensity to offer SEP schools, or perhaps that there issome effect of “preparing” for selective differentiation. If either were the case, wewould reasonably expect similar processes to characterize the trend in future SEPdistricts—those that have not begun offering SEP schools in the grade range ofthe current analysis but that offer SEP schools in high school. Analyses test thispossibility, and the estimated DiD coefficients for future SEP districts do not reachconventional levels of significance (p < 0.05) in any of the models presented above.Overall, then, analyses in this article present strong evidence of a slowing of mathachievement growth and a widening white–Latinx achievement gap in SEP districtsrelative to similar non-SEP districts.
Importantly, however, this DiD test for future SEP districts also raises somequestions about the effect of SEP districts on black students. Although future SEP
sociological science | www.sociologicalscience.com 120 April 2020 | Volume 7
Irwin SEP Schools and Math Achievement
status itself is not significantly predictive of math achievement growth relativeto comparison districts, there is overlap in the estimated growth trend for blackstudents in treated SEP and future SEP districts. Moreover, for the white–blackachievement gap, future treatment is marginally predictive (p < 0.1) of an increasein the achievement gap, whereas there is no evidence of a treatment effect of SEPdistricts from third to eighth grade. Rather than indicating something about thetype of district that offers SEP schools (i.e., a spurious effect, which would implyan effect in both current and future treated districts), this may imply an effect ofpreparation for selective differentiation. For instance, it could be that middle schoolsthat typically send very few of their students to SEP high schools are less proactiveabout preparing their students for the admissions process (or, vice versa—SEP“feeder” schools may be especially proactive), which could have spillovers forachievement on standardized tests. If there are systematic inequalities in who thesemiddle schools serve, whereby SEP feeder schools disproportionately underserveblack students, then this could result in relatively lower achievement outcomesfor black students prior to differentiation. In order to establish whether thesefindings may indeed be evidence of negative externalities in the preparation fordifferentiation, particularly for black students, future research must consider themechanisms through which the provision of SEP schools generate districtwideeffects.
Although the present study represents an important starting point in our un-derstanding of the potential spillover effects of SEP schools, made possible by twonew sources of data, the analyses here are still limited by their inability to identifythe mechanisms at work. SEP schools are likely to shape students’ educationalexperiences by shaping the peers they share classrooms with, the curricula taughtin those classrooms, and the expectations teachers hold for them, both for studentswho attend SEP schools and those who attend non-SEP schools in SEP districts.Importantly, only a very small percentage of students in SEP districts typicallyattend SEP schools. For neighborhood schools that serve primarily poor and mi-nority populations—for whom structural inequalities limit both information andpreparation for SEP school admissions—this may mean only a handful of studentsare lost to SEP schools. In other words, a direct peer effect from the composition ofstudents’ classrooms or schools may be unlikely. However, teacher expectationsfor their students may be broadly shaped by the district’s arbitrary definition of“bright” students. Districts may also make strategic decisions about how to allocateresources based on this process of student differentiation, perhaps concentratingcollege preparatory resources in a smaller number of schools. Such mechanisms aredifficult to measure with the national data sets, like the Civil Rights Data Collec-tion or Common Core of Data, particularly at the primary level.26 Future researchshould consider these and other mechanisms in order to better understand therelationship between SEP schools and district-level outcomes.
Finally, it is important to acknowledge that SEP schools currently operate undera system of unequal opportunity. Under these less-than-ideal conditions, SEPdistricts may not be producing their best potential outcomes for achievement growthand inequality. Of course, achieving equal access is no doubt a sticky issue (e.g.,Orfield and Ayscue 2018), and the likelihood of positive results under such a
sociological science | www.sociologicalscience.com 121 April 2020 | Volume 7

Irwin SEP Schools and Math Achievement
regime is made somewhat questionable by the evidence from this study that SEPschools currently hinder average districtwide achievement growth even amongwhite students, who tend to be overrepresented in SEP schools. However, this articlefar from closes the debate on the merits of SEP schools. Rather, it highlights thatthe effects of these schools should not be sought solely among choice participants.This, in turn, should motivate continued research on the conditions under whichSEP schools are founded, the place they occupy in district-level processes, and themechanisms through which they exert their effects.
Notes
1 Other important dimensions, according to Sørensen, are inclusiveness and whether dif-ferentiation is horizontal or vertical. Inclusiveness refers to the number of opportunitiesavailable at a given level of schooling (i.e., K-8 education) and is of little analytic valuehere, because schooling is compulsory in the United States until students are 16. Verticaldifferentiation reduces variation in students’ presumed capacity to learn course content,whereas horizontal differentiation reduces the variation in the content delivered in aparticular course setting. These latter concepts overlap significantly with the selectivityof assignment procedures.
2 Sørensen’s framework defines electivity—the extent to which subgroup placement is achoice for students—as a distinct characteristic of assignment procedure. In theory, anelective process could produce a homogenous (i.e., select) group. In practice, however,when assignment is not purely the prerogative of students, this either results in or is theresult of selective criteria.
3 As distinct from schools for the performing arts that use auditions or portfolios.
4 These schools are referred to by many different names by their operating districts,including selective enrollment schools, specialized schools, exam schools, criteria schools,and so on. Notably, some of these schools are designated as magnets, whereas othersare not. Magnets are public schools that offer specialized programs intended to attractstudents from throughout a district. Canonically, these programs are designed to fosterintegration and do not use admissions criteria (Fuller and Elmore 1996; Wells 1993).Variation in magnet status among SEP schools may therefore reflect different levels ofemphasis on student integration associated with these schools.
5 Exam schools are a specific subtype of SEP schools that utilize exam scores as the sole(or primary) criterion in their admissions process.
6 Some research has attempted to estimate effects for SEP students further from the marginand reaches similar conclusions about the weak effect of SEP schools on enrolled students(Angrist and Rokkanen 2015).
7 However, academic self-selection into charter schools is possible.
8 That is, traditional public school students in SEP districts are not structurally precludedfrom selective four-year colleges, as is the case for vocational school students in Germany.
9 My list differs significantly from Finn and Hockett’s because (1) they only includeschools that offer high school diplomas, whereas mine includes primary schools, and (2)they include several schools run at the state level or by district consortia, which I omit tofacilitate district-level analysis. However, this filter is only relevant at the high schoollevel and does not factor into the sample for the current article.
sociological science | www.sociologicalscience.com 122 April 2020 | Volume 7
Irwin SEP Schools and Math Achievement
10 The mean number of SEP schools offered in SEP districts is 4.2. This differs significantlyfrom the median because of the large number of SEP schools offered in very largedistricts, namely, Philadelphia, Dallas, Chicago, and New York City. However, all butPhiladelphia begin differentiating students before third grade and are therefore excludedfrom these analyses.
11 Note that this grade-level restriction pertains to the analytic sample, only, and did notfactor into the design of the web scrape procedure to identify SEP schools.
12 At each grade level, every cohort is mean-centered and standardized relative to a singlecohort (at the appropriate grade level) to allow for analysis of absolute differences inachievement levels over time. The reference cohort is the cohort that participated inNAEP in fourth grade in 2009.
13 SEDA provides an additional scale, called the Grade Cohort Scale (GCS), which isstandardized relative to the change in NAEP scores from one grade to the next, eachwithin a given cohort. This scale produces grade-equivalent units, which increasefrom an average of 3 for students achieving at grade level in third grade to 8 in eighthgrade. On this scale, the average standard deviation of math achievement increases witheach grade level, making it somewhat difficult to compare inequality between pre- andposttreatment. For questions of achievement growth, however, the GCS is quite usefulbecause scores increase by approximately one unit with each additional grade, providingan intuitive measurement for achievement growth. Models for achievement growth arereplicated in Appendix C of the online supplement using the GCS scale.
14 Because of this tracking structure, it also is easier to identify advanced coursework inmath than in reading using available national data. In fact, although the CRDC providesrelatively detailed information on mathematics courses, beginning with Algebra inseventh grade, it contains no information about English courses. This information onstudent participation in advanced coursework is tested as a mediator in Appendix B ofthe online supplement.
15 Averaging across years also avoids the issue of states with missing data in eighth gradefor multiple years because of the use of end-of-course (as opposed to end-of-year) tests,which could therefore not be benchmarked to state-level NAEP scores. For instance,California has only one year of complete eighth grade data and Texas only two (out ofseven), so running regressions with one observation for each year could importantlyunderweight these large states.
16 Additionally, to account for potential state-level differences in proficiency standards orother policies that may influence student test outcomes, models are estimated with statefixed effects by including a state indicator as a factor variable in the models, representing42 states and the District of Columbia; I set the largest state—California—to be the basecategory.
17 In addition to being substantively meaningless to attribute achievement differences ina district with one school to the lack of SEP schools, these small districts, if included,would also receive disproportionate weight by virtue of the district-level structure of theanalysis.
18 Additional analyses, not shown, define the comparison group solely by district size andproduce substantively similar results.
19 Such an “average” district may be more or less typical for students of different racialbackgrounds.
20 Three districts each begin offering SEP schools in fourth and eighth grade. Individualtrend lines for these sets of districts are omitted to avoid overcrowding the graph, butthey are included in the average lines of best fit.
sociological science | www.sociologicalscience.com 123 April 2020 | Volume 7
Irwin SEP Schools and Math Achievement
21 Rather, it may imply relatively faster growth in NAEP-participating cohort, againstwhich other cohorts in the data were standardized, producing an artifact of relativelyslower growth overall.
22 This downward trend from one grade to the next persist for all cohorts except thereference cohort of 2009 fourth grade NAEP participants. This suggests there is someartifact of benchmarking other cohorts against this cohort that produces this trend. Thisartifact is unique to this cohort-mean-standardized scale and does not affect modelresults. Results for models using the grade-equivalent scale (which increases one unitper grade level on average) are presented in Appendix B of the online supplement.
23 That is, there is a diminishing sample from one grade to the next, with 30 in third gradeand only three districts that are still “pretreatment” by seventh grade.
24 Note that in Appendix B of the online supplement, which presents model results usingthe GCS (grade-equivalent) scale, the difference between SEP and comparison districts inthird grade remains significant in models 2 to 5. It is possible that the collinearity betweengrade level itself and the GCS scale may artificially produce this relationship. However,this does not affect the DiD coefficients, which are consistent both in significance andrelative effect size in models using the GCS and CS scale.
25 By examining districts that are likely to be most similar to the treated districts in thisanalysis, this test also provides reassurance that results are not likely to be significantlyaffected by the omission of any districts that the scrape may have failed to identify.
26 Appendix C of the online supplement provides results for an attempt at such a mediationanalysis, using available data from the CRDC and SEDA—(1) the percentage of studentsin the district attending a school where Algebra is offered in seventh grade, as an indicatorof the (un)evenness of curricular rigor throughout the districts, and (2) student exposureto low-income peers, based on free and reduced price lunch status, as an indicator ofthe concentration of exposure to more/less privileged peers. Information on advancedmath courses is the only available data on curricular differentiation from the CRDC priorto high school. One might reasonably expect a school’s advanced math offerings to bedirectly shaped by its selective standing within a district, and for that in turn to shapemath achievement, making it a reasonable mediator. Likewise, SEP schools might shapethe distribution of more/less privileged students throughout the district, in turn shapingthings like PTA resources or teacher expectations at different schools, which might thenshape achievement. Student socioeconomic segregation is therefore perhaps more anindicator of other mechanisms than a true mediator in itself.
References
Abdulkadiroglu, Atila, Joshua D. Angrist, and Parag A. Pathak. 2014. “The Elite Illusion:Achievement Effects at Boston and New York Exam Schools.” Econometrica 82(1):137–96.https://doi.org/10.3982/ECTA10266.
Allensworth, Elaine M., Paul T. Moore, Lauren Sartain, and Marisa de la Torre. 2017. “TheEducational Benefits of Attending Higher Performing Schools: Evidence from ChicagoHigh Schools.” Educational Evaluation and Policy Analysis 39(2):175–97. https://doi.org/10.3102/0162373716672039.
Angrist, Joshua D., and Miikka Rokkanen. 2015. “Wanna Get Away? Regression Discontinu-ity Estimation of Exam School Effects Away from the Cutoff.” Journal of the American Statis-tical Association 110(512):1331–44. https://doi.org/10.1080/01621459.2015.1012259.
sociological science | www.sociologicalscience.com 124 April 2020 | Volume 7

Irwin SEP Schools and Math Achievement
Attewell, Paul. 2001. “The Winner-Take-All High School: Organizational Adaptations toEducational Stratification.” Sociology of Education 74(4):267–95. https://doi.org/10.2307/2673136.
Ayalon, Hanna, and Adam Gamoran. 2000. “Stratification in Academic Secondary Programsand Educational Inequality: Comparisons of Israel and the United States.” ComparativeEducation Review 44(1):54–80. https://doi.org/10.1086/447591.
Booker, Kevin, Scott M. Gilpatric, Timothy Gronberg, and Dennis Jansen. 2008. “The Effectof Charter Schools on Traditional Public School Students in Texas: Are Children WhoStay Behind Left Behind?” Journal of Urban Economics 64(1):123–45. https://doi.org/10.1016/j.jue.2007.10.003.
Bryk, Anthony S., and Stephan W. Raudenbush. 1988. “Toward a More Appropriate Con-ceptualization of Research on School Effects: A Three-Level Hierarchical Linear Model.”American Journal of Education 97(1):65–108. https://doi.org/10.1086/443913.
Burkam, David T., Douglas D. Ready, Valerie E. Lee, and Laura F. LoGerfo. 2004. “Social-Class Differences in Summer Learning between Kindergarten and First Grade: ModelSpecification and Estimation.” Sociology of Education 77(1):1–31. https://doi.org/10.1177/003804070407700101.
Clark, Damon. 2010. “Selective Schools and Academic Achievement.” B.E. Journal of EconomicAnalysis & Policy 10(1):1917. https://doi.org/10.2202/1935-1682.1917.
Cooper, Harris, Barbara Nye, Kelly Charlton, James Lindsay, and Scott Greathouse. 1996.“The Effects of Summer Vacation on Achievement Test Scores: A Narrative and Meta-Analytic Review.” Review of Educational Research 66(3):227–68. https://doi.org/10.3102/00346543066003227.
Davis, James A. 1966. “The Campus as a Frog Pond: An Application of the Theory ofRelative Deprivation to Career Decisions of College Men.” American Journal of Sociology72(1):17–31.https://doi.org/10.1086/224257.
Dobbie, Will, and Roland G. Fryer, Jr. 2011. Exam High Schools and Academic Achievement:Evidence from New York City. Working Paper No. 17286, National Bureau of EconomicResearch. https://doi.org/10.3386/w17286.
Ebbert, Stephanie. 2016. “Testing Program to Expand, Increase Latin School Access.” BostonGlobe, April 27.
Espenshade, Thomas J., Lauren E. Hale, and Chang Y. Chung. 2005. “The Frog PondRevisited: High School Academic Context, Class Rank, and Elite College Admission.”Sociology of Education 78(4):269–93. https://doi.org/10.1177/003804070507800401.
Fahle, Erin, Benjamin Shear, Demetra Kalogrides, Sean Reardon, Richard DiSalvo, andAndrew Ho. 2018. Stanford Education Data Archive: Technical Documentation. Version 2.1.
Finn, Chester E., Jr., and Jessica A. Hockett. 2012. Exam Schools: Inside America’s Most SelectivePublic High Schools. Princeton, NJ: Princeton University Press. https://doi.org/10.1515/9781400844579.
Frank, Robert H., and Philip J. Cook. 1995. The Winner-Take-All Society: Why the Few at the TopGet So Much More Than the Rest of Us. New York, NY: Random House.
Fuller, Bruce, and Richard Elmore, eds. 1996. Who Chooses? Who Loses? Culture, Institutionsand the Unequal Effects of School Choice. New York, NY: Teachers College Press.
Gay, Malcolm. 2019. “The Valedictorians Project: Part 3. The Race to Get into Boston’s ExamSchools.” The Boston Globe, January 17.
Grigg, Jeffrey. 2012. “School Enrollment Changes and Student Achievement Growth: A CaseStudy in Educational Disruption and Continuity.” Sociology of Education 85(4):388–404.https://doi.org/10.1177/0038040712441374.
sociological science | www.sociologicalscience.com 125 April 2020 | Volume 7

Irwin SEP Schools and Math Achievement
Hanushek, Eric A., and Ludger Wößmann. 2006. “Does Educational Tracking Affect Perfor-mance and Inequality? Differences-in-Differences Evidence across Countries.” EconomicJournal 116(510):C63–76. https://doi.org/10.1111/j.1468-0297.2006.01076.x.
Horn, Daniel. 2009. “Age of Selection Counts: A Cross-Country Analysis of EducationalInstitutions.” Educational Research and Evaluation 15(4):343–66. https://doi.org/10.1080/13803610903087011.
Irizarry, Yasmiyn. 2017. “Commentary: Healing Won’t Begin until LASA Represents All ofAustin ISD.” Statesman, February 24.
Jinnai, Yusuke. 2014. “Direct and Indirect Impact of Charter Schools’ Entry on TraditionalPublic Schools: New Evidence from North Carolina.” Economics Letters 124(3):452–6.https://doi.org/10.1016/j.econlet.2014.07.016.
Kerckhoff, Alan C. 2001. “Education and Social Stratification Processes in ComparativePerspective.” Sociology of Education 74(Extra):3–18. https://doi.org/10.2307/2673250.
Marsh, Herbert W. 1991. “Failure of High-Ability High Schools to Deliver Academic BenefitsCommensurate with Their Students’ Ability Levels.” American Educational Research Journal28(2):445–80. https://doi.org/10.3102/00028312028002445.
Marsh, Herbert W., and Kit Tai Hau. 2003. “Big-Fish-Little-Pond Effect on AcademicSelf-Concept: A Cross-Cultural (26-Country) Test of the Negative Effects of Academi-cally Selective Schools.” American Psychologist 58(5):364–76. https://doi.org/10.1037/0003-066X.58.5.364.
Murnane, Richard. 1975. The Impact of School Resources on Learning of Inner City Children.Cambridge, MA: Ballinger.
Ni, Yongmei. 2009. “The Impact of Charter Schools on the Efficiency of Traditional PublicSchools: Evidence from Michigan.” Economics of Education Review 28(5):571–84. https://doi.org/10.1016/j.econedurev.2009.01.003.
Orfield, Gary, and Jennifer B. Ayscue, eds. 2018. Discrimination in Elite Public Schools:Investigating Buffalo. New York, NY: Teachers College Press.
Parcel, Toby L., and Mikaela J. Dufur. 2001. “Capital at Home and at School: Effects onStudent Achievement.” Social Forces 79(3):881–911. https://doi.org/10.1353/sof.2001.0021.
Pfeffer, Fabian T. 2008. “Persistent Inequality in Educational Attainment and Its InstitutionalContext.” European Sociological Review 24(5):543–65. https://doi.org/10.1093/esr/jcn026.
Pfeffer, Fabian T. 2012. Equality and Quality in Education. Research Report 12-774, PopulationStudies Center.
Reardon, Sean. F., Andrew D. Ho, Benjamin R. Shear, Erin M. Fahle, Demetra Kalogrides,and Richard DiSalvo. 2018. Stanford Education Data Archive. Version 2.1.
Reardon, Sean F., Demetra Kalogrides, and Andrew Ho. 2017. “Linking U.S. School DistrictTest Score Distributions to a Common Scale.” Working Paper No. 16-09, Stanford Centerfor Education Policy Analysis.
Rey, Jay. 2017. “African–American Enrollment Dips at City Honors, Despite Efforts to CorrectDisparity.” Buffalo News, September 26.
Sørensen, Aage Bøttger. 1970. “Organizational Differentiation of Students and EducationalOpportunity.” Sociology of Education 43(4):355–76. https://doi.org/10.2307/2111838.
Stevens, Mitchell L. 2007. “Creating a Class: College Admissions and the Education of Elites.”Cambridge, MA: Harvard University Press.
sociological science | www.sociologicalscience.com 126 April 2020 | Volume 7

Irwin SEP Schools and Math Achievement
van de Werfhorst, Herman G., and Jonathan J. B. Mijs. 2010. “Achievement Inequality andthe Institutional Structure of Educational Systems: A Comparative Perspective.” AnnualReview of Sociology 36:407–28. https://doi.org/10.1146/annurev.soc.012809.102538.
Wells, Amy Stuart. 1993. Time To Choose: America at the Crossroads of School Choice Policy. EastRutherford, NJ: Putnam Publishing Group.
West, Anne, and Rita Nikolai. 2013. “Welfare Regimes and Education Regimes: Equality ofOpportunity and Expenditure in the EU (and US).” Journal of Social Policy 42(3):469–93.https://doi.org/10.1017/S0047279412001043.
Zimmer, Ron, and Richard Buddin. 2009. “Is Charter School Competition in CaliforniaImproving the Performance of Traditional Public Schools?” Public Administration Review69(5):831–45. https://doi.org/10.1111/j.1540-6210.2009.02033.x.
Acknowledgments: I thank Samuel Lucas, Daniel Schneider, Anthony Jack, and ZawadiRucks-Ahidiana for their thoughtful comments. This work also benefited from excel-lent feedback at the Improving Education and Reducing Inequality Conference at theRussell Sage Foundation and was supported by funding from Russell Sage FoundationGrant #83-18-14.
Véronique Irwin: Department of Sociology, University of California, Berkeley. E-mail:[email protected].
sociological science | www.sociologicalscience.com 127 April 2020 | Volume 7