Embed Size (px)
Citation preview
Enhancing the rheological performance of wheat flourdough with glucose oxidase, transglutaminase orsupplementary glutenMeerts, Mathieu; Van Ammel, Helene; Meeus, Yannick; Van Engeland, Sarah; Cardinaels,R.M.; Oosterlinck, Filip; Courtin, Christophe M.; Moldenaers, PaulaPublished in:Food and Bioprocess Technology
DOI:10.1007/s11947-017-1986-0
Published: 01/12/2017
Document VersionAccepted manuscript including changes made at the peer-review stage
Please check the document version of this publication:
• A submitted manuscript is the author's version of the article upon submission and before peer-review. There can be important differencesbetween the submitted version and the official published version of record. People interested in the research are advised to contact theauthor for the final version of the publication, or visit the DOI to the publisher's website.• The final author version and the galley proof are versions of the publication after peer review.• The final published version features the final layout of the paper including the volume, issue and page numbers.
Link to publication
Citation for published version (APA):Meerts, M., Van Ammel, H., Meeus, Y., Van Engeland, S., Cardinaels, R., Oosterlinck, F., ... Moldenaers, P.(2017). Enhancing the rheological performance of wheat flour dough with glucose oxidase, transglutaminase orsupplementary gluten. Food and Bioprocess Technology, 10(12), 2188-2198. DOI: 10.1007/s11947-017-1986-0
General rightsCopyright and moral rights for the publications made accessible in the public portal are retained by the authors and/or other copyright ownersand it is a condition of accessing publications that users recognise and abide by the legal requirements associated with these rights.
• Users may download and print one copy of any publication from the public portal for the purpose of private study or research. • You may not further distribute the material or use it for any profit-making activity or commercial gain • You may freely distribute the URL identifying the publication in the public portal ?
Take down policyIf you believe that this document breaches copyright please contact us providing details, and we will remove access to the work immediatelyand investigate your claim.
Download date: 16. Sep. 2018
Food and Bioprocess Technology manuscript No.(will be inserted by the editor)
Enhancing the rheological performance of wheat flour doughwith glucose oxidase, transglutaminase or supplementarygluten
Mathieu Meerts · Helene Van Ammel ·Yannick Meeus · Sarah Van Engeland · RuthCardinaels · Filip Oosterlinck · Christophe M.Courtin · Paula Moldenaers
Received: date / Accepted: date
Abstract The enzymes glucose oxidase and transglutaminase are frequently used toimprove the breadmaking performance of wheat flours, as they have the ability toconsiderably alter the viscoelastic nature of the gluten network. To evaluate a flour’sbreadmaking performance, rheological tests offer an attractive framework. In thisstudy, the rheological impact of adding glucose oxidase or transglutaminase to wheatflour dough is investigated by means of linear oscillatory shear tests, creep-recoveryshear tests and startup extensional tests. The former tests reveal that the enzymes ren-der the dough stiffer and enhance its elastic character, until saturation is reached. Inthe breadmaking process, the use of excessive amounts of enzyme is known to becounterproductive. The strain-hardening index clearly reveals this overcross-linkingeffect. Besides enzymes, the gluten network can also be reinforced by adding supple-mentary gluten, which was indeed found to enhance the extent of strain-hardening.
Keywords Dough rheology · Glucose oxidase · Transglutaminase · Gluten ·Creep-recovery · Strain-hardening
M. Meerts · H. Van Ammel · Y. Meeus · S. Van Engeland · R. Cardinaels · F. Oosterlinck · P. MoldenaersSoft Matter, Rheology and Technology, Department of Chemical Engineering, KU Leuven, Celestijnen-laan 200F, Box 2424, BE 3001 Leuven, BelgiumE-mail: [email protected]
R. CardinaelsPolymer Technology, Department of Mechanical Engineering, TU Eindhoven, Box 513, 5600 MB Eind-hoven, The Netherlands
F. OosterlinckMaterials Science Center, DSM Ahead B.V., Urmonderbaan 22, 6167 RD Geleen, The Netherlands
C. M. CourtinLaboratory of Food Chemistry and Biochemistry & Leuven Food Science and Nutrition Research Center(LFoRCe), Department of Microbial and Molecular Systems, KU Leuven, Kasteelpark Arenberg 22, Box2463, BE 3001 Leuven, Belgium
2 Meerts et al.
Introduction
The breadmaking performance of wheat flours is mostly determined by the gluten net-work, and may differ significantly from one wheat flour type to another. In addition togluten quantity, gluten quality was also found to be an important factor. Lack of highmolecular weight glutenin proteins will result in a loss of dough cohesiveness andelasticity, whereas a surplus of these long protein chains will likely thwart a properexpansion of the gas cells. In both cases, only very small bread volumes with poorcrumb characteristics will be obtained (Veraverbeke and Delcour 2002). The glutenquality can be adjusted by the use of enzymes, resulting in an improved loaf volume,crumb structure, shelf-life and/or flavour. The enzymes glucose oxidase (GO) andtransglutaminase (TG) are known to have applications in baked goods (Gerrard et al.(2001) and Caballero et al. (2005), amongst others). The GO and TG enzymes bothhave the ability to create covalent cross-links between the gluten polypeptide chains,but the two enzymes differ with regard to the reaction mechanism and the nature ofthe established cross-links.
The GO enzyme is able to alter the structure and functional properties of thegluten network by creating additional covalent disulphide cross-links through the in-termediary action of H2O2 (Poulsen and Høstrup 1998; Decamps et al. 2013). Inthe presence of O2, GO catalyses the oxidation of β-D-glucose into gluconic acid andH2O2 (Bankar et al. 2009). The produced H2O2 will oxidise the available thiol groupson the gluten proteins to create disulphide cross-links. Disulphide cross-links are nat-urally present in dough, and form an important means to set up the gluten network,besides hydrogen bonds, hydrophobic interactions, etc. (Kontogiorgos 2011). Thedisulphide cross-links are generally considered to be non-permanent, as the cross-links can be rearranged through the SH-SS interchange mechanism (Bloksma 1975).The glutenin fraction appears to be affected to a greater extent by the action of GOthan the gliadin fraction (Rasiah et al. 2005; Bonet et al. 2006), possibly because ofthe latter’s compact structure (Bonet et al. 2006).
GO is an oxygen-consuming enzyme. O2 is naturally present in wheat flour, andan additional amount of O2 is incorporated in the dough during mixing. However,several other enzymes, such as lipoxygenase and polyphenol oxidase, compete withGO for the limited amount of O2 present in bread dough (Decamps et al. 2012). Con-sequently, O2 is probably the limiting substrate for GO. For that reason, the activityof GO is restricted to the mixing stage (Dunnewind et al. 2002; Rasiah et al. 2005).Additional complications arise as not all of the generated H2O2 is used for the forma-tion of disulphide cross-links. For instance, Tilley et al. (2001) mention that H2O2 isalso able to cross-link tyrosine residues in gluten. Even so, Hanft and Koehler (2005)and Decamps et al. (2013) found the formation of dityrosine cross-links to be verylimited in GO-supplemented dough and model systems, respectively. Additionally, invitro experiments have indicated that H2O2 promotes the cross-linking of arabinoxy-lans by means of ferulic acid bridges (Decamps et al. 2013). At present the questionremains to what extent cross-linking of arabinoxylans effectively occurs in dough.There is furthermore no consensus yet on the exact nature of the formed network (see
Enhancing the rheological performance of wheat flour dough 3
for instance Labat et al. (2001) vs. Piber and Koehler (2005)).
The main action mechanism of the TG enzyme is the catalysis of the acyl-transferreaction between the ε-amino groups of peptide-bound lysine residues and the γ-carboxyamide group of peptide-bound glutamine residues, resulting in permanentiso-peptide bonds between the gluten chains (Nonaka et al. 1989). Besides the ε-amino group of lysine residues, other primary amines can equally serve as substratefor TG; when insufficient primary amines are present, also hydrolysis of glutamine toglutamic acid may take place. However, according to Larré et al. (2000) and Ohtsukaet al. (2001), these side reactions are probably only of minor importance.
Protein extraction experiments have indicated that TG has the ability to substan-tially alter the molecular weight distribution of the gluten proteins present in wheatflour. With increasing TG concentration, a dramatic shift in the amount of gliadinsand glutenins towards the highest molecular weights occurs, resulting in the creationof large, insoluble protein aggregates (Larré et al. 2000; Gerrard et al. 2001; Baueret al. 2003a; Rosell et al. 2003; Autio et al. 2005; Bagagli et al. 2014). As glutamineis abundantly present in all gluten fractions, the reactivity of each gluten fraction ismost likely determined by its lysine content. Lysine residues can mainly be found inthe high molecular weight glutenins (HMW-GS), which are indeed affected the mostby TG (Larré et al. 2000; Bauer et al. 2003a; Autio et al. 2005). The bread-improvingeffect of TG is typically attributed to the increase in the amount of high molecularweight gluten proteins. Contrary to GO, TG does not require O2 to create covalentcross-links, and consequently the enzymatic reaction can proceed for very long times(up to 18 hours, according to Larré et al. (2000)). The degree of cross-linking inducedby TG is therefore dependent on both the concentration level and the reaction time,which makes TG a very flexible bread-improving agent (Basman et al. 2002).
The rheological properties of dough are known to relate to the final product qual-ity (Dobraszczyk and Morgenstern 2003). In a previous publication (Meerts et al.2017), we noted that only non-linear rheological tests allow to obtain a good indi-cation of flour quality, because in the linear region the starch granules may maskthe differences between doughs containing different gluten systems. The objective ofthis study is to assess the potential of the GO and TG enzymes as quality-improvingagents, by means of non-linear rheological tests (i.e. uniaxial extension and non-linear creep-recovery tests in shear). The extensional tests are performed by means ofan Extensional Viscosity Fixture (EVF), which enables us to apply a pure extensionalflow field, in contrast to the more commonly used Kieffer extensibility rig. In addi-tion, the impact of adding the GO and TG enzymes to a weak wheat flour (therebyaiming at improving its gluten quality) is compared to the beneficial effect of increas-ing the gluten quantity of the flour, in order to establish which parameter is the mostimportant with regard to the flour’s baking performance.
4 Meerts et al.
Materials and Methods
Materials
In this study two wheat flour types (Bilux and Bison) were used. Both flours wereobtained from Dossche Mills (Deinze, Belgium). The moisture content of the flourswas determined to be 13.4 ± 0.07 wt% and 12.7 ± 0.05 wt% for Bilux and Bison,respectively, according to AACC method 44-19.01 (AACC International 2000). Theprotein content (N x 5.7) of the flours was measured with an automated Dumas pro-tein analysis system (EAS, VarioMax N/CN, Elt, Gouda, The Netherlands) followingan adaptation of the AOAC method 990.03 (AOAC International 1995). Comparedto the Bison flour, the Bilux flour had a significantly higher protein content (15.1 ±0.2 wt% vs. 12.4 ± 1.0 wt% on a dry matter basis) and a far superior Farinographmixing stability (10.8 ± 0.8 min vs. 1.0 ± 0.2 min). Hence the Bilux flour couldbe classified as a strong flour, and the Bison flour as a weak flour. It is reasonableto assume that approx. 80 % (for a weak flour) to 85 % (for a strong flour) of theproteins present in wheat flour are gluten proteins. Consequently, the gluten contentof the strong Bilux flour amounts to ca. 13 wt% (dm), whereas the weak Bison flourcontains ca. 10 wt% (dm) gluten. To assess the impact of the gluten quantity on theflour performance, additional gluten were added to the weak Bison flour to obtaingluten contents of ca. 11.5 wt% and 13 wt% (dm), respectively. The commercialgluten proteins used to upgrade the Bison flour were purchased from Tereos Syral(Aalst, Belgium), had a protein content of 77.8 ± 0.13 wt% (dm), and a water con-tent of 6.5± 0.09 wt%. GO produced by Aspergillus niger was obtained from Sigma-Aldrich (Bornem, Belgium). The enzymatic activity of GO was determined with the2-2’-azino-bis(3-ethylbenzothiazoline-6-sulphonic acid) (ABTS) assay as describedin Decamps et al. (2012), and turned out to be 5900 U/g. An equivalent of 1 U GOenzyme is able to catalyse the oxidation of 1 μmol of glucose per min. The microbialACTIVA®WM TG was kindly provided by Ajinomoto Foods Europe S.A.S. (Mesnil-Saint-Nicaise, France). The enzymatic activity unit for TG is defined as the amountof enzyme resulting in the formation of 1 μmol of hydroxamic acid per min. Theenzymatic activity was determined by the manufacturer with the hydroxamate pro-cedure originally developed by Folk and Cole (1966), and was reported to be 100 U/g.
Dough Preparation
The optimal baking absorption and mixing time were determined with a Farinograph(Brabender, Duisburg, Germany) and a Mixograph (National Manufacturing, Lin-coln, NE, USA) in accordance with AACC methods 54-40.02 and 54-21.02, respec-tively (AACC International 2000). The dough samples consisted of 10 g flour (on 14% moisture base), 1.5 wt% sodium chloride, 6 wt% sucrose, 1 ml sodium phosphatebuffer (pH 6.5) and 4.80 ml/4.40 ml/4.40 ml/4.45 ml water for standard Bilux, stan-dard Bison, Bison (+ 1.5 wt% gluten) and Bison (+ 3 wt% gluten) flour, respectively(AACC method 10-10.03). Suitable amounts of GO or TG were added to the dough
Enhancing the rheological performance of wheat flour dough 5
by dissolving them in water. All ingredients were mixed in a 10 g pin bowl mixer (Na-tional Manufacturing). The standard Bilux and Bison flours were mixed for 3 min 30s to reach their optimal consistency, whereas the Bison (+ 1.5 wt% gluten) and Bison(+ 3 wt% gluten) flours had to be mixed for 4 min. After mixing, the dough sampleswere shaped with a pasta machine to obtain a cylindrical shape with a height of ca. 4mm and a diameter larger than 40 mm. The dough samples were allowed to rest for30 min prior to loading in the rheometer.
The pH of the dough was determined with a pH probe (HI 9126, Hanna Instru-ments, Temse, Belgium), which was placed directly in the sample. The addition ofthe sodium phosphate buffer resulted in a small but significant increase in the doughpH (from 5.76 ± 0.02 to 5.87 ± 0.01), which coincides with the optimal range of pHvalues (5.5 - 6.0) for both enzymes (Decamps et al. 2012; Kieliszek and Misiewicz2014).
Rheological Methods
Oscillatory Tests
Small amplitude oscillatory shear (SAOS) tests were performed at 25 ◦C on a stress-controlled MCR501 rheometer (Anton Paar, Graz, Austria) with a 40-mm parallelplate geometry in direct strain mode (Läuger et al. 2002). To prevent dehydrationof the dough samples, a solvent trap combined with wet cotton wool was used. Slipeffects were eliminated by coating the top and bottom plates with sandpaper. Afterloading in the rheometer, the dough sample was allowed to rest for an additional 30min to allow the remaining stresses to relax. Subsequently, frequency sweeps wereobtained. All dynamic measurements were performed at least in triplicate on sepa-rately prepared batches of dough (with the average values being shown). Good repro-ducibility was obtained with relative standard deviations less than 10 %. To determinewhether the observed differences between dough samples prepared with different en-zyme concentrations were statistically significant, we made use of the one-tailed un-paired Welch’s t-test (p < 0.05).
Creep-Recovery Tests
Non-linear creep-recovery experiments in shear deformation mode were performedwith the same setup as that used for the dynamic measurements. The creep-recoverydata were also obtained after a resting period of 30 min following the loading of thesample in the rheometer. The shear stress was applied for 30 min, after which thedough sample was allowed to recover for 60 min. The applied stress (σ = 500 Pa) isknown to result in non-linear creep behaviour (Meerts et al. 2017). The complianceJ(t) [Pa-1] was determined as the ratio of the observed strain γ(t) to the applied shearstress σ . Creep-recovery measurements were performed at least in duplicate and the
6 Meerts et al.
relative standard deviation was less than 17 % for all cases.
Extensional Tests
Dough behaviour in extension was studied at ambient temperature by means of theExtensional Viscosity Fixture (EVF) mounted on a strain-controlled ARES-G2 rheome-ter (TA Instruments, New Castle, DE, USA). The EVF setup consists of two drumsto which the dough strand can be attached. Extension at a constant rate is obtained asone drum remains stationary and the other moves in a circular orbit around it whilstalso rotating around its own axis. As a measure for deformation, we use the Henckystrain ε(t) [-]:
ε(t) = ln(
L(t)L0
)(1)
L0 stands for the initial length of the dough strand, whereas L(t) is the actual lengthduring extension. The transient extensional viscosity η+
e (ε) [Pa s] is defined as:
η+e (ε) =
σ11(ε)
ε(2)
In this expression σ11(ε) corresponds to the longitudinal stress [Pa] registered bythe transducer of the rheometer. The extension rate ε was kept constant at 0.1 s-1.The maximum achievable strain with the EVF setup was limited to 2.9; hence it wasnot possible to determine the extensibility of the dough, as the samples could not bestretched until their point of failure. In extension, both Bilux and Bison dough showsubstantial strain-hardening, the extent of which can be quantified by means of thestrain-hardening index (SHI) (see also Meerts et al. (2017)):
SHI =η+
e (εmax)
η+e0(εmax)
(3)
In this expression η+e (εmax) is the actual value of the transient extensional viscosity
at the maximum strain (2.9), and η+e0(εmax) is the value of the linear extensional vis-
cosity extrapolated to the maximum strain. The extensional viscosity curves are theaverage of 10 - 25 measurements on 2 - 4 separately prepared batches. As these mea-surements are not all independent, the pooled standard deviation sp has been used todetermine the data variability (McNaught and Wilkinson 1997):
sp =
√(n1−1) · s2
1 +(n2−1) · s22
n1 +n2−N(4)
In this expression, s1 and s2 represent the standard deviations for the measurements ofbatch 1 and 2, respectively. The number of measurements in each batch are denotedby n1 and n2, whereas the total number of batches is given by N. In the expression

Enhancing the rheological performance of wheat flour dough 7
above N = 2, but the expression can easily be adjusted in case N > 2. The relativestandard deviation varied between 7 and 22 %. For additional information on therheological setups and methodologies the reader is referred to Meerts et al. (2017).
Results and Discussion
Impact of GO and TG on Dough Behaviour
Oscillatory Tests
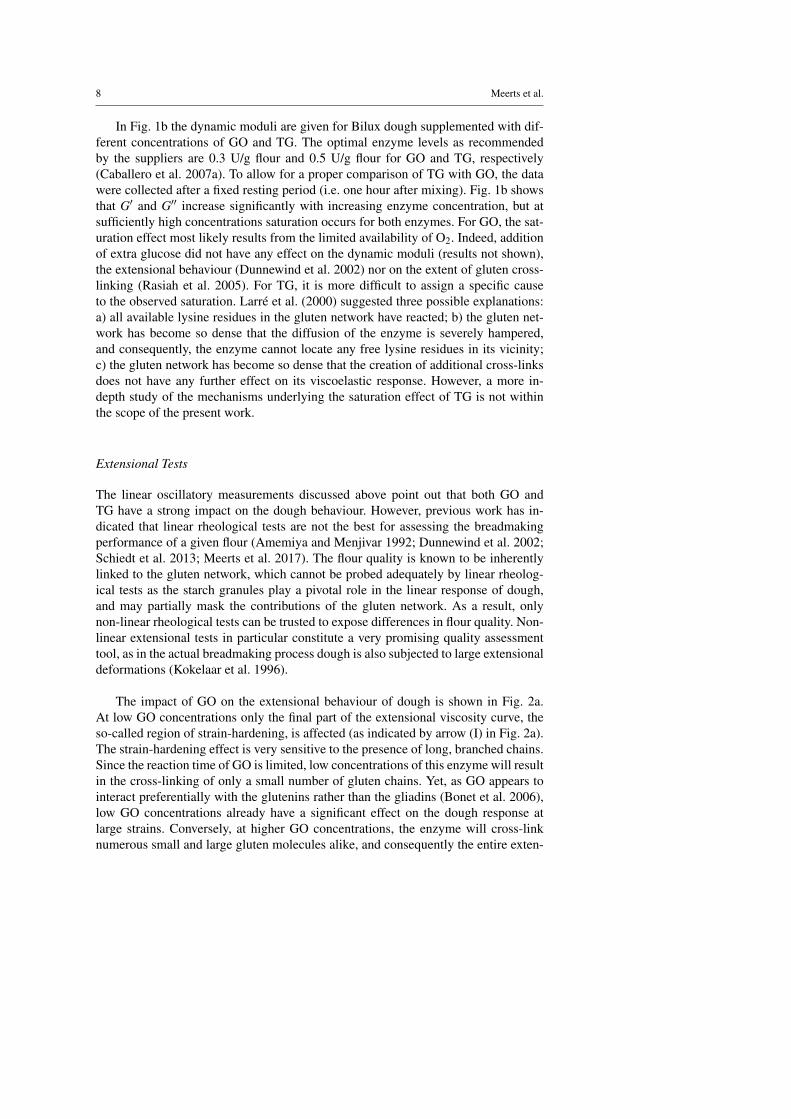
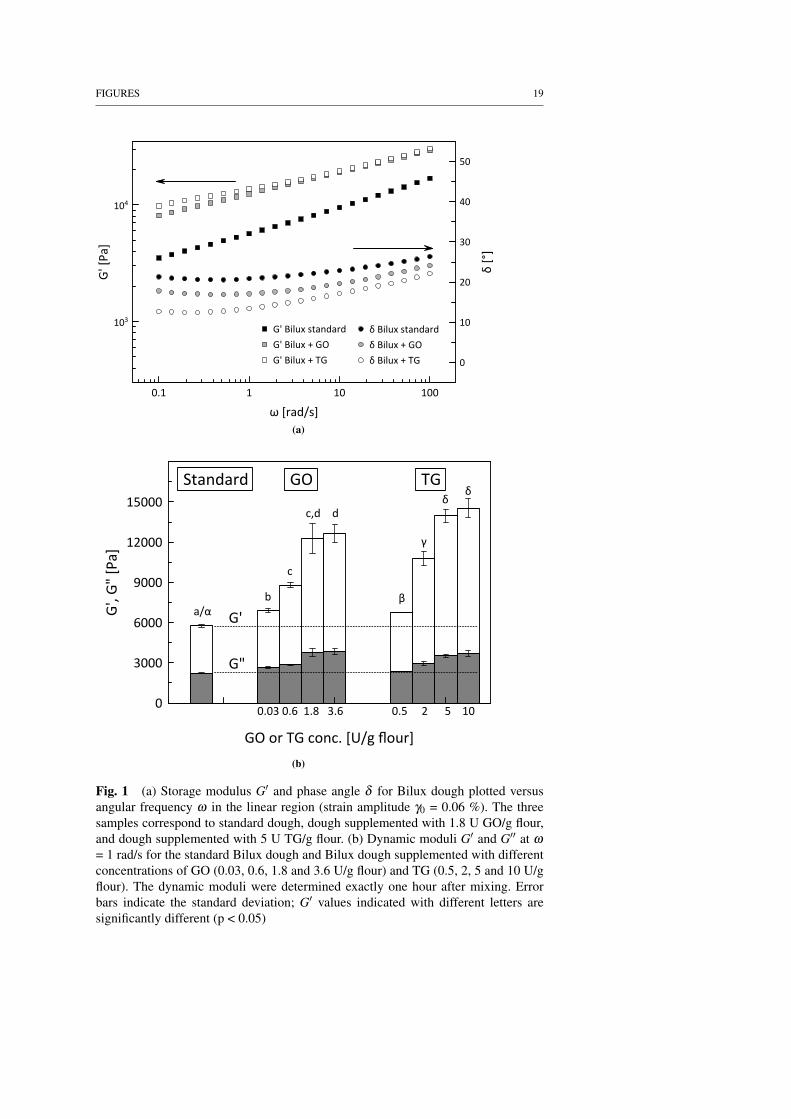
Even though the breadmaking potential of dough is known to be related mostly toits non-linear rheological properties, it is still worthwhile to perform small-amplitudeoscillatory shear (SAOS) as well, as these tests may yield additional information onthe kinetics and the concentration-dependent stiffening effect of both GO and TG.Fig. 1a gives the storage modulus G′ as a function of angular frequency ω for theuntreated Bilux dough and for Bilux dough supplemented with GO or TG. The oscil-latory data were obtained exactly one hour after mixing of the dough. Upon additionof either GO or TG the storage modulus G′ increases substantially. The loss modulusG′′ increases as well, albeit to a lesser extent, as evidenced by the slight decrease inthe phase angle δ . The addition of GO results in a quasi-parallel upward shift in theG′ and G′′ curves, whereas TG appears to also affect the frequency dependency ofthe dynamic moduli (as shown for G′ in Fig. 1a). The effect of GO and TG on thedynamic moduli has already been documented in literature, both for dough (see Vem-ulapalli et al. (1998) and Dunnewind et al. (2002) for GO, and Caballero et al. (2005)for TG) and for pure gluten (Hilhorst et al. (1999) for GO, and Larré et al. (2000) forTG). A decrease in the frequency dependency of the dynamic moduli was also ob-served for pure gluten supplemented with TG (Larré et al. 2000). The change in thefrequency dependency of the dynamic moduli is not a time effect (for a discussion ofthe reaction time of TG, see below), but most likely stems from the particularly highsensitivity of the HMW-GS fraction towards TG. Indeed, since the HMW-GS fractionis mainly associated with the slowest relaxation mechanisms, the high sensitivity ofthe HMW-GS fraction towards TG is likely to result in an increase in the dynamicmoduli predominantly at the lowest frequencies. Rasiah et al. (2005) and Bonet etal. (2006) reported that GO also prefers to interact with the glutenin rather than thegliadin fraction, yet this preference is apparently not sufficiently pronounced to bedetected in linear oscillatory shear tests.
Another difference between GO and TG is the reaction time. Whereas the actionof GO is mostly restricted to the mixing stage because of O2 limitations, the TG re-action may continue for several hours. As did Caballero et al. (2007a), we found thedynamic moduli of TG-supplemented dough to increase substantially over the courseof three hours, without reaching steady-state. According to Larré et al. (2000) the TGreaction might require up to 18 hours to complete.
8 Meerts et al.
In Fig. 1b the dynamic moduli are given for Bilux dough supplemented with dif-ferent concentrations of GO and TG. The optimal enzyme levels as recommendedby the suppliers are 0.3 U/g flour and 0.5 U/g flour for GO and TG, respectively(Caballero et al. 2007a). To allow for a proper comparison of TG with GO, the datawere collected after a fixed resting period (i.e. one hour after mixing). Fig. 1b showsthat G′ and G′′ increase significantly with increasing enzyme concentration, but atsufficiently high concentrations saturation occurs for both enzymes. For GO, the sat-uration effect most likely results from the limited availability of O2. Indeed, additionof extra glucose did not have any effect on the dynamic moduli (results not shown),the extensional behaviour (Dunnewind et al. 2002) nor on the extent of gluten cross-linking (Rasiah et al. 2005). For TG, it is more difficult to assign a specific causeto the observed saturation. Larré et al. (2000) suggested three possible explanations:a) all available lysine residues in the gluten network have reacted; b) the gluten net-work has become so dense that the diffusion of the enzyme is severely hampered,and consequently, the enzyme cannot locate any free lysine residues in its vicinity;c) the gluten network has become so dense that the creation of additional cross-linksdoes not have any further effect on its viscoelastic response. However, a more in-depth study of the mechanisms underlying the saturation effect of TG is not withinthe scope of the present work.
Extensional Tests
The linear oscillatory measurements discussed above point out that both GO andTG have a strong impact on the dough behaviour. However, previous work has in-dicated that linear rheological tests are not the best for assessing the breadmakingperformance of a given flour (Amemiya and Menjivar 1992; Dunnewind et al. 2002;Schiedt et al. 2013; Meerts et al. 2017). The flour quality is known to be inherentlylinked to the gluten network, which cannot be probed adequately by linear rheolog-ical tests as the starch granules play a pivotal role in the linear response of dough,and may partially mask the contributions of the gluten network. As a result, onlynon-linear rheological tests can be trusted to expose differences in flour quality. Non-linear extensional tests in particular constitute a very promising quality assessmenttool, as in the actual breadmaking process dough is also subjected to large extensionaldeformations (Kokelaar et al. 1996).
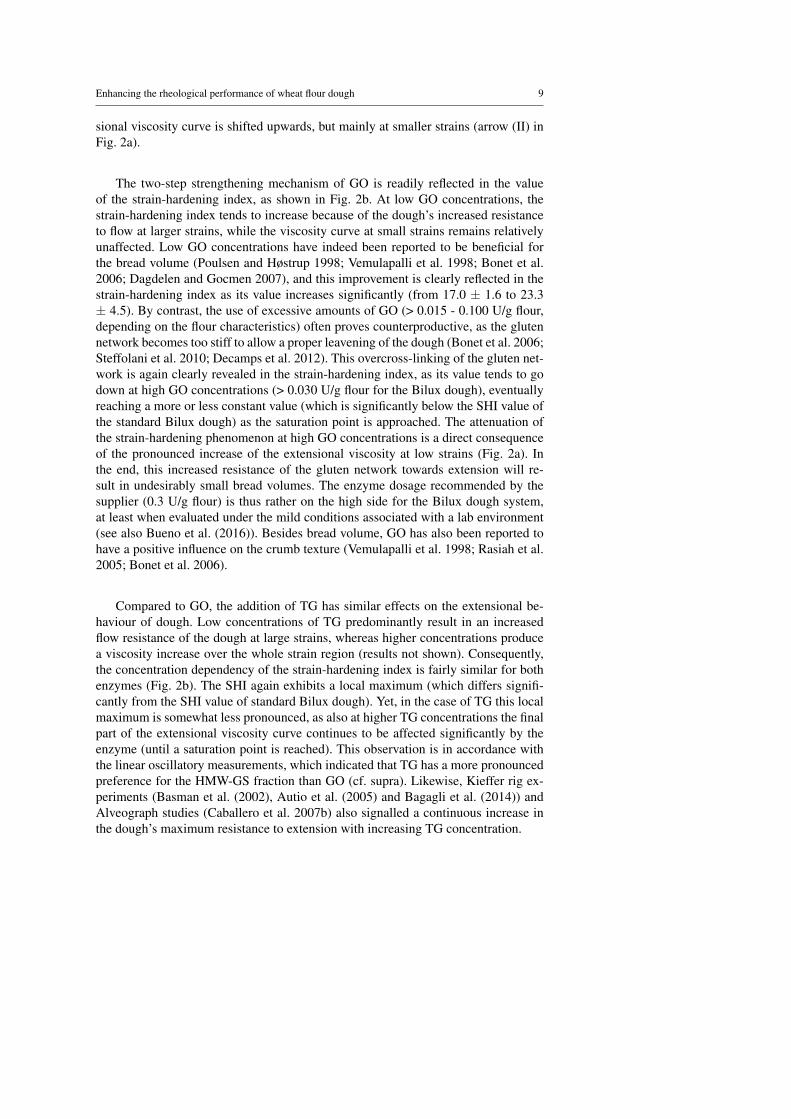
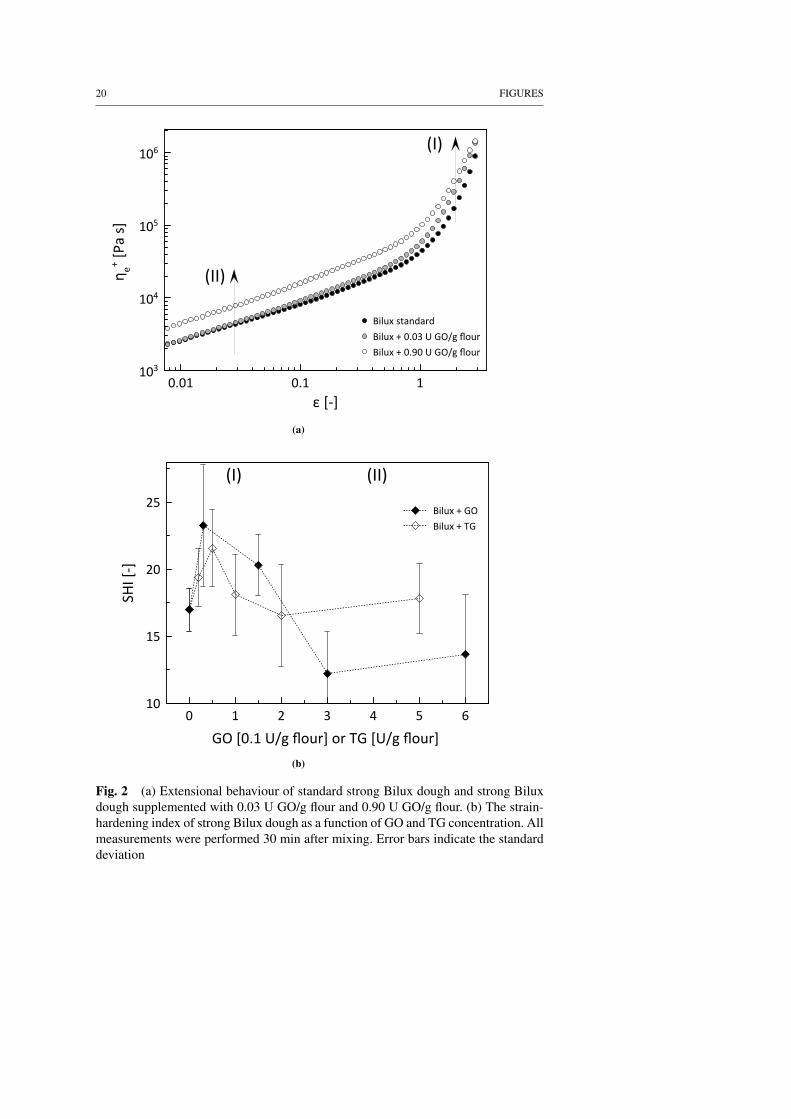
The impact of GO on the extensional behaviour of dough is shown in Fig. 2a.At low GO concentrations only the final part of the extensional viscosity curve, theso-called region of strain-hardening, is affected (as indicated by arrow (I) in Fig. 2a).The strain-hardening effect is very sensitive to the presence of long, branched chains.Since the reaction time of GO is limited, low concentrations of this enzyme will resultin the cross-linking of only a small number of gluten chains. Yet, as GO appears tointeract preferentially with the glutenins rather than the gliadins (Bonet et al. 2006),low GO concentrations already have a significant effect on the dough response atlarge strains. Conversely, at higher GO concentrations, the enzyme will cross-linknumerous small and large gluten molecules alike, and consequently the entire exten-
Enhancing the rheological performance of wheat flour dough 9
sional viscosity curve is shifted upwards, but mainly at smaller strains (arrow (II) inFig. 2a).
The two-step strengthening mechanism of GO is readily reflected in the valueof the strain-hardening index, as shown in Fig. 2b. At low GO concentrations, thestrain-hardening index tends to increase because of the dough’s increased resistanceto flow at larger strains, while the viscosity curve at small strains remains relativelyunaffected. Low GO concentrations have indeed been reported to be beneficial forthe bread volume (Poulsen and Høstrup 1998; Vemulapalli et al. 1998; Bonet et al.2006; Dagdelen and Gocmen 2007), and this improvement is clearly reflected in thestrain-hardening index as its value increases significantly (from 17.0 ± 1.6 to 23.3± 4.5). By contrast, the use of excessive amounts of GO (> 0.015 - 0.100 U/g flour,depending on the flour characteristics) often proves counterproductive, as the glutennetwork becomes too stiff to allow a proper leavening of the dough (Bonet et al. 2006;Steffolani et al. 2010; Decamps et al. 2012). This overcross-linking of the gluten net-work is again clearly revealed in the strain-hardening index, as its value tends to godown at high GO concentrations (> 0.030 U/g flour for the Bilux dough), eventuallyreaching a more or less constant value (which is significantly below the SHI value ofthe standard Bilux dough) as the saturation point is approached. The attenuation ofthe strain-hardening phenomenon at high GO concentrations is a direct consequenceof the pronounced increase of the extensional viscosity at low strains (Fig. 2a). Inthe end, this increased resistance of the gluten network towards extension will re-sult in undesirably small bread volumes. The enzyme dosage recommended by thesupplier (0.3 U/g flour) is thus rather on the high side for the Bilux dough system,at least when evaluated under the mild conditions associated with a lab environment(see also Bueno et al. (2016)). Besides bread volume, GO has also been reported tohave a positive influence on the crumb texture (Vemulapalli et al. 1998; Rasiah et al.2005; Bonet et al. 2006).
Compared to GO, the addition of TG has similar effects on the extensional be-haviour of dough. Low concentrations of TG predominantly result in an increasedflow resistance of the dough at large strains, whereas higher concentrations producea viscosity increase over the whole strain region (results not shown). Consequently,the concentration dependency of the strain-hardening index is fairly similar for bothenzymes (Fig. 2b). The SHI again exhibits a local maximum (which differs signifi-cantly from the SHI value of standard Bilux dough). Yet, in the case of TG this localmaximum is somewhat less pronounced, as also at higher TG concentrations the finalpart of the extensional viscosity curve continues to be affected significantly by theenzyme (until a saturation point is reached). This observation is in accordance withthe linear oscillatory measurements, which indicated that TG has a more pronouncedpreference for the HMW-GS fraction than GO (cf. supra). Likewise, Kieffer rig ex-periments (Basman et al. (2002), Autio et al. (2005) and Bagagli et al. (2014)) andAlveograph studies (Caballero et al. 2007b) also signalled a continuous increase inthe dough’s maximum resistance to extension with increasing TG concentration.
10 Meerts et al.
The evolution of the strain-hardening index with TG concentration again followsclosely the trend in breadmaking performance established in other studies (Basmanet al. 2002; Bauer et al. 2003b; Autio et al. 2005; Huang et al. 2008). Small amountsof TG generally have a positive effect on the bread volume, whereas the use of largeramounts (> 0.3 - 1 U/g flour, depending on the flour characteristics) entails the risk ofovercross-linking the dough. Other beneficial effects of TG are a significant decreasein dough stickiness, and therefore improved machinability (Bauer et al. 2003b); im-proved bread crumb strength (Caballero et al. 2007a); and a finer and more uniformcrumb structure (Basman et al. 2002; Caballero et al. 2007a). Considering the latter,van Vliet (2008) showed that strain-hardening indeed stimulates an equal growth ofexpanding gas cells, and tends to prevent coalescence between adjacent gas cells.
Creep-Recovery Tests
Our extensional rheological tests highlight the potential of the strain-hardening in-dex as a quality indicator. The SHI is not only able to capture the beneficial effectof adding small amounts of GO/TG to dough, but also provides an indication of theonset of overcross-linking, which tends to occur when excessive amounts of GO/TGare used. The extensional tests thus allow us to determine, in an approximate way, the"optimal" concentration levels of GO and TG that will improve the breadmaking per-formance of a given flour to the maximal extent. Besides extensional tests, non-linearcreep-recovery tests have also been proposed for assessing the flour quality. Impor-tant parameters that can be derived from the creep-recovery curves are the maximumcreep compliance Jmax
c (i.e. the compliance at the end of the creep phase) and the totalrecovery compliance Jmax
r (i.e. a measure for the amount of deformation that can berecovered following the removal of the stress). Van Bockstaele et al. (2008) found thetotal recovery compliance Jmax
r to correlate well with the breadmaking performance,as it provides a measure of the dough elasticity, which in turn can be traced back tothe gluten network. In a previous study we verified this correlation for the untreatedBilux and Bison dough systems (Meerts et al. 2017).
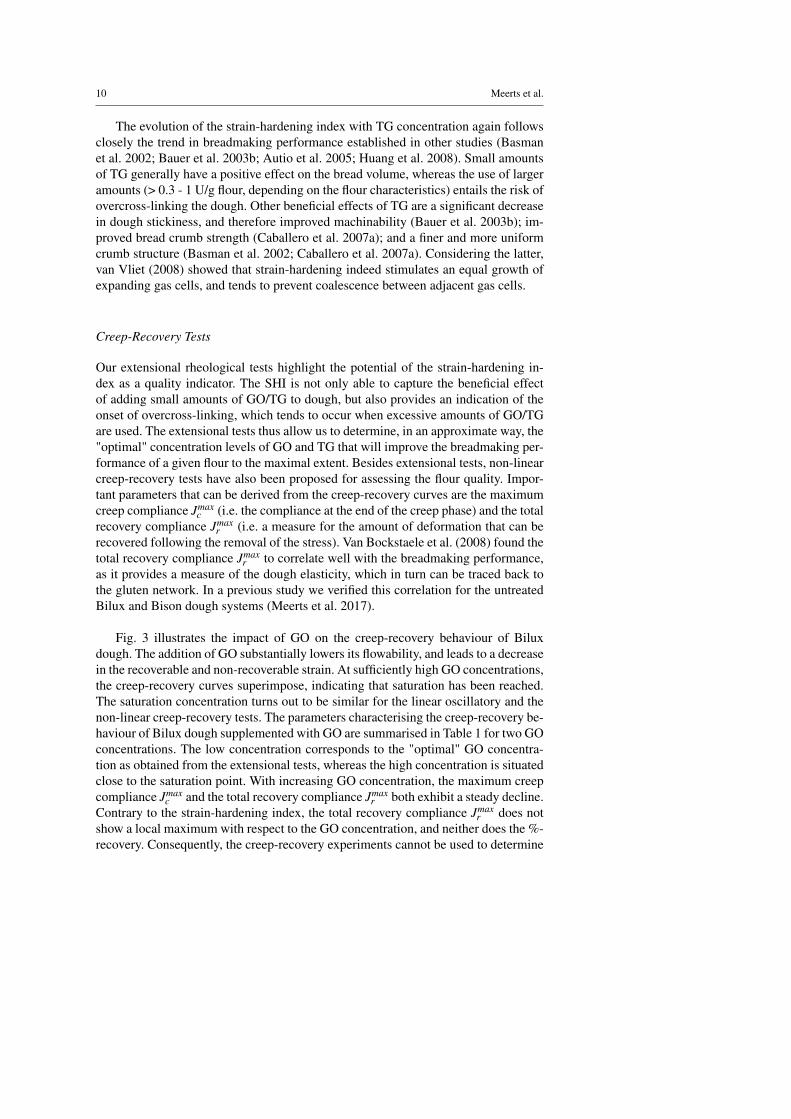
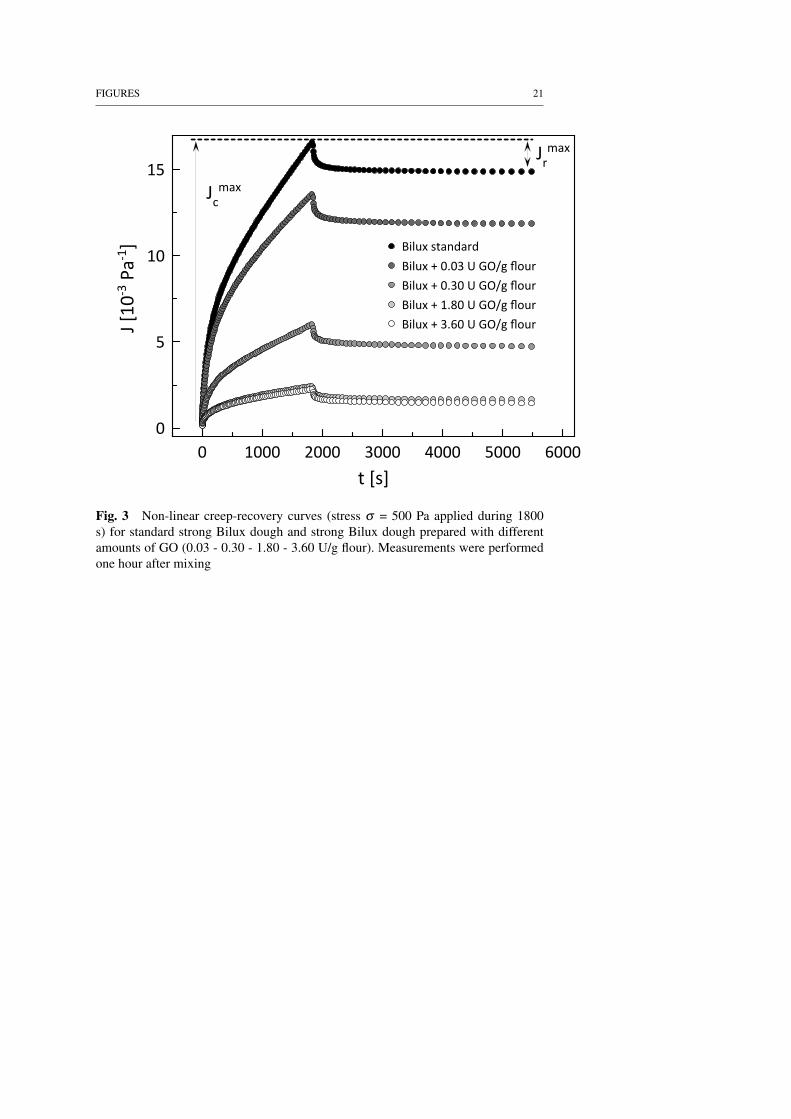
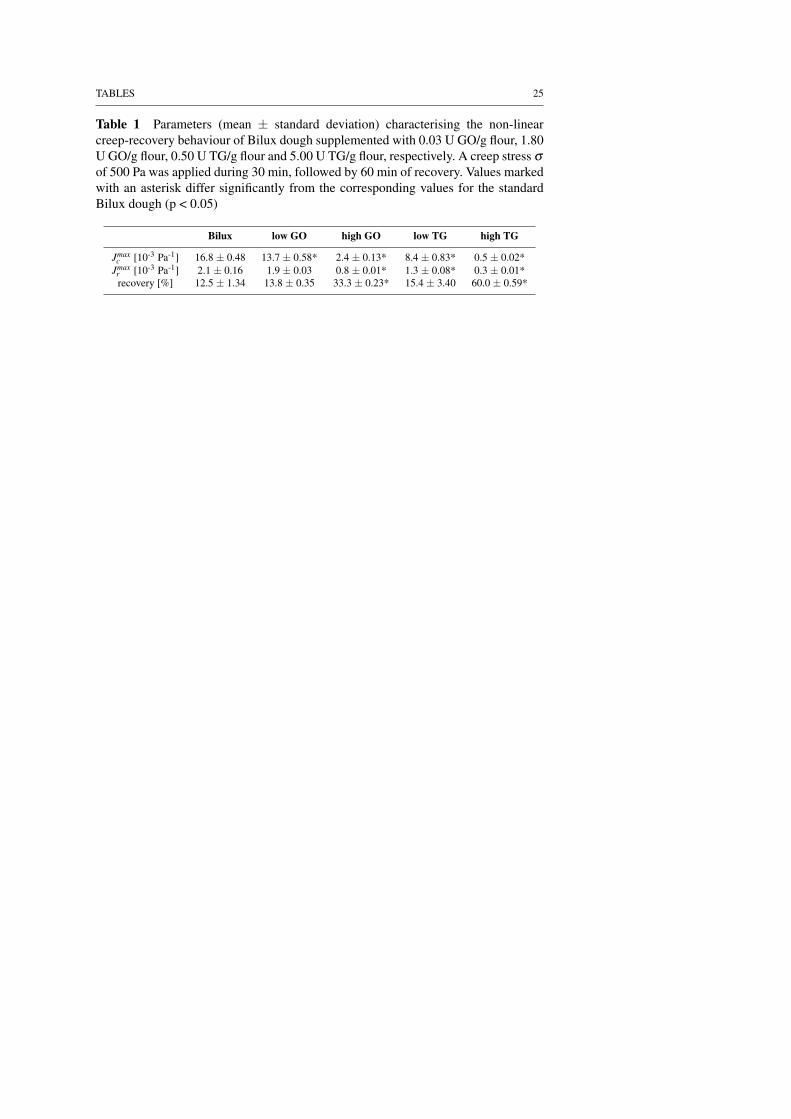
Fig. 3 illustrates the impact of GO on the creep-recovery behaviour of Biluxdough. The addition of GO substantially lowers its flowability, and leads to a decreasein the recoverable and non-recoverable strain. At sufficiently high GO concentrations,the creep-recovery curves superimpose, indicating that saturation has been reached.The saturation concentration turns out to be similar for the linear oscillatory and thenon-linear creep-recovery tests. The parameters characterising the creep-recovery be-haviour of Bilux dough supplemented with GO are summarised in Table 1 for two GOconcentrations. The low concentration corresponds to the "optimal" GO concentra-tion as obtained from the extensional tests, whereas the high concentration is situatedclose to the saturation point. With increasing GO concentration, the maximum creepcompliance Jmax
c and the total recovery compliance Jmaxr both exhibit a steady decline.
Contrary to the strain-hardening index, the total recovery compliance Jmaxr does not
show a local maximum with respect to the GO concentration, and neither does the %-recovery. Consequently, the creep-recovery experiments cannot be used to determine
Enhancing the rheological performance of wheat flour dough 11
the onset of overcross-linking. It is evident, however, that at the highest GO concen-trations the gluten network has become too dense to allow for a proper leavening ofthe dough, indicating that overcross-linking has indeed occurred. At the same time, itis surprising to note that even at the highest GO concentrations, the dough still retainsits ability to flow. This observation suggests that the SS cross-links created by GO inthe gluten network are not permanent. Instead, a SH/SS interchange reaction mech-anism has been suggested to allow for relative movement within the gluten matrixwithout compromising its stability (Bloksma 1975). It is equally possible that the ob-served stiffening effect of GO is only partially the result of an increased number of SScross-links. Kontogiorgos (2011), amongst others, suggests that the continuity of thegluten network also depends strongly on non-covalent interactions (such as hydro-gen bonds, hydrophobic interactions, etc.). It does not seem unthinkable, therefore,that conformational changes induced by the creation of additional SS cross-links maylead to improved, non-covalent interaction possibilities.
The effect of TG on the creep-recovery behaviour of Bilux dough resembles thatof GO. The maximum creep compliance Jmax
c and the total recovery compliance Jmaxr
both decrease upon addition of TG, yet the relative extent to which the dough isable to recover after removal of the load increases significantly (from 12.5 % to 60.0%, see again Table 1), even more so than with the addition of GO. In other words,TG increases the dough’s viscosity as well as elasticity, but the latter is affected themost since TG has a particularly high affinity for the longer gluten chains. The im-pact of TG on the dough behaviour observed in creep-recovery tests is thus fully inline with the observations from oscillatory tests (see above). Other studies on thecreep-recovery behaviour of TG-supplemented dough have yielded comparable re-sults (Bauer et al. 2003b; Šimurina et al. 2014).
Upgrading Weak Flour Dough: Gluten Quality versus Gluten Quantity
Extensional Tests
In the baking industry, GO and TG are applied to improve the gluten quality, andhence the characteristics of the baked product. Another way of improving the bakingperformance of a wheat flour would be to increase the gluten content of that flour byadding supplementary gluten. With our rheological toolbox we will now compare thepotential of these different routes to improve the rheological response of a weak flourdough.
To assess the potential of the GO and TG enzymes as quality-improving agents,we tested multiple enzyme concentrations in combination with the weak Bison dough,and we compared the rheological performance of the upgraded Bison dough to thatof the untreated strong Bilux dough, for shear as well as extensional deformations.As with Bilux dough, we observed that the strain-hardening index of GO- and TG-supplemented Bison dough exhibits a local maximum as a function of enzyme con-
12 Meerts et al.
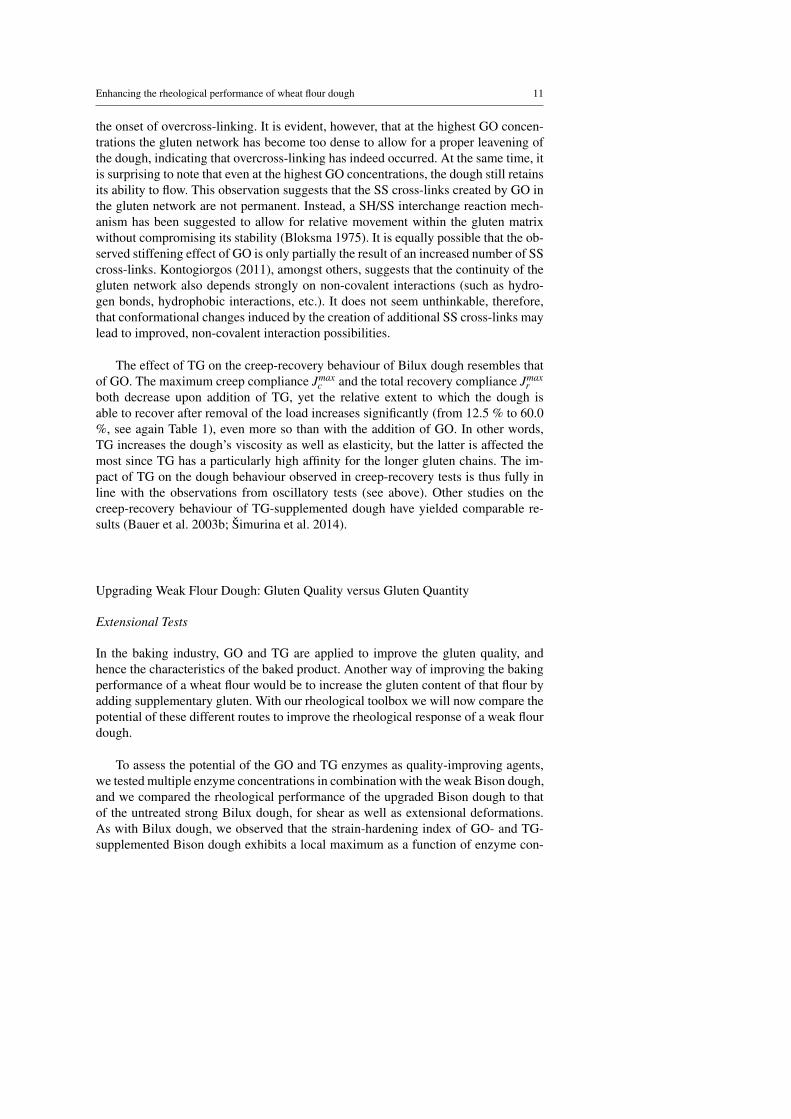
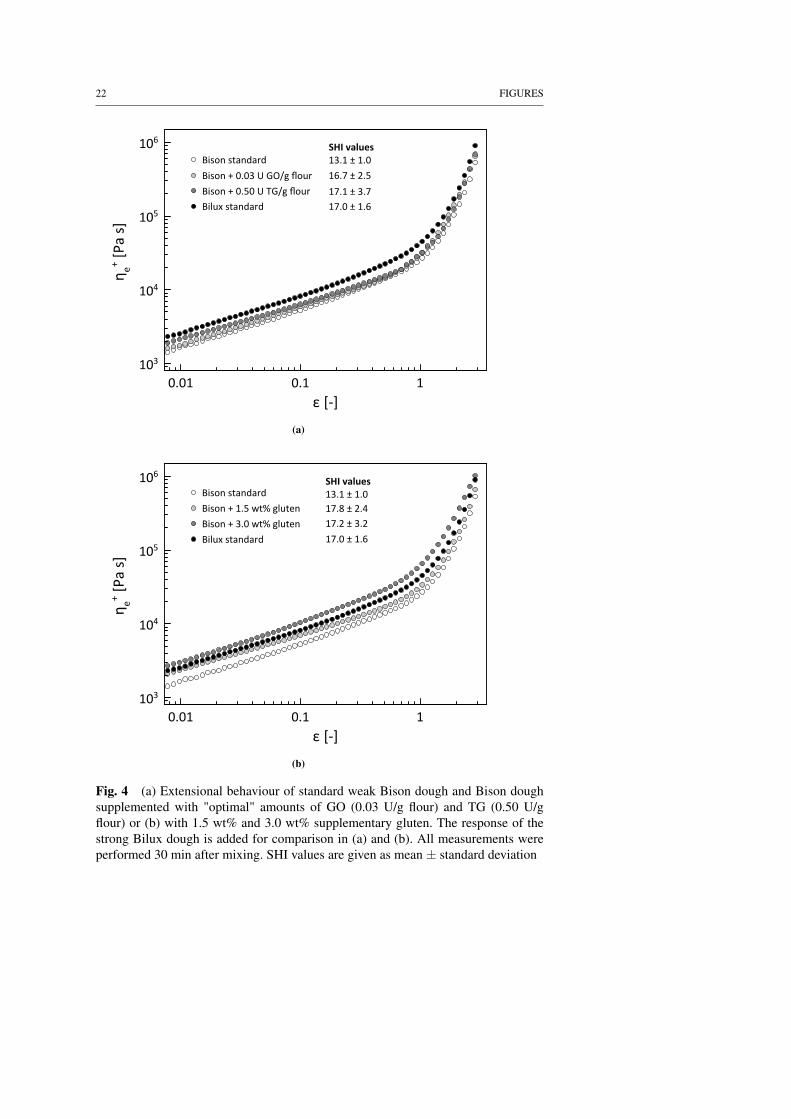
centration (results not shown). Moreover, for Bison dough the "optimal" enzyme con-centrations turned out to be very similar to those for Bilux dough. These "optimal" en-zyme concentrations were subsequently used to improve the rheological performanceof Bison dough, as shown in Fig. 4a, which compares the extensional behaviour ofweak Bison dough, supplemented with 0.03 U/g flour GO or 0.5 U/g flour TG, to thatof strong Bilux dough. The small amounts of GO and TG turn out to affect the exten-sional viscosity of weak Bison dough predominantly at larger strains, as was also thecase with strong Bilux dough (see Fig. 2a). It is furthermore clear that the stiffeningeffect of GO and TG with regard to the weak Bison dough is fairly significant, asthe use of these enzymes allows to emulate the strong Bilux dough. The value of theextensional viscosity at the maximum strain, η+
e (εmax), remains somewhat lower forthe improved Bison dough as compared to the strong Bilux dough (see Fig. 4a). Yet,the SHI reaches practically the same values (differences are not statistically signifi-cant) for the improved Bison dough as for the strong Bilux dough: the use of GO orTG results in an increase of the SHI from 13.1 (for untreated Bison dough) to 16.7and 17.1 for GO-treated and TG-treated Bison dough, respectively, whereas the un-treated strong Bilux dough has a SHI value of 17.0. Adjustment of the gluten qualityby the use of enzymes thus constitutes a valuable means to enhance the rheologicalperformance of a weak flour dough. Furthermore, the two enzymes GO and TG seemto improve the wheat flour dough to the same extent.
Besides the gluten quality, it is also possible to adjust the gluten quantity of aflour, by adding commercial gluten to the dough system. To assess the impact ofchanges in gluten quantity on the rheological performance of wheat flour dough, com-mercial gluten were added to the weak Bison flour in two different concentrations, inorder to bridge the gap in gluten content between the standard Bilux and Bison flours(see also Materials and Methods section). In Fig. 4b the performance of the standardBison dough (ca. 10 wt% gluten) and the standard Bilux dough (ca. 13 wt% gluten)in extension is compared to that of the upgraded Bison dough samples with 11.5 wt%and 13 wt% gluten. The addition of commercial gluten to the weak Bison dough turnsout to have a clear impact on its rheological behaviour. The commercial gluten pro-teins are readily integrated in the native gluten network, as evidenced by the upwardshift in the extensional viscosity curves with increasing gluten content. In contrast tothe GO and TG enzymes, the addition of supplementary gluten has an effect on the ex-tensional viscosity curves of dough at both small and large strains, probably becausethe supplementary gluten proteins have a wide distribution in molecular weight. Theincrease in extensional viscosity is most pronounced at higher strains, which impliesthat the addition of supplementary gluten has a positive effect on the SHI; the SHIvalue increases from 13.1 (for untreated Bison dough) to 17.8 and 17.2 for Bison (+1.5 wt% gluten) and Bison (+ 3 wt% gluten), respectively. By adding gluten to theweak Bison flour, it is thus possible to obtain SHI values similar to that of the (un-treated) strong Bilux flour. Yet, as with the use of enzymes, adjustment of the proteincontent also entails the risk of over-reinforcing the gluten network: as the gluten con-tent of the Bison flour is further increased from 11.5 wt% to 13 wt%, the SHI valueappears to decrease slightly (but the decrease is not statistically significant).
Enhancing the rheological performance of wheat flour dough 13
Creep-Recovery Tests
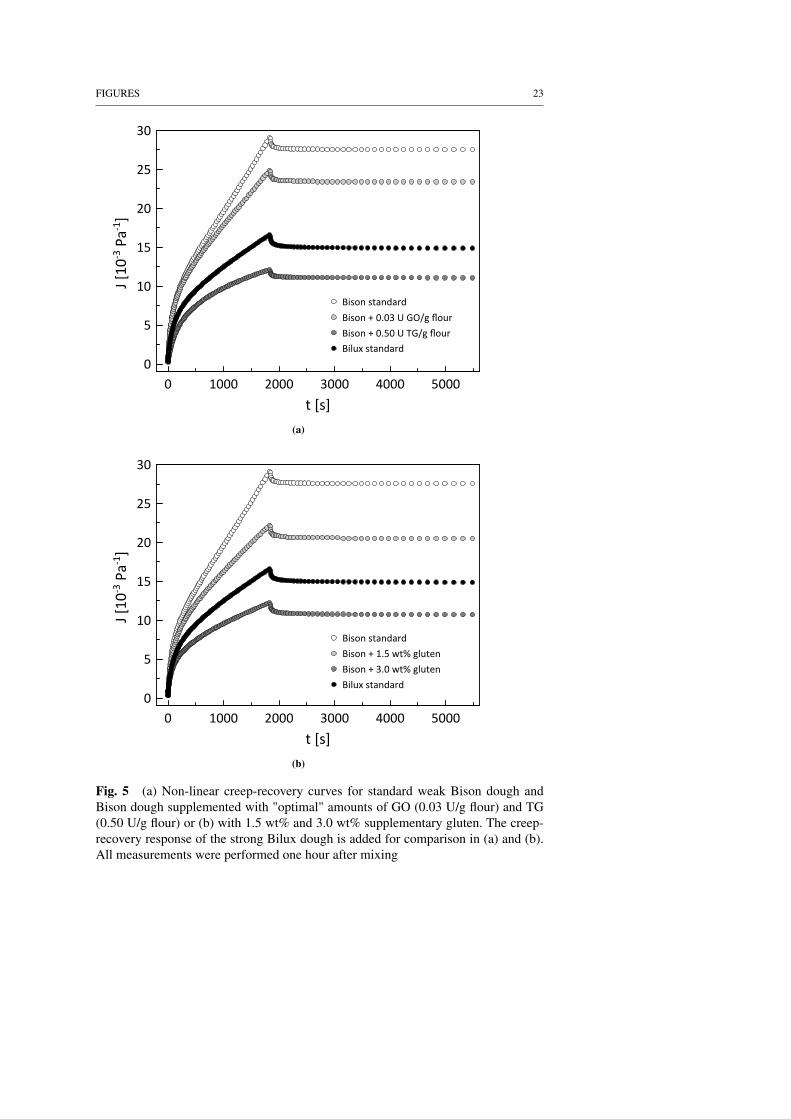
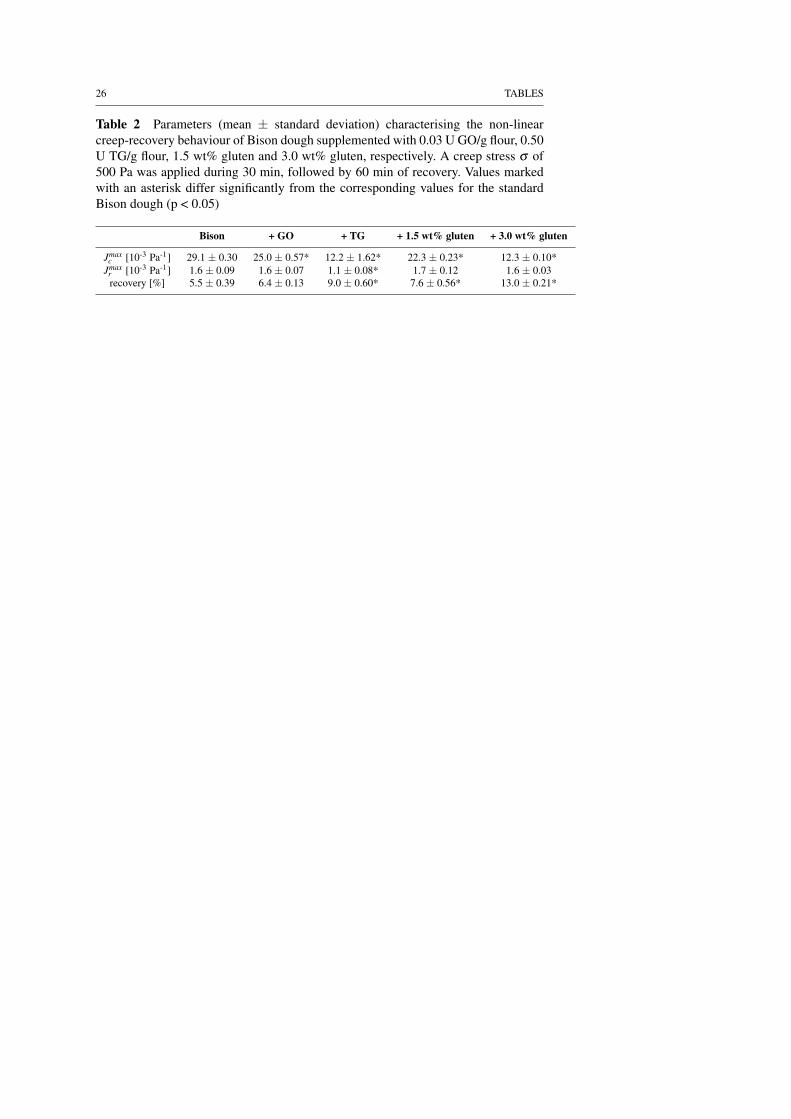
Non-linear creep-recovery tests can also be used to evaluate the changes in rheolog-ical performance of weak Bison dough supplemented with either enzymes or extragluten. Fig. 5a shows the creep-recovery behaviour of Bison dough supplementedwith GO or TG. The characteristics of the creep-recovery curves are summarised inTable 2. In creep-recovery, the effect of TG on Bison dough is much more appar-ent than the effect of GO, even though their impact on the extensional behaviour ofweak Bison dough was fairly similar (see Fig. 4a). For weak Bison dough we thusobserve the same trends as for strong Bilux dough (cf. Table 1). As with the Biluxdough, both Jmax
c and Jmaxr exhibit a steady decline, whereas the relative amount of
recoverable strain increases. The impact of an increase in the gluten content on thecreep-recovery behaviour of weak Bison dough is shown in Fig. 5b. The addition ofcommercial gluten results in a substantial reinforcement of the native gluten networkalready present in Bison dough, to such an extent that the weak Bison dough sup-plemented with 3 wt% gluten attains a much higher shear viscosity (Fig. 5b), andjudging from the %-recovery value in Table 2, also a slightly greater elasticity thanthe untreated strong Bilux dough.
Conclusions
The enzymes glucose oxidase and transglutaminase significantly affect the viscoelas-tic behaviour of wheat flour dough. Even though their assumed reaction mechanismsare different, the outcome is rather similar, as they both render the dough more stiffand elastic. The enzymes can be used to improve the strain-hardening behaviour ofdough, and their effect can be quantified by means of a strain-hardening index (SHI).The SHI value of the weak flour dough used in this study can be brought to the samelevel as that of the strong flour dough by the action of GO or TG. The use of excessiveamounts of enzyme has already proven to have severe ramifications for the breadmak-ing performance, and turns out to have an adverse effect on the SHI value as well.The SHI thus appears to correlate well with the breadmaking performance. In addi-tion to gluten quality, a flour’s breadmaking performance can also be improved byincreasing the gluten quantity. Supplementary gluten were found to become readilyincorporated in the existing gluten network, thereby increasing the SHI value of theweak flour dough to equal that of the strong flour dough. Consequently, from a rhe-ological point of view it appears that the degree of strain-hardening of a wheat flourdough can be improved to an equivalent extent by adjusting either the gluten qual-ity or the gluten quantity. However, additional research on other wheat flour typesis required before these conclusions can be generalised. Moreover, future breadmak-ing trials will have to decide whether these two bread-improving strategies are trulyequivalent or not.
Acknowledgements MM is indebted to the Research Foundation - Flanders (FWO) for a doctoral fel-lowship at KU Leuven. The authors would also like to express their gratitude to the Research Fund KULeuven (IDO/12/011) for financial support. Nore Struyf and Mohammad Naser Rezaei are also gratefullyacknowledged for determining the flour characteristics (protein content, moisture content, optimal mixing
14 Meerts et al.
time and water absorption). Finally we would like to thank Ajinomoto Foods Europe S.A.S. for providingus with a free sample of TG (ACTIVA®WM).
References
AACC International, Approved Methods of Analysis (11th edition), AACC Interna-tional (2000), St. Paul (MN).
Amemiya, J. I., & Menjivar, J. A. (1992). Comparison of small and large deformationmeasurements to characterize the rheology of wheat flour doughs. Journal of FoodEngineering, 16(1-2), 91-108.
Autio, K., Kruus, K., Knaapila, A., Gerber, N., Flander, L., & Buchert, J. (2005).Kinetics of transglutaminase-induced cross-linking of wheat proteins in dough.Journal of Agricultural and Food Chemistry, 53(4), 1039-1045.
AOAC International, Official Methods of Analysis of AOAC International (16th edi-tion), AOAC International (1995), Washington, DC.
Bagagli, M. P., Jazaeri, S., Bock, J. E., Seetharaman, K., & Sato, H. H. (2014). Effectof transglutaminase, citrate buffer, and temperature on a soft wheat flour doughsystem. Cereal Chemistry, 91(5), 460-465.
Bankar, S. B., Bule, M. V., Singhal, R. S., & Ananthanarayan, L. (2009). Glucoseoxidase - an overview. Biotechnology Advances, 27(4), 489-501.
Basman, A., Köksel, H., & Ng, P. K. W. (2002). Effects of increasing levels of trans-glutaminase on the rheological properties and bread quality characteristics of twowheat flours. European Food Research and Technology, 215(5), 419-424.
Bauer, N., Koehler, P., Wieser, H., & Schieberle, P. (2003a). Studies on effects ofmicrobial transglutaminase on gluten proteins of wheat. I. Biochemical analysis.Cereal Chemistry, 80(6), 781-786.
Bauer, N., Koehler, P., Wieser, H., & Schieberle, P. (2003b). Studies on effects ofmicrobial transglutaminase on gluten proteins of wheat. II. Rheological properties.Cereal Chemistry, 80(6), 787-790.
Bloksma, A. H. (1975). Thiol and disulfide groups in dough rheology. Cereal Chem-istry, 52(3s), 170r-183r.
Bonet, A., Rosell, C. M., Caballero, P. A., Gómez, M., Pérez-Munuera, I., & Lluch,M. A. (2006). Glucose oxidase effect on dough rheology and bread quality: A studyfrom macroscopic to molecular level. Food Chemistry, 99(2), 408-415.
Bueno, M. M., Thys, R. C. S., & Rodrigues, R. C. (2016). Microbial enzymes assubstitutes of chemical additives in baking wheat flour? Part I: individual effectsof nine enzymes on flour dough rheology. Food and Bioprocess Technology, 9(12),2012-2023.
Caballero, P. A., Bonet, A., Rosell, C. M., & Gómez, M. (2005). Effect of micro-bial transglutaminase on the rheological and thermal properties of insect damagedwheat flour. Journal of Cereal Science, 42(1), 93-100.
Caballero, P. A., Gómez, M., & Rosell, C. M. (2007a). Improvement of dough rheol-ogy, bread quality and bread shelf-life by enzymes combination. Journal of FoodEngineering, 81(1), 42-53.
Enhancing the rheological performance of wheat flour dough 15
Caballero, P. A., Gómez, M., & Rosell, C. M. (2007b). Bread quality and dough rhe-ology of enzyme-supplemented wheat flour. European Food Research and Tech-nology,224(5), 525-534.
Dagdelen, A. F., & Gocmen, D. (2007). Effects of glucose oxidase, hemicellulase andascorbic acid on dough and bread quality. Journal of Food Quality, 30(6), 1009-1022.
Decamps, K., Joye, I. J., Haltrich, D., Nicolas, J., Courtin, C. M., & Delcour, J. A.(2012a). Biochemical characteristics of Trametes multicolor pyranose oxidase andAspergillus niger glucose oxidase and implications for their functionality in wheatflour dough. Food Chemistry, 131(4), 1485-1492.
Decamps, K., Joye, I. J., Courtin, C. M., & Delcour, J. A. (2012b). Glucose andpyranose oxidase improve bread dough stability. Journal of Cereal Science, 55(3),380-384.
Decamps, K., Joye, I. J., Rakotozafy, L., Nicolas, J., Courtin, C. M., & Delcour, J.A. (2013). The bread dough stability improving effect of pyranose oxidase fromTrametes multicolor and glucose oxidase from Aspergillus niger: unraveling themolecular mechanism. Journal of Agricultural and Food Chemistry, 61(32), 7848-7854.
Dobraszczyk, B. J, & Morgenstern, M. P. (2003). Rheology and the breadmakingprocess. Journal of Cereal Science, 38(3), 229-245.
Dunnewind, B., van Vliet, T., & Orsel, R. (2002). Effect of oxidative enzymes on bulkrheological properties of wheat flour doughs. Journal of Cereal Science, 36(3),357-366.
Folk, J. E., & Cole, P. W. (1966). Transglutaminase: mechanistic features of the activesite as determined by kinetic and inhibitor studies. Biochimica et Biophysica Acta,122(2), 244-264.
Gerrard, J. A., Fayle, S. E., Brown, P. A., Sutton, K. H., Simmons, L., & Rasiah, I.(2001). Effects of microbial transglutaminase on the wheat proteins of bread andcroissant dough. Journal of Food Science, 66(6), 782-786.
Hanft, F., & Koehler, P. (2005). Quantitation of dityrosine in wheat flour and doughby liquid chromatography-tandem mass spectrometry. Journal of Agricultural andFood Chemistry, 53(7), 2418-2423.
Hilhorst, R., Dunnewind, B., Orsel, R., Stegeman, P., van Vliet, T., Gruppen, H., &Schols, H. A. (1999). Baking performance, rheology, and chemical composition ofwheat dough and gluten affected by xylanase and oxidative enzymes. Journal ofFood Science, 64(5), 808-813.
Huang, W. N., Yuan, Y. L., Kim, Y. S., & Chung, O. K. (2008). Effects of trans-glutaminase on rheology, microstructure, and baking properties of frozen dough.Cereal Chemistry, 85(3), 301-306.
Kieliszek, M., & Misiewicz, A. (2014). Microbial transglutaminase and its applica-tion in the food industry. A review. Folia Microbiology, 59(3), 241-250.
Kokelaar, J. J., van Vliet, T., & Prins, A. (1996). Strain hardening properties andextensibility of flour and gluten doughs in relation to breadmaking performance.Journal of Cereal Science, 24(3), 199-214.
Kontogiorgos, V. (2011). Microstructure of hydrated gluten network. Food ResearchInternational, 44(9), 2582-2586.
16 Meerts et al.
Labat, E., Morel, M. H., & Rouau, X. (2001). Effect of laccase and manganese per-oxidase on wheat gluten and pentosans during mixing. Food Hydrocolloids, 15(1),47-52.
Larré, C., Denery-Papini, S., Popineau, Y., Deshayes, G., Desserme, C., & Lefebvre,J. (2000). Biochemical analysis and rheological properties of gluten modified bytransglutaminase. Cereal Chemistry, 77(2), 121-127.
Läuger, J., Wollny, K., & Huck, S. (2002). Direct strain oscillation: a new oscillatorymethod enabling measurements at very small shear stresses and strains. RheologicaActa, 41(4), 356-361.
McNaught, A. D., & Wilkinson, A. (1997). Compendium of Chemical Terminology.Oxford: Blackwell Scientific Publications.
Meerts, M., Cardinaels, R., Oosterlinck, F., Courtin, C. M., & Moldenaers, P. (2017).The interplay between the main flour constituents in the rheological behaviour ofwheat flour dough. Food and Bioprocess Technology, 10(2), 249-265.
Nonaka, M., Tanaka, H., Okiyama, A., Motoki, M., Ando, H., Umeda, K., & Mat-suura, A. (1989). Polymerization of several proteins by Ca+2-independent transg-lutaminase derived from microorganisms. Agricultural and Biological Chemistry,53(10), 2619-2623.
Ohtsuka, T., Umezawa, Y., Nio, N., & Kubota, K. (2001). Comparison of deamidationactivity of transglutaminases. Journal of Food Science, 66(1), 25-29.
Piber, M., & Koehler, P. (2005). Identification of dehydro-ferulic acid-tyrosine in ryeand wheat: evidence for a covalent cross-link between arabinoxylans and proteins.Journal of Agricultural and Food Chemistry, 53(13), 5276-5284.
Poulsen, C., & Høstrup, P. B. (1998). Purification and characterization of a hexoseoxidase with excellent strengthening effects in bread. Cereal Chemistry, 75(1), 51-57.
Rasiah, I. A., Sutton, K. H., Low, F. L., Lin, H.-M., & Gerrard, J. A. (2005).Crosslinking of wheat dough proteins by glucose oxidase and the resulting effectson bread and croissants. Food Chemistry, 89(3), 325-332.
Rosell, C. M., Wang, J., Aja, S., Bean, S., & Lookhart, G. (2003). Wheat flourproteins as affected by transglutaminase and glucose oxidase. Cereal Chemistry,80(1), 52-55.
Schiedt, B., Baumann, A., Conde-Petit, B., & Vilgis, T. A. (2013). Short- and long-range interactions governing the viscoelastic properties during wheat dough andmodel dough development. Journal of Texture Studies, 44(4), 317-332
Šimurina, O. D., Filipcev, B. V., Dapcevic Hadnadev, T. R., Ikonic, B. B., & BodrožaSolarov, M. I. (2014). Modification of the rheological properties of substandardquality wheat dough with different doses of selected enzymes. Food and Feed Re-search, 41(2), 93-102.
Steffolani, M. E., Ribotta, P. D., Pérez, G. T., & León, A. E. (2010). Effect of glucoseoxidase, transglutaminase, and pentosanase on wheat proteins: relationship withdough properties and bread-making quality. Journal of Cereal Science, 51(3), 366-373.
Tilley, K. A., Benjamin, R. E., Bagorogoza, K. E., Okot-Kotber, B. M., Prakash, O.,& Kwen, H. (2001). Tyrosine cross-links: Molecular basis of gluten structure andfunction. Journal of Agricultural and Food Chemistry, 49(5), 2627-2632.

Enhancing the rheological performance of wheat flour dough 17
Van Bockstaele, F., De Leyn, I., Eeckhout, M., & Dewettinck, K. (2008). Rheologicalproperties of wheat flour dough and the relationship with bread volume. I. Creep-recovery measurements. Cereal Chemistry, 85(6), 753-761.
van Vliet, T. (2008). Strain hardening as an indicator of bread-making performance:a review with discussion. Journal of Cereal Science, 48(1), 1-9.
Vemulapalli, V., Miller, K. A., & Hoseney, R. C. (1998). Glucose oxidase in bread-making systems. Cereal Chemistry, 75(4), 439-442.
Veraverbeke, W. S., & Delcour, J. A. (2002). Wheat protein composition and proper-ties of wheat glutenin in relation to breadmaking functionality. Critical Reviews inFood Science and Nutrition, 42(3), 179-208.
18 Meerts et al.
List of Figures
1 (a) Storage modulus G′ and phase angle δ for Bilux dough plottedversus angular frequency ω in the linear region (strain amplitude γ0= 0.06 %). The three samples correspond to standard dough, doughsupplemented with 1.8 U GO/g flour, and dough supplemented with5 U TG/g flour. (b) Dynamic moduli G′ and G′′ at ω = 1 rad/s for thestandard Bilux dough and Bilux dough supplemented with differentconcentrations of GO (0.03, 0.6, 1.8 and 3.6 U/g flour) and TG (0.5,2, 5 and 10 U/g flour). The dynamic moduli were determined exactlyone hour after mixing. Error bars indicate the standard deviation; G′
values indicated with different letters are significantly different (p< 0.05) . . . . . . . . . . . . . . . . . . . . . . . . . . . . . . . . . 19
2 (a) Extensional behaviour of standard strong Bilux dough and strongBilux dough supplemented with 0.03 U GO/g flour and 0.90 U GO/gflour. (b) The strain-hardening index of strong Bilux dough as a func-tion of GO and TG concentration. All measurements were performed30 min after mixing. Error bars indicate the standard deviation . . . . 20
3 Non-linear creep-recovery curves (stress σ = 500 Pa applied during1800 s) for standard strong Bilux dough and strong Bilux dough pre-pared with different amounts of GO (0.03 - 0.30 - 1.80 - 3.60 U/gflour). Measurements were performed one hour after mixing . . . . . 21
4 (a) Extensional behaviour of standard weak Bison dough and Bisondough supplemented with "optimal" amounts of GO (0.03 U/g flour)and TG (0.50 U/g flour) or (b) with 1.5 wt% and 3.0 wt% supple-mentary gluten. The response of the strong Bilux dough is added forcomparison in (a) and (b). All measurements were performed 30 minafter mixing. SHI values are given as mean ± standard deviation . . . 22
5 (a) Non-linear creep-recovery curves for standard weak Bison doughand Bison dough supplemented with "optimal" amounts of GO (0.03U/g flour) and TG (0.50 U/g flour) or (b) with 1.5 wt% and 3.0 wt%supplementary gluten. The creep-recovery response of the strong Biluxdough is added for comparison in (a) and (b). All measurements wereperformed one hour after mixing . . . . . . . . . . . . . . . . . . . . 23
FIGURES 19
0.1 1 10 100
103
104
ω [rad/s]
G' [
Pa]
G' Bilux standardG' Bilux + GOG' Bilux + TG 0
10
20
30
40
50
δ [°
]
δ Bilux standardδ Bilux + GOδ Bilux + TG
(a)
0
3000
6000
9000
12000
15000
GO or TG conc. [U/g flour]
G',
G"
[Pa]
SAOS GO enzym G'SAOS GO enzym G"SAOS GO en TG Bilux G' Bilux omega 1 rad/s TGSAOS GO en TG Bilux G"SAOS GO en TG Bilux G' Bilux omega 1 rad/sSAOS GO en TG Bilux G"
GO TGStandard
a/αβ
γ
δδ
b
c
c,d d
0.03 0.6 1.8 3.6 0.5 2 5 10
G'
G"
(b)
Fig. 1 (a) Storage modulus G′ and phase angle δ for Bilux dough plotted versusangular frequency ω in the linear region (strain amplitude γ0 = 0.06 %). The threesamples correspond to standard dough, dough supplemented with 1.8 U GO/g flour,and dough supplemented with 5 U TG/g flour. (b) Dynamic moduli G′ and G′′ at ω
= 1 rad/s for the standard Bilux dough and Bilux dough supplemented with differentconcentrations of GO (0.03, 0.6, 1.8 and 3.6 U/g flour) and TG (0.5, 2, 5 and 10 U/gflour). The dynamic moduli were determined exactly one hour after mixing. Errorbars indicate the standard deviation; G′ values indicated with different letters aresignificantly different (p < 0.05)
20 FIGURES
0.01 0.1 1103
104
105
106
ε [-]
η e+ [Pa
s]
Bilux standardBilux + 0.03 U GO/g flourBilux + 0.90 U GO/g flour
(I)
(II)
(a)
0 1 2 3 4 5 610
15
20
25
GO [0.1 U/g flour] or TG [U/g flour]
SHI [
-]
Bilux + GOBilux + TG
(I) (II)
(b)
Fig. 2 (a) Extensional behaviour of standard strong Bilux dough and strong Biluxdough supplemented with 0.03 U GO/g flour and 0.90 U GO/g flour. (b) The strain-hardening index of strong Bilux dough as a function of GO and TG concentration. Allmeasurements were performed 30 min after mixing. Error bars indicate the standarddeviation
FIGURES 21
0 1000 2000 3000 4000 5000 60000
5
10
15
t [s]
J [10
-3 P
a-1] Bilux standard
Bilux + 0.03 U GO/g flourBilux + 0.30 U GO/g flourBilux + 1.80 U GO/g flourBilux + 3.60 U GO/g flour
Jcmax
Jrmax
Fig. 3 Non-linear creep-recovery curves (stress σ = 500 Pa applied during 1800s) for standard strong Bilux dough and strong Bilux dough prepared with differentamounts of GO (0.03 - 0.30 - 1.80 - 3.60 U/g flour). Measurements were performedone hour after mixing
22 FIGURES
0.01 0.1 1103
104
105
106
ε [-]
η e+ [Pa
s]
Bison standardBison + 0.03 U GO/g flourBison + 0.50 U TG/g flourBilux standard
16.7 ± 2.5
SHI values13.1 ± 1.0
17.1 ± 3.717.0 ± 1.6
(a)
0.01 0.1 1103
104
105
106
ε [-]
η e+ [Pa
s]
Bison standardBison + 1.5 wt% glutenBison + 3.0 wt% glutenBilux standard
SHI values13.1 ± 1.017.8 ± 2.417.2 ± 3.217.0 ± 1.6
(b)
Fig. 4 (a) Extensional behaviour of standard weak Bison dough and Bison doughsupplemented with "optimal" amounts of GO (0.03 U/g flour) and TG (0.50 U/gflour) or (b) with 1.5 wt% and 3.0 wt% supplementary gluten. The response of thestrong Bilux dough is added for comparison in (a) and (b). All measurements wereperformed 30 min after mixing. SHI values are given as mean ± standard deviation
FIGURES 23
0 1000 2000 3000 4000 50000
5
10
15
20
25
30
t [s]
Bison standardBison + 0.03 U GO/g flourBison + 0.50 U TG/g flourBilux standard
J [10
-3 P
a-1]
(a)
0 1000 2000 3000 4000 50000
5
10
15
20
25
30
t [s]
Bison standardBison + 1.5 wt% glutenBison + 3.0 wt% glutenBilux standard
J [10
-3 P
a-1]
(b)
Fig. 5 (a) Non-linear creep-recovery curves for standard weak Bison dough andBison dough supplemented with "optimal" amounts of GO (0.03 U/g flour) and TG(0.50 U/g flour) or (b) with 1.5 wt% and 3.0 wt% supplementary gluten. The creep-recovery response of the strong Bilux dough is added for comparison in (a) and (b).All measurements were performed one hour after mixing
24 FIGURES
List of Tables
1 Parameters (mean± standard deviation) characterising the non-linearcreep-recovery behaviour of Bilux dough supplemented with 0.03 UGO/g flour, 1.80 U GO/g flour, 0.50 U TG/g flour and 5.00 U TG/gflour, respectively. A creep stress σ of 500 Pa was applied during 30min, followed by 60 min of recovery. Values marked with an asteriskdiffer significantly from the corresponding values for the standardBilux dough (p < 0.05) . . . . . . . . . . . . . . . . . . . . . . . . . 25
2 Parameters (mean± standard deviation) characterising the non-linearcreep-recovery behaviour of Bison dough supplemented with 0.03 UGO/g flour, 0.50 U TG/g flour, 1.5 wt% gluten and 3.0 wt% gluten,respectively. A creep stress σ of 500 Pa was applied during 30 min,followed by 60 min of recovery. Values marked with an asterisk differsignificantly from the corresponding values for the standard Bisondough (p < 0.05) . . . . . . . . . . . . . . . . . . . . . . . . . . . . 26
TABLES 25
Table 1 Parameters (mean ± standard deviation) characterising the non-linearcreep-recovery behaviour of Bilux dough supplemented with 0.03 U GO/g flour, 1.80U GO/g flour, 0.50 U TG/g flour and 5.00 U TG/g flour, respectively. A creep stress σ
of 500 Pa was applied during 30 min, followed by 60 min of recovery. Values markedwith an asterisk differ significantly from the corresponding values for the standardBilux dough (p < 0.05)
Bilux low GO high GO low TG high TG
Jmaxc [10-3 Pa-1] 16.8 ± 0.48 13.7 ± 0.58* 2.4 ± 0.13* 8.4 ± 0.83* 0.5 ± 0.02*
Jmaxr [10-3 Pa-1] 2.1 ± 0.16 1.9 ± 0.03 0.8 ± 0.01* 1.3 ± 0.08* 0.3 ± 0.01*recovery [%] 12.5 ± 1.34 13.8 ± 0.35 33.3 ± 0.23* 15.4 ± 3.40 60.0 ± 0.59*
26 TABLES
Table 2 Parameters (mean ± standard deviation) characterising the non-linearcreep-recovery behaviour of Bison dough supplemented with 0.03 U GO/g flour, 0.50U TG/g flour, 1.5 wt% gluten and 3.0 wt% gluten, respectively. A creep stress σ of500 Pa was applied during 30 min, followed by 60 min of recovery. Values markedwith an asterisk differ significantly from the corresponding values for the standardBison dough (p < 0.05)
Bison + GO + TG + 1.5 wt% gluten + 3.0 wt% gluten
Jmaxc [10-3 Pa-1] 29.1 ± 0.30 25.0 ± 0.57* 12.2 ± 1.62* 22.3 ± 0.23* 12.3 ± 0.10*
Jmaxr [10-3 Pa-1] 1.6 ± 0.09 1.6 ± 0.07 1.1 ± 0.08* 1.7 ± 0.12 1.6 ± 0.03recovery [%] 5.5 ± 0.39 6.4 ± 0.13 9.0 ± 0.60* 7.6 ± 0.56* 13.0 ± 0.21*