Embed Size (px)
Citation preview
20778.04 01/09/11 Proof 5
Spectris plc Interim Report 2011
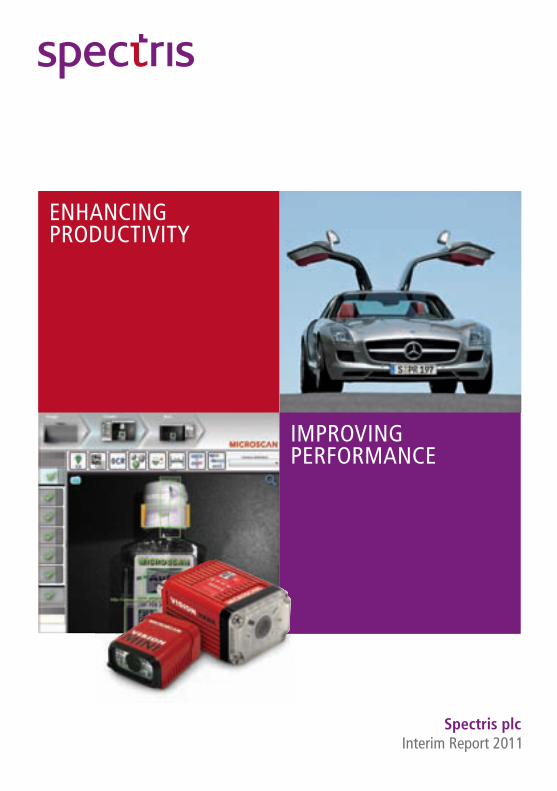
ImpRovIng peRfoRmance
enhancIngpRoductIvIty
20778SPECTRIScvr.indd 2 01/09/2011 10:27:12
20778.04 01/09/11 Proof 5
Spectris plc is a leading supplier of productivity-enhancing instrumentation and controls. the company’s products and technologies help customers to improve product quality and performance, improve core manufacturing processes, reduce downtime and wastage, and reduce time to market. Its global customer base spans a diverse range of end user markets.
Spectris operates across four business segments which reflect the applications and industries it serves: materials analysis, test and measurement, In-line Instrumentation and Industrial controls. headquartered in egham, Surrey, england, the company employs over 6,400 people, with offices in more than 30 countries. for more information, visit www.spectris.com.
contents
The Interim Report contains certain forward-looking statements with respect to the operations, performance and financial condition of the company. By their nature, these statements involve uncertainties since future events and circumstances can cause actual results to differ materially from those anticipated and no reliance should be placed on them. The forward-looking statements reflect knowledge and information available at the date of preparation of this Interim Report and the company undertakes no obligation to update these forward-looking statements. Nothing in this Interim Report should be construed as a profit forecast.
01 Highlights02 Group at a Glance04 Chairman’s Statement06 Chief Executive’s Review08 Operating Review15 Financial Review17 Principal Risks and Uncertainties17 Statement of Directors’ Responsibilities18 Interim Financial Statements25 Notes to the Interim Financial Statements39 Shareholder Information This report is printed on Revive 50 Silk, a recycled paper containing 50% recycled waste and 50% virgin fibre and
manufactured at a mill certified to the ISO 14001 environmental management standard.
The pulp used in this product is bleached using an Elemental Chlorine Free Process.
© Spectris plc August 2011
PhotographyImage on page 8 courtesy of Boliden ABImage on page 10 courtesy of Mercedes-AMG
“Spectris” is a trade mark of Spectris plc and is protected by registration in the United Kingdom and other jurisdictions. Other product names referred to in this interim report are registered or unregistered trade marks or registered names of Spectris plc or its subsidiary companies and are similarly protected.
20778SPECTRIScvr.indd 3 01/09/2011 10:27:12
Spectris plc Interim Report 2011 1
20778.04 01/09/11 Proof 5
Highlights
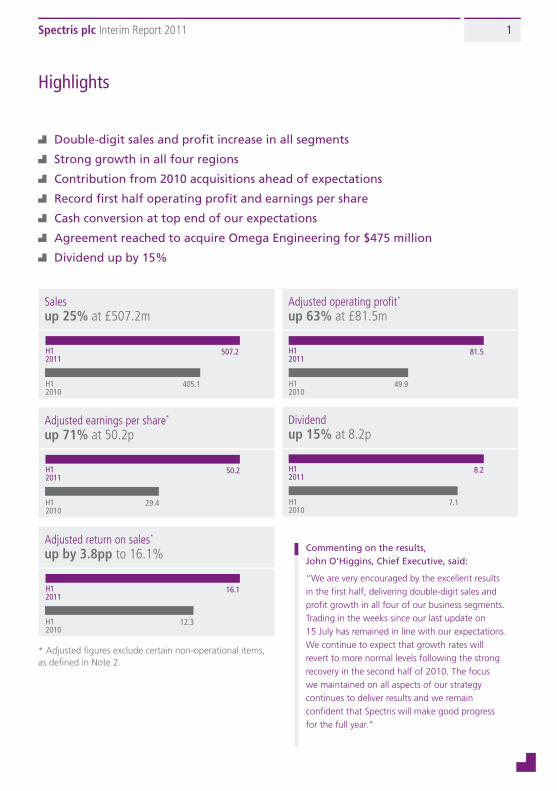
Double-digit sales and profit increase in all segments
Strong growth in all four regions
Contribution from 2010 acquisitions ahead of expectations
Record first half operating profit and earnings per share
Cash conversion at top end of our expectations
Agreement reached to acquire Omega Engineering for $475 million
Dividend up by 15%
Salesup 25% at £507.2m
H12011
507.2
405.1H12010
Adjusted return on sales*
up by 3.8pp to 16.1%
H12011
16.1
12.3H12010
Dividendup 15% at 8.2p
H12011
8.2
7.1H12010
Adjusted operating profit*
up 63% at £81.5m
H12011
81.5
49.9H12010
Adjusted earnings per share*
up 71% at 50.2p
H12011
50.2
29.4H12010
Commenting on the results, John O’Higgins, Chief Executive, said:
“We are very encouraged by the excellent results in the first half, delivering double-digit sales and profit growth in all four of our business segments. Trading in the weeks since our last update on 15 July has remained in line with our expectations. We continue to expect that growth rates will revert to more normal levels following the strong recovery in the second half of 2010. The focus we maintained on all aspects of our strategy continues to deliver results and we remain confident that Spectris will make good progress for the full year.”
* Adjusted figures exclude certain non-operational items, as defined in Note 2.
20778SPECTRIS.indd 1 01/09/2011 10:26:21
Spectris plc Interim Report 2011Spectris plc Interim Report 20112
20778.04 01/09/11 Proof 5
Group at a Glance
MaterialS analySiS
teSt and MeaSureMent
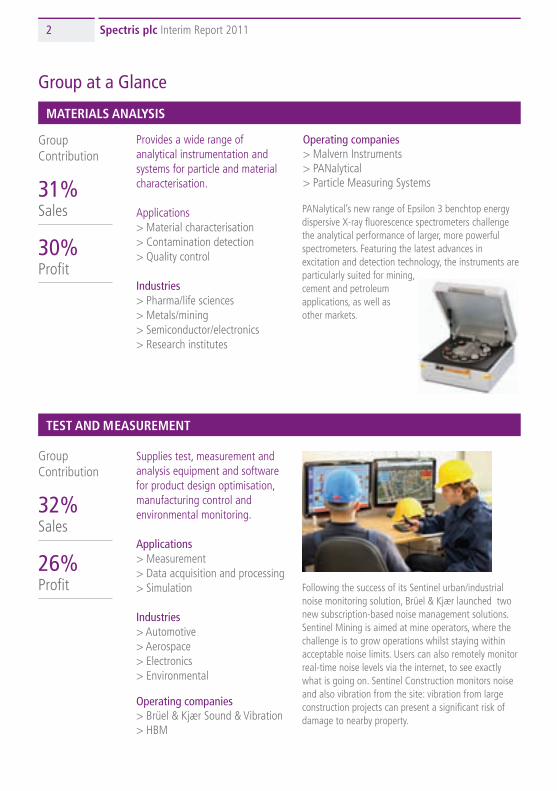
Provides a wide range of analytical instrumentation and systems for particle and material characterisation.
Applications> Material characterisation> Contamination detection> Quality control
Industries> Pharma/life sciences> Metals/mining> Semiconductor/electronics> Research institutes
Supplies test, measurement and analysis equipment and software for product design optimisation, manufacturing control andenvironmental monitoring.
Applications> Measurement> Data acquisition and processing> Simulation
Industries> Automotive> Aerospace> Electronics> Environmental
PANalytical’s new range of Epsilon 3 benchtop energy dispersive X-ray fluorescence spectrometers challenge the analytical performance of larger, more powerful spectrometers. Featuring the latest advances in excitation and detection technology, the instruments are particularly suited for mining, cement and petroleum applications, as well as other markets.
Following the success of its Sentinel urban/industrial noise monitoring solution, Brüel & Kjær launched two new subscription-based noise management solutions. Sentinel Mining is aimed at mine operators, where the challenge is to grow operations whilst staying within acceptable noise limits. Users can also remotely monitor real-time noise levels via the internet, to see exactly what is going on. Sentinel Construction monitors noise and also vibration from the site: vibration from large construction projects can present a significant risk of damage to nearby property.
31% Sales
30% Profit
Group Contribution
29% Sales
34% Profit
Group Contribution
32% Sales
26% Profit
Group Contribution
8% Sales
10% Profit
Group Contribution
Operating companies> Malvern Instruments> PANalytical> Particle Measuring Systems
Operating companies> Brüel & Kjær Sound & Vibration> HBM
20778SPECTRIS.indd 2 01/09/2011 10:26:24
Spectris plc Interim Report 2011 3
20778.04 01/09/11 Proof 5
Group at a Glance
MaterialS analySiS in-line inStruMentation
teSt and MeaSureMent induStrial ControlS
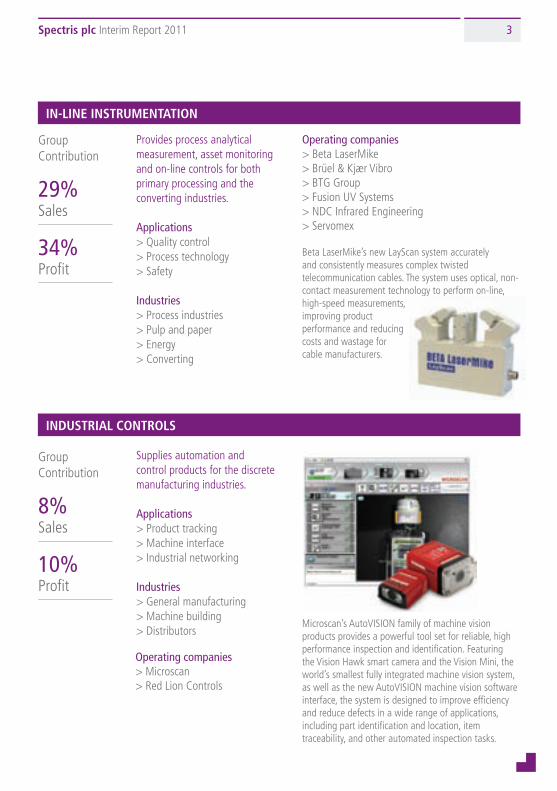
Provides process analytical measurement, asset monitoring and on-line controls for both primary processing and the converting industries.
Applications> Quality control> Process technology> Safety
Industries> Process industries> Pulp and paper> Energy> Converting
Supplies automation and control products for the discrete manufacturing industries.
Applications> Product tracking> Machine interface> Industrial networking
Industries> General manufacturing> Machine building> Distributors
PANalytical’s new range of Epsilon 3 benchtop energy dispersive X-ray fluorescence spectrometers challenge the analytical performance of larger, more powerful spectrometers. Featuring the latest advances in excitation and detection technology, the instruments are particularly suited for mining, cement and petroleum applications, as well as other markets.
Beta LaserMike’s new LayScan system accurately and consistently measures complex twisted telecommunication cables. The system uses optical, non-contact measurement technology to perform on-line, high-speed measurements, improving product performance and reducing costs and wastage for cable manufacturers.
Following the success of its Sentinel urban/industrial noise monitoring solution, Brüel & Kjær launched two new subscription-based noise management solutions. Sentinel Mining is aimed at mine operators, where the challenge is to grow operations whilst staying within acceptable noise limits. Users can also remotely monitor real-time noise levels via the internet, to see exactly what is going on. Sentinel Construction monitors noise and also vibration from the site: vibration from large construction projects can present a significant risk of damage to nearby property.
Microscan’s AutoVISION family of machine vision products provides a powerful tool set for reliable, high performance inspection and identification. Featuring the Vision Hawk smart camera and the Vision Mini, the world’s smallest fully integrated machine vision system, as well as the new AutoVISION machine vision software interface, the system is designed to improve efficiency and reduce defects in a wide range of applications, including part identification and location, item traceability, and other automated inspection tasks.
29% Sales
34% Profit
Group Contribution
8% Sales
10% Profit
Group Contribution
Operating companies> Beta LaserMike> Brüel & Kjær Vibro> BTG Group> Fusion UV Systems> NDC Infrared Engineering> Servomex
Operating companies> Microscan> Red Lion Controls
20778SPECTRIS.indd 3 01/09/2011 10:26:26
Spectris plc Interim Report 2011Spectris plc Interim Report 20114
20778.04 01/09/11 Proof 5
Chairman’s Statement
Introduction
Spectris achieved an excellent performance in the first half of 2011, in terms of both revenue and adjusted operating profit. The focus we maintained on delivery of all aspects of our strategy was instrumental in enabling us to achieve this.
Strong customer demand led to revenue for the half year increasing to £507.2 million (H1 2010: £405.1 million) and adjusted operating profit* increasing by 63% to £81.5 million (H1 2010: £49.9 million). On a reported basis, revenue growth was 25%, including a contribution from acquisitions of +5% and the impact from currency of -1%. On a constant currency organic (like-for-like) basis, growth was therefore 21%. The operating margin increased by 3.8 percentage points to 16.1%, largely driven by volume, and this represents a record since the company became Spectris plc in 2001.
Profit before tax increased by 74% to £77.7 million (H1 2010: £44.7 million) and earnings per share increased by 71% from 29.4 pence to 50.2 pence.
Cash conversion was at the top end of our expectations, with 78% of operating profit converted into operating cash. Planned increases in working capital and capex spend were the primary drivers behind the reduction in the cash conversion rate compared with the prior year. Net debt decreased by £12.5 million to £73.7 million from £86.2 million at the end of December 2010. Net interest costs were £3.8 million.
The Board has declared an interim dividend of 8.2 pence (H1 2010: 7.1 pence), an increase of 15%. This is consistent with our policy of making progressive dividend payments based upon affordability and sustainability. The dividend will be paid on 11 November 2011 to shareholders on the register at the close of business on 21 October 2011.
On 15 August, we announced that we had reached agreement to acquire the Omega Engineering business for US$475 million (approximately £290 million). Omega provides a broad range of process measurement and control instrumentation to customers in industrial and academic markets and
represents a significant strategic growth platform for our Industrial Controls segment. In addition to being earnings-enhancing in the first full financial year of ownership, we see significant opportunities to develop the business, particularly internationally. The transaction is expected to close in Q4 of this year.
Outlook
We are very encouraged by the excellent results in the first half, with sales and profit growth in all four of our business segments. Trading in the weeks since our last update on 15 July has remained in line with our expectations. We continue to expect that growth rates will revert to more normal levels following the strong recovery in the second half of 2010. The focus we maintained on all aspects of our strategy continues to deliver results and we remain confident that Spectris will make good progress for the full year.
John HughesChairman
* Unless stated otherwise, figures quoted for operating profit, net interest, profit before tax, tax, earnings per share and operating cash flow are adjusted measures – for explanation of adjusted figures and reconciliation to the statutory reported figures see Notes 2 and 7.
Spectris achieved an excellent performance in the first half of 2011, in terms of both revenue and adjusted operating profit.
20778SPECTRIS.indd 4 01/09/2011 10:26:27
Spectris plc Interim Report 2011 5
20778.04 01/09/11 Proof 5
Chairman’s Statement
Introduction
Spectris achieved an excellent performance in the first half of 2011, in terms of both revenue and adjusted operating profit. The focus we maintained on delivery of all aspects of our strategy was instrumental in enabling us to achieve this.
Strong customer demand led to revenue for the half year increasing to £507.2 million (H1 2010: £405.1 million) and adjusted operating profit* increasing by 63% to £81.5 million (H1 2010: £49.9 million). On a reported basis, revenue growth was 25%, including a contribution from acquisitions of +5% and the impact from currency of -1%. On a constant currency organic (like-for-like) basis, growth was therefore 21%. The operating margin increased by 3.8 percentage points to 16.1%, largely driven by volume, and this represents a record since the company became Spectris plc in 2001.
Profit before tax increased by 74% to £77.7 million (H1 2010: £44.7 million) and earnings per share increased by 71% from 29.4 pence to 50.2 pence.
Cash conversion was at the top end of our expectations, with 78% of operating profit converted into operating cash. Planned increases in working capital and capex spend were the primary drivers behind the reduction in the cash conversion rate compared with the prior year. Net debt decreased by £12.5 million to £73.7 million from £86.2 million at the end of December 2010. Net interest costs were £3.8 million.
The Board has declared an interim dividend of 8.2 pence (H1 2010: 7.1 pence), an increase of 15%. This is consistent with our policy of making progressive dividend payments based upon affordability and sustainability. The dividend will be paid on 11 November 2011 to shareholders on the register at the close of business on 21 October 2011.
On 15 August, we announced that we had reached agreement to acquire the Omega Engineering business for US$475 million (approximately £290 million). Omega provides a broad range of process measurement and control instrumentation to customers in industrial and academic markets and
represents a significant strategic growth platform for our Industrial Controls segment. In addition to being earnings-enhancing in the first full financial year of ownership, we see significant opportunities to develop the business, particularly internationally. The transaction is expected to close in Q4 of this year.
Outlook
We are very encouraged by the excellent results in the first half, with sales and profit growth in all four of our business segments. Trading in the weeks since our last update on 15 July has remained in line with our expectations. We continue to expect that growth rates will revert to more normal levels following the strong recovery in the second half of 2010. The focus we maintained on all aspects of our strategy continues to deliver results and we remain confident that Spectris will make good progress for the full year.
John HughesChairman
* Unless stated otherwise, figures quoted for operating profit, net interest, profit before tax, tax, earnings per share and operating cash flow are adjusted measures – for explanation of adjusted figures and reconciliation to the statutory reported figures see Notes 2 and 7.
The focus we maintained on all aspects of our strategy continues to deliver results and we remain confident that Spectris will make good progress for the full year.
20778SPECTRIS.indd 5 01/09/2011 10:26:27
Spectris plc Interim Report 2011Spectris plc Interim Report 20116
20778.04 01/09/11 Proof 5
Chief Executive’s Review
Introduction
The recovery in our markets which accelerated in the second half of 2010 has continued into 2011, with strong demand in all regions and end markets. The 21% growth in like-for-like sales was balanced across the group, with all four business segments seeing double-digit sales and profit growth. Regionally, North America grew by 26%, Asia Pacific by 21%, Europe by 18% and rest of the world by 27%. The adjusted operating margin, at 16.1%, is 3.8pp higher than in the same period last year and is the highest first half margin in 14 years.
Strategy
We continued to make good progress on our strategy during the first half. Some of the highlights are illustrated below:
Strengthening market positions through innovation
We maintained our investment in research and development, with expenditure at £34.5 million in the first half, or 6.8% of sales, and we launched a number of new products, technologies and applications across the group. Notable amongst these was the Epsilon 3 benchtop X-ray fluorescence (XRF) spectrometer. This combines the latest excitation and detection technology with state-of-the-art analysis software to provide best in class analytical performance, challenging that of larger, more powerful spectrometers, and is particularly suitable for mining, cement and petroleum applications. We also launched the Facility Pro Environmental Monitoring System. This system is unique in combining both biological and particle contamination monitoring on a single platform for cleanroom environments in drug manufacture. In June, we launched the next generation of vibration controllers. Featuring the latest technology, these modular products are designed for a wide range of applications including large-scale satellite pre-launch vibration testing and fatigue durability testing, where they can reduce testing times by up to 70%.
Increasing regional expansion with a focus on emerging markets
Asia Pacific continued to see strong growth, with sales up by 21% on a like-for-like basis. This remains our second-largest regional market, and its share of total group sales is now just 2pp behind Europe. We also saw strong growth in Latin America, particularly Brazil, where sales increased by almost 30% compared with the prior year period. In order to respond to the growth in demand, we have significantly increased our
The recovery in our markets which accelerated in the second half of 2010 has continued into 2011, with strong demand in all regions and end markets.
resources in Brazil, both in the number of people employed and also in a new facility in São Paulo which allows for applications laboratories and training rooms, extending the services available to customers in this region.
Building our presence in key strategic growth areas, both organically and through acquisition
The new products we launched in the first half continued to build our presence in key markets and regions. These are described in more detail in the review which follows. Sales accruing from service and consumables grew by 18% to account for 27% of group sales. The planned acquisition of Omega Engineering represents a strategic platform for growth within the Industrial Controls segment. Including Omega Engineering, on a pro-forma basis, Industrial Controls would account for more than 15% of group sales.
Growing existing businesses through acquisition
Successful integration of the businesses acquired in 2010 has resulted in a contribution to the group exceeding our expectations. On 11 August, we announced the acquisition of IRM Group SA, which extends our gauging product capabilities to the increasingly important metals processing market and also strengthens our global distribution channels, particularly in emerging markets.
Focusing on operational excellence
Management focus on improving operational efficiency continued throughout the group. Our strategic sourcing teams continued to deliver benefits across the group, with the value of items sourced or manufactured in lower-cost countries, principally Asia and Eastern Europe, increasing to approximately 12% of the total cost of goods sold. At our Red Lion Controls business in North America, cell cycle time for one product range has been reduced from 72 hours to 33 hours as a result of layout changes that have improved flow and further efficiency gains are possible as incremental improvements are applied.
John O’HigginsChief Executive
20778SPECTRIS.indd 6 01/09/2011 10:26:29
Spectris plc Interim Report 2011 7
20778.04 01/09/11 Proof 5
Chief Executive’s Review
Introduction
The recovery in our markets which accelerated in the second half of 2010 has continued into 2011, with strong demand in all regions and end markets. The 21% growth in like-for-like sales was balanced across the group, with all four business segments seeing double-digit sales and profit growth. Regionally, North America grew by 26%, Asia Pacific by 21%, Europe by 18% and rest of the world by 27%. The adjusted operating margin, at 16.1%, is 3.8pp higher than in the same period last year and is the highest first half margin in 14 years.
Strategy
We continued to make good progress on our strategy during the first half. Some of the highlights are illustrated below:
Strengthening market positions through innovation
We maintained our investment in research and development, with expenditure at £34.5 million in the first half, or 6.8% of sales, and we launched a number of new products, technologies and applications across the group. Notable amongst these was the Epsilon 3 benchtop X-ray fluorescence (XRF) spectrometer. This combines the latest excitation and detection technology with state-of-the-art analysis software to provide best in class analytical performance, challenging that of larger, more powerful spectrometers, and is particularly suitable for mining, cement and petroleum applications. We also launched the Facility Pro Environmental Monitoring System. This system is unique in combining both biological and particle contamination monitoring on a single platform for cleanroom environments in drug manufacture. In June, we launched the next generation of vibration controllers. Featuring the latest technology, these modular products are designed for a wide range of applications including large-scale satellite pre-launch vibration testing and fatigue durability testing, where they can reduce testing times by up to 70%.
Increasing regional expansion with a focus on emerging markets
Asia Pacific continued to see strong growth, with sales up by 21% on a like-for-like basis. This remains our second-largest regional market, and its share of total group sales is now just 2pp behind Europe. We also saw strong growth in Latin America, particularly Brazil, where sales increased by almost 30% compared with the prior year period. In order to respond to the growth in demand, we have significantly increased our
resources in Brazil, both in the number of people employed and also in a new facility in São Paulo which allows for applications laboratories and training rooms, extending the services available to customers in this region.
Building our presence in key strategic growth areas, both organically and through acquisition
The new products we launched in the first half continued to build our presence in key markets and regions. These are described in more detail in the review which follows. Sales accruing from service and consumables grew by 18% to account for 27% of group sales. The planned acquisition of Omega Engineering represents a strategic platform for growth within the Industrial Controls segment. Including Omega Engineering, on a pro-forma basis, Industrial Controls would account for more than 15% of group sales.
Growing existing businesses through acquisition
Successful integration of the businesses acquired in 2010 has resulted in a contribution to the group exceeding our expectations. On 11 August, we announced the acquisition of IRM Group SA, which extends our gauging product capabilities to the increasingly important metals processing market and also strengthens our global distribution channels, particularly in emerging markets.
Focusing on operational excellence
Management focus on improving operational efficiency continued throughout the group. Our strategic sourcing teams continued to deliver benefits across the group, with the value of items sourced or manufactured in lower-cost countries, principally Asia and Eastern Europe, increasing to approximately 12% of the total cost of goods sold. At our Red Lion Controls business in North America, cell cycle time for one product range has been reduced from 72 hours to 33 hours as a result of layout changes that have improved flow and further efficiency gains are possible as incremental improvements are applied.
John O’HigginsChief Executive
The adjusted operating margin, at 16.1%, is the highest first half margin in 14 years.
20778SPECTRIS.indd 7 01/09/2011 10:26:29
Spectris plc Interim Report 2011Spectris plc Interim Report 20118
20778.04 01/09/11 Proof 5
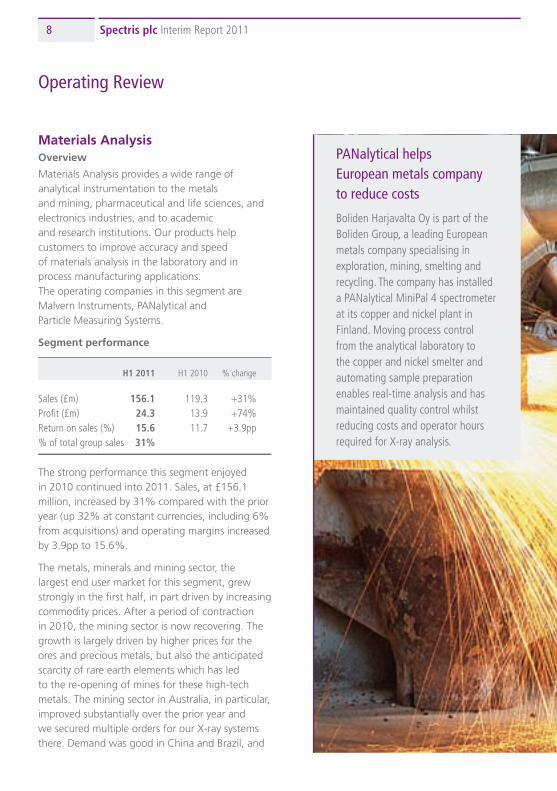
PANalytical helps European metals company to reduce costs
Boliden Harjavalta Oy is part of the Boliden Group, a leading European metals company specialising in exploration, mining, smelting and recycling. The company has installed a PANalytical MiniPal 4 spectrometer at its copper and nickel plant in Finland. Moving process control from the analytical laboratory to the copper and nickel smelter and automating sample preparation enables real-time analysis and has maintained quality control whilst reducing costs and operator hours required for X-ray analysis.
Operating Review
Materials AnalysisOverview
Materials Analysis provides a wide range of analytical instrumentation to the metals and mining, pharmaceutical and life sciences, and electronics industries, and to academic and research institutions. Our products help customers to improve accuracy and speed of materials analysis in the laboratory and in process manufacturing applications. The operating companies in this segment are Malvern Instruments, PANalytical and Particle Measuring Systems.
Segment performance
H1 2011 H1 2010 % change
Sales (£m) 156.1 119.3 +31%Profit (£m) 24.3 13.9 +74%Return on sales (%) 15.6 11.7 +3.9pp% of total group sales 31%
The strong performance this segment enjoyed in 2010 continued into 2011. Sales, at £156.1 million, increased by 31% compared with the prior year (up 32% at constant currencies, including 6% from acquisitions) and operating margins increased by 3.9pp to 15.6%.
The metals, minerals and mining sector, the largest end user market for this segment, grew strongly in the first half, in part driven by increasing commodity prices. After a period of contraction in 2010, the mining sector is now recovering. The growth is largely driven by higher prices for the ores and precious metals, but also the anticipated scarcity of rare earth elements which has led to the re-opening of mines for these high-tech metals. The mining sector in Australia, in particular, improved substantially over the prior year and we secured multiple orders for our X-ray systems there. Demand was good in China and Brazil, and
20778SPECTRIS.indd 8 01/09/2011 10:26:31
Spectris plc Interim Report 2011 9
20778.04 01/09/11 Proof 5
Operating Review
we also received two orders for sample-handling automated laboratories in Germany. Investment in urbanisation and infrastructure projects continued in a number of countries, particularly in China, India and the Middle East, resulting in good demand for our products in construction-related markets. In China, in particular, the interest for X-ray analysis for cement production control remains high.
Continued investment by pharmaceutical manufacturers, particularly in emerging regions, has resulted in good demand for our products. The growth of the bio-pharmaceutical market has created additional opportunities for our products which are used for protein and antibody characterisation. The purity and stability of bio-therapeutic formulations is of particular interest as this determines the shelf life, as well as the efficacy or potential for adverse immune response, of the drug. In March, China introduced more stringent drug development and manufacturing regulations, bringing them closer to those in Europe and the US. As a result, our environmental monitoring systems and microbial monitors, which are used in cleanrooms for drug manufacture, proved highly successful there. In June, we launched the Facility Pro Environmental Monitoring System, which is unique in combining both biological and particle contamination monitoring on a single platform for cleanroom environments in drug manufacture. This integrated system reduces overall cost and has more powerful data management and control capabilities.
Sales to the academic sector and to research institutions continued to grow, with demand especially high in emerging economies such as China, where the government’s goal of raising industrial competitiveness is driving investment in research institutes and universities. There is particular focus on alternative energy, new materials development, biotech and machine
20778SPECTRIS.indd 9 01/09/2011 10:26:32
Spectris plc Interim Report 2011Spectris plc Interim Report 201110
20778.04 01/09/11 Proof 5
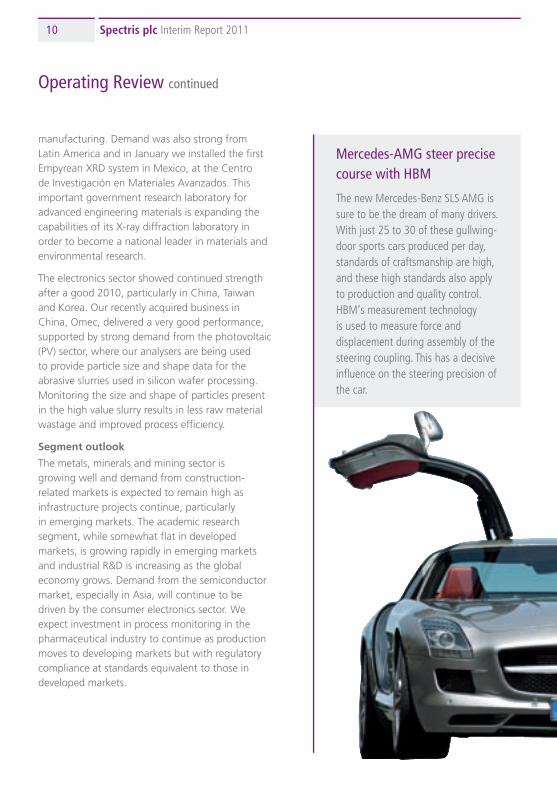
Mercedes-AMG steer precise course with HBM
The new Mercedes-Benz SLS AMG is sure to be the dream of many drivers. With just 25 to 30 of these gullwing-door sports cars produced per day, standards of craftsmanship are high, and these high standards also apply to production and quality control. HBM‘s measurement technology is used to measure force and displacement during assembly of the steering coupling. This has a decisive influence on the steering precision of the car.
Operating Review continued
manufacturing. Demand was also strong from Latin America and in January we installed the first Empyrean XRD system in Mexico, at the Centro de Investigación en Materiales Avanzados. This important government research laboratory for advanced engineering materials is expanding the capabilities of its X-ray diffraction laboratory in order to become a national leader in materials and environmental research.
The electronics sector showed continued strength after a good 2010, particularly in China, Taiwan and Korea. Our recently acquired business in China, Omec, delivered a very good performance, supported by strong demand from the photovoltaic (PV) sector, where our analysers are being used to provide particle size and shape data for the abrasive slurries used in silicon wafer processing. Monitoring the size and shape of particles present in the high value slurry results in less raw material wastage and improved process efficiency.
Segment outlook
The metals, minerals and mining sector is growing well and demand from construction-related markets is expected to remain high as infrastructure projects continue, particularly in emerging markets. The academic research segment, while somewhat flat in developed markets, is growing rapidly in emerging markets and industrial R&D is increasing as the global economy grows. Demand from the semiconductor market, especially in Asia, will continue to be driven by the consumer electronics sector. We expect investment in process monitoring in the pharmaceutical industry to continue as production moves to developing markets but with regulatory compliance at standards equivalent to those in developed markets.
Test and MeasurementOverview
Test and Measurement supplies test, measurement and analysis equipment and software for product design optimisation, manufacturing control, and environmental monitoring systems. Markets are principally the aerospace, automotive and consumer electronics industries. For customers in the automotive and aerospace industries, our products and applications help them to design and test new products whilst reducing time to market. In consumer electronics, our equipment and software enable customers to refine the performance and accuracy of their products. In the environmental monitoring market, the desire for higher standards of community comfort is driving increasing demand. The operating companies in this segment are Brüel & Kjær Sound & Vibration and HBM.
20778SPECTRIS.indd 10 01/09/2011 10:26:34

Spectris plc Interim Report 2011 11
20778.04 01/09/11 Proof 5
Operating Review continued
Segment performance
H1 2011 H1 2010 % change
Sales (£m) 162.8 131.3 +24%Profit (£m) 20.9 8.2 +157%Return on sales (%) 12.9 6.3 +6.6pp% of total group sales 32%
Sales in Test and Measurement increased by 24% to £162.8 million (up 25% at constant currencies) and operating margins increased by 6.6pp to 12.9%.
The strength of recovery in this segment continued, supported by demand from the automotive, aerospace and environmental markets.
In the automotive market, a key end user market for this segment, the improvement seen in 2010, as customers began to reinstate budgets, continued into 2011. Demand was strong in North America, Europe and China. Our new products, such as the QuantumX data acquisition system, are having good success in China, and also in Korea, where we secured an order for its application in electric vehicle development.
In Europe, Mercedes-AMG, a subsidiary of Daimler, has selected our measurement technology for use in the production of its new SLS AMG sports car. With just 25 to 30 of these gullwing-door sports cars produced per day, standards of craftsmanship are high, as are the standards of production and quality control. Our load cells and press fit controllers measure force and displacement during assembly of the steering coupling, which is key to the steering precision of the car.
Test and MeasurementOverview
Test and Measurement supplies test, measurement and analysis equipment and software for product design optimisation, manufacturing control, and environmental monitoring systems. Markets are principally the aerospace, automotive and consumer electronics industries. For customers in the automotive and aerospace industries, our products and applications help them to design and test new products whilst reducing time to market. In consumer electronics, our equipment and software enable customers to refine the performance and accuracy of their products. In the environmental monitoring market, the desire for higher standards of community comfort is driving increasing demand. The operating companies in this segment are Brüel & Kjær Sound & Vibration and HBM.
20778SPECTRIS.indd 11 01/09/2011 10:26:35
Spectris plc Interim Report 2011Spectris plc Interim Report 201112
20778.04 01/09/11 Proof 5
Demand was good from the aerospace market, with orders secured for new aircraft and satellite programmes. In China, the leading aerospace research institute selected our data acquisition system for structural testing of aircraft and we also secured a contract with a major European aircraft manufacturer for a data acquisition system for structural testing. In March, the Instituto Nacional de Pesquisas Espaciais, a research unit of the Brazilian Ministry of Science and Technology, selected our data acquisition and vibration test system for satellite launch simulation and qualification testing.
Our airport noise monitoring systems have been successful for a number of years and we are now adapting these systems for use in other industries. Following the success of our Sentinel urban/industrial noise monitoring solution we have now introduced two new subscription-based noise management solutions aimed at the mining and construction industries. Mining Sentinel is particularly attractive for mine operators, where the challenge is to grow operations whilst staying within acceptable noise limits. Operating licences can be revoked if local noise regulations are broken, leading to significant loss of revenue. We have signed a five-year contract with a leading mining company in Australia to provide early warning of noise infractions and provide independent evidence of compliance. Construction Sentinel is an extension of the noise monitoring system, providing vibration monitoring in addition. This is a key requirement for large construction projects where there is a significant risk of damage to nearby property, particularly historic or vulnerable structures. We have already secured a contract from a city administration in Canada for a 16-location monitoring solution for their sewer system replacement project.
In the power sector, we signed an agreement with the University of Windsor in Ontario, Canada, to establish North America’s first Wind and Renewable Energies Centre of Expertise. Under the agreement, we will provide research equipment to the University, including a large scale wind turbine model and supporting software, which will enable the study of wind turbine noise and vibration testing of turbine components.
Segment outlook
The automotive sector showed good growth in the first half of 2011, especially in Asia. The aerospace industry continues to provide additional opportunities for growth, particularly in the area of testing for structural integrity for satellite and new aircraft programmes. Noise monitoring continues to grow in importance as regulation increases and we are extending the range of products we can offer this market. Applications in other industry sectors such as rail and power are increasing. Our new products and technologies are finding increasing application with customers in this segment.
In-line InstrumentationOverview
In-line Instrumentation provides process analytical measurement, asset monitoring and on-line controls for both primary processing and the converting industries. Our products and applications provide precision measurement in challenging operating environments, ensuring process quality, asset uptime, safety, and improved yield. The operating companies in this segment are Beta LaserMike, Brüel & Kjær Vibro, BTG Group, Fusion UV Systems, NDC Infrared Engineering, and Servomex.
Segment performance
H1 2011 H1 2010 % change
Sales (£m) 147.7 126.9 +16%Profit (£m) 28.1 23.7 +19%Return on sales (%) 19.0 18.7 +0.3pp% of total group sales 29%
Sales in In-line Instrumentation increased by 16% (increase of 16% at constant currencies, including 3% from acquisitions) to £147.7 million, and operating margins increased by 0.3pp to 19.0%. Sales of service, spare parts and consumables are a key feature of this segment and represent 41% of revenues.
In the pulp and paper industry, the largest end user market for this segment, demand for our instruments and creping blades was good as papermills continued to seek ways of improving productivity in response to higher energy and raw material costs. There was strong demand for our products in China, where new mills are starting up, and our sales to this region increased by 50% compared with the prior year. In Japan, the earthquake and subsequent tsunami affected mills in the north-east of the country, but capacity increased in other mills to compensate and production is now restarting.
In the energy and refining market, continuing high oil prices and increasing global demand have resulted in increased activity as companies downstream seek to reduce their costs, and we saw good demand for our products, particularly in North America, the Middle East, India and China. In Europe, we won a key project for our laser-based gas analysis technology at a major ethylene plant in the Netherlands. In China, there was good demand for our products from the industrial gas industry, and in particular for the products acquired
Operating Review continued
20778SPECTRIS.indd 12 01/09/2011 10:26:35
Spectris plc Interim Report 2011 13
20778.04 01/09/11 Proof 5
In the power sector, we signed an agreement with the University of Windsor in Ontario, Canada, to establish North America’s first Wind and Renewable Energies Centre of Expertise. Under the agreement, we will provide research equipment to the University, including a large scale wind turbine model and supporting software, which will enable the study of wind turbine noise and vibration testing of turbine components.
Segment outlook
The automotive sector showed good growth in the first half of 2011, especially in Asia. The aerospace industry continues to provide additional opportunities for growth, particularly in the area of testing for structural integrity for satellite and new aircraft programmes. Noise monitoring continues to grow in importance as regulation increases and we are extending the range of products we can offer this market. Applications in other industry sectors such as rail and power are increasing. Our new products and technologies are finding increasing application with customers in this segment.
In-line InstrumentationOverview
In-line Instrumentation provides process analytical measurement, asset monitoring and on-line controls for both primary processing and the converting industries. Our products and applications provide precision measurement in challenging operating environments, ensuring process quality, asset uptime, safety, and improved yield. The operating companies in this segment are Beta LaserMike, Brüel & Kjær Vibro, BTG Group, Fusion UV Systems, NDC Infrared Engineering, and Servomex.
Segment performance
H1 2011 H1 2010 % change
Sales (£m) 147.7 126.9 +16%Profit (£m) 28.1 23.7 +19%Return on sales (%) 19.0 18.7 +0.3pp% of total group sales 29%
Sales in In-line Instrumentation increased by 16% (increase of 16% at constant currencies, including 3% from acquisitions) to £147.7 million, and operating margins increased by 0.3pp to 19.0%. Sales of service, spare parts and consumables are a key feature of this segment and represent 41% of revenues.
In the pulp and paper industry, the largest end user market for this segment, demand for our instruments and creping blades was good as papermills continued to seek ways of improving productivity in response to higher energy and raw material costs. There was strong demand for our products in China, where new mills are starting up, and our sales to this region increased by 50% compared with the prior year. In Japan, the earthquake and subsequent tsunami affected mills in the north-east of the country, but capacity increased in other mills to compensate and production is now restarting.
In the energy and refining market, continuing high oil prices and increasing global demand have resulted in increased activity as companies downstream seek to reduce their costs, and we saw good demand for our products, particularly in North America, the Middle East, India and China. In Europe, we won a key project for our laser-based gas analysis technology at a major ethylene plant in the Netherlands. In China, there was good demand for our products from the industrial gas industry, and in particular for the products acquired
with the Delta F business at the end of 2010. In addition, in the Middle East, our laser-based gas analysis technology was selected for use in a system to be installed in what will be the largest helium production facility in the world.
In wire and cable applications, we launched the LayScan measurement system for accurate measurement of complex twisted telecommunication cables. The system uses optical, non-contact measurement technology to perform on-line, high-speed length measurements and enables cable manufacturers to reduce product costs and waste material. We saw good demand for our scanning systems for rubber calendering for tyres, with a number of orders received from Indonesia, and for film production, particularly for facilities in Asia.
Continued growth in the display market resulted in good sales of our UV curing systems as the major manufacturers invested in R&D and production equipment to meet the growing demand for digital televisions, cameras, mobile devices (including smart phones) and notebooks. We also sold a UV lamp system for curing the functionalised optical films and components in a new 3D TV platform.
Segment outlook
The global macro outlook for hydrocarbon processing remains favourable, although political events in the Middle East may lead to some slowing of projects in this region. Demand for applications in wind and hydro power markets is expected to continue. Increasing bandwidth and growth in fibre to the home are expected to drive the demand for optical fibre over the next two to three years. Service and support will continue to account for a high percentage of turnover in this segment.
Operating Review continued
20778SPECTRIS.indd 13 01/09/2011 10:26:35
Spectris plc Interim Report 2011Spectris plc Interim Report 201114
20778.04 01/09/11 Proof 5
Operating Review continued
Industrial ControlsOverview
Industrial Controls supplies automation and control products for the discrete manufacturing industries. Our products provide track, trace and control solutions during the manufacturing process, displays for process monitoring and control, and data interfaces and rugged Ethernet switches for a broad range of manufacturing industries. Sales are made indirectly to end users via distributors as well as directly to original equipment manufacturers, with a significant proportion of repeat business. The operating companies in this segment are Microscan and Red Lion Controls. The segment will be augmented by the Omega Engineering business on closing of the transaction.
Segment performance
H1 2011 H1 2010 % change
Sales (£m) 40.6 27.6 +47%Profit (£m) 8.2 4.1 +100%Return on sales (%) 20.3 14.9 +5.4pp% of total group sales 8%
Sales in Industrial Controls increased by 47% to £40.6 million (increase of 56% at constant currencies, including 30% from acquisitions) and operating margins increased by 5.4pp to 20.3%.
The strong growth in the general manufacturing sector seen in the second half of 2010 continued in the first half of 2011 and we saw good demand for our industrial measurement and control products.
In China, where stricter drug regulations have been introduced mandating traceability on all pharmaceutical manufacturing, there was good demand for our track, trace and control solutions.
In June, we launched the AutoVision suite of smart cameras and software. This is the smallest, most scalable, integrated bar code imaging and machine vision solution on the market and enables manufacturers to improve efficiency and reduce defects in a wide range of applications, including part identification and location, item traceability, and other automated inspection tasks.
Red Lion continued to expand its distribution channels and signed a contract with a leading supplier of maintenance, repair and operating products to sell its panel meters via their catalogue, website and network of trade stores. The N-Tron industrial networking business, acquired in 2010, performed well and launched a number of new products during the first half. The new models feature hardened industrial technology in an ultra-slim format and are optimised for plug and play applications in harsh industrial environments.
Segment outlook
We expect the demand from the general manufacturing sector to continue, with good opportunities in China. Development of our portfolio of track, trace and control solutions continues as these find increasing opportunities across a number of industrial controls sectors, particularly in China as the pharmaceutical market responds to increasing regulation. Demand for industrial networking components is expected to continue to grow. The planned acquisition of Omega Engineering will provide good growth opportunities for this segment.
Financial Review
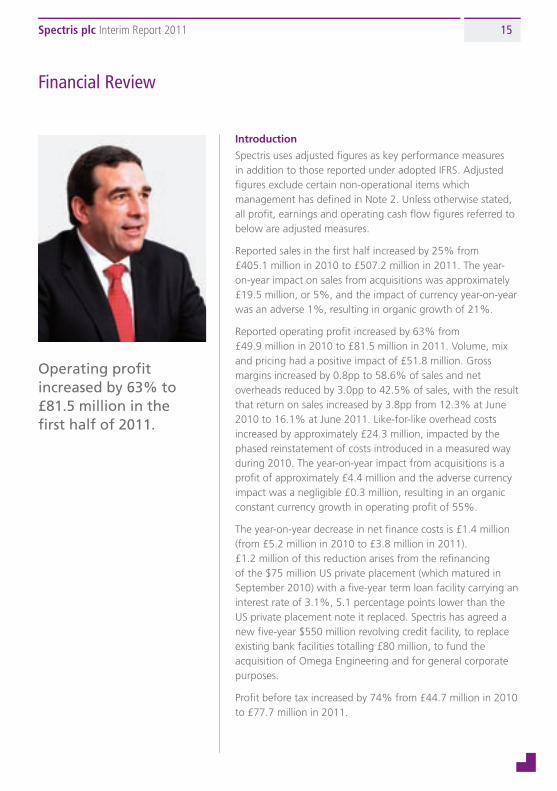
Operating profit increased by 63% to £81.5 million in the first half of 2011.
20778SPECTRIS.indd 14 01/09/2011 10:26:36
Spectris plc Interim Report 2011 15
20778.04 01/09/11 Proof 5
Operating Review continued
In June, we launched the AutoVision suite of smart cameras and software. This is the smallest, most scalable, integrated bar code imaging and machine vision solution on the market and enables manufacturers to improve efficiency and reduce defects in a wide range of applications, including part identification and location, item traceability, and other automated inspection tasks.
Red Lion continued to expand its distribution channels and signed a contract with a leading supplier of maintenance, repair and operating products to sell its panel meters via their catalogue, website and network of trade stores. The N-Tron industrial networking business, acquired in 2010, performed well and launched a number of new products during the first half. The new models feature hardened industrial technology in an ultra-slim format and are optimised for plug and play applications in harsh industrial environments.
Segment outlook
We expect the demand from the general manufacturing sector to continue, with good opportunities in China. Development of our portfolio of track, trace and control solutions continues as these find increasing opportunities across a number of industrial controls sectors, particularly in China as the pharmaceutical market responds to increasing regulation. Demand for industrial networking components is expected to continue to grow. The planned acquisition of Omega Engineering will provide good growth opportunities for this segment.
Financial Review
Introduction
Spectris uses adjusted figures as key performance measures in addition to those reported under adopted IFRS. Adjusted figures exclude certain non-operational items which management has defined in Note 2. Unless otherwise stated, all profit, earnings and operating cash flow figures referred to below are adjusted measures.
Reported sales in the first half increased by 25% from £405.1 million in 2010 to £507.2 million in 2011. The year-on-year impact on sales from acquisitions was approximately £19.5 million, or 5%, and the impact of currency year-on-year was an adverse 1%, resulting in organic growth of 21%.
Reported operating profit increased by 63% from £49.9 million in 2010 to £81.5 million in 2011. Volume, mix and pricing had a positive impact of £51.8 million. Gross margins increased by 0.8pp to 58.6% of sales and net overheads reduced by 3.0pp to 42.5% of sales, with the result that return on sales increased by 3.8pp from 12.3% at June 2010 to 16.1% at June 2011. Like-for-like overhead costs increased by approximately £24.3 million, impacted by the phased reinstatement of costs introduced in a measured way during 2010. The year-on-year impact from acquisitions is a profit of approximately £4.4 million and the adverse currency impact was a negligible £0.3 million, resulting in an organic constant currency growth in operating profit of 55%.
The year-on-year decrease in net finance costs is £1.4 million (from £5.2 million in 2010 to £3.8 million in 2011). £1.2 million of this reduction arises from the refinancing of the $75 million US private placement (which matured in September 2010) with a five-year term loan facility carrying an interest rate of 3.1%, 5.1 percentage points lower than the US private placement note it replaced. Spectris has agreed a new five-year $550 million revolving credit facility, to replace existing bank facilities totalling £80 million, to fund the acquisition of Omega Engineering and for general corporate purposes.
Profit before tax increased by 74% from £44.7 million in 2010 to £77.7 million in 2011.
Operating profit increased by 63% to £81.5 million in the first half of 2011.
20778SPECTRIS.indd 15 01/09/2011 10:26:36
Spectris plc Interim Report 2011Spectris plc Interim Report 201116
20778.04 01/09/11 Proof 5
Financial Review continued
Based on the forecast for the full year, the effective tax rate for the half year is estimated at 25.0% (2010 full year: 24.2%), in line with the expected geographic mix of profits.
The higher operating profit resulted in earnings per share increasing by 71% from 29.4 pence to 50.2 pence.
Operating cash flow of £63.5 million (2010: £66.3 million) resulted in an operating cash conversion of 78% (2010: 133%). The expected increase in working capital and capex spend were the primary drivers behind the reduction in the cash conversion rate. Net debt decreased by £12.5 million (2010: decrease of £31.1 million) from £86.2 million at 31 December 2010 to £73.7 million. Reflecting the continuing strong working capital management actions throughout the group, rolling 12-month average working capital improved further and is now running at just below 9% of sales compared to just above 9% at the end of 2010.
Clive WatsonGroup Finance Director
Principal Risks and Uncertainties
The group has in place processes for identifying, evaluating and managing the key risks which could have an impact upon the group’s performance.
The current risks, together with a description of how they relate to the group’s strategy and the approach to managing them, are set out in the 2010 Annual Report which is available on the group’s website at www.spectris.com. The group has reviewed these risks and concluded that they adequately represent the current principal risks and uncertainties of the company and will continue to remain relevant for the second half of the financial year. They comprise:
• Acquisition integration
• New product development
• Competitive activity
• Supply chain disruption
• Seasonal fluctuations in sales
• Fluctuations in exchange rates
• Intellectual property
• Political and economic environment
• Compliance with all relevant laws and regulations
The potential impact of these risks on our strategy and financial performance, together with details of our specific mitigation actions, is also set out in the 2010 Annual Report.
Clive WatsonGroup Finance Director
20778SPECTRIS.indd 16 01/09/2011 10:26:37
Spectris plc Interim Report 2011 17
20778.04 01/09/11 Proof 5
Financial Review continued Principal Risks and Uncertainties Statement of Directors’ Responsibilities in respect of the Interim Report
The group has in place processes for identifying, evaluating and managing the key risks which could have an impact upon the group’s performance.
The current risks, together with a description of how they relate to the group’s strategy and the approach to managing them, are set out in the 2010 Annual Report which is available on the group’s website at www.spectris.com. The group has reviewed these risks and concluded that they adequately represent the current principal risks and uncertainties of the company and will continue to remain relevant for the second half of the financial year. They comprise:
• Acquisition integration
• New product development
• Competitive activity
• Supply chain disruption
• Seasonal fluctuations in sales
• Fluctuations in exchange rates
• Intellectual property
• Political and economic environment
• Compliance with all relevant laws and regulations
The potential impact of these risks on our strategy and financial performance, together with details of our specific mitigation actions, is also set out in the 2010 Annual Report.
Clive WatsonGroup Finance Director
The directors confirm that this condensed set of financial statements has been prepared in accordance with IAS 34 as adopted by the European Union, and that the interim management report herein includes a fair review of the information required by DTR 4.2.7R and DTR 4.2.8R.
The directors of Spectris plc are as listed in the 2010 report and accounts.
By order of the Board
John HughesChairman
20778SPECTRIS.indd 17 01/09/2011 10:26:37
Spectris plc Interim Report 2011Spectris plc Interim Report 201118
20778.04 01/09/11 Proof 5
Condensed Consolidated Statement of IncomeFor the six months ended 30 June 2011
Condensed Consolidated Statement of Comprehensive IncomeFor the six months ended 30 June 2011
2011 2010 2010 Half year Half year Full year Note £m £m £m
Continuing operations
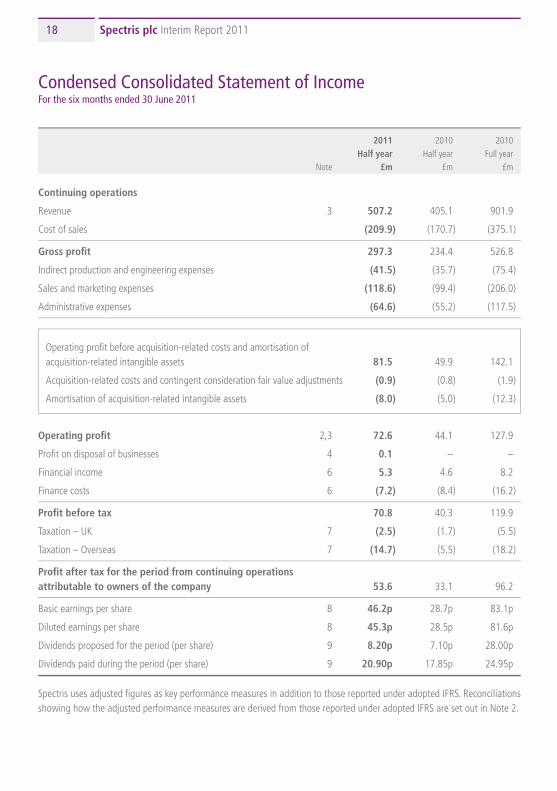
Revenue 3 507.2 405.1 901.9
Cost of sales (209.9) (170.7) (375.1)
Gross profit 297.3 234.4 526.8
Indirect production and engineering expenses (41.5) (35.7) (75.4)
Sales and marketing expenses (118.6) (99.4) (206.0)
Administrative expenses (64.6) (55.2) (117.5)
Operating profit before acquisition-related costs and amortisation of acquisition-related intangible assets 81.5 49.9 142.1
Acquisition-related costs and contingent consideration fair value adjustments (0.9) (0.8) (1.9)
Amortisation of acquisition-related intangible assets (8.0) (5.0) (12.3)
operating profit 2,3 72.6 44.1 127.9
Profit on disposal of businesses 4 0.1 – –
Financial income 6 5.3 4.6 8.2
Finance costs 6 (7.2) (8.4) (16.2)
Profit before tax 70.8 40.3 119.9
Taxation – UK 7 (2.5) (1.7) (5.5)
Taxation – Overseas 7 (14.7) (5.5) (18.2)
Profit after tax for the period from continuing operations attributable to owners of the company 53.6 33.1 96.2
Basic earnings per share 8 46.2p 28.7p 83.1p
Diluted earnings per share 8 45.3p 28.5p 81.6p
Dividends proposed for the period (per share) 9 8.20p 7.10p 28.00p
Dividends paid during the period (per share) 9 20.90p 17.85p 24.95p
Spectris uses adjusted figures as key performance measures in addition to those reported under adopted IFRS. Reconciliations showing how the adjusted performance measures are derived from those reported under adopted IFRS are set out in Note 2.
2011 2010 2010 Half year Half year Full year £m £m £m
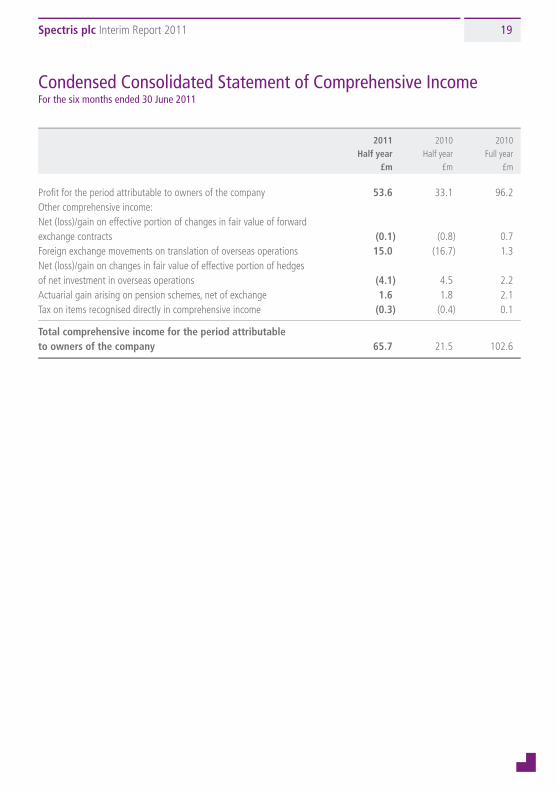
Profit for the period attributable to owners of the company 53.6 33.1 96.2 Other comprehensive income: Net (loss)/gain on effective portion of changes in fair value of forward exchange contracts (0.1) (0.8) 0.7 Foreign exchange movements on translation of overseas operations 15.0 (16.7) 1.3 Net (loss)/gain on changes in fair value of effective portion of hedges of net investment in overseas operations (4.1) 4.5 2.2 Actuarial gain arising on pension schemes, net of exchange 1.6 1.8 2.1 Tax on items recognised directly in comprehensive income (0.3) (0.4) 0.1
total comprehensive income for the period attributable to owners of the company 65.7 21.5 102.6
20778SPECTRIS.indd 18 01/09/2011 10:26:37
Spectris plc Interim Report 2011 19
20778.04 01/09/11 Proof 5
Condensed Consolidated Statement of IncomeFor the six months ended 30 June 2011
Condensed Consolidated Statement of Comprehensive IncomeFor the six months ended 30 June 2011
2011 2010 2010 Half year Half year Full year Note £m £m £m
Continuing operations
Revenue 3 507.2 405.1 901.9
Cost of sales (209.9) (170.7) (375.1)
Gross profit 297.3 234.4 526.8
Indirect production and engineering expenses (41.5) (35.7) (75.4)
Sales and marketing expenses (118.6) (99.4) (206.0)
Administrative expenses (64.6) (55.2) (117.5)
Operating profit before acquisition-related costs and amortisation of acquisition-related intangible assets 81.5 49.9 142.1
Acquisition-related costs and contingent consideration fair value adjustments (0.9) (0.8) (1.9)
Amortisation of acquisition-related intangible assets (8.0) (5.0) (12.3)
operating profit 2,3 72.6 44.1 127.9
Profit on disposal of businesses 4 0.1 – –
Financial income 6 5.3 4.6 8.2
Finance costs 6 (7.2) (8.4) (16.2)
Profit before tax 70.8 40.3 119.9
Taxation – UK 7 (2.5) (1.7) (5.5)
Taxation – Overseas 7 (14.7) (5.5) (18.2)
Profit after tax for the period from continuing operations attributable to owners of the company 53.6 33.1 96.2
Basic earnings per share 8 46.2p 28.7p 83.1p
Diluted earnings per share 8 45.3p 28.5p 81.6p
Dividends proposed for the period (per share) 9 8.20p 7.10p 28.00p
Dividends paid during the period (per share) 9 20.90p 17.85p 24.95p
Spectris uses adjusted figures as key performance measures in addition to those reported under adopted IFRS. Reconciliations showing how the adjusted performance measures are derived from those reported under adopted IFRS are set out in Note 2.
2011 2010 2010 Half year Half year Full year £m £m £m
Profit for the period attributable to owners of the company 53.6 33.1 96.2 Other comprehensive income: Net (loss)/gain on effective portion of changes in fair value of forward exchange contracts (0.1) (0.8) 0.7 Foreign exchange movements on translation of overseas operations 15.0 (16.7) 1.3 Net (loss)/gain on changes in fair value of effective portion of hedges of net investment in overseas operations (4.1) 4.5 2.2 Actuarial gain arising on pension schemes, net of exchange 1.6 1.8 2.1 Tax on items recognised directly in comprehensive income (0.3) (0.4) 0.1
total comprehensive income for the period attributable to owners of the company 65.7 21.5 102.6
20778SPECTRIS.indd 19 01/09/2011 10:26:37
Spectris plc Interim Report 2011Spectris plc Interim Report 201120
20778.04 01/09/11 Proof 5
Capital Share Share Retained Translation Hedging Merger redemption total capital premium earnings reserve reserve reserve reserve equity £m £m £m £m £m £m £m £m
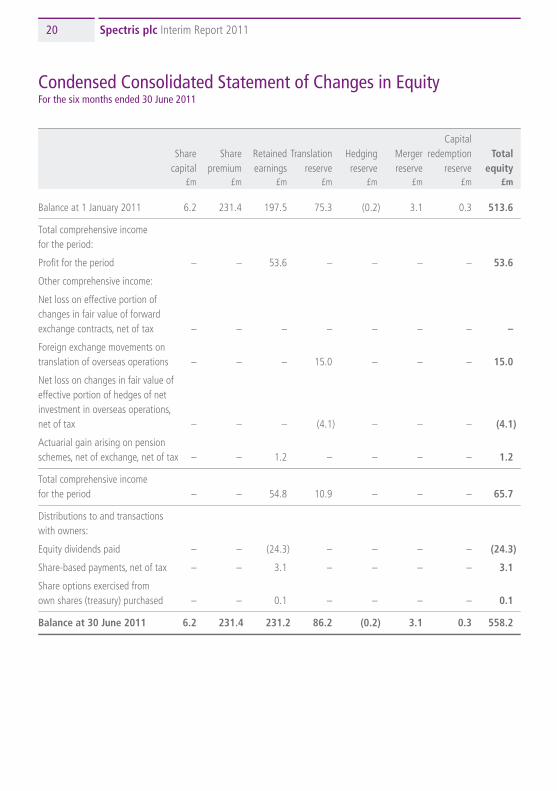
Balance at 1 January 2011 6.2 231.4 197.5 75.3 (0.2) 3.1 0.3 513.6
Total comprehensive income for the period:
Profit for the period – – 53.6 – – – – 53.6
Other comprehensive income:
Net loss on effective portion of changes in fair value of forward exchange contracts, net of tax – – – – – – – –
Foreign exchange movements on translation of overseas operations – – – 15.0 – – – 15.0
Net loss on changes in fair value of effective portion of hedges of net investment in overseas operations, net of tax – – – (4.1) – – – (4.1)
Actuarial gain arising on pension schemes, net of exchange, net of tax – – 1.2 – – – – 1.2
Total comprehensive income for the period – – 54.8 10.9 – – – 65.7
Distributions to and transactions with owners:
Equity dividends paid – – (24.3) – – – – (24.3)
Share-based payments, net of tax – – 3.1 – – – – 3.1
Share options exercised from own shares (treasury) purchased – – 0.1 – – – – 0.1
Balance at 30 June 2011 6.2 231.4 231.2 86.2 (0.2) 3.1 0.3 558.2
Capital Share Share Retained Translation Hedging Merger redemption Total capital premium earnings reserve reserve reserve reserve equity £m £m £m £m £m £m £m £m
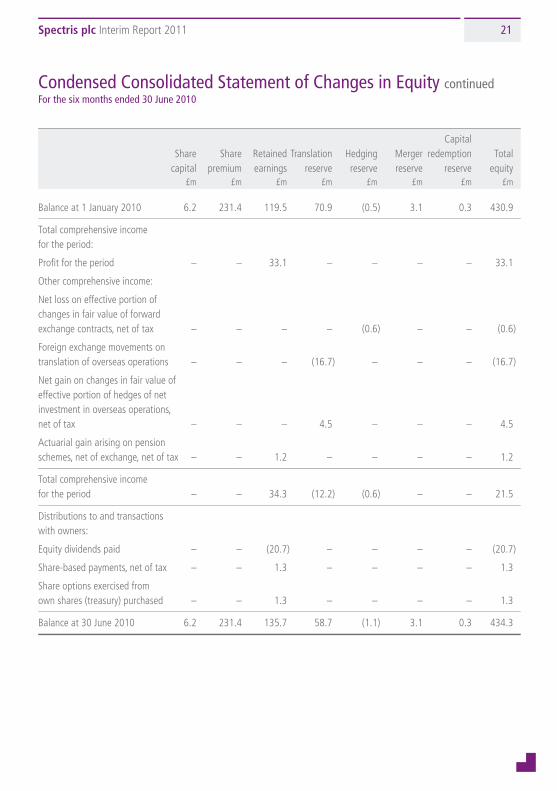
Balance at 1 January 2010 6.2 231.4 119.5 70.9 (0.5) 3.1 0.3 430.9
Total comprehensive income for the period:
Profit for the period – – 33.1 – – – – 33.1
Other comprehensive income:
Net loss on effective portion of changes in fair value of forward exchange contracts, net of tax – – – – (0.6) – – (0.6)
Foreign exchange movements on translation of overseas operations – – – (16.7) – – – (16.7)
Net gain on changes in fair value of effective portion of hedges of net investment in overseas operations, net of tax – – – 4.5 – – – 4.5
Actuarial gain arising on pension schemes, net of exchange, net of tax – – 1.2 – – – – 1.2
Total comprehensive income for the period – – 34.3 (12.2) (0.6) – – 21.5
Distributions to and transactions with owners:
Equity dividends paid – – (20.7) – – – – (20.7)
Share-based payments, net of tax – – 1.3 – – – – 1.3
Share options exercised from own shares (treasury) purchased – – 1.3 – – – – 1.3
Balance at 30 June 2010 6.2 231.4 135.7 58.7 (1.1) 3.1 0.3 434.3
Condensed Consolidated Statement of Changes in EquityFor the six months ended 30 June 2011
Condensed Consolidated Statement of Changes in Equity continuedFor the six months ended 30 June 2010
20778SPECTRIS.indd 20 01/09/2011 10:26:37
Spectris plc Interim Report 2011 21
20778.04 01/09/11 Proof 5
Capital Share Share Retained Translation Hedging Merger redemption total capital premium earnings reserve reserve reserve reserve equity £m £m £m £m £m £m £m £m
Balance at 1 January 2011 6.2 231.4 197.5 75.3 (0.2) 3.1 0.3 513.6
Total comprehensive income for the period:
Profit for the period – – 53.6 – – – – 53.6
Other comprehensive income:
Net loss on effective portion of changes in fair value of forward exchange contracts, net of tax – – – – – – – –
Foreign exchange movements on translation of overseas operations – – – 15.0 – – – 15.0
Net loss on changes in fair value of effective portion of hedges of net investment in overseas operations, net of tax – – – (4.1) – – – (4.1)
Actuarial gain arising on pension schemes, net of exchange, net of tax – – 1.2 – – – – 1.2
Total comprehensive income for the period – – 54.8 10.9 – – – 65.7
Distributions to and transactions with owners:
Equity dividends paid – – (24.3) – – – – (24.3)
Share-based payments, net of tax – – 3.1 – – – – 3.1
Share options exercised from own shares (treasury) purchased – – 0.1 – – – – 0.1
Balance at 30 June 2011 6.2 231.4 231.2 86.2 (0.2) 3.1 0.3 558.2
Capital Share Share Retained Translation Hedging Merger redemption Total capital premium earnings reserve reserve reserve reserve equity £m £m £m £m £m £m £m £m
Balance at 1 January 2010 6.2 231.4 119.5 70.9 (0.5) 3.1 0.3 430.9
Total comprehensive income for the period:
Profit for the period – – 33.1 – – – – 33.1
Other comprehensive income:
Net loss on effective portion of changes in fair value of forward exchange contracts, net of tax – – – – (0.6) – – (0.6)
Foreign exchange movements on translation of overseas operations – – – (16.7) – – – (16.7)
Net gain on changes in fair value of effective portion of hedges of net investment in overseas operations, net of tax – – – 4.5 – – – 4.5
Actuarial gain arising on pension schemes, net of exchange, net of tax – – 1.2 – – – – 1.2
Total comprehensive income for the period – – 34.3 (12.2) (0.6) – – 21.5
Distributions to and transactions with owners:
Equity dividends paid – – (20.7) – – – – (20.7)
Share-based payments, net of tax – – 1.3 – – – – 1.3
Share options exercised from own shares (treasury) purchased – – 1.3 – – – – 1.3
Balance at 30 June 2010 6.2 231.4 135.7 58.7 (1.1) 3.1 0.3 434.3
Condensed Consolidated Statement of Changes in EquityFor the six months ended 30 June 2011
Condensed Consolidated Statement of Changes in Equity continuedFor the six months ended 30 June 2010
20778SPECTRIS.indd 21 01/09/2011 10:26:37
Spectris plc Interim Report 2011Spectris plc Interim Report 201122
20778.04 01/09/11 Proof 5
Capital Share Share Retained Translation Hedging Merger redemption Total capital premium earnings reserve reserve reserve reserve equity £m £m £m £m £m £m £m £m
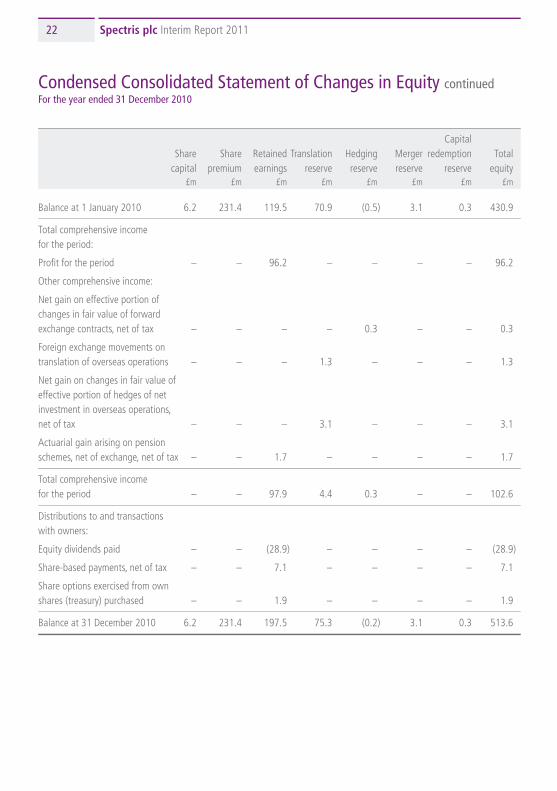
Balance at 1 January 2010 6.2 231.4 119.5 70.9 (0.5) 3.1 0.3 430.9
Total comprehensive income for the period:
Profit for the period – – 96.2 – – – – 96.2
Other comprehensive income:
Net gain on effective portion of changes in fair value of forward exchange contracts, net of tax – – – – 0.3 – – 0.3
Foreign exchange movements on translation of overseas operations – – – 1.3 – – – 1.3
Net gain on changes in fair value of effective portion of hedges of net investment in overseas operations, net of tax – – – 3.1 – – – 3.1
Actuarial gain arising on pension schemes, net of exchange, net of tax – – 1.7 – – – – 1.7
Total comprehensive income for the period – – 97.9 4.4 0.3 – – 102.6
Distributions to and transactions with owners:
Equity dividends paid – – (28.9) – – – – (28.9)
Share-based payments, net of tax – – 7.1 – – – – 7.1
Share options exercised from own shares (treasury) purchased – – 1.9 – – – – 1.9
Balance at 31 December 2010 6.2 231.4 197.5 75.3 (0.2) 3.1 0.3 513.6
Condensed Consolidated Statement of Changes in Equity continuedFor the year ended 31 December 2010
Condensed Consolidated Statement of Financial PositionAs at 30 June 2011
2011 2010 2010 Half year Half year Full year £m £m £m
assets non-current assets Intangible assets:
Goodwill 365.3 309.8 355.1 Other intangible assets 87.8 67.0 97.4
453.1 376.8 452.5Property, plant and equipment 118.3 103.7 110.5Equity-accounted investments 0.5 0.6 0.5Deferred tax assets 22.2 26.9 18.4 594.1 508.0 581.9Current assets Inventories 140.7 109.0 121.0Taxation recoverable 10.7 – 8.5Trade and other receivables 185.2 154.8 194.8Derivative financial instruments 2.3 0.2 2.3Cash and cash equivalents 80.5 55.3 64.7 419.4 319.3 391.3total assets 1,013.5 827.3 973.2liabilities Current liabilities Short-term borrowings (1.1) (51.2) (1.7)Trade and other payables (201.5) (164.2) (212.1)Current tax liabilities (46.1) (28.4) (36.7)Provisions (25.9) (20.0) (23.4) (274.6) (263.8) (273.9)net current assets 144.8 55.5 117.4non-current liabilities Medium- and long-term borrowings (133.7) (89.6) (135.5)Derivative financial instruments (19.4) (8.7) (14.9)Other payables (12.0) (8.8) (17.3)Retirement benefit obligations (10.9) (18.5) (14.1)Deferred tax liabilities (4.7) (3.6) (3.9) (180.7) (129.2) (185.7)total liabilities (455.3) (393.0) (459.6)net assets 558.2 434.3 513.6equity Issued share capital 6.2 6.2 6.2Share premium 231.4 231.4 231.4Retained earnings 231.2 135.7 197.5Translation reserve 86.2 58.7 75.3Hedging reserve (0.2) (1.1) (0.2)Merger reserve 3.1 3.1 3.1Capital redemption reserve 0.3 0.3 0.3
total equity attributable to equity holders of the company 558.2 434.3 513.6total equity and liabilities 1,013.5 827.3 973.2
20778SPECTRIS.indd 22 01/09/2011 10:26:37
Spectris plc Interim Report 2011 23
20778.04 01/09/11 Proof 5
Capital Share Share Retained Translation Hedging Merger redemption Total capital premium earnings reserve reserve reserve reserve equity £m £m £m £m £m £m £m £m
Balance at 1 January 2010 6.2 231.4 119.5 70.9 (0.5) 3.1 0.3 430.9
Total comprehensive income for the period:
Profit for the period – – 96.2 – – – – 96.2
Other comprehensive income:
Net gain on effective portion of changes in fair value of forward exchange contracts, net of tax – – – – 0.3 – – 0.3
Foreign exchange movements on translation of overseas operations – – – 1.3 – – – 1.3
Net gain on changes in fair value of effective portion of hedges of net investment in overseas operations, net of tax – – – 3.1 – – – 3.1
Actuarial gain arising on pension schemes, net of exchange, net of tax – – 1.7 – – – – 1.7
Total comprehensive income for the period – – 97.9 4.4 0.3 – – 102.6
Distributions to and transactions with owners:
Equity dividends paid – – (28.9) – – – – (28.9)
Share-based payments, net of tax – – 7.1 – – – – 7.1
Share options exercised from own shares (treasury) purchased – – 1.9 – – – – 1.9
Balance at 31 December 2010 6.2 231.4 197.5 75.3 (0.2) 3.1 0.3 513.6
Condensed Consolidated Statement of Changes in Equity continuedFor the year ended 31 December 2010
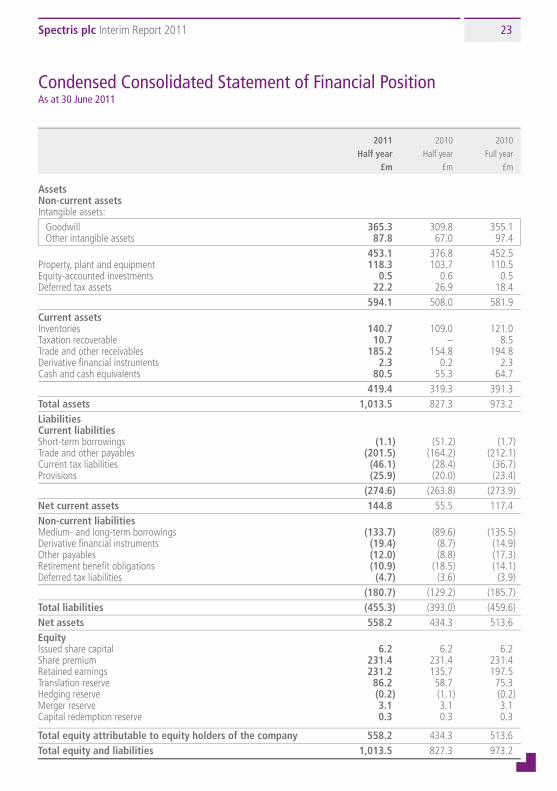
Condensed Consolidated Statement of Financial PositionAs at 30 June 2011
2011 2010 2010 Half year Half year Full year £m £m £m
assets non-current assets Intangible assets:
Goodwill 365.3 309.8 355.1 Other intangible assets 87.8 67.0 97.4
453.1 376.8 452.5Property, plant and equipment 118.3 103.7 110.5Equity-accounted investments 0.5 0.6 0.5Deferred tax assets 22.2 26.9 18.4 594.1 508.0 581.9Current assets Inventories 140.7 109.0 121.0Taxation recoverable 10.7 – 8.5Trade and other receivables 185.2 154.8 194.8Derivative financial instruments 2.3 0.2 2.3Cash and cash equivalents 80.5 55.3 64.7 419.4 319.3 391.3total assets 1,013.5 827.3 973.2liabilities Current liabilities Short-term borrowings (1.1) (51.2) (1.7)Trade and other payables (201.5) (164.2) (212.1)Current tax liabilities (46.1) (28.4) (36.7)Provisions (25.9) (20.0) (23.4) (274.6) (263.8) (273.9)net current assets 144.8 55.5 117.4non-current liabilities Medium- and long-term borrowings (133.7) (89.6) (135.5)Derivative financial instruments (19.4) (8.7) (14.9)Other payables (12.0) (8.8) (17.3)Retirement benefit obligations (10.9) (18.5) (14.1)Deferred tax liabilities (4.7) (3.6) (3.9) (180.7) (129.2) (185.7)total liabilities (455.3) (393.0) (459.6)net assets 558.2 434.3 513.6equity Issued share capital 6.2 6.2 6.2Share premium 231.4 231.4 231.4Retained earnings 231.2 135.7 197.5Translation reserve 86.2 58.7 75.3Hedging reserve (0.2) (1.1) (0.2)Merger reserve 3.1 3.1 3.1Capital redemption reserve 0.3 0.3 0.3
total equity attributable to equity holders of the company 558.2 434.3 513.6total equity and liabilities 1,013.5 827.3 973.2
20778SPECTRIS.indd 23 01/09/2011 10:26:37
Spectris plc Interim Report 2011Spectris plc Interim Report 201124
20778.04 01/09/11 Proof 5
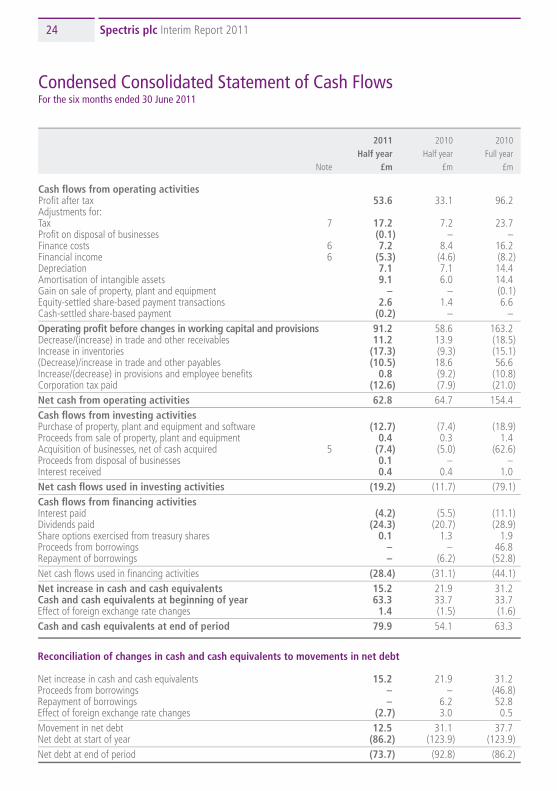
Condensed Consolidated Statement of Cash FlowsFor the six months ended 30 June 2011
Notes to the Interim Financial Statements
2011 2010 2010 Half year Half year Full year Note £m £m £m
Cash flows from operating activities Profit after tax 53.6 33.1 96.2 Adjustments for: Tax 7 17.2 7.2 23.7Profit on disposal of businesses (0.1) – –Finance costs 6 7.2 8.4 16.2Financial income 6 (5.3) (4.6) (8.2)Depreciation 7.1 7.1 14.4Amortisation of intangible assets 9.1 6.0 14.4Gain on sale of property, plant and equipment – – (0.1)Equity-settled share-based payment transactions 2.6 1.4 6.6 Cash-settled share-based payment (0.2) – –operating profit before changes in working capital and provisions 91.2 58.6 163.2Decrease/(increase) in trade and other receivables 11.2 13.9 (18.5) Increase in inventories (17.3) (9.3) (15.1)(Decrease)/increase in trade and other payables (10.5) 18.6 56.6Increase/(decrease) in provisions and employee benefits 0.8 (9.2) (10.8)Corporation tax paid (12.6) (7.9) (21.0)net cash from operating activities 62.8 64.7 154.4Cash flows from investing activities Purchase of property, plant and equipment and software (12.7) (7.4) (18.9) Proceeds from sale of property, plant and equipment 0.4 0.3 1.4Acquisition of businesses, net of cash acquired 5 (7.4) (5.0) (62.6)Proceeds from disposal of businesses 0.1 – –Interest received 0.4 0.4 1.0net cash flows used in investing activities (19.2) (11.7) (79.1)Cash flows from financing activities Interest paid (4.2) (5.5) (11.1)Dividends paid (24.3) (20.7) (28.9)Share options exercised from treasury shares 0.1 1.3 1.9Proceeds from borrowings – – 46.8Repayment of borrowings – (6.2) (52.8)Net cash flows used in financing activities (28.4) (31.1) (44.1)net increase in cash and cash equivalents 15.2 21.9 31.2Cash and cash equivalents at beginning of year 63.3 33.7 33.7Effect of foreign exchange rate changes 1.4 (1.5) (1.6)Cash and cash equivalents at end of period 79.9 54.1 63.3
reconciliation of changes in cash and cash equivalents to movements in net debt
Net increase in cash and cash equivalents 15.2 21.9 31.2Proceeds from borrowings – – (46.8)Repayment of borrowings – 6.2 52.8Effect of foreign exchange rate changes (2.7) 3.0 0.5Movement in net debt 12.5 31.1 37.7Net debt at start of year (86.2) (123.9) (123.9)Net debt at end of period (73.7) (92.8) (86.2)
1. Principal accounting Policies and Basis of Preparation
Spectris plc is a public limited company incorporated and domiciled in the United Kingdom, whose shares are publicly traded on the London Stock Exchange.
The condensed consolidated interim financial statements of the company for the six months ended 30 June 2011 comprise the company and its subsidiaries, together referred to as the group. These condensed consolidated interim financial statements are presented in millions of pounds sterling rounded to the nearest one decimal place. The consolidated financial statements of the group for the year ended 31 December 2010 are available upon request from the company’s registered office at Station Road, Egham, Surrey TW20 9NP.
These condensed consolidated interim financial statements have been prepared in accordance with adopted International Financial Reporting Standard (IFRS) IAS 34 ‘Interim Financial Reporting’. They do not include all of the information required for full annual financial statements, and should be read in conjunction with the consolidated financial statements of the group for the year ended 31 December 2010.
The accounting policies applied by the group in these condensed consolidated interim financial statements are the same as those applied by the group in its consolidated financial statements for the year ended 31 December 2010.
Having reviewed the group’s plans and available financial facilities, the Board has a reasonable expectation that the group has adequate resources to continue its operational existence for the foreseeable future. For this reason, it continues to adopt the going concern basis in preparing the group’s accounts. There are no key sensitivities identified in relation to this conclusion.
The interim results are unaudited. They do not constitute statutory financial statements as defined in section 434 of the Companies Act 2006. The comparative figures for the financial year ended 31 December 2010 are not the company’s statutory accounts for that financial year. Those accounts have been reported on by the company’s auditors and delivered to the registrar of companies. The report of the auditors was (i) unqualified, (ii) did not include a reference to any matters to which the auditors drew attention by way of emphasis without qualifying their report, and (iii) did not contain a statement under section 498(2) or (3) of the Companies Act 2006.
The preparation of interim financial statements in conformity with adopted IFRS requires management to make judgements, estimates and assumptions that affect the application of accounting policies and the reported amount of assets and liabilities, income and expense. Actual results may differ from these estimates. In preparing these condensed consolidated interim financial statements, the significant judgements made by management in applying the group’s accounting policies and the key sources of estimation uncertainty were the same as those that applied to the consolidated statements for the year ended 31 December 2010.
The directors have considered the circumstances as at 30 June 2011 and concluded that there are no indicators of impairments that require an impairment review to be undertaken at the balance sheet date. Regular impairment reviews will be undertaken later in 2011 consistent with the timing in previous years.
The group’s financial risk management objectives and policies are consistent with those disclosed in the consolidated financial statements for the year ended 31 December 2010.
These condensed consolidated interim financial statements were approved by the Board of Directors on 23 August 2011.
20778SPECTRIS.indd 24 01/09/2011 10:26:38
Spectris plc Interim Report 2011 25
20778.04 01/09/11 Proof 5
Condensed Consolidated Statement of Cash FlowsFor the six months ended 30 June 2011
Notes to the Interim Financial Statements
2011 2010 2010 Half year Half year Full year Note £m £m £m
Cash flows from operating activities Profit after tax 53.6 33.1 96.2 Adjustments for: Tax 7 17.2 7.2 23.7Profit on disposal of businesses (0.1) – –Finance costs 6 7.2 8.4 16.2Financial income 6 (5.3) (4.6) (8.2)Depreciation 7.1 7.1 14.4Amortisation of intangible assets 9.1 6.0 14.4Gain on sale of property, plant and equipment – – (0.1)Equity-settled share-based payment transactions 2.6 1.4 6.6 Cash-settled share-based payment (0.2) – –operating profit before changes in working capital and provisions 91.2 58.6 163.2Decrease/(increase) in trade and other receivables 11.2 13.9 (18.5) Increase in inventories (17.3) (9.3) (15.1)(Decrease)/increase in trade and other payables (10.5) 18.6 56.6Increase/(decrease) in provisions and employee benefits 0.8 (9.2) (10.8)Corporation tax paid (12.6) (7.9) (21.0)net cash from operating activities 62.8 64.7 154.4Cash flows from investing activities Purchase of property, plant and equipment and software (12.7) (7.4) (18.9) Proceeds from sale of property, plant and equipment 0.4 0.3 1.4Acquisition of businesses, net of cash acquired 5 (7.4) (5.0) (62.6)Proceeds from disposal of businesses 0.1 – –Interest received 0.4 0.4 1.0net cash flows used in investing activities (19.2) (11.7) (79.1)Cash flows from financing activities Interest paid (4.2) (5.5) (11.1)Dividends paid (24.3) (20.7) (28.9)Share options exercised from treasury shares 0.1 1.3 1.9Proceeds from borrowings – – 46.8Repayment of borrowings – (6.2) (52.8)Net cash flows used in financing activities (28.4) (31.1) (44.1)net increase in cash and cash equivalents 15.2 21.9 31.2Cash and cash equivalents at beginning of year 63.3 33.7 33.7Effect of foreign exchange rate changes 1.4 (1.5) (1.6)Cash and cash equivalents at end of period 79.9 54.1 63.3
reconciliation of changes in cash and cash equivalents to movements in net debt
Net increase in cash and cash equivalents 15.2 21.9 31.2Proceeds from borrowings – – (46.8)Repayment of borrowings – 6.2 52.8Effect of foreign exchange rate changes (2.7) 3.0 0.5Movement in net debt 12.5 31.1 37.7Net debt at start of year (86.2) (123.9) (123.9)Net debt at end of period (73.7) (92.8) (86.2)
1. Principal accounting Policies and Basis of Preparation
Spectris plc is a public limited company incorporated and domiciled in the United Kingdom, whose shares are publicly traded on the London Stock Exchange.
The condensed consolidated interim financial statements of the company for the six months ended 30 June 2011 comprise the company and its subsidiaries, together referred to as the group. These condensed consolidated interim financial statements are presented in millions of pounds sterling rounded to the nearest one decimal place. The consolidated financial statements of the group for the year ended 31 December 2010 are available upon request from the company’s registered office at Station Road, Egham, Surrey TW20 9NP.
These condensed consolidated interim financial statements have been prepared in accordance with adopted International Financial Reporting Standard (IFRS) IAS 34 ‘Interim Financial Reporting’. They do not include all of the information required for full annual financial statements, and should be read in conjunction with the consolidated financial statements of the group for the year ended 31 December 2010.
The accounting policies applied by the group in these condensed consolidated interim financial statements are the same as those applied by the group in its consolidated financial statements for the year ended 31 December 2010.
Having reviewed the group’s plans and available financial facilities, the Board has a reasonable expectation that the group has adequate resources to continue its operational existence for the foreseeable future. For this reason, it continues to adopt the going concern basis in preparing the group’s accounts. There are no key sensitivities identified in relation to this conclusion.
The interim results are unaudited. They do not constitute statutory financial statements as defined in section 434 of the Companies Act 2006. The comparative figures for the financial year ended 31 December 2010 are not the company’s statutory accounts for that financial year. Those accounts have been reported on by the company’s auditors and delivered to the registrar of companies. The report of the auditors was (i) unqualified, (ii) did not include a reference to any matters to which the auditors drew attention by way of emphasis without qualifying their report, and (iii) did not contain a statement under section 498(2) or (3) of the Companies Act 2006.
The preparation of interim financial statements in conformity with adopted IFRS requires management to make judgements, estimates and assumptions that affect the application of accounting policies and the reported amount of assets and liabilities, income and expense. Actual results may differ from these estimates. In preparing these condensed consolidated interim financial statements, the significant judgements made by management in applying the group’s accounting policies and the key sources of estimation uncertainty were the same as those that applied to the consolidated statements for the year ended 31 December 2010.
The directors have considered the circumstances as at 30 June 2011 and concluded that there are no indicators of impairments that require an impairment review to be undertaken at the balance sheet date. Regular impairment reviews will be undertaken later in 2011 consistent with the timing in previous years.
The group’s financial risk management objectives and policies are consistent with those disclosed in the consolidated financial statements for the year ended 31 December 2010.
These condensed consolidated interim financial statements were approved by the Board of Directors on 23 August 2011.
20778SPECTRIS.indd 25 01/09/2011 10:26:38
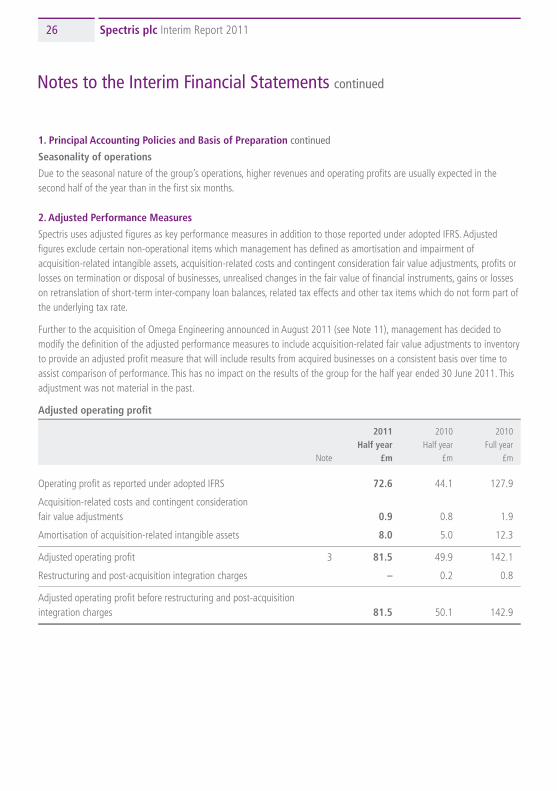
Spectris plc Interim Report 2011Spectris plc Interim Report 201126
20778.04 01/09/11 Proof 5
1. Principal accounting Policies and Basis of Preparation continued
Seasonality of operations
Due to the seasonal nature of the group’s operations, higher revenues and operating profits are usually expected in the second half of the year than in the first six months.
2. adjusted Performance Measures
Spectris uses adjusted figures as key performance measures in addition to those reported under adopted IFRS. Adjusted figures exclude certain non-operational items which management has defined as amortisation and impairment of acquisition-related intangible assets, acquisition-related costs and contingent consideration fair value adjustments, profits or losses on termination or disposal of businesses, unrealised changes in the fair value of financial instruments, gains or losses on retranslation of short-term inter-company loan balances, related tax effects and other tax items which do not form part of the underlying tax rate.
Further to the acquisition of Omega Engineering announced in August 2011 (see Note 11), management has decided to modify the definition of the adjusted performance measures to include acquisition-related fair value adjustments to inventory to provide an adjusted profit measure that will include results from acquired businesses on a consistent basis over time to assist comparison of performance. This has no impact on the results of the group for the half year ended 30 June 2011. This adjustment was not material in the past.
adjusted operating profit
2011 2010 2010 Half year Half year Full year Note £m £m £m
Operating profit as reported under adopted IFRS 72.6 44.1 127.9
Acquisition-related costs and contingent consideration fair value adjustments 0.9 0.8 1.9
Amortisation of acquisition-related intangible assets 8.0 5.0 12.3
Adjusted operating profit 3 81.5 49.9 142.1
Restructuring and post-acquisition integration charges – 0.2 0.8
Adjusted operating profit before restructuring and post-acquisition integration charges 81.5 50.1 142.9
adjusted operating profit by segment – June 2011
2011 Materials test and in-line industrial Half year analysis Measurement instrumentation Controls total Note £m £m £m £m £m
Operating profit as reported under adopted IFRS 22.1 17.4 26.9 6.2 72.6
Acquisition-related costs and contingent consideration fair value adjustments 0.1 0.3 0.1 0.4 0.9
Amortisation of acquisition-related intangible assets 2.1 3.2 1.1 1.6 8.0
Adjusted operating profit: segment result under adopted IFRS 3 24.3 20.9 28.1 8.2 81.5
adjusted operating profit by segment – June 2010
2010 Materials Test and In-line Industrial Half year Analysis Measurement Instrumentation Controls Total Note £m £m £m £m £m
Operating profit as reported under adopted IFRS 12.1 5.1 23.3 3.6 44.1
Acquisition-related costs and contingent consideration fair value adjustments 0.8 – – – 0.8
Amortisation of acquisition-related intangible assets 1.0 3.1 0.4 0.5 5.0
Adjusted operating profit: segment result under adopted IFRS 3 13.9 8.2 23.7 4.1 49.9
Notes to the Interim Financial Statements continued
20778SPECTRIS.indd 26 01/09/2011 10:26:38
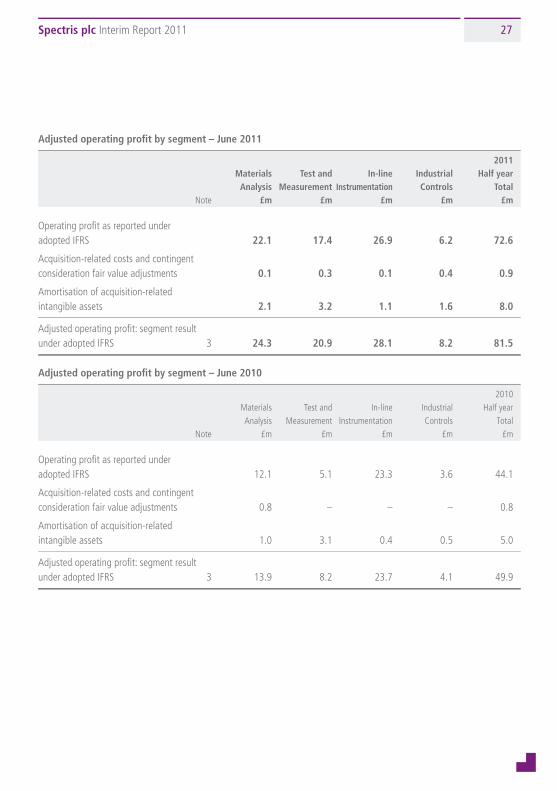
Spectris plc Interim Report 2011 27
20778.04 01/09/11 Proof 5
1. Principal accounting Policies and Basis of Preparation continued
Seasonality of operations
Due to the seasonal nature of the group’s operations, higher revenues and operating profits are usually expected in the second half of the year than in the first six months.
2. adjusted Performance Measures
Spectris uses adjusted figures as key performance measures in addition to those reported under adopted IFRS. Adjusted figures exclude certain non-operational items which management has defined as amortisation and impairment of acquisition-related intangible assets, acquisition-related costs and contingent consideration fair value adjustments, profits or losses on termination or disposal of businesses, unrealised changes in the fair value of financial instruments, gains or losses on retranslation of short-term inter-company loan balances, related tax effects and other tax items which do not form part of the underlying tax rate.
Further to the acquisition of Omega Engineering announced in August 2011 (see Note 11), management has decided to modify the definition of the adjusted performance measures to include acquisition-related fair value adjustments to inventory to provide an adjusted profit measure that will include results from acquired businesses on a consistent basis over time to assist comparison of performance. This has no impact on the results of the group for the half year ended 30 June 2011. This adjustment was not material in the past.
adjusted operating profit
2011 2010 2010 Half year Half year Full year Note £m £m £m
Operating profit as reported under adopted IFRS 72.6 44.1 127.9
Acquisition-related costs and contingent consideration fair value adjustments 0.9 0.8 1.9
Amortisation of acquisition-related intangible assets 8.0 5.0 12.3
Adjusted operating profit 3 81.5 49.9 142.1
Restructuring and post-acquisition integration charges – 0.2 0.8
Adjusted operating profit before restructuring and post-acquisition integration charges 81.5 50.1 142.9
adjusted operating profit by segment – June 2011
2011 Materials test and in-line industrial Half year analysis Measurement instrumentation Controls total Note £m £m £m £m £m
Operating profit as reported under adopted IFRS 22.1 17.4 26.9 6.2 72.6
Acquisition-related costs and contingent consideration fair value adjustments 0.1 0.3 0.1 0.4 0.9
Amortisation of acquisition-related intangible assets 2.1 3.2 1.1 1.6 8.0
Adjusted operating profit: segment result under adopted IFRS 3 24.3 20.9 28.1 8.2 81.5
adjusted operating profit by segment – June 2010
2010 Materials Test and In-line Industrial Half year Analysis Measurement Instrumentation Controls Total Note £m £m £m £m £m
Operating profit as reported under adopted IFRS 12.1 5.1 23.3 3.6 44.1
Acquisition-related costs and contingent consideration fair value adjustments 0.8 – – – 0.8
Amortisation of acquisition-related intangible assets 1.0 3.1 0.4 0.5 5.0
Adjusted operating profit: segment result under adopted IFRS 3 13.9 8.2 23.7 4.1 49.9
20778SPECTRIS.indd 27 01/09/2011 10:26:38

Spectris plc Interim Report 2011Spectris plc Interim Report 201128
20778.04 01/09/11 Proof 5
2. adjusted Performance Measures continued
adjusted operating profit by segment – december 2010
2010 Materials Test and In-line Industrial Full year Analysis Measurement Instrumentation Controls Total Note £m £m £m £m £m
Operating profit as reported under adopted IFRS 34.7 28.3 57.1 7.8 127.9
Acquisition-related costs and contingent consideration fair value adjustments 1.2 0.2 0.3 0.2 1.9
Amortisation of acquisition-related intangible assets 3.6 6.3 0.9 1.5 12.3
Adjusted operating profit: segment result under adopted IFRS 3 39.5 34.8 58.3 9.5 142.1
return on sales by segment – June 2011
2011 Materials test and in-line industrial Half year analysis Measurement instrumentation Controls total
Using operating profit as reported under adopted IFRS 14.2% 10.7% 18.2% 15.3% 14.3%
Using adjusted operating profit 15.6% 12.9% 19.0% 20.3% 16.1%
return on sales by segment – June 2010
2010 Materials Test and In-line Industrial Half year Analysis Measurement Instrumentation Controls Total
Using operating profit as reported under adopted IFRS 10.1% 3.9% 18.4% 13.0% 10.9%
Using adjusted operating profit 11.7% 6.3% 18.7% 14.9% 12.3%
return on sales by segment – december 2010
2010 Materials Test and In-line Industrial Full year Analysis Measurement Instrumentation Controls Total
Using operating profit as reported under adopted IFRS 12.8% 9.5% 20.9% 13.0% 14.2%
Using adjusted operating profit 14.5% 11.7% 21.3% 15.9% 15.8%
reconciliation to adjusted profit before tax and adjusted operating profit
2011 2010 2010 Half year Half year Full year Note £m £m £m
Profit before tax as reported under adopted IFRS 70.8 40.3 119.9
Add/(deduct):
Acquisition-related costs and contingent consideration fair value adjustments 0.9 0.8 1.9
Amortisation of acquisition-related intangible assets 8.0 5.0 12.3
Net gains on retranslation of short-term inter-company loan balances 6 (0.7) (0.3) (0.4)
Profit on disposal of businesses 4 (0.1) – –
Increase in fair value of cross-currency interest rate swaps 6 (1.2) (1.1) (1.4)
Adjusted profit before tax 77.7 44.7 132.3
Adjusted net finance costs (see below) 3.8 5.2 9.8
Adjusted operating profit 81.5 49.9 142.1
adjusted net finance costs
2011 2010 2010 Half year Half year Full year £m £m £m
Net interest costs as reported under adopted IFRS (1.9) (3.8) (8.0)
Increase in fair value of cross-currency interest rate swaps (1.2) (1.1) (1.4)
Net gains on retranslation of short-term inter-company loan balances (0.7) (0.3) (0.4)
Adjusted net finance costs (3.8) (5.2) (9.8)
Notes to the Interim Financial Statements continued
20778SPECTRIS.indd 28 01/09/2011 10:26:38
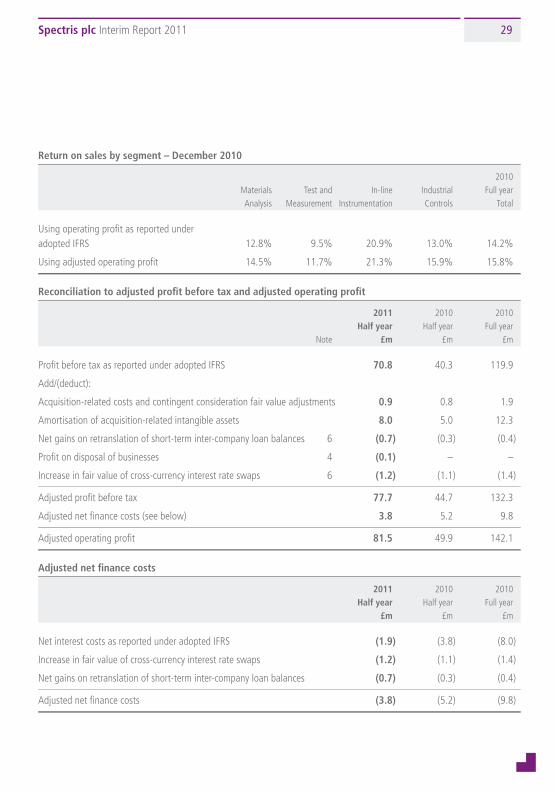
Spectris plc Interim Report 2011 29
20778.04 01/09/11 Proof 5
2. adjusted Performance Measures continued
adjusted operating profit by segment – december 2010
2010 Materials Test and In-line Industrial Full year Analysis Measurement Instrumentation Controls Total Note £m £m £m £m £m
Operating profit as reported under adopted IFRS 34.7 28.3 57.1 7.8 127.9
Acquisition-related costs and contingent consideration fair value adjustments 1.2 0.2 0.3 0.2 1.9
Amortisation of acquisition-related intangible assets 3.6 6.3 0.9 1.5 12.3
Adjusted operating profit: segment result under adopted IFRS 3 39.5 34.8 58.3 9.5 142.1
return on sales by segment – June 2011
2011 Materials test and in-line industrial Half year analysis Measurement instrumentation Controls total
Using operating profit as reported under adopted IFRS 14.2% 10.7% 18.2% 15.3% 14.3%
Using adjusted operating profit 15.6% 12.9% 19.0% 20.3% 16.1%
return on sales by segment – June 2010
2010 Materials Test and In-line Industrial Half year Analysis Measurement Instrumentation Controls Total
Using operating profit as reported under adopted IFRS 10.1% 3.9% 18.4% 13.0% 10.9%
Using adjusted operating profit 11.7% 6.3% 18.7% 14.9% 12.3%
return on sales by segment – december 2010
2010 Materials Test and In-line Industrial Full year Analysis Measurement Instrumentation Controls Total
Using operating profit as reported under adopted IFRS 12.8% 9.5% 20.9% 13.0% 14.2%
Using adjusted operating profit 14.5% 11.7% 21.3% 15.9% 15.8%
reconciliation to adjusted profit before tax and adjusted operating profit
2011 2010 2010 Half year Half year Full year Note £m £m £m
Profit before tax as reported under adopted IFRS 70.8 40.3 119.9
Add/(deduct):
Acquisition-related costs and contingent consideration fair value adjustments 0.9 0.8 1.9
Amortisation of acquisition-related intangible assets 8.0 5.0 12.3
Net gains on retranslation of short-term inter-company loan balances 6 (0.7) (0.3) (0.4)
Profit on disposal of businesses 4 (0.1) – –
Increase in fair value of cross-currency interest rate swaps 6 (1.2) (1.1) (1.4)
Adjusted profit before tax 77.7 44.7 132.3
Adjusted net finance costs (see below) 3.8 5.2 9.8
Adjusted operating profit 81.5 49.9 142.1
adjusted net finance costs
2011 2010 2010 Half year Half year Full year £m £m £m
Net interest costs as reported under adopted IFRS (1.9) (3.8) (8.0)
Increase in fair value of cross-currency interest rate swaps (1.2) (1.1) (1.4)
Net gains on retranslation of short-term inter-company loan balances (0.7) (0.3) (0.4)
Adjusted net finance costs (3.8) (5.2) (9.8)
20778SPECTRIS.indd 29 01/09/2011 10:26:38
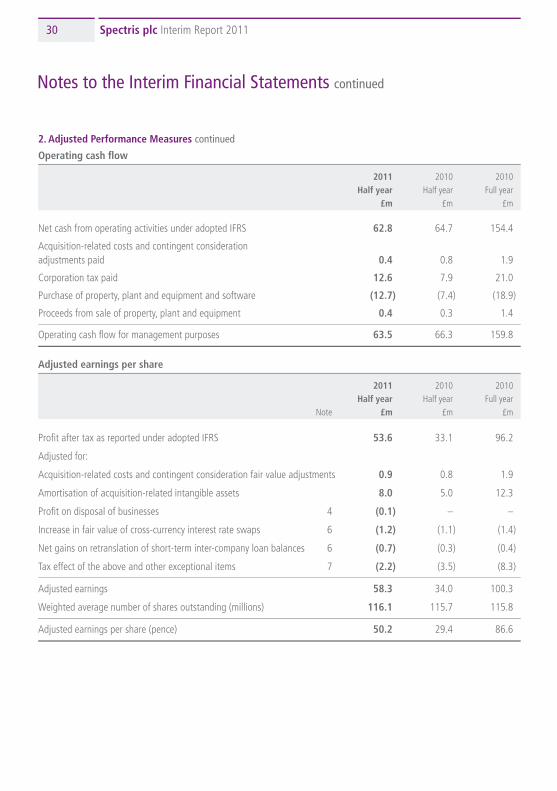
Spectris plc Interim Report 2011Spectris plc Interim Report 201130
20778.04 01/09/11 Proof 5
2. adjusted Performance Measures continued
operating cash flow
2011 2010 2010 Half year Half year Full year £m £m £m
Net cash from operating activities under adopted IFRS 62.8 64.7 154.4
Acquisition-related costs and contingent consideration adjustments paid 0.4 0.8 1.9
Corporation tax paid 12.6 7.9 21.0
Purchase of property, plant and equipment and software (12.7) (7.4) (18.9)
Proceeds from sale of property, plant and equipment 0.4 0.3 1.4
Operating cash flow for management purposes 63.5 66.3 159.8
adjusted earnings per share
2011 2010 2010 Half year Half year Full year Note £m £m £m
Profit after tax as reported under adopted IFRS 53.6 33.1 96.2
Adjusted for:
Acquisition-related costs and contingent consideration fair value adjustments 0.9 0.8 1.9
Amortisation of acquisition-related intangible assets 8.0 5.0 12.3
Profit on disposal of businesses 4 (0.1) – –
Increase in fair value of cross-currency interest rate swaps 6 (1.2) (1.1) (1.4)
Net gains on retranslation of short-term inter-company loan balances 6 (0.7) (0.3) (0.4)
Tax effect of the above and other exceptional items 7 (2.2) (3.5) (8.3)
Adjusted earnings 58.3 34.0 100.3
Weighted average number of shares outstanding (millions) 116.1 115.7 115.8
Adjusted earnings per share (pence) 50.2 29.4 86.6
adjusted diluted earnings per share
2011 2010 2010 Note Half year Half year Full year
Adjusted earnings (as above) (£m) 58.3 34.0 100.3
Diluted weighted average number of shares outstanding (millions) 8 118.4 116.2 117.9
Adjusted diluted earnings per share (pence) 49.2 29.3 85.1
Basic and diluted earnings per share in accordance with IAS 33 are disclosed in Note 8.
analysis of net debt for management purposes
2011 2010 2010 Half year Half year Full year £m £m £m
Bank overdrafts 0.6 1.2 1.4
Bank loans – secured 2.0 2.4 2.2
Bank loans – unsecured 47.2 – 48.3
Unsecured loan notes 85.0 137.2 85.3
Cross-currency interest rate swaps – currency portion 19.4 7.3 13.7
Total borrowings 154.2 148.1 150.9
Cash balances (80.5) (55.3) (64.7)
Net debt 73.7 92.8 86.2
3. operating Segments
The group has four reportable segments, as described below, which are the group’s strategic business units. These units offer different applications, assist companies at various stages of the production cycle and are focused towards specific industries. These segments reflect the internal reporting provided to the Chief Operating Decision Maker (considered to be the Board) on a regular basis. The following summary describes the operations in each of the group’s reportable segments.
• Materials Analysis provides a wide range of analytical instrumentation to the metals and mining, pharmaceutical and life sciences, and electronics industries, and to academic and research institutions.
• Test and Measurement supplies test, measurement and analysis equipment and software for product design optimisation, manufacturing control and environmental monitoring systems, principally to the aerospace, automotive and consumer electronics industries.
• In-line Instrumentation provides process analytical measurement, asset monitoring and on-line controls for both primary processing and the converting industries.
• Industrial Controls supplies automation and control products for the discrete manufacturing industries.
Notes to the Interim Financial Statements continued
20778SPECTRIS.indd 30 01/09/2011 10:26:38
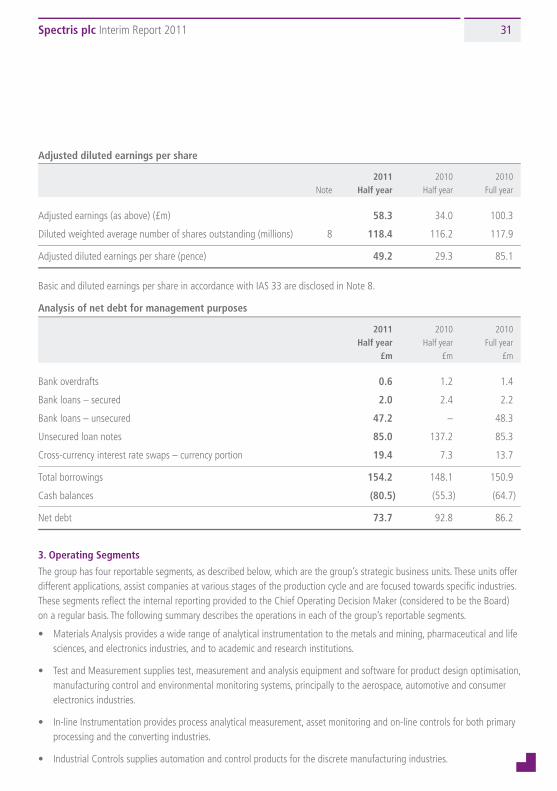
Spectris plc Interim Report 2011 31
20778.04 01/09/11 Proof 5
2. adjusted Performance Measures continued
operating cash flow
2011 2010 2010 Half year Half year Full year £m £m £m
Net cash from operating activities under adopted IFRS 62.8 64.7 154.4
Acquisition-related costs and contingent consideration adjustments paid 0.4 0.8 1.9
Corporation tax paid 12.6 7.9 21.0
Purchase of property, plant and equipment and software (12.7) (7.4) (18.9)
Proceeds from sale of property, plant and equipment 0.4 0.3 1.4
Operating cash flow for management purposes 63.5 66.3 159.8
adjusted earnings per share
2011 2010 2010 Half year Half year Full year Note £m £m £m
Profit after tax as reported under adopted IFRS 53.6 33.1 96.2
Adjusted for:
Acquisition-related costs and contingent consideration fair value adjustments 0.9 0.8 1.9
Amortisation of acquisition-related intangible assets 8.0 5.0 12.3
Profit on disposal of businesses 4 (0.1) – –
Increase in fair value of cross-currency interest rate swaps 6 (1.2) (1.1) (1.4)
Net gains on retranslation of short-term inter-company loan balances 6 (0.7) (0.3) (0.4)
Tax effect of the above and other exceptional items 7 (2.2) (3.5) (8.3)
Adjusted earnings 58.3 34.0 100.3
Weighted average number of shares outstanding (millions) 116.1 115.7 115.8
Adjusted earnings per share (pence) 50.2 29.4 86.6
adjusted diluted earnings per share
2011 2010 2010 Note Half year Half year Full year
Adjusted earnings (as above) (£m) 58.3 34.0 100.3
Diluted weighted average number of shares outstanding (millions) 8 118.4 116.2 117.9
Adjusted diluted earnings per share (pence) 49.2 29.3 85.1
Basic and diluted earnings per share in accordance with IAS 33 are disclosed in Note 8.
analysis of net debt for management purposes
2011 2010 2010 Half year Half year Full year £m £m £m
Bank overdrafts 0.6 1.2 1.4
Bank loans – secured 2.0 2.4 2.2
Bank loans – unsecured 47.2 – 48.3
Unsecured loan notes 85.0 137.2 85.3
Cross-currency interest rate swaps – currency portion 19.4 7.3 13.7
Total borrowings 154.2 148.1 150.9
Cash balances (80.5) (55.3) (64.7)
Net debt 73.7 92.8 86.2
3. operating Segments
The group has four reportable segments, as described below, which are the group’s strategic business units. These units offer different applications, assist companies at various stages of the production cycle and are focused towards specific industries. These segments reflect the internal reporting provided to the Chief Operating Decision Maker (considered to be the Board) on a regular basis. The following summary describes the operations in each of the group’s reportable segments.
• Materials Analysis provides a wide range of analytical instrumentation to the metals and mining, pharmaceutical and life sciences, and electronics industries, and to academic and research institutions.
• Test and Measurement supplies test, measurement and analysis equipment and software for product design optimisation, manufacturing control and environmental monitoring systems, principally to the aerospace, automotive and consumer electronics industries.
• In-line Instrumentation provides process analytical measurement, asset monitoring and on-line controls for both primary processing and the converting industries.
• Industrial Controls supplies automation and control products for the discrete manufacturing industries.
20778SPECTRIS.indd 31 01/09/2011 10:26:38
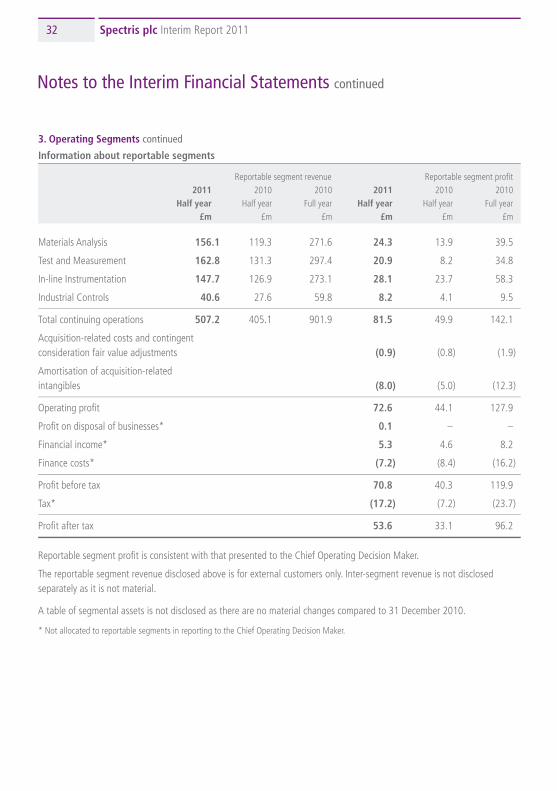
Spectris plc Interim Report 2011Spectris plc Interim Report 201132
20778.04 01/09/11 Proof 5
3. operating Segments continued
information about reportable segments
Reportable segment revenue Reportable segment profit 2011 2010 2010 2011 2010 2010 Half year Half year Full year Half year Half year Full year £m £m £m £m £m £m
Materials Analysis 156.1 119.3 271.6 24.3 13.9 39.5
Test and Measurement 162.8 131.3 297.4 20.9 8.2 34.8
In-line Instrumentation 147.7 126.9 273.1 28.1 23.7 58.3
Industrial Controls 40.6 27.6 59.8 8.2 4.1 9.5
Total continuing operations 507.2 405.1 901.9 81.5 49.9 142.1
Acquisition-related costs and contingent consideration fair value adjustments (0.9) (0.8) (1.9)
Amortisation of acquisition-related intangibles (8.0) (5.0) (12.3)
Operating profit 72.6 44.1 127.9
Profit on disposal of businesses* 0.1 – –
Financial income* 5.3 4.6 8.2
Finance costs* (7.2) (8.4) (16.2)
Profit before tax 70.8 40.3 119.9
Tax* (17.2) (7.2) (23.7)
Profit after tax 53.6 33.1 96.2
Reportable segment profit is consistent with that presented to the Chief Operating Decision Maker.
The reportable segment revenue disclosed above is for external customers only. Inter-segment revenue is not disclosed separately as it is not material.
A table of segmental assets is not disclosed as there are no material changes compared to 31 December 2010.
* Not allocated to reportable segments in reporting to the Chief Operating Decision Maker.
Geographical segments
The group’s operating segments are each located in several geographical locations, and sell on to external customers in all parts of the world.
No individual country amounts to more than 3.5% of turnover, other than those noted below.
The following is an analysis of revenue by geographical destination.
2011 2010 2010 Half year Half year Full year £m £m £m
UK 18.2 14.6 31.4
Germany 55.1 46.3 104.5
France 22.4 18.3 38.9
Rest of Europe 81.6 70.0 150.4
USA 111.1 88.2 202.9
Rest of North America 14.0 10.6 24.4
Japan 42.5 33.5 73.2
China 70.4 48.0 111.2
Rest of Asia Pacific 56.6 48.1 102.5
Rest of the world 35.3 27.5 62.5
507.2 405.1 901.9
4. disposal of Businesses
On 1 January 2011, the group sold a sales operation in the Netherlands for a profit of £0.1m. The total consideration was £0.1m net of transaction costs.
During the period to 30 June 2010 and the year to 31 December 2010 the group did not divest any businesses.
Notes to the Interim Financial Statements continued
20778SPECTRIS.indd 32 01/09/2011 10:26:38

Spectris plc Interim Report 2011 33
20778.04 01/09/11 Proof 5
3. operating Segments continued
information about reportable segments
Reportable segment revenue Reportable segment profit 2011 2010 2010 2011 2010 2010 Half year Half year Full year Half year Half year Full year £m £m £m £m £m £m
Materials Analysis 156.1 119.3 271.6 24.3 13.9 39.5
Test and Measurement 162.8 131.3 297.4 20.9 8.2 34.8
In-line Instrumentation 147.7 126.9 273.1 28.1 23.7 58.3
Industrial Controls 40.6 27.6 59.8 8.2 4.1 9.5
Total continuing operations 507.2 405.1 901.9 81.5 49.9 142.1
Acquisition-related costs and contingent consideration fair value adjustments (0.9) (0.8) (1.9)
Amortisation of acquisition-related intangibles (8.0) (5.0) (12.3)
Operating profit 72.6 44.1 127.9
Profit on disposal of businesses* 0.1 – –
Financial income* 5.3 4.6 8.2
Finance costs* (7.2) (8.4) (16.2)
Profit before tax 70.8 40.3 119.9
Tax* (17.2) (7.2) (23.7)
Profit after tax 53.6 33.1 96.2
Reportable segment profit is consistent with that presented to the Chief Operating Decision Maker.
The reportable segment revenue disclosed above is for external customers only. Inter-segment revenue is not disclosed separately as it is not material.
A table of segmental assets is not disclosed as there are no material changes compared to 31 December 2010.
* Not allocated to reportable segments in reporting to the Chief Operating Decision Maker.
Geographical segments
The group’s operating segments are each located in several geographical locations, and sell on to external customers in all parts of the world.
No individual country amounts to more than 3.5% of turnover, other than those noted below.
The following is an analysis of revenue by geographical destination.
2011 2010 2010 Half year Half year Full year £m £m £m
UK 18.2 14.6 31.4
Germany 55.1 46.3 104.5
France 22.4 18.3 38.9
Rest of Europe 81.6 70.0 150.4
USA 111.1 88.2 202.9
Rest of North America 14.0 10.6 24.4
Japan 42.5 33.5 73.2
China 70.4 48.0 111.2
Rest of Asia Pacific 56.6 48.1 102.5
Rest of the world 35.3 27.5 62.5
507.2 405.1 901.9
4. disposal of Businesses
On 1 January 2011, the group sold a sales operation in the Netherlands for a profit of £0.1m. The total consideration was £0.1m net of transaction costs.
During the period to 30 June 2010 and the year to 31 December 2010 the group did not divest any businesses.
20778SPECTRIS.indd 33 01/09/2011 10:26:38
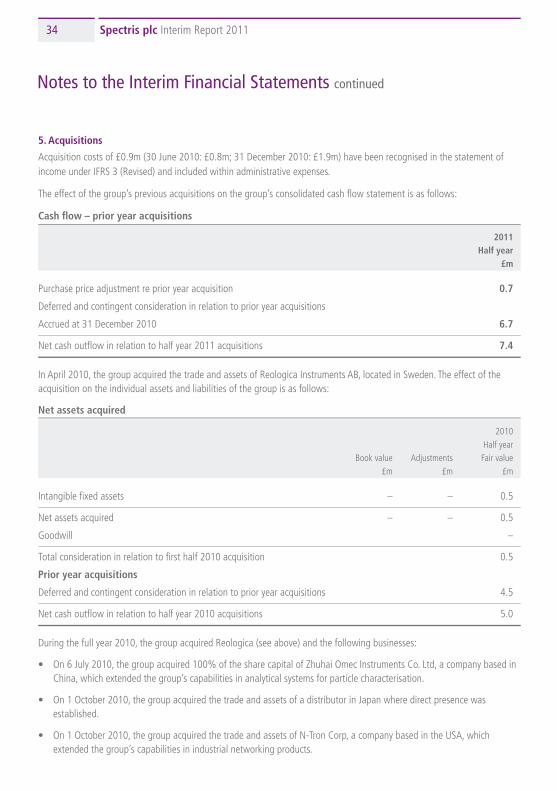
Spectris plc Interim Report 2011Spectris plc Interim Report 201134
20778.04 01/09/11 Proof 5
5. acquisitions
Acquisition costs of £0.9m (30 June 2010: £0.8m; 31 December 2010: £1.9m) have been recognised in the statement of income under IFRS 3 (Revised) and included within administrative expenses.
The effect of the group’s previous acquisitions on the group’s consolidated cash flow statement is as follows:
Cash flow – prior year acquisitions
2011 Half year £m
Purchase price adjustment re prior year acquisition 0.7
Deferred and contingent consideration in relation to prior year acquisitions
Accrued at 31 December 2010 6.7
Net cash outflow in relation to half year 2011 acquisitions 7.4
In April 2010, the group acquired the trade and assets of Reologica Instruments AB, located in Sweden. The effect of the acquisition on the individual assets and liabilities of the group is as follows:
net assets acquired
2010 Half year Book value Adjustments Fair value £m £m £m
Intangible fixed assets – – 0.5
Net assets acquired – – 0.5
Goodwill –
Total consideration in relation to first half 2010 acquisition 0.5
Prior year acquisitions
Deferred and contingent consideration in relation to prior year acquisitions 4.5
Net cash outflow in relation to half year 2010 acquisitions 5.0
During the full year 2010, the group acquired Reologica (see above) and the following businesses:
• On 6 July 2010, the group acquired 100% of the share capital of Zhuhai Omec Instruments Co. Ltd, a company based in China, which extended the group’s capabilities in analytical systems for particle characterisation.
• On 1 October 2010, the group acquired the trade and assets of a distributor in Japan where direct presence was established.
• On 1 October 2010, the group acquired the trade and assets of N-Tron Corp, a company based in the USA, which extended the group’s capabilities in industrial networking products.
• On 24 November 2010, the group acquired 100% of the shares of the Delta F Corporation, a company based in the USA, which extended the group’s capabilities in trace oxygen and water measurement.
The assets and liabilities acquired as a result of the above transactions, together with the aggregate purchase consideration, are summarised below.
net assets acquired
2010 Full year Book value Adjustments Fair value £m £m £m
Intangible fixed assets 0.1 36.5 36.6
Tangible fixed assets 0.5 (0.1) 0.4
Inventories 4.1 (0.2) 3.9
Trade and other receivables 4.5 – 4.5
Trade and other payables (1.7) – (1.7)
Provisions (0.1) – (0.1)
Deferred tax liabilities – (5.7) (5.7)
Cash 0.8 – 0.8
Net assets acquired 8.2 30.5 38.7
Goodwill 24.3
Total consideration in relation to full year 2010 acquisitions 63.0
analysis of cash outflow in consolidated cash flow statement
Total consideration in respect of 2010 acquisitions 63.0
Adjustment for cash acquired on 2010 acquisitions (0.8)
Deferred and contingent consideration on 2010 acquisitions to be paid in future years (4.1)
Cash paid in 2010 in respect of 2010 acquisitions 58.1
Acquisitions prior to 2010:
Purchase price adjustment 8.3
Deferred and contingent consideration adjustments:
Accrued at 31 December 2009 4.5
Accrued during 2010 but not paid at 31 December 2010 (8.3)
Cash paid in 2010 in respect of prior year acquisitions 4.5
Net cash outflow in relation to full year 2010 acquisitions 62.6
Notes to the Interim Financial Statements continued
20778SPECTRIS.indd 34 01/09/2011 10:26:39
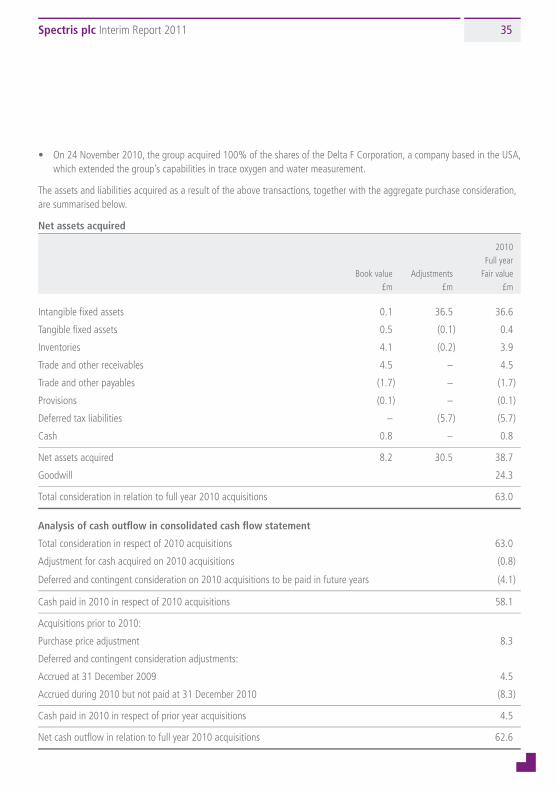
Spectris plc Interim Report 2011 35
20778.04 01/09/11 Proof 5
5. acquisitions
Acquisition costs of £0.9m (30 June 2010: £0.8m; 31 December 2010: £1.9m) have been recognised in the statement of income under IFRS 3 (Revised) and included within administrative expenses.
The effect of the group’s previous acquisitions on the group’s consolidated cash flow statement is as follows:
Cash flow – prior year acquisitions
2011 Half year £m
Purchase price adjustment re prior year acquisition 0.7
Deferred and contingent consideration in relation to prior year acquisitions
Accrued at 31 December 2010 6.7
Net cash outflow in relation to half year 2011 acquisitions 7.4
In April 2010, the group acquired the trade and assets of Reologica Instruments AB, located in Sweden. The effect of the acquisition on the individual assets and liabilities of the group is as follows:
net assets acquired
2010 Half year Book value Adjustments Fair value £m £m £m
Intangible fixed assets – – 0.5
Net assets acquired – – 0.5
Goodwill –
Total consideration in relation to first half 2010 acquisition 0.5
Prior year acquisitions
Deferred and contingent consideration in relation to prior year acquisitions 4.5
Net cash outflow in relation to half year 2010 acquisitions 5.0
During the full year 2010, the group acquired Reologica (see above) and the following businesses:
• On 6 July 2010, the group acquired 100% of the share capital of Zhuhai Omec Instruments Co. Ltd, a company based in China, which extended the group’s capabilities in analytical systems for particle characterisation.
• On 1 October 2010, the group acquired the trade and assets of a distributor in Japan where direct presence was established.
• On 1 October 2010, the group acquired the trade and assets of N-Tron Corp, a company based in the USA, which extended the group’s capabilities in industrial networking products.
• On 24 November 2010, the group acquired 100% of the shares of the Delta F Corporation, a company based in the USA, which extended the group’s capabilities in trace oxygen and water measurement.
The assets and liabilities acquired as a result of the above transactions, together with the aggregate purchase consideration, are summarised below.
net assets acquired
2010 Full year Book value Adjustments Fair value £m £m £m
Intangible fixed assets 0.1 36.5 36.6
Tangible fixed assets 0.5 (0.1) 0.4
Inventories 4.1 (0.2) 3.9
Trade and other receivables 4.5 – 4.5
Trade and other payables (1.7) – (1.7)
Provisions (0.1) – (0.1)
Deferred tax liabilities – (5.7) (5.7)
Cash 0.8 – 0.8
Net assets acquired 8.2 30.5 38.7
Goodwill 24.3
Total consideration in relation to full year 2010 acquisitions 63.0
analysis of cash outflow in consolidated cash flow statement
Total consideration in respect of 2010 acquisitions 63.0
Adjustment for cash acquired on 2010 acquisitions (0.8)
Deferred and contingent consideration on 2010 acquisitions to be paid in future years (4.1)
Cash paid in 2010 in respect of 2010 acquisitions 58.1
Acquisitions prior to 2010:
Purchase price adjustment 8.3
Deferred and contingent consideration adjustments:
Accrued at 31 December 2009 4.5
Accrued during 2010 but not paid at 31 December 2010 (8.3)
Cash paid in 2010 in respect of prior year acquisitions 4.5
Net cash outflow in relation to full year 2010 acquisitions 62.6
20778SPECTRIS.indd 35 01/09/2011 10:26:39
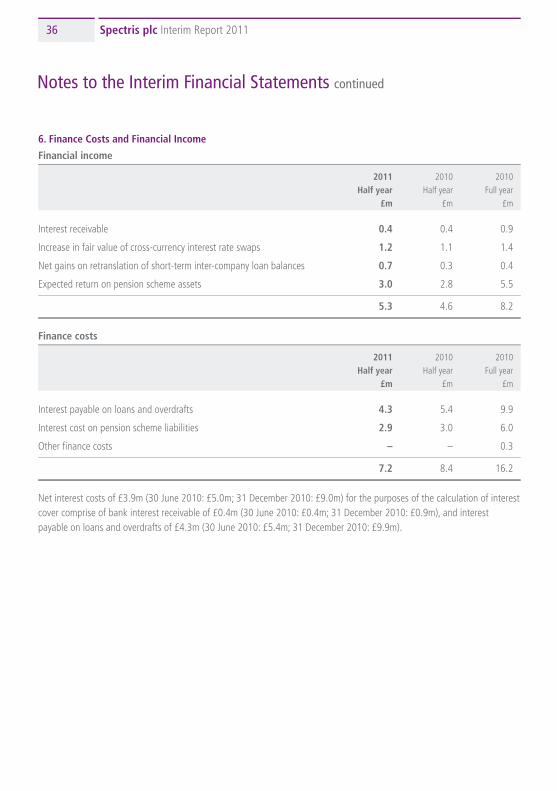
Spectris plc Interim Report 2011Spectris plc Interim Report 201136
20778.04 01/09/11 Proof 5
6. Finance Costs and Financial income
Financial income
2011 2010 2010 Half year Half year Full year £m £m £m
Interest receivable 0.4 0.4 0.9
Increase in fair value of cross-currency interest rate swaps 1.2 1.1 1.4
Net gains on retranslation of short-term inter-company loan balances 0.7 0.3 0.4
Expected return on pension scheme assets 3.0 2.8 5.5
5.3 4.6 8.2
Finance costs
2011 2010 2010 Half year Half year Full year £m £m £m
Interest payable on loans and overdrafts 4.3 5.4 9.9
Interest cost on pension scheme liabilities 2.9 3.0 6.0
Other finance costs – – 0.3
7.2 8.4 16.2
Net interest costs of £3.9m (30 June 2010: £5.0m; 31 December 2010: £9.0m) for the purposes of the calculation of interest cover comprise of bank interest receivable of £0.4m (30 June 2010: £0.4m; 31 December 2010: £0.9m), and interest payable on loans and overdrafts of £4.3m (30 June 2010: £5.4m; 31 December 2010: £9.9m).
7. tax on Profit on ordinary activities
The taxation charge for the six months to 30 June 2011 is based on an estimate of the effective rate of taxation for the current year. The effective rate of taxation applied to adjusted profit before tax for the half year is 25.0% (30 June 2010: 24.0%; year ended 31 December 2010: 24.2%). A reconciliation of the tax charge on adjusted profit to the actual tax charge is presented below.
2011 2010 2010 Half year Half year Full year £m £m £m
The tax charge is analysed as follows:
Tax charge on adjusted profit before tax at effective rate 19.4 10.7 32.0
Tax credit on amortisation of intangible assets (2.6) (1.6) (4.0)
Tax charge on unrealised gain on change in fair value of cross-currency interest rate swaps 0.3 0.3 0.4
Tax credit on acquisition-related costs (0.2) – (0.1)
Tax charge/(credit) on retranslation of short-term inter-company loan balances 0.3 0.1 (0.3)
Tax credit on prior year acquisitions and disposals – (2.3) (4.3)
Total 17.2 7.2 23.7
8. earnings Per Share
Earnings per share and diluted earnings per share are calculated as follows:
Basic earnings per share
2011 2010 2010 Half year Half year Full year
Profit after tax (£m) 53.6 33.1 96.2
Weighted average number of shares outstanding (millions) 116.1 115.7 115.8
Basic earnings per share (pence) 46.2 28.7 83.1
Basic earnings per share amounts are calculated by dividing net profit for the period attributable to ordinary shareholders by the weighted average number of ordinary shares outstanding during the period.
The calculation of diluted earnings per share of 45.3p (30 June 2010: 28.5p; 31 December 2010: 81.6p) is based on the group profit of £53.6m (30 June 2010: £33.1m; 31 December 2010: £96.2m) and on the diluted weighted average number of 5p ordinary shares in issue during the period of 118.4 million (30 June 2010: 116.2 million; 31 December 2010: 117.9 million).
Notes to the Interim Financial Statements continued
20778SPECTRIS.indd 36 01/09/2011 10:26:39
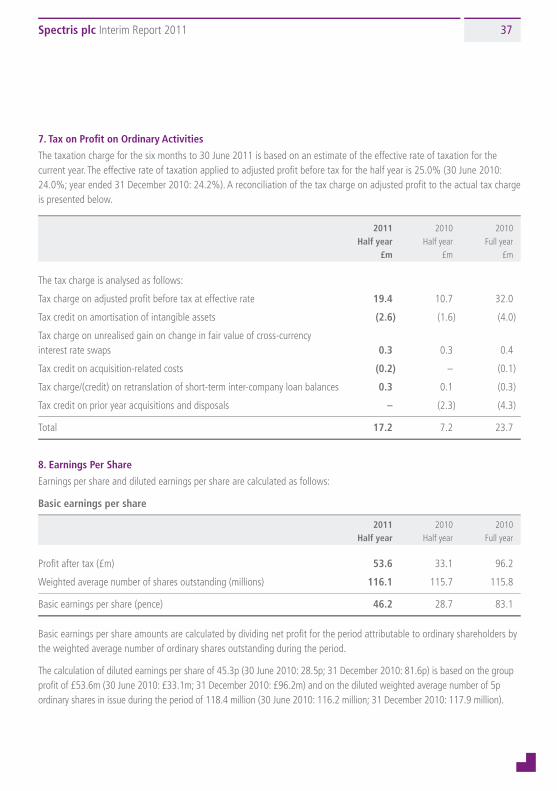
Spectris plc Interim Report 2011 37
20778.04 01/09/11 Proof 5
6. Finance Costs and Financial income
Financial income
2011 2010 2010 Half year Half year Full year £m £m £m
Interest receivable 0.4 0.4 0.9
Increase in fair value of cross-currency interest rate swaps 1.2 1.1 1.4
Net gains on retranslation of short-term inter-company loan balances 0.7 0.3 0.4
Expected return on pension scheme assets 3.0 2.8 5.5
5.3 4.6 8.2
Finance costs
2011 2010 2010 Half year Half year Full year £m £m £m
Interest payable on loans and overdrafts 4.3 5.4 9.9
Interest cost on pension scheme liabilities 2.9 3.0 6.0
Other finance costs – – 0.3
7.2 8.4 16.2
Net interest costs of £3.9m (30 June 2010: £5.0m; 31 December 2010: £9.0m) for the purposes of the calculation of interest cover comprise of bank interest receivable of £0.4m (30 June 2010: £0.4m; 31 December 2010: £0.9m), and interest payable on loans and overdrafts of £4.3m (30 June 2010: £5.4m; 31 December 2010: £9.9m).
7. tax on Profit on ordinary activities
The taxation charge for the six months to 30 June 2011 is based on an estimate of the effective rate of taxation for the current year. The effective rate of taxation applied to adjusted profit before tax for the half year is 25.0% (30 June 2010: 24.0%; year ended 31 December 2010: 24.2%). A reconciliation of the tax charge on adjusted profit to the actual tax charge is presented below.
2011 2010 2010 Half year Half year Full year £m £m £m
The tax charge is analysed as follows:
Tax charge on adjusted profit before tax at effective rate 19.4 10.7 32.0
Tax credit on amortisation of intangible assets (2.6) (1.6) (4.0)
Tax charge on unrealised gain on change in fair value of cross-currency interest rate swaps 0.3 0.3 0.4
Tax credit on acquisition-related costs (0.2) – (0.1)
Tax charge/(credit) on retranslation of short-term inter-company loan balances 0.3 0.1 (0.3)
Tax credit on prior year acquisitions and disposals – (2.3) (4.3)
Total 17.2 7.2 23.7
8. earnings Per Share
Earnings per share and diluted earnings per share are calculated as follows:
Basic earnings per share
2011 2010 2010 Half year Half year Full year
Profit after tax (£m) 53.6 33.1 96.2
Weighted average number of shares outstanding (millions) 116.1 115.7 115.8
Basic earnings per share (pence) 46.2 28.7 83.1
Basic earnings per share amounts are calculated by dividing net profit for the period attributable to ordinary shareholders by the weighted average number of ordinary shares outstanding during the period.
The calculation of diluted earnings per share of 45.3p (30 June 2010: 28.5p; 31 December 2010: 81.6p) is based on the group profit of £53.6m (30 June 2010: £33.1m; 31 December 2010: £96.2m) and on the diluted weighted average number of 5p ordinary shares in issue during the period of 118.4 million (30 June 2010: 116.2 million; 31 December 2010: 117.9 million).
20778SPECTRIS.indd 37 01/09/2011 10:26:39
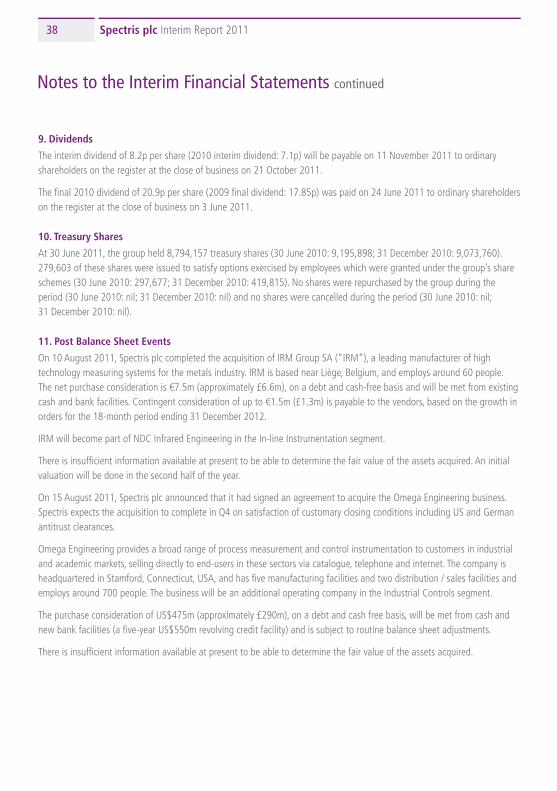
Spectris plc Interim Report 2011Spectris plc Interim Report 201138
20778.04 01/09/11 Proof 5
9. dividends
The interim dividend of 8.2p per share (2010 interim dividend: 7.1p) will be payable on 11 November 2011 to ordinary shareholders on the register at the close of business on 21 October 2011.
The final 2010 dividend of 20.9p per share (2009 final dividend: 17.85p) was paid on 24 June 2011 to ordinary shareholders on the register at the close of business on 3 June 2011.
10. treasury Shares
At 30 June 2011, the group held 8,794,157 treasury shares (30 June 2010: 9,195,898; 31 December 2010: 9,073,760). 279,603 of these shares were issued to satisfy options exercised by employees which were granted under the group’s share schemes (30 June 2010: 297,677; 31 December 2010: 419,815). No shares were repurchased by the group during the period (30 June 2010: nil; 31 December 2010: nil) and no shares were cancelled during the period (30 June 2010: nil; 31 December 2010: nil).
11. Post Balance Sheet events
On 10 August 2011, Spectris plc completed the acquisition of IRM Group SA (“IRM”), a leading manufacturer of high technology measuring systems for the metals industry. IRM is based near Liège, Belgium, and employs around 60 people. The net purchase consideration is €7.5m (approximately £6.6m), on a debt and cash-free basis and will be met from existing cash and bank facilities. Contingent consideration of up to €1.5m (£1.3m) is payable to the vendors, based on the growth in orders for the 18-month period ending 31 December 2012.
IRM will become part of NDC Infrared Engineering in the In-line Instrumentation segment.
There is insufficient information available at present to be able to determine the fair value of the assets acquired. An initial valuation will be done in the second half of the year.
On 15 August 2011, Spectris plc announced that it had signed an agreement to acquire the Omega Engineering business. Spectris expects the acquisition to complete in Q4 on satisfaction of customary closing conditions including US and German antitrust clearances.
Omega Engineering provides a broad range of process measurement and control instrumentation to customers in industrial and academic markets, selling directly to end-users in these sectors via catalogue, telephone and internet. The company is headquartered in Stamford, Connecticut, USA, and has five manufacturing facilities and two distribution / sales facilities and employs around 700 people. The business will be an additional operating company in the Industrial Controls segment.
The purchase consideration of US$475m (approximately £290m), on a debt and cash free basis, will be met from cash and new bank facilities (a five-year US$550m revolving credit facility) and is subject to routine balance sheet adjustments.
There is insufficient information available at present to be able to determine the fair value of the assets acquired.
Notes to the Interim Financial Statements continued Shareholder Information
Company secretary
R J Stephens, FCIS
registered office
Spectris plcStation RoadEghamSurreyTW20 9NPEnglandTel: +44 (0)1784 470470Email: [email protected] registered in England, No. 2025003
auditors
KPMG Audit Plc
Bankers
Royal Bank of Scotland Plc
Solicitors
Macfarlanes LLP
Brokers
RBS Hoare Govett LimitedJ P Morgan Cazenove
Financial calendar
2011 interim results 23 August 2011Record date for interim dividend 21 October 2011Interim dividend payable 11 November 2011Interim management statement 11 November 20112011 full year results 17 February 2012
20778SPECTRIS.indd 38 01/09/2011 10:26:39
Spectris plc Interim Report 2011 39
20778.04 01/09/11 Proof 5
9. dividends
The interim dividend of 8.2p per share (2010 interim dividend: 7.1p) will be payable on 11 November 2011 to ordinary shareholders on the register at the close of business on 21 October 2011.
The final 2010 dividend of 20.9p per share (2009 final dividend: 17.85p) was paid on 24 June 2011 to ordinary shareholders on the register at the close of business on 3 June 2011.
10. treasury Shares
At 30 June 2011, the group held 8,794,157 treasury shares (30 June 2010: 9,195,898; 31 December 2010: 9,073,760). 279,603 of these shares were issued to satisfy options exercised by employees which were granted under the group’s share schemes (30 June 2010: 297,677; 31 December 2010: 419,815). No shares were repurchased by the group during the period (30 June 2010: nil; 31 December 2010: nil) and no shares were cancelled during the period (30 June 2010: nil; 31 December 2010: nil).
11. Post Balance Sheet events
On 10 August 2011, Spectris plc completed the acquisition of IRM Group SA (“IRM”), a leading manufacturer of high technology measuring systems for the metals industry. IRM is based near Liège, Belgium, and employs around 60 people. The net purchase consideration is €7.5m (approximately £6.6m), on a debt and cash-free basis and will be met from existing cash and bank facilities. Contingent consideration of up to €1.5m (£1.3m) is payable to the vendors, based on the growth in orders for the 18-month period ending 31 December 2012.
IRM will become part of NDC Infrared Engineering in the In-line Instrumentation segment.
There is insufficient information available at present to be able to determine the fair value of the assets acquired. An initial valuation will be done in the second half of the year.
On 15 August 2011, Spectris plc announced that it had signed an agreement to acquire the Omega Engineering business. Spectris expects the acquisition to complete in Q4 on satisfaction of customary closing conditions including US and German antitrust clearances.
Omega Engineering provides a broad range of process measurement and control instrumentation to customers in industrial and academic markets, selling directly to end-users in these sectors via catalogue, telephone and internet. The company is headquartered in Stamford, Connecticut, USA, and has five manufacturing facilities and two distribution / sales facilities and employs around 700 people. The business will be an additional operating company in the Industrial Controls segment.
The purchase consideration of US$475m (approximately £290m), on a debt and cash free basis, will be met from cash and new bank facilities (a five-year US$550m revolving credit facility) and is subject to routine balance sheet adjustments.
There is insufficient information available at present to be able to determine the fair value of the assets acquired.
Shareholder Information
Company secretary
R J Stephens, FCIS
registered office
Spectris plcStation RoadEghamSurreyTW20 9NPEnglandTel: +44 (0)1784 470470Email: [email protected] registered in England, No. 2025003
auditors
KPMG Audit Plc
Bankers
Royal Bank of Scotland Plc
Solicitors
Macfarlanes LLP
Brokers
RBS Hoare Govett LimitedJ P Morgan Cazenove
Financial Pr advisers
FD
registrars
Equiniti LimitedAspect HouseSpencer RoadLancingWest SussexBN99 6DAThe registrars provide a range of shareholderservices on-line at www.shareview.co.uk
Share price information
The company’s ordinary shares are listed onthe London Stock Exchange. The latest shareprice is available via the company’s website atwww.spectris.com
e-mail news service
To receive details of press releases and otherannouncements as they are issued, register withthe e-mail alert service on the company’s websiteat www.spectris.com
Financial calendar
2011 interim results 23 August 2011Record date for interim dividend 21 October 2011Interim dividend payable 11 November 2011Interim management statement 11 November 20112011 full year results 17 February 2012
20778SPECTRIS.indd 39 01/09/2011 10:26:39

Spectris plc Interim Report 201140
20778.04 01/09/11 Proof 520778SPECTRIS.indd 40 01/09/2011 10:26:39
20778.04 01/09/11 Proof 5
This report is printed on Revive 50 Silk, a recycled paper containing 50% recycled waste and 50% virgin fibre and manufactured at a mill certified to the ISO 14001 environmental management standard.
The pulp used in this product is bleached using an Elemental Chlorine Free Process.
© Spectris plc August 2011
PhotographyImage on page 8 courtesy of Boliden ABImage on page 10 courtesy of Mercedes-AMG
“Spectris” is a trade mark of Spectris plc and is protected by registration in the United Kingdom and other jurisdictions. Other product names referred to in this interim report are registered or unregistered trade marks or registered names of Spectris plc or its subsidiary companies and are similarly protected.
20778SPECTRIScvr.indd 4 01/09/2011 10:27:13

20778.04 01/09/11 Proof 5
Spectris plcStation RoadeghamSurreytW20 9npengland
t: +44 (0)1784 470470f: +44 (0)1784 [email protected]
20778SPECTRIScvr.indd 1 01/09/2011 10:27:13