Embed Size (px)
Citation preview
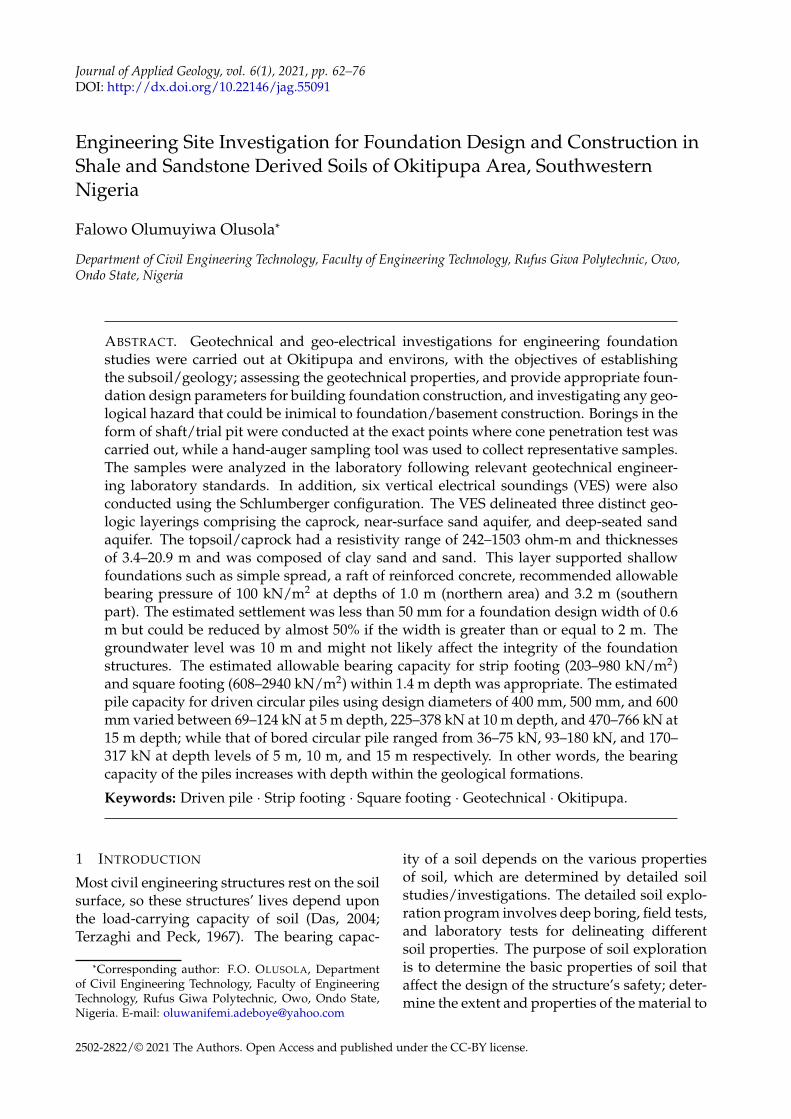
Journal of Applied Geology, vol. 6(1), 2021, pp. 62–76DOI: http://dx.doi.org/10.22146/jag.55091
Engineering Site Investigation for Foundation Design and Construction inShale and Sandstone Derived Soils of Okitipupa Area, SouthwesternNigeria
Falowo Olumuyiwa Olusola*
Department of Civil Engineering Technology, Faculty of Engineering Technology, Rufus Giwa Polytechnic, Owo,Ondo State, Nigeria
ABSTRACT. Geotechnical and geo-electrical investigations for engineering foundationstudies were carried out at Okitipupa and environs, with the objectives of establishingthe subsoil/geology; assessing the geotechnical properties, and provide appropriate foun-dation design parameters for building foundation construction, and investigating any geo-logical hazard that could be inimical to foundation/basement construction. Borings in theform of shaft/trial pit were conducted at the exact points where cone penetration test wascarried out, while a hand-auger sampling tool was used to collect representative samples.The samples were analyzed in the laboratory following relevant geotechnical engineer-ing laboratory standards. In addition, six vertical electrical soundings (VES) were alsoconducted using the Schlumberger configuration. The VES delineated three distinct geo-logic layerings comprising the caprock, near-surface sand aquifer, and deep-seated sandaquifer. The topsoil/caprock had a resistivity range of 242–1503 ohm-m and thicknessesof 3.4–20.9 m and was composed of clay sand and sand. This layer supported shallowfoundations such as simple spread, a raft of reinforced concrete, recommended allowablebearing pressure of 100 kN/m2 at depths of 1.0 m (northern area) and 3.2 m (southernpart). The estimated settlement was less than 50 mm for a foundation design width of 0.6m but could be reduced by almost 50% if the width is greater than or equal to 2 m. Thegroundwater level was 10 m and might not likely affect the integrity of the foundationstructures. The estimated allowable bearing capacity for strip footing (203–980 kN/m2)and square footing (608–2940 kN/m2) within 1.4 m depth was appropriate. The estimatedpile capacity for driven circular piles using design diameters of 400 mm, 500 mm, and 600mm varied between 69–124 kN at 5 m depth, 225–378 kN at 10 m depth, and 470–766 kN at15 m depth; while that of bored circular pile ranged from 36–75 kN, 93–180 kN, and 170–317 kN at depth levels of 5 m, 10 m, and 15 m respectively. In other words, the bearingcapacity of the piles increases with depth within the geological formations.
Keywords: Driven pile · Strip footing · Square footing · Geotechnical · Okitipupa.
1 INTRODUCTION
Most civil engineering structures rest on the soilsurface, so these structures’ lives depend uponthe load-carrying capacity of soil (Das, 2004;Terzaghi and Peck, 1967). The bearing capac-
*Corresponding author: F.O. OLUSOLA, Departmentof Civil Engineering Technology, Faculty of EngineeringTechnology, Rufus Giwa Polytechnic, Owo, Ondo State,Nigeria. E-mail: [email protected]
ity of a soil depends on the various propertiesof soil, which are determined by detailed soilstudies/investigations. The detailed soil explo-ration program involves deep boring, field tests,and laboratory tests for delineating differentsoil properties. The purpose of soil explorationis to determine the basic properties of soil thataffect the design of the structure’s safety; deter-mine the extent and properties of the material to
2502-2822/© 2021 The Authors. Open Access and published under the CC-BY license.
ENGINEERING SITE INVESTIGATION FOR FOUNDATION DESIGN AND CONSTRUCTION
be used for construction; to determine ground-water condition; to analyze the causes of failureof existing works (Murthy, 2002). Such investi-gations are used to decide the appropriate typeof foundation and the soil suitability for con-struction. Sand and gravel are excellent foun-dation materials, unlike peat, plastic silt, andorganic soil, associated with high compressibil-ity. A foundation is required to transmit theload of the structure on a large area of soil. Thestructure’s foundation should be designed sothat the soil below does not fail in shear norundergo excessive settlement (Bell, 2007; Tom-linson, 1999). The conventional foundation de-sign method is based on the concept/theory ofbearing capacity, which is also influenced by thefoundation’s width, shape, and depth. Henceimportant soil parameters or characteristics likeshear strength, density, permeability must bestudied holistically.
Consequently, engineering subsoil investi-gation was carried out in Okitipupa and en-vironed in Southwestern Nigeria to providegeotechnical or geoelectrical parameters data.It would help select a proper type of foundationthat would be cost-effective/economical; andrecommended appropriate foundation designoptions, using conventional geophysical andgeotechnical investigations. This would fur-ther assist the government in its infrastructuraldevelopment strive in the State. Hence in-situcone penetration testing combined with geo-physical methods were employed to achievethe aim of this study. Geophysical techniquesthat can be used to determine bedrock depthinclude gravity, magnetic, resistivity, groundradar, seismic refraction, seismic reflection (Os-inowo and Falufosi, 2018; Osinowo et al., 2011;Coker, 2015). It has also been shown that geo-physical surveys are efficient and cost-effectivein providing the required geotechnical infor-mation (Badmus et al., 2012; Coker et al., 2013;Ibitoye et al., 2013). The application of electricalresistivity has provided qualitative data in thehydrogeological investigation, natural hazardsstudies, environmental engineering site inves-tigation, groundwater pollution studies, andsubsurface mapping. Akintorinwa and Olu-wole (2018), Adigun et al. (2014) have employedresistivity methods in mapping the distributionof electrical properties for hydrogeological and
dam-site investigation. Their study demon-strated the ability of geophysical investigationto measure both subsurface physical parame-ters such as ground resistivity and determinethe spatial variation of the measured parame-ter along with the three orthogonal directions.The geoelectrical generated sections, maps, and3-D models of the subsurface provided relevantinformation that could guide point selectionfor geotechnical investigations and structuralconstruction.
The CPT is a method of determining thein-situ mechanical properties of soils (Coerts,1996). The test method has gained extensivepreference over the years because of its rapidprocedure, relatively cheap operational cost,and continuous reproducible results (Lunne etal., 1997; Nottingham, 1975; Mazlan, 2007). Fol-lowing the standardization of the test processand improvement in data interpretation meth-ods, its reliability is excellent. In most CPT mea-surements, the mobilized cone tip resistance isrepresentative of the formation conditions. Asemi-empirical method of interpretation of suchdata is available in many academic journals.The method was developed from a theoreticalconcept. The angle of internal friction, cohesion,and ultimate bearing capacity of soils can bedirectly obtained from observed tip resistance.The results of the interpretations are in goodagreement with field conditions. The methodis particularly suitable in cases where the accu-racy of the measured skin friction is in doubt.CPT soundings can be very effective in site char-acterization, especially sites with discrete strati-graphic horizons or discontinuous lenses (Ma-zlan, 2007).
Consequently, the combination of geophys-ical and geotechnical methods in foundationinvestigation has shown to be invaluable indeciphering the depth to bedrock, characteriz-ing the earth materials, and extent of variationof allowable bearing pressure of foundationsoils (Ngah and Nwankwoala, 2013; Oyedeleet al., 2011; Nwankwoala and Warmate, 2014).Geotechnical sampling along carefully selectedpoints or varying geo-resistivity zones wouldprovide relevant information for subsurfaceheterogeneity. Thus guide in the design analy-sis of appropriate foundation that will supportevery part of the building amidst possible varia-
Journal of Applied Geology 63
OLUSOLA
tion in rock strength (Nwankwoala and Amadi,2013; Owamah et al., 2018; Sudha et al., 2009).
2 DESCRIPTION OF STUDY AREA
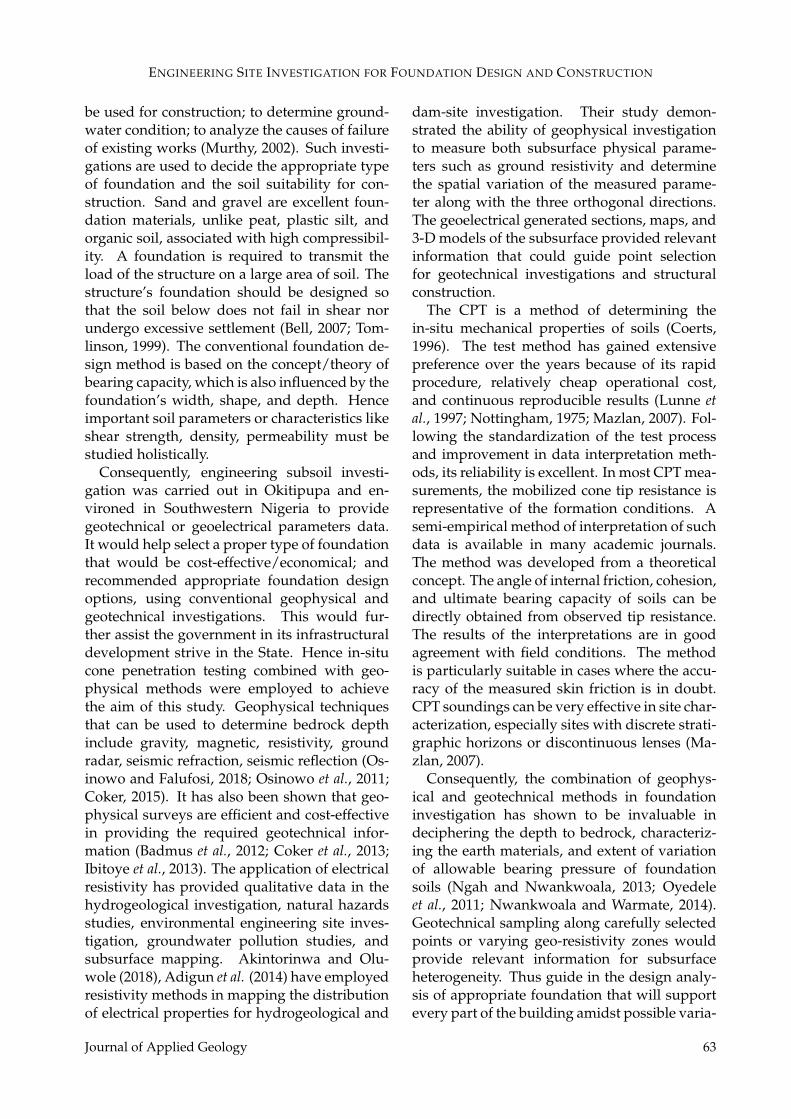
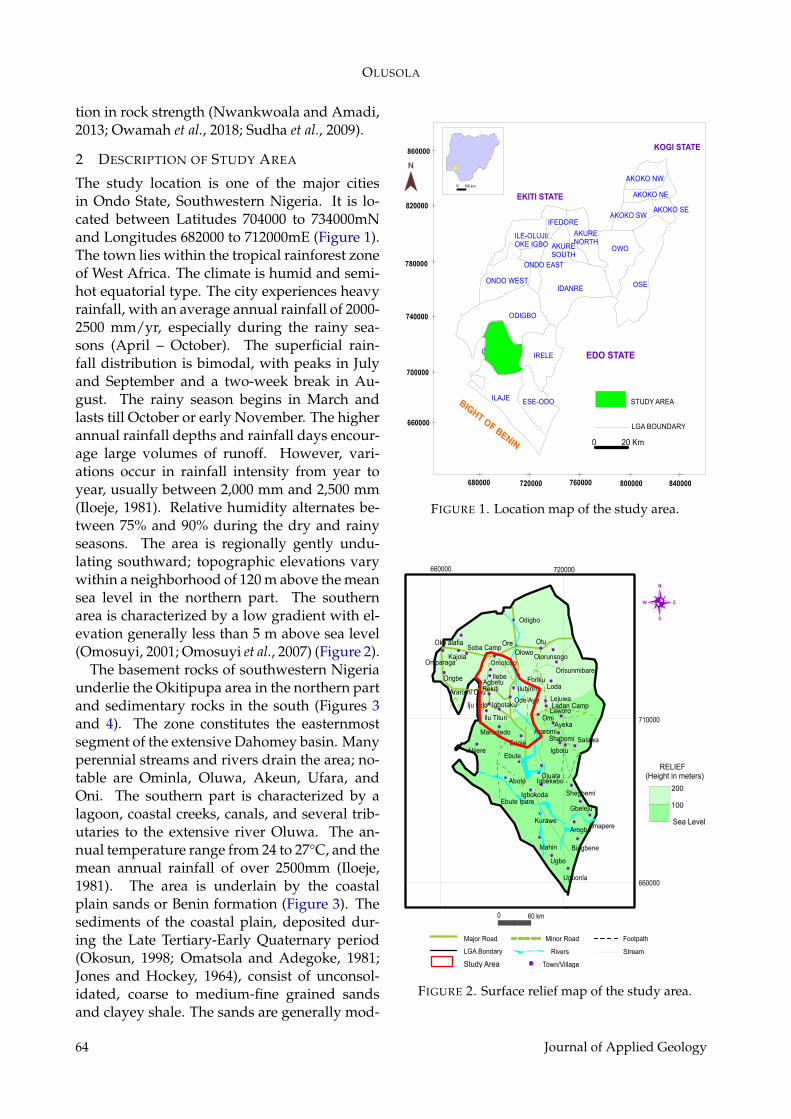
The study location is one of the major citiesin Ondo State, Southwestern Nigeria. It is lo-cated between Latitudes 704000 to 734000mNand Longitudes 682000 to 712000mE (Figure 1).The town lies within the tropical rainforest zoneof West Africa. The climate is humid and semi-hot equatorial type. The city experiences heavyrainfall, with an average annual rainfall of 2000-2500 mm/yr, especially during the rainy sea-sons (April – October). The superficial rain-fall distribution is bimodal, with peaks in Julyand September and a two-week break in Au-gust. The rainy season begins in March andlasts till October or early November. The higherannual rainfall depths and rainfall days encour-age large volumes of runoff. However, vari-ations occur in rainfall intensity from year toyear, usually between 2,000 mm and 2,500 mm(Iloeje, 1981). Relative humidity alternates be-tween 75% and 90% during the dry and rainyseasons. The area is regionally gently undu-lating southward; topographic elevations varywithin a neighborhood of 120 m above the meansea level in the northern part. The southernarea is characterized by a low gradient with el-evation generally less than 5 m above sea level(Omosuyi, 2001; Omosuyi et al., 2007) (Figure 2).
The basement rocks of southwestern Nigeriaunderlie the Okitipupa area in the northern partand sedimentary rocks in the south (Figures 3and 4). The zone constitutes the easternmostsegment of the extensive Dahomey basin. Manyperennial streams and rivers drain the area; no-table are Ominla, Oluwa, Akeun, Ufara, andOni. The southern part is characterized by alagoon, coastal creeks, canals, and several trib-utaries to the extensive river Oluwa. The an-nual temperature range from 24 to 27°C, and themean annual rainfall of over 2500mm (Iloeje,1981). The area is underlain by the coastalplain sands or Benin formation (Figure 3). Thesediments of the coastal plain, deposited dur-ing the Late Tertiary-Early Quaternary period(Okosun, 1998; Omatsola and Adegoke, 1981;Jones and Hockey, 1964), consist of unconsol-idated, coarse to medium-fine grained sandsand clayey shale. The sands are generally mod-
IRELE
ODIGBO
OKITIPUPA
IDANRE
ILE-OLUJI/OKE IGBO
OSEONDO WEST
AKURENORTH
IFEDORE
AKURESOUTH
OWO
AKOKO SE
AKOKO NW
EDO STATE
KOGI STATE
EKITI STATE
780000
860000
STUDY AREA
LGA BOUNDARY
100 km
ESE-ODOILAJE
0 20 Km
Figure 1: Location map of the study areaFIGURE 1. Location map of the study area.
Major Road Minor Road Footpath
LGA Bondary Rivers Stream
Sea Level
RELIEF(Height in meters)
Ore
OniparagaKajola
Soba Camp
Omotoso
Mahintedo
Ilebe
Igbokoda
Aboto
AtijereErinje
Ebute Ipare
Kurawe
Odigbo
Olorunsogo
OrisunmibareForiku
Ayeka
Salawa
Igbotaku
RekitiAgbetu
Ode Aye
Ilu TitunLaworo
Loda
LejuwaLadan Camp
Olowo
Araromi
Igbotu
IgbekeboOjuala
Shegbemi
Gbeleju
Biagbene
ArogboAmapere
Mahin
Ugbo
Ugbonla
Ebute
Ilubirin
Town/VillageStudy Area
Figure 2: Surface relief map of the study areaFIGURE 2. Surface relief map of the study area.
64 Journal of Applied Geology
ENGINEERING SITE INVESTIGATION FOR FOUNDATION DESIGN AND CONSTRUCTION
Ilubirin
Major Road
Minor Road
Footpath
LGA Bondary
Rivers
Stream
Charnockitic Rock
Fine Grained Biotite Granite
Undifferentiated Older Granite, Mainly Granitised Gneiss
Coastal Alluvium
Coastal Plain Sand (Benin Formation)
Ogwashi-Asaba Formation (Akinbo/Oshosun Formation ?)
Amaki Formation (Ewekoro and Akinbo Formations ?)
Ajali Sandstone Formation (Abeokuta Group ?)
Migmatite-Gneiss Complex
RekitiAgbetu
Ode Aye
Ilu TitunLaworo
Loda
LejuwaLadan Camp
Olowo
Araromi
Igbotu
IgbekeboOjuala
Shegbemi
Gbeleju
Biagbene
ArogboAmapere
Mahin
Ugbo
Ugbonla
Ebute
Igbokoda
Aboto
AtijereErinje
Ebute Ipare
Kurawe
Odigbo
Olorunsogo
OrisunmibareForiku
Ayeka
Salawa
Igbotaku
Ore
OniparagaKajola
Soba Camp
Omotoso
Mahintedo
Ilebe
Town & Village
Study Area
Figure 3: Geological Map of the Study Area
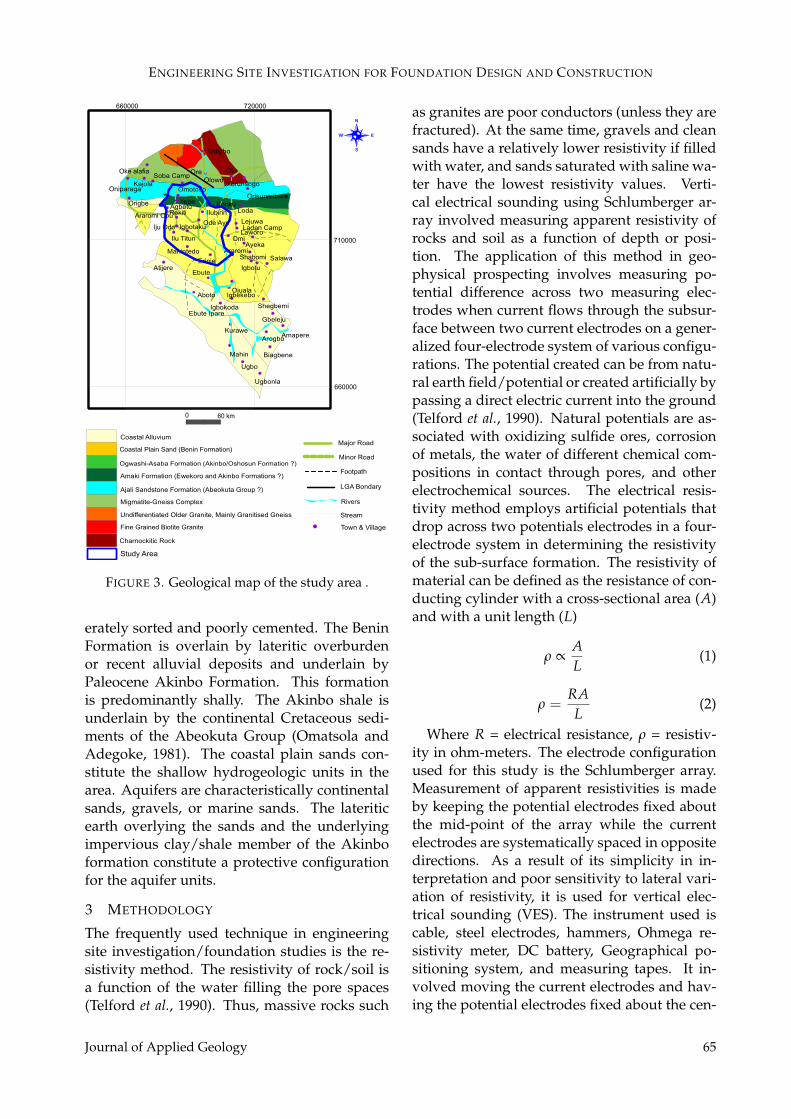
FIGURE 3. Geological map of the study area .
erately sorted and poorly cemented. The BeninFormation is overlain by lateritic overburdenor recent alluvial deposits and underlain byPaleocene Akinbo Formation. This formationis predominantly shally. The Akinbo shale isunderlain by the continental Cretaceous sedi-ments of the Abeokuta Group (Omatsola andAdegoke, 1981). The coastal plain sands con-stitute the shallow hydrogeologic units in thearea. Aquifers are characteristically continentalsands, gravels, or marine sands. The lateriticearth overlying the sands and the underlyingimpervious clay/shale member of the Akinboformation constitute a protective configurationfor the aquifer units.
3 METHODOLOGY
The frequently used technique in engineeringsite investigation/foundation studies is the re-sistivity method. The resistivity of rock/soil isa function of the water filling the pore spaces(Telford et al., 1990). Thus, massive rocks such
as granites are poor conductors (unless they arefractured). At the same time, gravels and cleansands have a relatively lower resistivity if filledwith water, and sands saturated with saline wa-ter have the lowest resistivity values. Verti-cal electrical sounding using Schlumberger ar-ray involved measuring apparent resistivity ofrocks and soil as a function of depth or posi-tion. The application of this method in geo-physical prospecting involves measuring po-tential difference across two measuring elec-trodes when current flows through the subsur-face between two current electrodes on a gener-alized four-electrode system of various configu-rations. The potential created can be from natu-ral earth field/potential or created artificially bypassing a direct electric current into the ground(Telford et al., 1990). Natural potentials are as-sociated with oxidizing sulfide ores, corrosionof metals, the water of different chemical com-positions in contact through pores, and otherelectrochemical sources. The electrical resis-tivity method employs artificial potentials thatdrop across two potentials electrodes in a four-electrode system in determining the resistivityof the sub-surface formation. The resistivity ofmaterial can be defined as the resistance of con-ducting cylinder with a cross-sectional area (A)and with a unit length (L)
ρ ∝AL
(1)
ρ =RAL
(2)
Where R = electrical resistance, ρ = resistiv-ity in ohm-meters. The electrode configurationused for this study is the Schlumberger array.Measurement of apparent resistivities is madeby keeping the potential electrodes fixed aboutthe mid-point of the array while the currentelectrodes are systematically spaced in oppositedirections. As a result of its simplicity in in-terpretation and poor sensitivity to lateral vari-ation of resistivity, it is used for vertical elec-trical sounding (VES). The instrument used iscable, steel electrodes, hammers, Ohmega re-sistivity meter, DC battery, Geographical po-sitioning system, and measuring tapes. It in-volved moving the current electrodes and hav-ing the potential electrodes fixed about the cen-
Journal of Applied Geology 65
OLUSOLA
(a) (b)
Figure 4: Field pictures of (a) migmatite gneiss and granitic rocks mapped in Ode Aye located at
the northern part of the study area (b) soft shaly soil and mud-stone observed along Okitipupa -
Igbokoda highway at the southern part of the study area
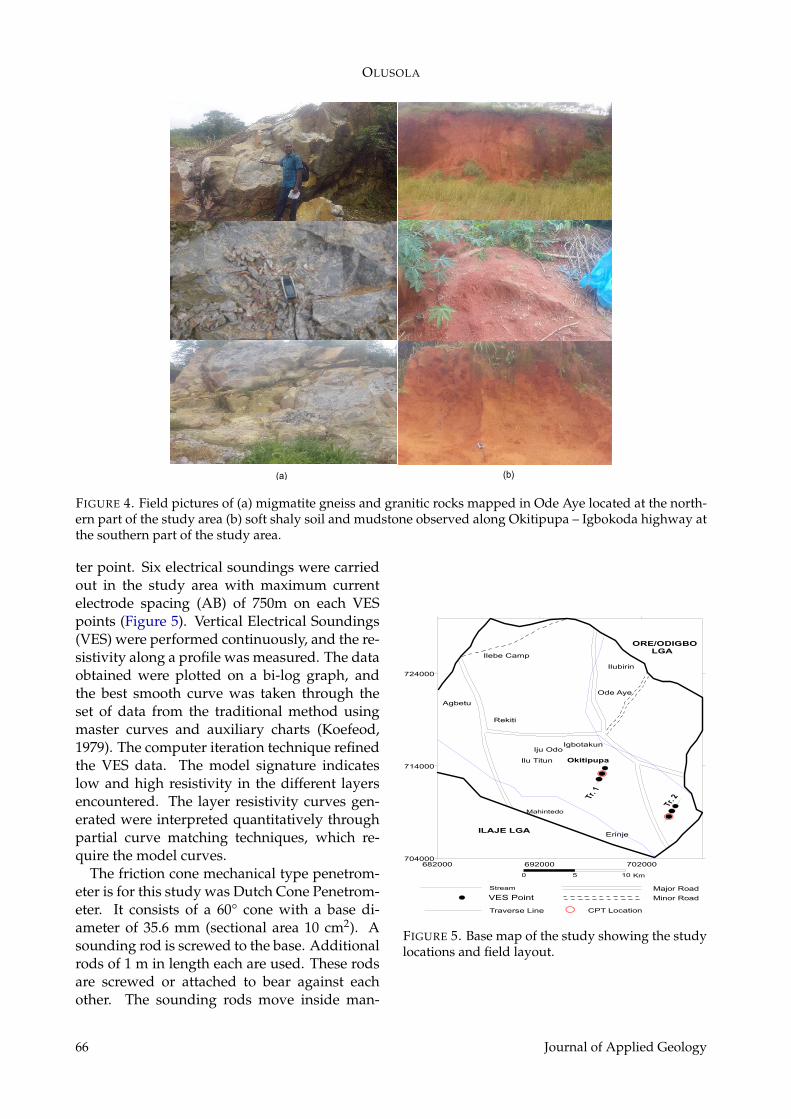
FIGURE 4. Field pictures of (a) migmatite gneiss and granitic rocks mapped in Ode Aye located at the north-ern part of the study area (b) soft shaly soil and mudstone observed along Okitipupa – Igbokoda highway atthe southern part of the study area.
ter point. Six electrical soundings were carriedout in the study area with maximum currentelectrode spacing (AB) of 750m on each VESpoints (Figure 5). Vertical Electrical Soundings(VES) were performed continuously, and the re-sistivity along a profile was measured. The dataobtained were plotted on a bi-log graph, andthe best smooth curve was taken through theset of data from the traditional method usingmaster curves and auxiliary charts (Koefeod,1979). The computer iteration technique refinedthe VES data. The model signature indicateslow and high resistivity in the different layersencountered. The layer resistivity curves gen-erated were interpreted quantitatively throughpartial curve matching techniques, which re-quire the model curves.
The friction cone mechanical type penetrom-eter is for this study was Dutch Cone Penetrom-eter. It consists of a 60° cone with a base di-ameter of 35.6 mm (sectional area 10 cm2). Asounding rod is screwed to the base. Additionalrods of 1 m in length each are used. These rodsare screwed or attached to bear against eachother. The sounding rods move inside man-
682000 692000 702000704000
714000
724000
ORE/ODIGBO LGA
ILAJE LGAErinje
Mahintedo
Ilu Titun
Iju OdoIgbotakun
Ode Aye
Ilubirin
Okitipupa
Ilebe Camp
Agbetu
Rekiti
0 5 10 Km
Stream Major Road
Minor Road
Traverse Line CPT Location
Figure 5: Base Map of the study showing the study locations and Field LayoutFIGURE 5. Base map of the study showing the studylocations and field layout.
66 Journal of Applied Geology
ENGINEERING SITE INVESTIGATION FOR FOUNDATION DESIGN AND CONSTRUCTION
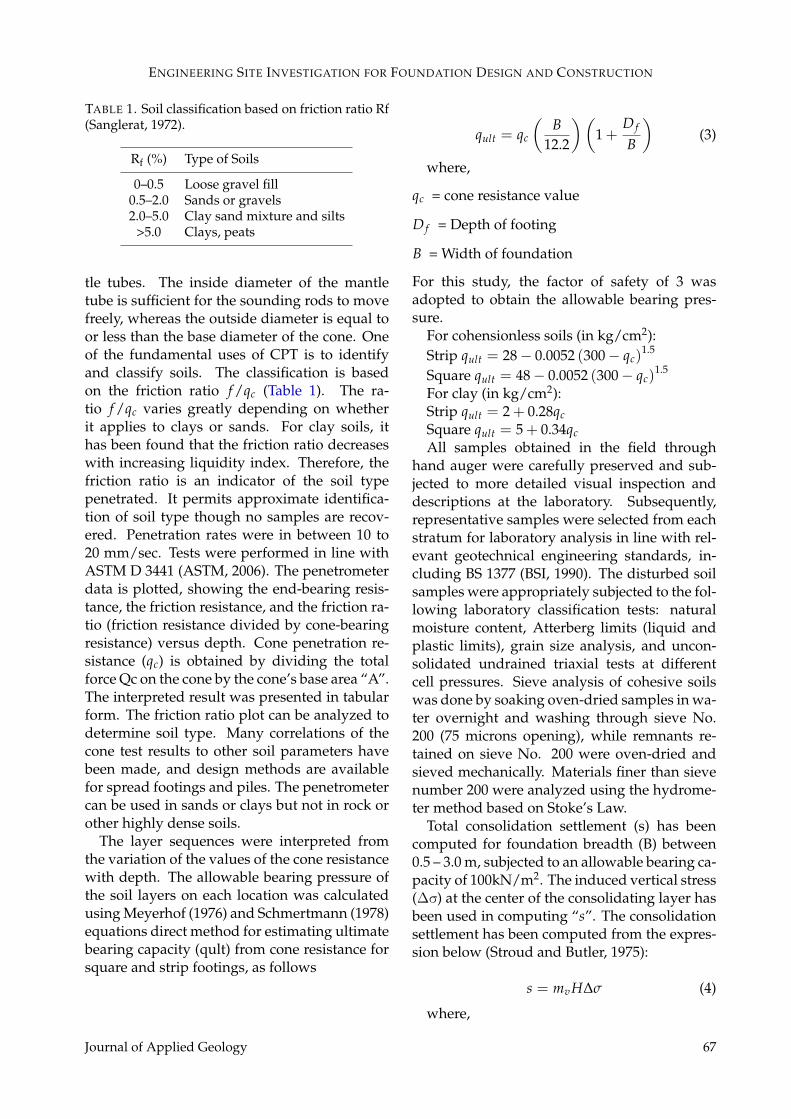
TABLE 1. Soil classification based on friction ratio Rf(Sanglerat, 1972).
Rf (%) Type of Soils
0–0.5 Loose gravel fill0.5–2.0 Sands or gravels2.0–5.0 Clay sand mixture and silts
>5.0 Clays, peats
tle tubes. The inside diameter of the mantletube is sufficient for the sounding rods to movefreely, whereas the outside diameter is equal toor less than the base diameter of the cone. Oneof the fundamental uses of CPT is to identifyand classify soils. The classification is basedon the friction ratio f /qc (Table 1). The ra-tio f /qc varies greatly depending on whetherit applies to clays or sands. For clay soils, ithas been found that the friction ratio decreaseswith increasing liquidity index. Therefore, thefriction ratio is an indicator of the soil typepenetrated. It permits approximate identifica-tion of soil type though no samples are recov-ered. Penetration rates were in between 10 to20 mm/sec. Tests were performed in line withASTM D 3441 (ASTM, 2006). The penetrometerdata is plotted, showing the end-bearing resis-tance, the friction resistance, and the friction ra-tio (friction resistance divided by cone-bearingresistance) versus depth. Cone penetration re-sistance (qc) is obtained by dividing the totalforce Qc on the cone by the cone’s base area “A”.The interpreted result was presented in tabularform. The friction ratio plot can be analyzed todetermine soil type. Many correlations of thecone test results to other soil parameters havebeen made, and design methods are availablefor spread footings and piles. The penetrometercan be used in sands or clays but not in rock orother highly dense soils.
The layer sequences were interpreted fromthe variation of the values of the cone resistancewith depth. The allowable bearing pressure ofthe soil layers on each location was calculatedusing Meyerhof (1976) and Schmertmann (1978)equations direct method for estimating ultimatebearing capacity (qult) from cone resistance forsquare and strip footings, as follows
qult = qc
(B
12.2
)(1 +
D f
B
)(3)
where,
qc = cone resistance value
D f = Depth of footing
B = Width of foundation
For this study, the factor of safety of 3 wasadopted to obtain the allowable bearing pres-sure.
For cohensionless soils (in kg/cm2):Strip qult = 28− 0.0052 (300− qc)
1.5
Square qult = 48− 0.0052 (300− qc)1.5
For clay (in kg/cm2):Strip qult = 2 + 0.28qcSquare qult = 5 + 0.34qcAll samples obtained in the field through
hand auger were carefully preserved and sub-jected to more detailed visual inspection anddescriptions at the laboratory. Subsequently,representative samples were selected from eachstratum for laboratory analysis in line with rel-evant geotechnical engineering standards, in-cluding BS 1377 (BSI, 1990). The disturbed soilsamples were appropriately subjected to the fol-lowing laboratory classification tests: naturalmoisture content, Atterberg limits (liquid andplastic limits), grain size analysis, and uncon-solidated undrained triaxial tests at differentcell pressures. Sieve analysis of cohesive soilswas done by soaking oven-dried samples in wa-ter overnight and washing through sieve No.200 (75 microns opening), while remnants re-tained on sieve No. 200 were oven-dried andsieved mechanically. Materials finer than sievenumber 200 were analyzed using the hydrome-ter method based on Stoke’s Law.
Total consolidation settlement (s) has beencomputed for foundation breadth (B) between0.5 – 3.0 m, subjected to an allowable bearing ca-pacity of 100kN/m2. The induced vertical stress(Δσv) at the center of the consolidating layer hasbeen used in computing “s”. The consolidationsettlement has been computed from the expres-sion below (Stroud and Butler, 1975):
s = mvH∆σ (4)
where,
Journal of Applied Geology 67
OLUSOLA
mv = coefficient of volume compressibility
H = thickness of the compressible layer
∆σ = average increase inadequate pressure
An mv value of 0.125m2/KN, which corre-sponds to the adopted net allowable bearingpressure, was used in the settlement analysisand corresponded to stiff clay in the range of(0.25 – 0.125m2/KN). The settlement analysisof the granular soil is determined using theSchmertmann equation (Schmertmann, 1970);
δ = C1C2C3q′∑Ie∆zEs
(5)
where;
C1 = depth factor
C2 = secondary creep factor
C3 = shape factor
q′ = net bearing pressure
Ie = strain influence factor
∆z = thickness of soil layer (at midpoint of soillayer)
Es = equivalent modulus of elasticity
Empirical correction for depth of embedment,secondary creep, and footing shape:
C1 = 1− 0.5[
σ′zDq′
](6)
C2 = 1 + 0.2 log(
t0.1
)(7)
C3 = 1.03− 0.03LB≥ 0.73 (8)
In order to use the Schmertmann (1970)method, it is necessary to estimate the stiffnessof the soil in terms of the equivalent Young’smodulus at various depths. In the case of nor-mally loaded cohesionless materials (not pre-stressed significantly to pressures above thepresent in in-situ overburden pressure, the CPTbearing capacity qc has been correlated withYoung’s modulus (Es) by DeBeer (1963) andWebb (1969). The relationship suggested bySchmertmann (1970) is
Es = 2qc (9)
where qc = CPT bearing capacityUsing Meyerhof equation (Meyerhof, 1976),
the allowable and ultimate bearing capacitywas calculated using this equation:
qa = 2.7qc
(KNm2
)(10)
qa =qc
40(kg/cm2) (11)
For this study, the CFEM equation (CFEM,1992) was used for modulus of elasticity de-termination. A modified version of the Terza-ghi bearing capacity equation is widely usedfor pile design. The third term, or the den-sity term, in the Terzaghi bearing capacity equa-tion, is negligible in piles and hence usuallyignored (CFEM, 1992; de Ruiter and Beringen,1979; Bustamante and Gianeselli, 1982). The lat-eral earth pressure coefficient, K, is introducedto compute the skin friction of piles.
Pultimate =(σ′t × Nq × A
)+(K + σ′v × tan δ× Ap
)(12)
where,
Pultimate = ultimate pile capacity
σ′t = effective stress at the tip of the pile
Nq = bearing factor cross-sectional area coeffi-cient
A = of the pile at the tip
K = lateral earth pressure coefficient
σ′v = effective stress at the perimeter of the pile
tan δ = friction angle between pile and soil
Ap = perimeter area of the pile
For round piles, Ap = πdLwhere,
d = diameter
L = length of the pile
The API method (American Petroleum Insti-tute) (API, 1984) uses the following equation forend-bearing capacity, adopted for this study.
where,
68 Journal of Applied Geology
ENGINEERING SITE INVESTIGATION FOR FOUNDATION DESIGN AND CONSTRUCTION
q = Nq × σ′t × A
q is end bearing capacity of the pile
σ′t is effective stress at the pile tip
A is the cross-sectional area of the (circular) pileat the tip = π × D2
4 ; D is the pile diameter.The maximum effective stress used in the
computation is within the 240 kPa recom-mended (Meyerhof, 1976). The value of Nqdepends on the soil:
Nq = 8 to 12 for loose sand
Nq = 12 to 40 for medium dense sand
Nq = 40 for dense sand
Meyerhof (1976) suggested the following equa-tion for driven/bored piles:
s = β× σ′v × Ap (13)
where
s = skin friction of the pile
σ′v = effective stress at the midpoint of the pile
Ap = perimeter surface area of the pile
For driven piles β = 0.44 for Ø = 28°; β = 0.75 forØ = 35°; β = 1.2 for Ø = 37°. For bored piles β= 0.10 for Ø = 33°; β = 0.20 for Ø = 35°; β = 0.35for Ø = 37°.
4 RESULTS AND DISCUSSION
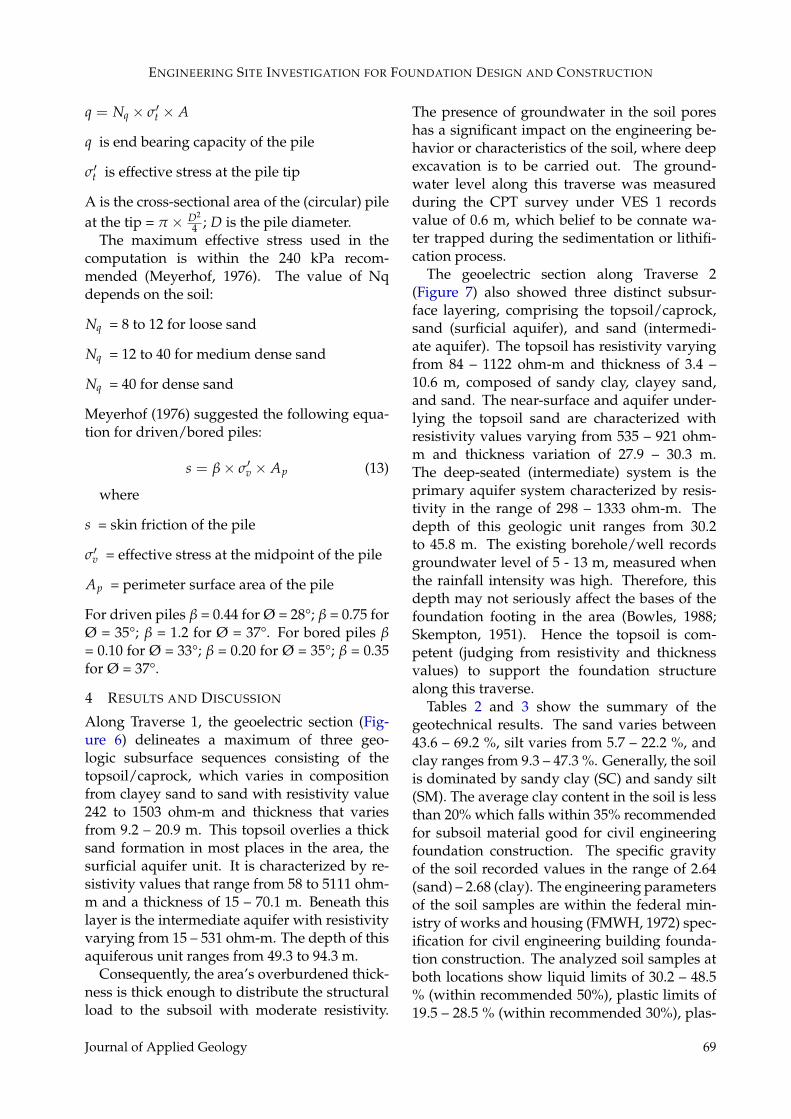
Along Traverse 1, the geoelectric section (Fig-ure 6) delineates a maximum of three geo-logic subsurface sequences consisting of thetopsoil/caprock, which varies in compositionfrom clayey sand to sand with resistivity value242 to 1503 ohm-m and thickness that variesfrom 9.2 – 20.9 m. This topsoil overlies a thicksand formation in most places in the area, thesurficial aquifer unit. It is characterized by re-sistivity values that range from 58 to 5111 ohm-m and a thickness of 15 – 70.1 m. Beneath thislayer is the intermediate aquifer with resistivityvarying from 15 – 531 ohm-m. The depth of thisaquiferous unit ranges from 49.3 to 94.3 m.
Consequently, the area’s overburdened thick-ness is thick enough to distribute the structuralload to the subsoil with moderate resistivity.
The presence of groundwater in the soil poreshas a significant impact on the engineering be-havior or characteristics of the soil, where deepexcavation is to be carried out. The ground-water level along this traverse was measuredduring the CPT survey under VES 1 recordsvalue of 0.6 m, which belief to be connate wa-ter trapped during the sedimentation or lithifi-cation process.
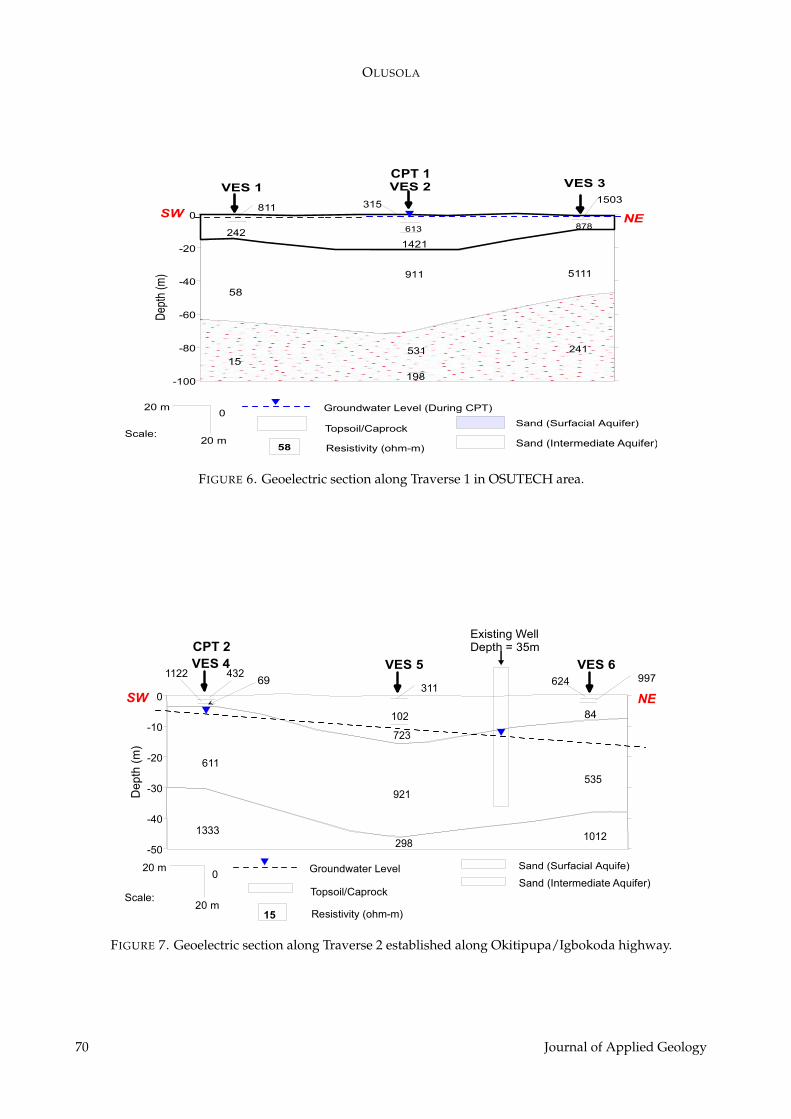
The geoelectric section along Traverse 2(Figure 7) also showed three distinct subsur-face layering, comprising the topsoil/caprock,sand (surficial aquifer), and sand (intermedi-ate aquifer). The topsoil has resistivity varyingfrom 84 – 1122 ohm-m and thickness of 3.4 –10.6 m, composed of sandy clay, clayey sand,and sand. The near-surface and aquifer under-lying the topsoil sand are characterized withresistivity values varying from 535 – 921 ohm-m and thickness variation of 27.9 – 30.3 m.The deep-seated (intermediate) system is theprimary aquifer system characterized by resis-tivity in the range of 298 – 1333 ohm-m. Thedepth of this geologic unit ranges from 30.2to 45.8 m. The existing borehole/well recordsgroundwater level of 5 - 13 m, measured whenthe rainfall intensity was high. Therefore, thisdepth may not seriously affect the bases of thefoundation footing in the area (Bowles, 1988;Skempton, 1951). Hence the topsoil is com-petent (judging from resistivity and thicknessvalues) to support the foundation structurealong this traverse.
Tables 2 and 3 show the summary of thegeotechnical results. The sand varies between43.6 – 69.2 %, silt varies from 5.7 – 22.2 %, andclay ranges from 9.3 – 47.3 %. Generally, the soilis dominated by sandy clay (SC) and sandy silt(SM). The average clay content in the soil is lessthan 20% which falls within 35% recommendedfor subsoil material good for civil engineeringfoundation construction. The specific gravityof the soil recorded values in the range of 2.64(sand) – 2.68 (clay). The engineering parametersof the soil samples are within the federal min-istry of works and housing (FMWH, 1972) spec-ification for civil engineering building founda-tion construction. The analyzed soil samples atboth locations show liquid limits of 30.2 – 48.5% (within recommended 50%), plastic limits of19.5 – 28.5 % (within recommended 30%), plas-
Journal of Applied Geology 69
OLUSOLA
-100
-80
-60
-40
-20
0
Dep
th (m
)
811
58
15
613
1421
1503
878
5111
VES 1 VES 2 VES 3
Groundwater Level (During CPT)
Topsoil/Caprock
Sand (Intermediate Aquifer)
020 m
20 mScale:
Resistivity (ohm-m)
SW NE
Figure 6: Geoelectric section along Traverse 1 in OSUTECH areaFIGURE 6. Geoelectric section along Traverse 1 in OSUTECH area.
-50
-40
-30
-20
-10
0
Dep
th (
m)
VES 4 VES 5 VES 669
1122
611
1333
311624 997
84
1012
Existing WellDepth = 35m
Groundwater Level
Topsoil/CaprockSand (Intermediate Aquifer)
020 m
20 mScale:
15 Resistivity (ohm-m)
CPT 2
SW NE
Figure 7: Geoelectric section along Traverse 2 established along Okitipupa/Igbokoda highwayFIGURE 7. Geoelectric section along Traverse 2 established along Okitipupa/Igbokoda highway.
70 Journal of Applied Geology
ENGINEERING SITE INVESTIGATION FOR FOUNDATION DESIGN AND CONSTRUCTION
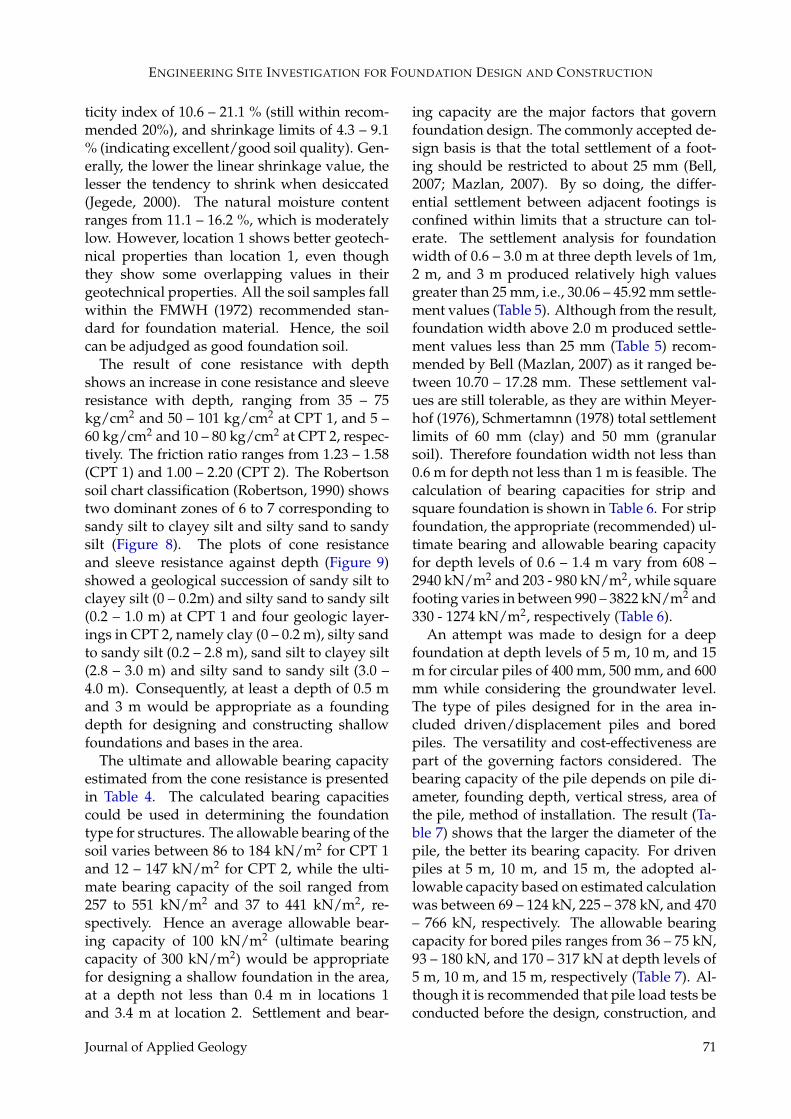
ticity index of 10.6 – 21.1 % (still within recom-mended 20%), and shrinkage limits of 4.3 – 9.1% (indicating excellent/good soil quality). Gen-erally, the lower the linear shrinkage value, thelesser the tendency to shrink when desiccated(Jegede, 2000). The natural moisture contentranges from 11.1 – 16.2 %, which is moderatelylow. However, location 1 shows better geotech-nical properties than location 1, even thoughthey show some overlapping values in theirgeotechnical properties. All the soil samples fallwithin the FMWH (1972) recommended stan-dard for foundation material. Hence, the soilcan be adjudged as good foundation soil.
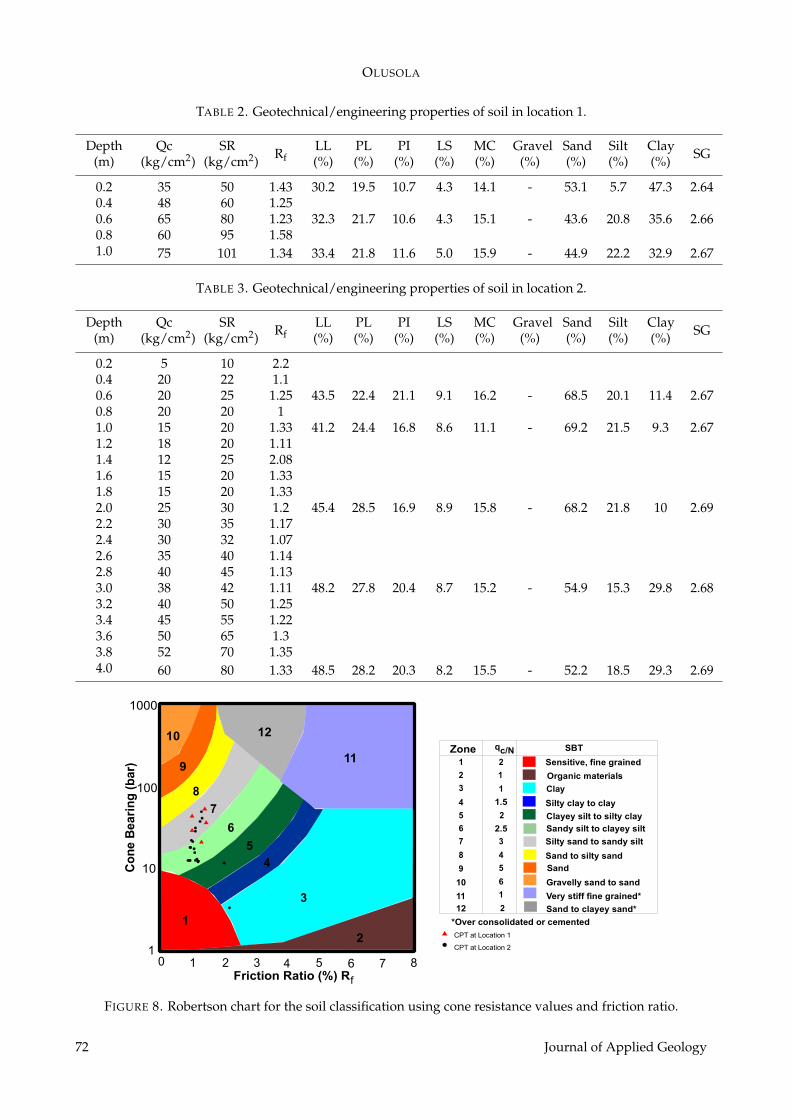
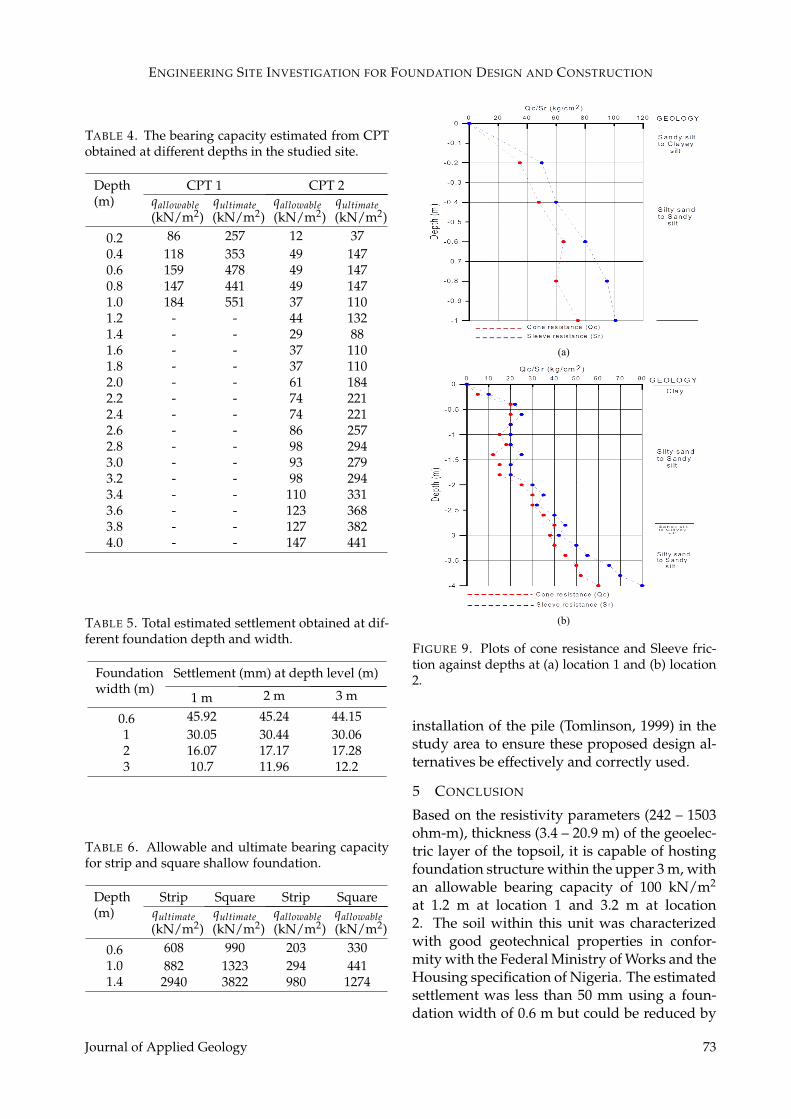
The result of cone resistance with depthshows an increase in cone resistance and sleeveresistance with depth, ranging from 35 – 75kg/cm2 and 50 – 101 kg/cm2 at CPT 1, and 5 –60 kg/cm2 and 10 – 80 kg/cm2 at CPT 2, respec-tively. The friction ratio ranges from 1.23 – 1.58(CPT 1) and 1.00 – 2.20 (CPT 2). The Robertsonsoil chart classification (Robertson, 1990) showstwo dominant zones of 6 to 7 corresponding tosandy silt to clayey silt and silty sand to sandysilt (Figure 8). The plots of cone resistanceand sleeve resistance against depth (Figure 9)showed a geological succession of sandy silt toclayey silt (0 – 0.2m) and silty sand to sandy silt(0.2 – 1.0 m) at CPT 1 and four geologic layer-ings in CPT 2, namely clay (0 – 0.2 m), silty sandto sandy silt (0.2 – 2.8 m), sand silt to clayey silt(2.8 – 3.0 m) and silty sand to sandy silt (3.0 –4.0 m). Consequently, at least a depth of 0.5 mand 3 m would be appropriate as a foundingdepth for designing and constructing shallowfoundations and bases in the area.
The ultimate and allowable bearing capacityestimated from the cone resistance is presentedin Table 4. The calculated bearing capacitiescould be used in determining the foundationtype for structures. The allowable bearing of thesoil varies between 86 to 184 kN/m2 for CPT 1and 12 – 147 kN/m2 for CPT 2, while the ulti-mate bearing capacity of the soil ranged from257 to 551 kN/m2 and 37 to 441 kN/m2, re-spectively. Hence an average allowable bear-ing capacity of 100 kN/m2 (ultimate bearingcapacity of 300 kN/m2) would be appropriatefor designing a shallow foundation in the area,at a depth not less than 0.4 m in locations 1and 3.4 m at location 2. Settlement and bear-
ing capacity are the major factors that governfoundation design. The commonly accepted de-sign basis is that the total settlement of a foot-ing should be restricted to about 25 mm (Bell,2007; Mazlan, 2007). By so doing, the differ-ential settlement between adjacent footings isconfined within limits that a structure can tol-erate. The settlement analysis for foundationwidth of 0.6 – 3.0 m at three depth levels of 1m,2 m, and 3 m produced relatively high valuesgreater than 25 mm, i.e., 30.06 – 45.92 mm settle-ment values (Table 5). Although from the result,foundation width above 2.0 m produced settle-ment values less than 25 mm (Table 5) recom-mended by Bell (Mazlan, 2007) as it ranged be-tween 10.70 – 17.28 mm. These settlement val-ues are still tolerable, as they are within Meyer-hof (1976), Schmertamnn (1978) total settlementlimits of 60 mm (clay) and 50 mm (granularsoil). Therefore foundation width not less than0.6 m for depth not less than 1 m is feasible. Thecalculation of bearing capacities for strip andsquare foundation is shown in Table 6. For stripfoundation, the appropriate (recommended) ul-timate bearing and allowable bearing capacityfor depth levels of 0.6 – 1.4 m vary from 608 –2940 kN/m2 and 203 - 980 kN/m2, while squarefooting varies in between 990 – 3822 kN/m2 and330 - 1274 kN/m2, respectively (Table 6).
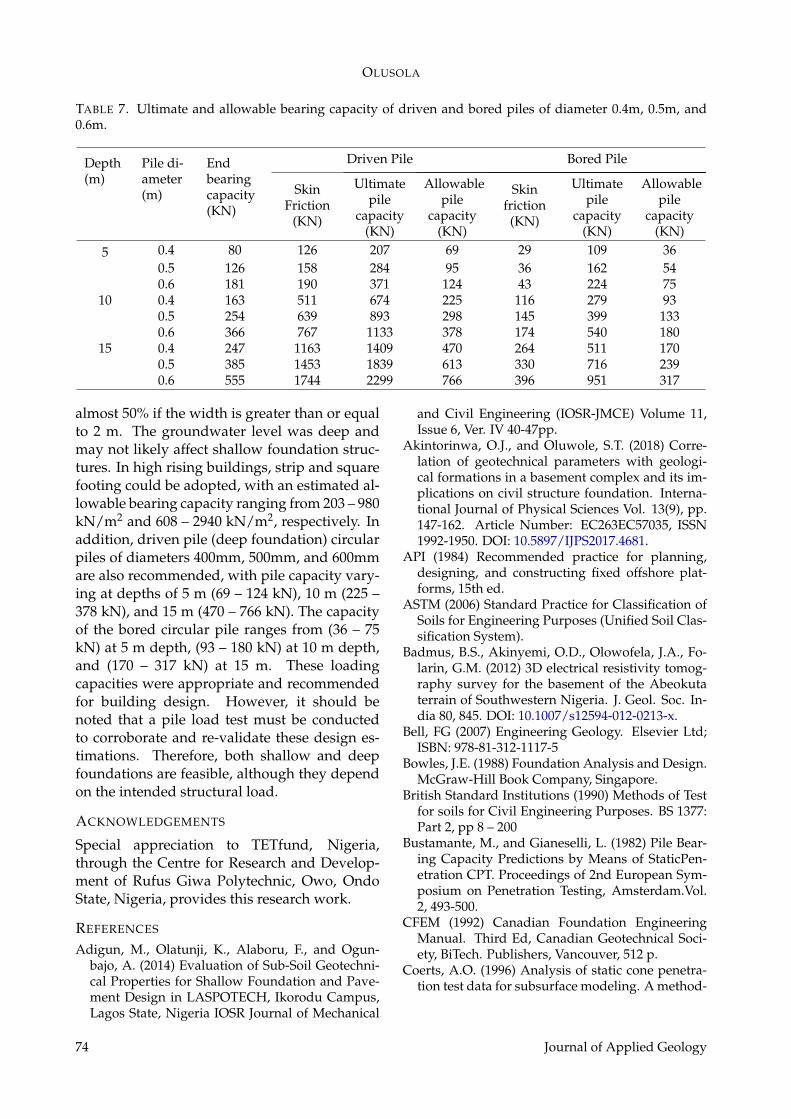
An attempt was made to design for a deepfoundation at depth levels of 5 m, 10 m, and 15m for circular piles of 400 mm, 500 mm, and 600mm while considering the groundwater level.The type of piles designed for in the area in-cluded driven/displacement piles and boredpiles. The versatility and cost-effectiveness arepart of the governing factors considered. Thebearing capacity of the pile depends on pile di-ameter, founding depth, vertical stress, area ofthe pile, method of installation. The result (Ta-ble 7) shows that the larger the diameter of thepile, the better its bearing capacity. For drivenpiles at 5 m, 10 m, and 15 m, the adopted al-lowable capacity based on estimated calculationwas between 69 – 124 kN, 225 – 378 kN, and 470– 766 kN, respectively. The allowable bearingcapacity for bored piles ranges from 36 – 75 kN,93 – 180 kN, and 170 – 317 kN at depth levels of5 m, 10 m, and 15 m, respectively (Table 7). Al-though it is recommended that pile load tests beconducted before the design, construction, and
Journal of Applied Geology 71
OLUSOLA
TABLE 2. Geotechnical/engineering properties of soil in location 1.
Depth(m)
Qc(kg/cm2)
SR(kg/cm2) Rf
LL(%)
PL(%)
PI(%)
LS(%)
MC(%)
Gravel(%)
Sand(%)
Silt(%)
Clay(%) SG
0.2 35 50 1.43 30.2 19.5 10.7 4.3 14.1 - 53.1 5.7 47.3 2.640.4 48 60 1.250.6 65 80 1.23 32.3 21.7 10.6 4.3 15.1 - 43.6 20.8 35.6 2.660.8 60 95 1.581.0 75 101 1.34 33.4 21.8 11.6 5.0 15.9 - 44.9 22.2 32.9 2.67
TABLE 3. Geotechnical/engineering properties of soil in location 2.
Depth(m)
Qc(kg/cm2)
SR(kg/cm2) Rf
LL(%)
PL(%)
PI(%)
LS(%)
MC(%)
Gravel(%)
Sand(%)
Silt(%)
Clay(%) SG
0.2 5 10 2.20.4 20 22 1.10.6 20 25 1.25 43.5 22.4 21.1 9.1 16.2 - 68.5 20.1 11.4 2.670.8 20 20 11.0 15 20 1.33 41.2 24.4 16.8 8.6 11.1 - 69.2 21.5 9.3 2.671.2 18 20 1.111.4 12 25 2.081.6 15 20 1.331.8 15 20 1.332.0 25 30 1.2 45.4 28.5 16.9 8.9 15.8 - 68.2 21.8 10 2.692.2 30 35 1.172.4 30 32 1.072.6 35 40 1.142.8 40 45 1.133.0 38 42 1.11 48.2 27.8 20.4 8.7 15.2 - 54.9 15.3 29.8 2.683.2 40 50 1.253.4 45 55 1.223.6 50 65 1.33.8 52 70 1.354.0 60 80 1.33 48.5 28.2 20.3 8.2 15.5 - 52.2 18.5 29.3 2.69
1
2
3
45
6
7
8
9
10
11
12
Friction Ratio (%) Rf
0 1 2 3 4 5 6 7 81
10
100
1000
Co
ne
Bea
rin
g (
bar
)
10
11
12
Zone
1.5
2.5
SBT
Sensitive, fine grained
Organic materials
Clay
Silty clay to clay
Clayey silt to silty clay
Sandy silt to clayey silt
Silty sand to sandy silt
Sand to silty sand
Sand
Gravelly sand to sand
Very stiff fine grained*
Sand to clayey sand*
*Over consolidated or cemented
qc/N
CPT at Location 2
CPT at Location 1
Figure 8: Robertson Chart for the soil classification using cone resistance values and friction
ratio
FIGURE 8. Robertson chart for the soil classification using cone resistance values and friction ratio.
72 Journal of Applied Geology
ENGINEERING SITE INVESTIGATION FOR FOUNDATION DESIGN AND CONSTRUCTION
TABLE 4. The bearing capacity estimated from CPTobtained at different depths in the studied site.
Depth(m)
CPT 1 CPT 2qallowable(kN/m2)
qultimate(kN/m2)
qallowable(kN/m2)
qultimate(kN/m2)
0.2 86 257 12 370.4 118 353 49 1470.6 159 478 49 1470.8 147 441 49 1471.0 184 551 37 1101.2 - - 44 1321.4 - - 29 881.6 - - 37 1101.8 - - 37 1102.0 - - 61 1842.2 - - 74 2212.4 - - 74 2212.6 - - 86 2572.8 - - 98 2943.0 - - 93 2793.2 - - 98 2943.4 - - 110 3313.6 - - 123 3683.8 - - 127 3824.0 - - 147 441
TABLE 5. Total estimated settlement obtained at dif-ferent foundation depth and width.
Foundationwidth (m)
Settlement (mm) at depth level (m)
1 m 2 m 3 m
0.6 45.92 45.24 44.151 30.05 30.44 30.062 16.07 17.17 17.283 10.7 11.96 12.2
TABLE 6. Allowable and ultimate bearing capacityfor strip and square shallow foundation.
Depth(m)
Strip Square Strip Squarequltimate(kN/m2)
qultimate(kN/m2)
qallowable(kN/m2)
qallowable(kN/m2)
0.6 608 990 203 3301.0 882 1323 294 4411.4 2940 3822 980 1274
(a)
(b)
Figure 9: Plots of cone resistance and Sleeve friction against depths at (a) location 1 and (b)
location 2FIGURE 9. Plots of cone resistance and Sleeve fric-tion against depths at (a) location 1 and (b) location2.
installation of the pile (Tomlinson, 1999) in thestudy area to ensure these proposed design al-ternatives be effectively and correctly used.
5 CONCLUSION
Based on the resistivity parameters (242 – 1503ohm-m), thickness (3.4 – 20.9 m) of the geoelec-tric layer of the topsoil, it is capable of hostingfoundation structure within the upper 3 m, withan allowable bearing capacity of 100 kN/m2
at 1.2 m at location 1 and 3.2 m at location2. The soil within this unit was characterizedwith good geotechnical properties in confor-mity with the Federal Ministry of Works and theHousing specification of Nigeria. The estimatedsettlement was less than 50 mm using a foun-dation width of 0.6 m but could be reduced by
Journal of Applied Geology 73
OLUSOLA
TABLE 7. Ultimate and allowable bearing capacity of driven and bored piles of diameter 0.4m, 0.5m, and0.6m.
Depth(m)
Pile di-ameter(m)
Endbearingcapacity(KN)
Driven Pile Bored Pile
SkinFriction
(KN)
Ultimatepile
capacity(KN)
Allowablepile
capacity(KN)
Skinfriction(KN)
Ultimatepile
capacity(KN)
Allowablepile
capacity(KN)
5 0.4 80 126 207 69 29 109 360.5 126 158 284 95 36 162 540.6 181 190 371 124 43 224 75
10 0.4 163 511 674 225 116 279 930.5 254 639 893 298 145 399 1330.6 366 767 1133 378 174 540 180
15 0.4 247 1163 1409 470 264 511 1700.5 385 1453 1839 613 330 716 2390.6 555 1744 2299 766 396 951 317
almost 50% if the width is greater than or equalto 2 m. The groundwater level was deep andmay not likely affect shallow foundation struc-tures. In high rising buildings, strip and squarefooting could be adopted, with an estimated al-lowable bearing capacity ranging from 203 – 980kN/m2 and 608 – 2940 kN/m2, respectively. Inaddition, driven pile (deep foundation) circularpiles of diameters 400mm, 500mm, and 600mmare also recommended, with pile capacity vary-ing at depths of 5 m (69 – 124 kN), 10 m (225 –378 kN), and 15 m (470 – 766 kN). The capacityof the bored circular pile ranges from (36 – 75kN) at 5 m depth, (93 – 180 kN) at 10 m depth,and (170 – 317 kN) at 15 m. These loadingcapacities were appropriate and recommendedfor building design. However, it should benoted that a pile load test must be conductedto corroborate and re-validate these design es-timations. Therefore, both shallow and deepfoundations are feasible, although they dependon the intended structural load.
ACKNOWLEDGEMENTS
Special appreciation to TETfund, Nigeria,through the Centre for Research and Develop-ment of Rufus Giwa Polytechnic, Owo, OndoState, Nigeria, provides this research work.
REFERENCES
Adigun, M., Olatunji, K., Alaboru, F., and Ogun-bajo, A. (2014) Evaluation of Sub-Soil Geotechni-cal Properties for Shallow Foundation and Pave-ment Design in LASPOTECH, Ikorodu Campus,Lagos State, Nigeria IOSR Journal of Mechanical
and Civil Engineering (IOSR-JMCE) Volume 11,Issue 6, Ver. IV 40-47pp.
Akintorinwa, O.J., and Oluwole, S.T. (2018) Corre-lation of geotechnical parameters with geologi-cal formations in a basement complex and its im-plications on civil structure foundation. Interna-tional Journal of Physical Sciences Vol. 13(9), pp.147-162. Article Number: EC263EC57035, ISSN1992-1950. DOI: 10.5897/IJPS2017.4681.
API (1984) Recommended practice for planning,designing, and constructing fixed offshore plat-forms, 15th ed.
ASTM (2006) Standard Practice for Classification ofSoils for Engineering Purposes (Unified Soil Clas-sification System).
Badmus, B.S., Akinyemi, O.D., Olowofela, J.A., Fo-larin, G.M. (2012) 3D electrical resistivity tomog-raphy survey for the basement of the Abeokutaterrain of Southwestern Nigeria. J. Geol. Soc. In-dia 80, 845. DOI: 10.1007/s12594-012-0213-x.
Bell, FG (2007) Engineering Geology. Elsevier Ltd;ISBN: 978-81-312-1117-5
Bowles, J.E. (1988) Foundation Analysis and Design.McGraw-Hill Book Company, Singapore.
British Standard Institutions (1990) Methods of Testfor soils for Civil Engineering Purposes. BS 1377:Part 2, pp 8 – 200
Bustamante, M., and Gianeselli, L. (1982) Pile Bear-ing Capacity Predictions by Means of StaticPen-etration CPT. Proceedings of 2nd European Sym-posium on Penetration Testing, Amsterdam.Vol.2, 493-500.
CFEM (1992) Canadian Foundation EngineeringManual. Third Ed, Canadian Geotechnical Soci-ety, BiTech. Publishers, Vancouver, 512 p.
Coerts, A.O. (1996) Analysis of static cone penetra-tion test data for subsurface modeling. A method-
74 Journal of Applied Geology
ENGINEERING SITE INVESTIGATION FOR FOUNDATION DESIGN AND CONSTRUCTION
ology – Ph.D. Thesis, Nethernals GeographicalStudies 210, 263pp
Coker, J.O., Makinde, V., Adesodun, J.K., andMustapha, AO (2013) Integration of Geophysi-cal and Geotechnical Investigation for a ProposedNew Lecture Theatre at Federal University ofAgriculture, Abeokuta, South-Western Nigeria.International Journal of Emerging Trends in Engi-neering and Development Issue 3, Vol.5: 338-348
Coker, JO (2015) Geophysical and Geotechnical As-sessment of Foundation Failure: A Case Study ofLibrary Complex Area, Lagos State Polytechnic,Ikorodu, Lagos, Nigeria. Research Journal in En-gineering and Applied Sciences. Vol.3, No 7.
Das, B.M. (2004) Principles of Foundation Engineer-ing 5th Edition. Brooks/Coe Publishing Co., Cal-ifornia.
de Ruiter, J., and Beringen, F.L. (1979) Pile Foun-dations for Large North Sea Structures. MarineGeotechnology, Vol. 3, No. 3, pp. 267-314.
Debeer, EE (1963) The scale effect in the transposi-tion of the results of deep sounding tests on the ul-timate bearing capacity of piles and caisson foun-dations. Geotechnique, Vol. 13, No. 1, pp.39-75.
FMWH (1972) Highway Manual Part 1 Road Design,Federal Ministry of Works and Housing, Lagos.
Ibitoye, F.P, Ipinmoroti, F.V., Salami, M., Akin-luwade, K.J., Adeyinka T.T, Adetunji A.R. (2013)Application of Geophysical Methods to Build-ing Foundation Studies, International Jour-nal of Geosciences, 2013, 4, 1256-1266. DOI:10.4236/ijg.2013.49120.
Iloeje, M. P. (1981) A new Geography of Nigeria.Longman Nigeria, 26 - 28.
Jegede, G. (2000) Effect of soil properties on pave-ment failure along the F209 highway at Ado-Ekiti,Southwestern Nigeria. Journal of Constructionand Building Materials, vol. 14, pp. 311-315.
Jones, H.A., and Hockey, RD (1964) The Geology ofpart of Southwestern Nigeria, Geological SurveyNigeria Bulletin, 31: 56 - 86.
Koefeod, O. (1979) Geosounding principles, I. Resis-tivity sounding measurements, Elsevier ScientificPublishing Comp, Amsterdam, 275p.
Lunne, T., Robertson, P.K., and Powell, J.J.M. (1997)Cone Penetration Testing in Geotechnical Prac-tise, Blackie Academic and Professional, London,312p.
Mazlan, A. (2007) Correlation Between Cone Pen-etration Test and Bearing Capacity for Shal-lowFoundation. Master’s Thesis. UniversitiTeknologi Malaysia.
Meyerhof, G.G. (1976) Bearing capacity and settle-ment of ASCE, Journal of Geotechnical Engineer-ing, Vol. 102, GT3, pp. 195 - 228.
Murthy, V.N.S. (2002) Principles and Practices of Soil
Mechanics and Foundation Engineering. CRCPress, Florida.
Ngah, S.A., and Nwankwoala, H.O. (2013) Evalua-tion of Sub-Soil Geotechnical Properties for Shal-low Foundation Design in Onne, Rivers State,Nigeria. The International Journal of Engineeringand Science (IJES), Volume 2, Issue 11, Pages 08-16.
Nottingham, L.C., (1975) Use of quasi-static frictioncone penetrometer data to predict load capacityof displacement piles. Ph.D. Thesis, Dept. of CivilEngineering., University of Florida, 553p.
Nwankwoala, H.O., and Amadi, AN (2013)Geotechnical Investigation of Sub-soil andRock Characteristics in parts of Shiroro- Muya-Chanchaga Area of Niger State, Nigeria. Interna-tional Journal of Earth Sciences and Engineering,Vol. 61: 8 -17.
Nwankwoala, H.O., and Warmate, T. (2014)Geotechnical Assessment of Foundation Con-ditions of a Site in Ubima, Ikwerre Local Govern-ment Area, Rivers State, Nigeria. InternationalJournal of Engineering Research and Develop-ment (IJERD), 98: 50 - 63.
Okosun, E.A. (1998) Review of the Early Stratigra-phy of Southwestern Nigeria, Journal of Miningand Geology, 34 (1), 27 - 35.
Omatsola, M.E., and Adegoke, O.S. (1981) TectonicEvolution and Cretaceous Stratigraphy of the Da-homey Basin, Journal of Mining and Geology, 8:30-137.
Omosuyi, G.O. (2001) Geophysical and Hydrogeo-logical Investigations of Groundwater Prospectsin the Southern Part of Ondo State, Nigeria.Ph.D. Thesis, Department of Applied Geophysics,Federal University of Technology, Akure, Nige-ria.195pp.
Omosuyi, G.O., Ojo, JS, and Olorunfemi, M.O.(2007) Hydrochemical Investigation of Ground-water in Okitipupa area, Ondo State, Southwest-ern Nigeria. Journal of African Water Resourcesand Environment (Aquaterra), 1(2), 3 - 13.
Osinowo O.O., Falufosi M.O. (2018) 3D ElectricalResistivity Imaging (ERI) for subsurface evalu-ation in pre-engineering construction site inves-tigation NRIAG Journal of Astronomy and geo-physics (2018). DOI: 10.1016/j.nrjag.2018.07.001.
Osinowo, O.O., Akanji, A.O., Akinmosin, A. (2011)Integrated geophysical and geotechnical investi-gation of the failed portion of a road in BasementComplex terrain, southwestern Nigeria. RMZ –Mater. Geoenviron. 58 (2), 143–162.
Owamah, H.I., Atipko, E., Ukala, D.C, and Ap-kan, E.J. (2018) Assessment of Some Geotechni-cal Properties of Nigerian Coastal Soil: A Case-Study of Port-Harcourt Beach Mud. Appl. Sci.
Journal of Applied Geology 75
OLUSOLA
Environ. Manage. Vol. 22 (2) 228 – 233. DOI:10.4314/jasem.v22i2.13.
Oyedele, K.F., Oladele, S., and Adedoyin, O. (2011)Application of Geophysical and GeotechnicalMethods to Site Characterization for Construc-tion Purposes at Ikoyi, Lagos, Nigeria Journalof Earth Sciences and Geotechnical Engineering,1(1): 87-100.
Robertson, P.K. (1990) Soil classification using thecone penetration test. Canadian GeotechnicalJournal, 27:151-158.
Sanglerat, G. (1972) The Penetrometer and Soil Ex-ploration. Elsevier Publishing Co., Amsterdam.
Schmertmann, J.H. (1970) Static cone to computestatic settlement over-sand. Journal of the SoilMechanics and Foundations Division. ASCE. Vol.96. No. SM3. Proc. Paper 7302, pp. 1011 - 1043.
Schmertmann, J.H. (1978) Guidelines for Cone Pen-etration Test: Performance and Design. U.S.Dept.of Transportation, Washington, DC.
Skempton, A.W. (1951) The Bearing Capacity ofClays, Proceedings Building Research Congress,Vol. 1, pp. 180-189.
Stroud, M.A., and Butler, F.G. (1975) The standardpenetration test and the engineering properties ofGlacial materials. In: Proceedings of the Sympo-sium of glacial materials, University of Birming-ham.
Sudha, K., Israil, M., Mittal, S., Rai, J. (2009) Soilcharacterization using electrical resistivity tomog-raphy and geotechnical investigations. Journal ofApplied Geophysics, 67, 74 – 79.
Telford, W.M., Geldart, L.P., Sheriff, RE (1990) Ap-plied Geophysics, second edition. CambridgeUniversity Press.
Terzaghi, K., and Peck, R. B. (1967) Soil Mechanicsin Engineering Practice, John Wiley & Sons, Inc.,2nd edition, New York, p. 491.
Tomlinson M.J. (1999) Foundation Design and Con-struction 6th Edition.
Webb, D.L. (1969) Settlement of Structures on deepalluvial sand sediments in Durban, South Africa,British Geotechnical Society Conference on in-SituInvestigations in Soils and Rocks, Session III, pa-per 16, London, England, 13-15 May 1969, pp.133-140.
76 Journal of Applied Geology