Embed Size (px)
Citation preview

• Energy Update!
• Review Last Lecture• Today’s Material:
• Energy• Society
• Homework Assignment (due next Wed)• CH 1: 1• CH 2: 1, 3, 4, 5,

http://www.universetoday.com/114076/extreme-weather-is-linked-to-global-warming-a-new-study-suggests/#more-114076 http://www.pnas.org/content/early/2014/08/06/1412797111
Extreme weather is becoming much more common. Heat waves and heavy rains are escalating, food crops are being damaged, human beings are being displaced due to flooding and animals are migrating toward the poles or going extinct.
The research shows blocking patterns — high-pressure systems that become immobile for days or even weeks, causing extreme heat waves and torrential rain — may have doubled in summers over the last decade.
In 2013, a blocking pattern over Alaska caused a record-breaking heat wave. Credit: Earth Observatory
It was a blocking pattern that led to the heat wave in Alaska in 2013, and to the devastating floods in Colorado last summer.
These blocking patterns are associated with the jet stream, the fast flowing winds high in Earth’s atmosphere at latitudes between 30 and 60 degrees. Sometimes the flow weakens, and the winds can dip down into more southern latitudes. These excursions lead to blocking patterns.
The jet streams are driven by the difference in temperature between the poles and the equator. So because the Arctic is warming more quickly than lower latitudes, the temperature difference is declining, providing less energy for the jet stream and causing it to meander.
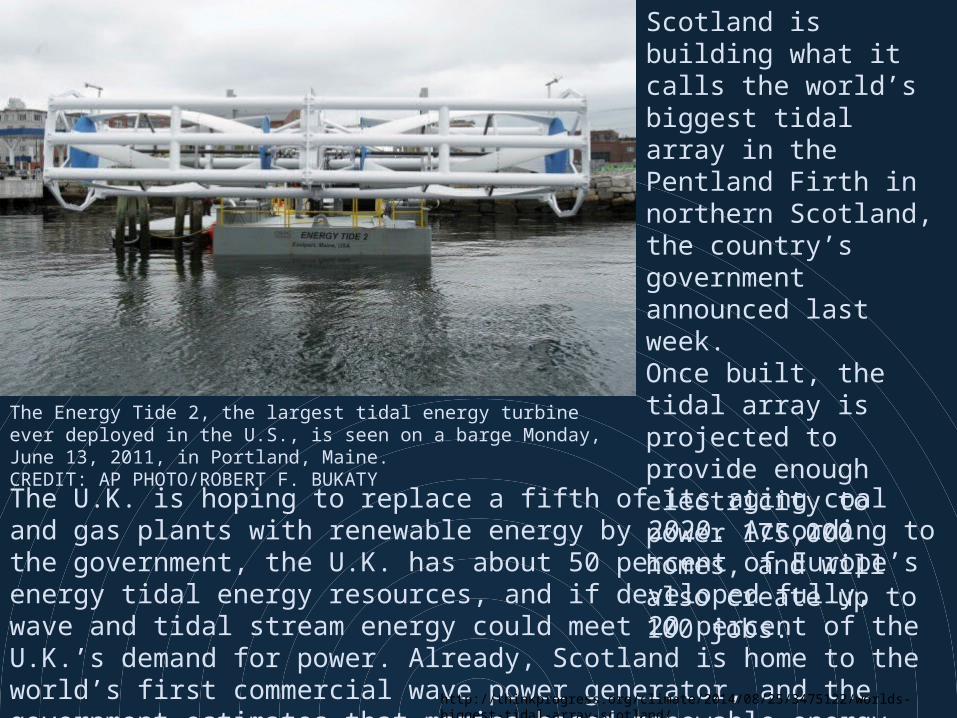
The Energy Tide 2, the largest tidal energy turbine ever deployed in the U.S., is seen on a barge Monday, June 13, 2011, in Portland, Maine.CREDIT: AP PHOTO/ROBERT F. BUKATY
Scotland is building what it calls the world’s biggest tidal array in the Pentland Firth in northern Scotland, the country’s government announced last week.Once built, the tidal array is projected to provide enough electricity to power 175,000 homes, and will also create up to 100 jobs.
The U.K. is hoping to replace a fifth of its aging coal and gas plants with renewable energy by 2020. According to the government, the U.K. has about 50 percent of Europe’s energy tidal energy resources, and if developed fully, wave and tidal stream energy could meet 20 percent of the U.K.’s demand for power. Already, Scotland is home to the world’s first commercial wave power generator, and the government estimates that marine-based renewable energy like tidal arrays could one day power 750,000 homes in Scotland. http://thinkprogress.org/climate/2014/08/25/3475122/worlds-biggest-tidal-array-scotland/
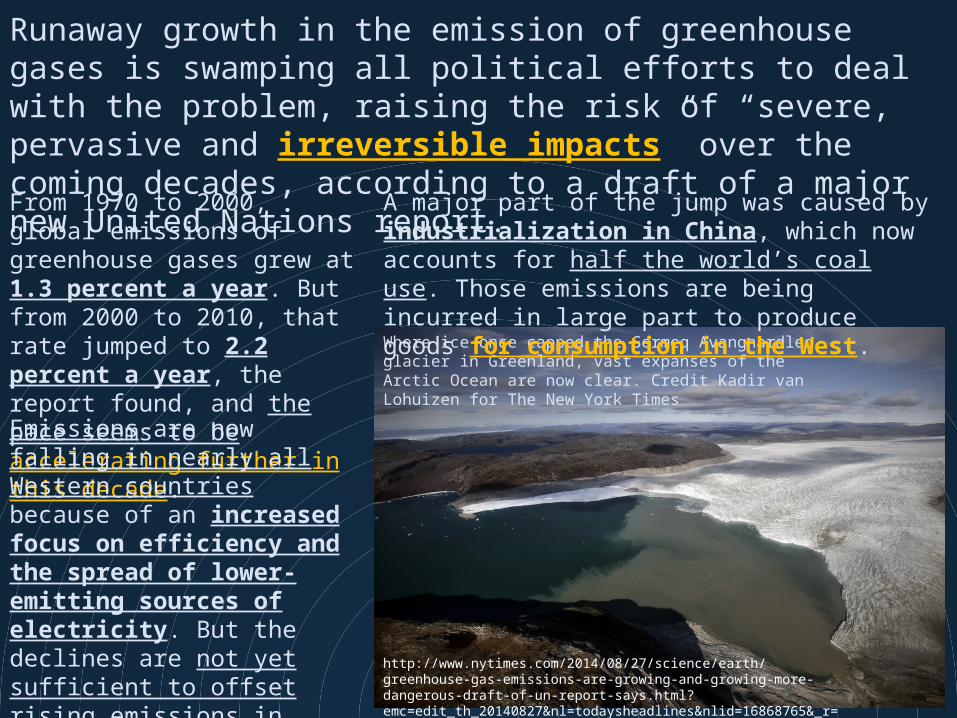
Where ice once capped the Sermeq Avangnardleq glacier in Greenland, vast expanses of the Arctic Ocean are now clear. Credit Kadir van Lohuizen for The New York Times
From 1970 to 2000, global emissions of greenhouse gases grew at 1.3 percent a year. But from 2000 to 2010, that rate jumped to 2.2 percent a year, the report found, and the pace seems to be accelerating further in this decade.
A major part of the jump was caused by industrialization in China, which now accounts for half the world’s coal use. Those emissions are being incurred in large part to produce goods for consumption in the West.
Runaway growth in the emission of greenhouse gases is swamping all political efforts to deal with the problem, raising the risk of “severe, pervasive and irreversible impacts” over the coming decades, according to a draft of a major new United Nations report.
Emissions are now falling in nearly all Western countries because of an increased focus on efficiency and the spread of lower-emitting sources of electricity. But the declines are not yet sufficient to offset rising emissions in developing countries, many of whose governments are focused on pulling their people out of poverty.
http://www.nytimes.com/2014/08/27/science/earth/greenhouse-gas-emissions-are-growing-and-growing-more-dangerous-draft-of-un-report-says.html?emc=edit_th_20140827&nl=todaysheadlines&nlid=16868765&_r=1

What is the Scientific Method?What are the steps?
http://www.thwink.org/sustain/deadlock/WhyUnableToSolveProblem.htm
1. Observe a phenomenon.2. Formulate an hypothesis.3. Design an experiment to test the hypothesis.4. Perform the experiment.5. Accept, reject, or modify the hypothesis.

Potential vs. Kinetic?
http://water.me.vccs.edu/courses/env211/lesson2_print.htm

Potential vs. Kinetic?
http://www.dailyspeculations.com/wordpress/?cat=251
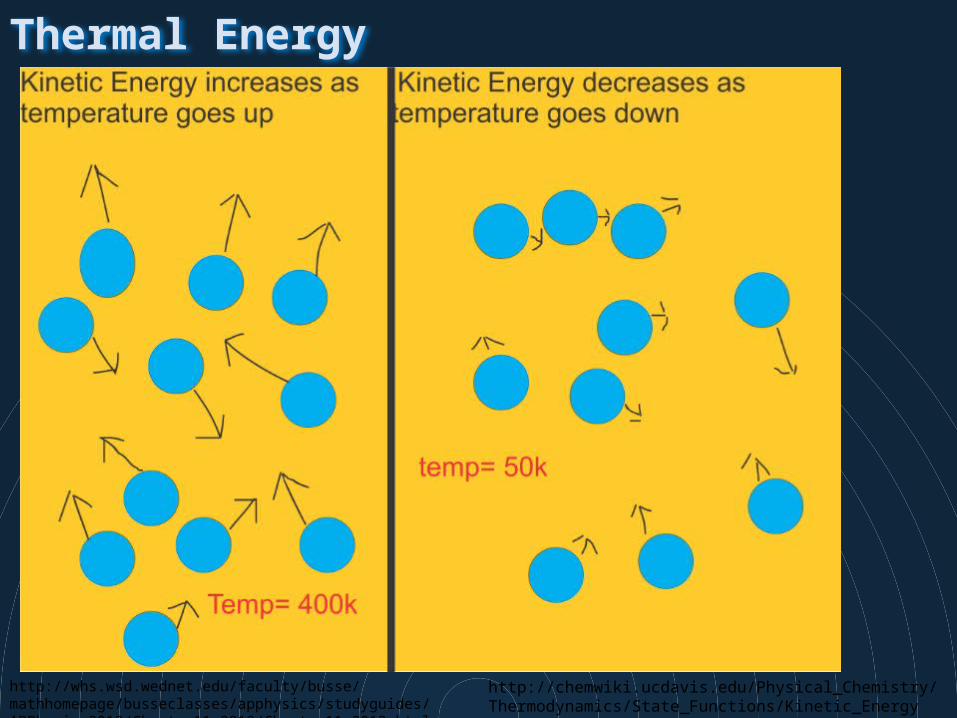
Thermal Energy
http://chemwiki.ucdavis.edu/Physical_Chemistry/Thermodynamics/State_Functions/Kinetic_Energy
http://whs.wsd.wednet.edu/faculty/busse/mathhomepage/busseclasses/apphysics/studyguides/APPhysics2012/Chapter11_2012/Chapter11_2012.html
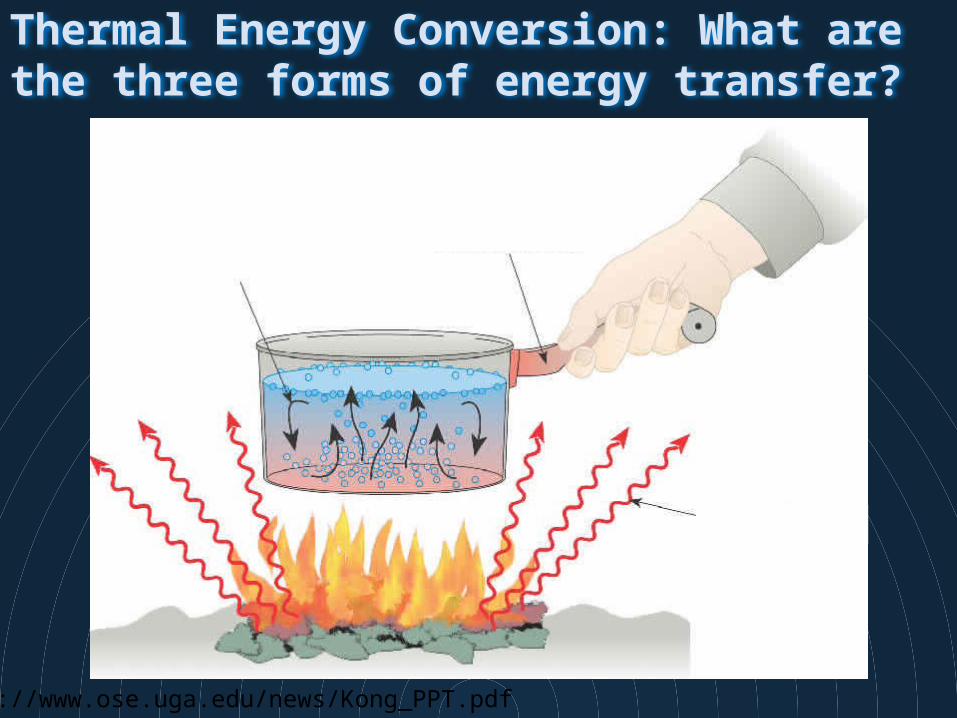
Thermal Energy Conversion: What are the three forms of energy transfer?
http://www.ose.uga.edu/news/Kong_PPT.pdf
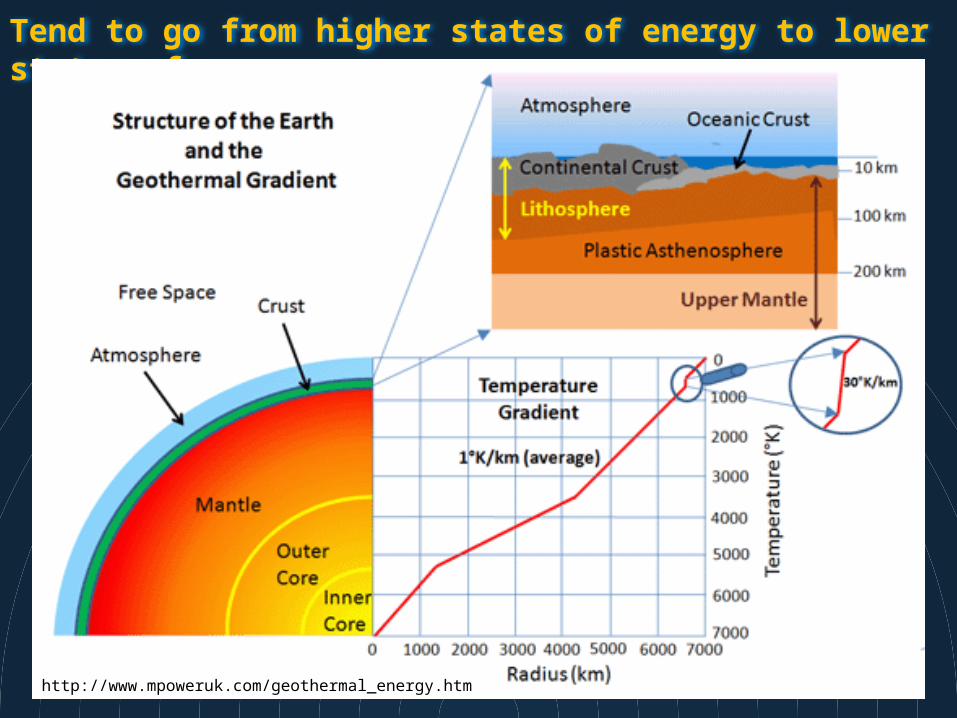
Tend to go from higher states of energy to lower states of energy…
http://www.mpoweruk.com/geothermal_energy.htm
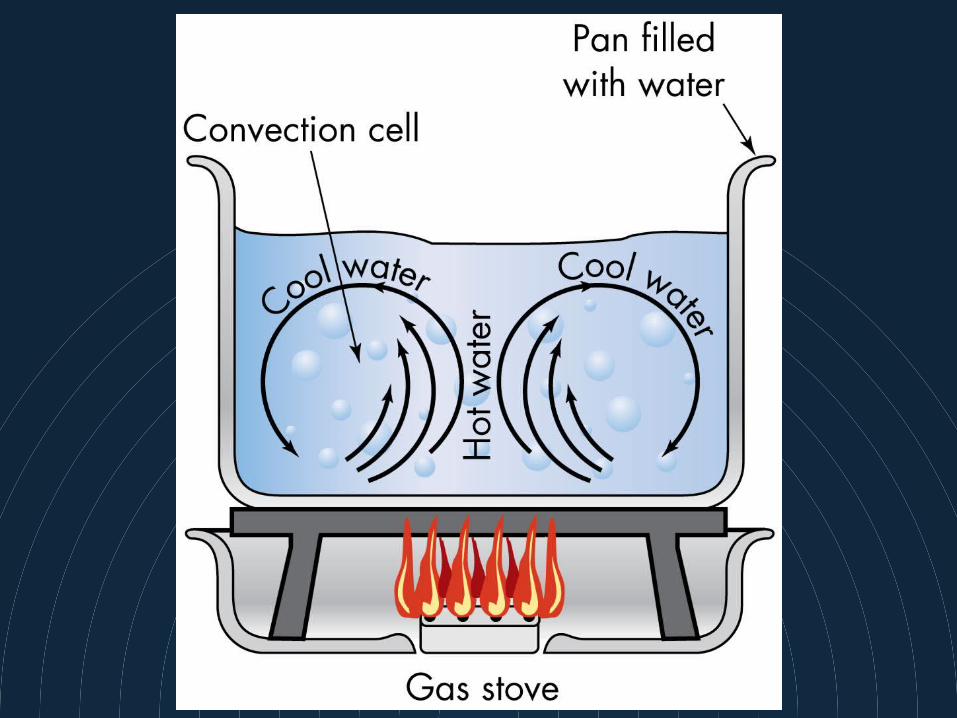
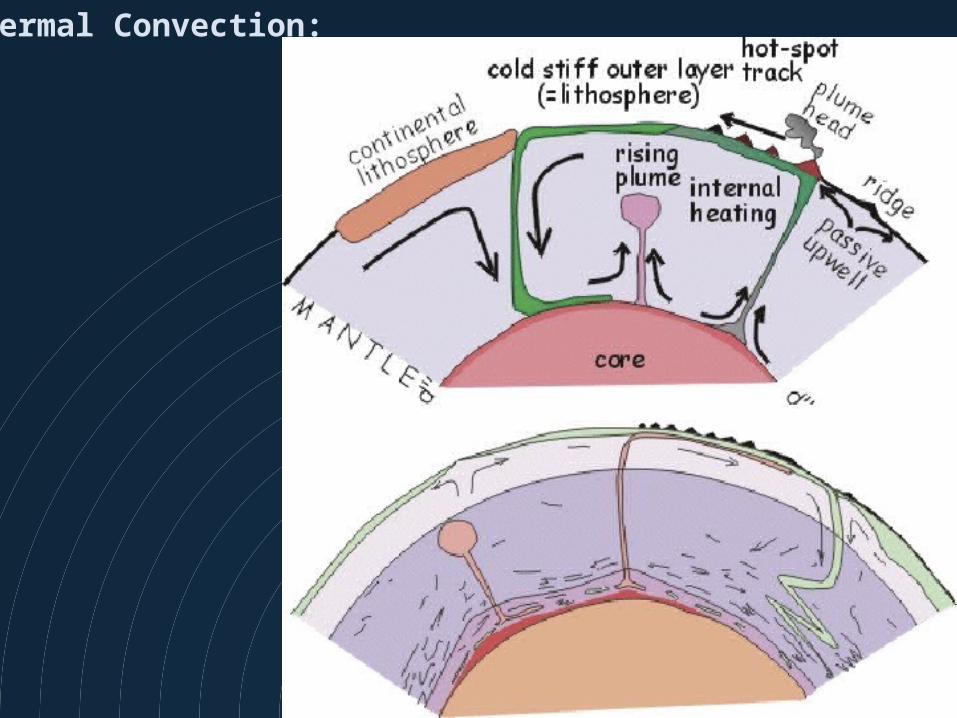
Thermal Convection:
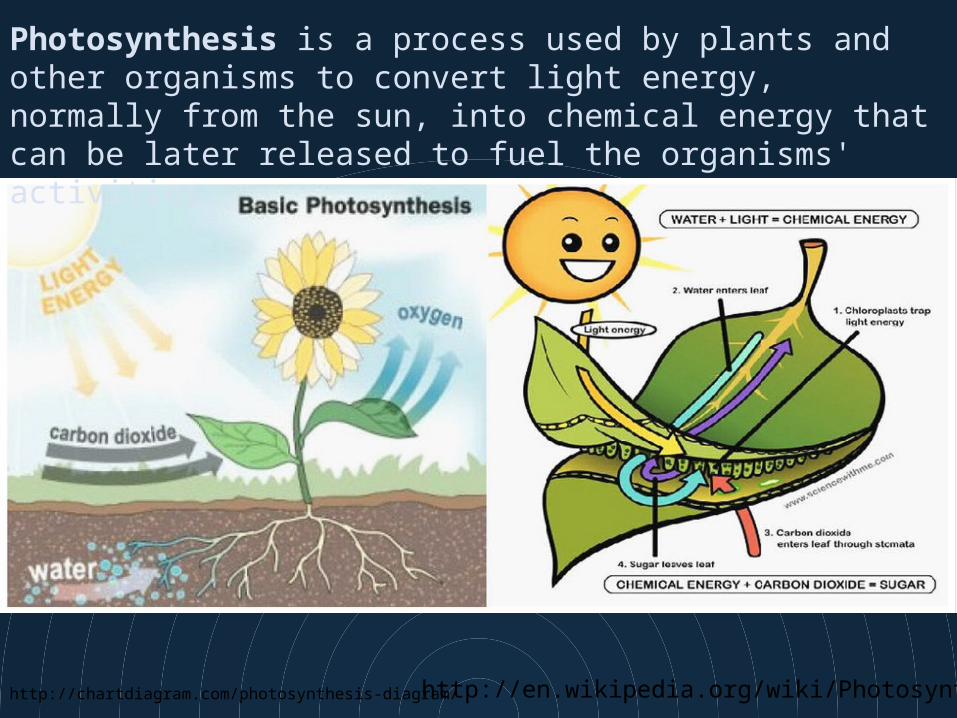
http://chartdiagram.com/photosynthesis-diagram/
Photosynthesis is a process used by plants and other organisms to convert light energy, normally from the sun, into chemical energy that can be later released to fuel the organisms' activities.
http://en.wikipedia.org/wiki/Photosynthesis
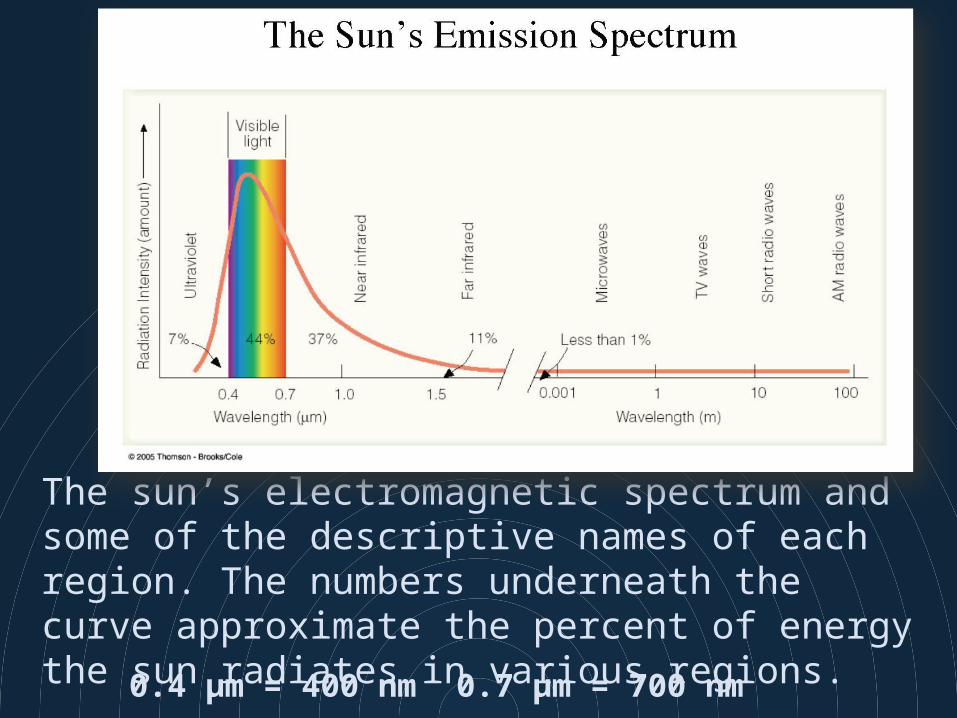
The sun’s electromagnetic spectrum and some of the descriptive names of each region. The numbers underneath the curve approximate the percent of energy the sun radiates in various regions.
0.4 μm = 400 nm 0.7 μm = 700 nm
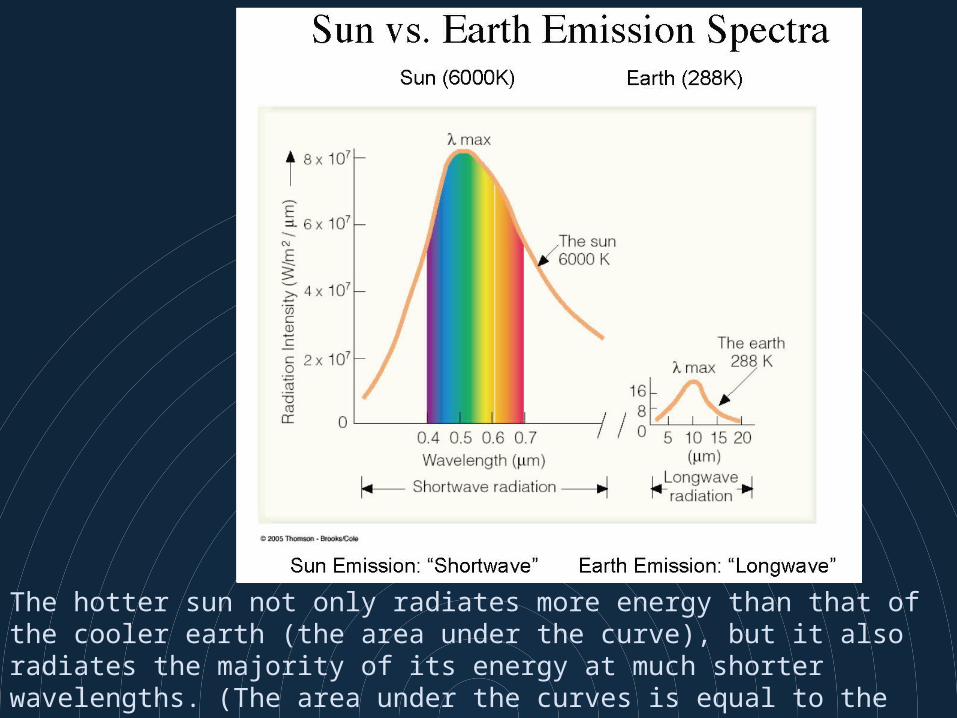
The hotter sun not only radiates more energy than that of the cooler earth (the area under the curve), but it also radiates the majority of its energy at much shorter wavelengths. (The area under the curves is equal to the total energy emitted, and the scales for the two curves differ by a factor of 100,000.)
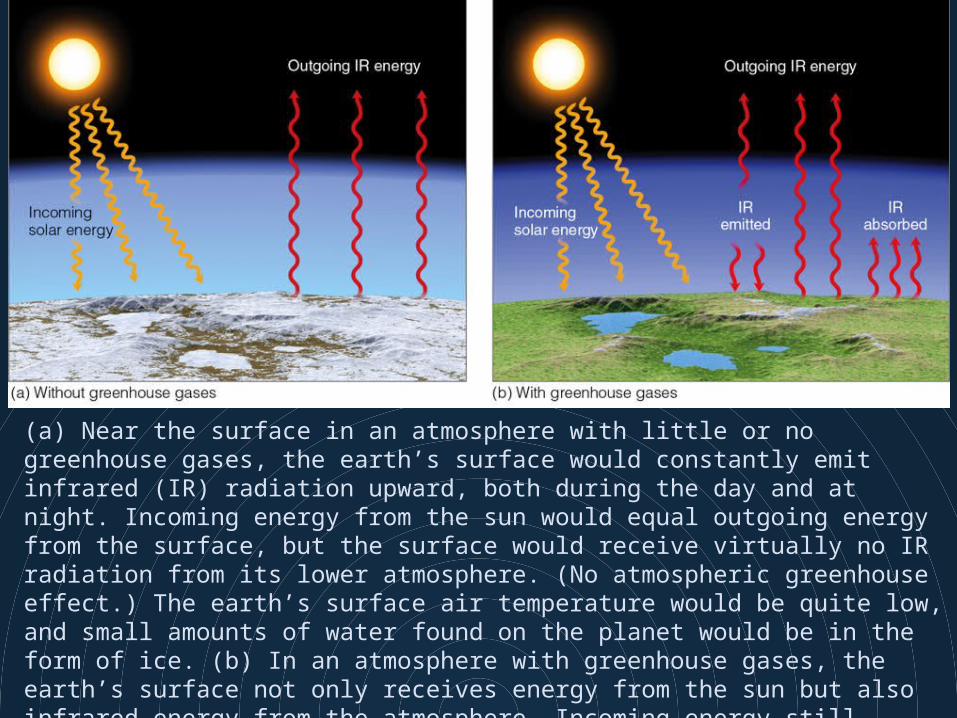
(a) Near the surface in an atmosphere with little or no greenhouse gases, the earth’s surface would constantly emit infrared (IR) radiation upward, both during the day and at night. Incoming energy from the sun would equal outgoing energy from the surface, but the surface would receive virtually no IR radiation from its lower atmosphere. (No atmospheric greenhouse effect.) The earth’s surface air temperature would be quite low, and small amounts of water found on the planet would be in the form of ice. (b) In an atmosphere with greenhouse gases, the earth’s surface not only receives energy from the sun but also infrared energy from the atmosphere. Incoming energy still equals outgoing energy, but the added IR energy from the greenhouse gases raises the earth’s average surface temperature to a more habitable level.
http://geogrify.net/GEO1/Images/Geosystems/EG_7e_Figure_02_08_L.jpg
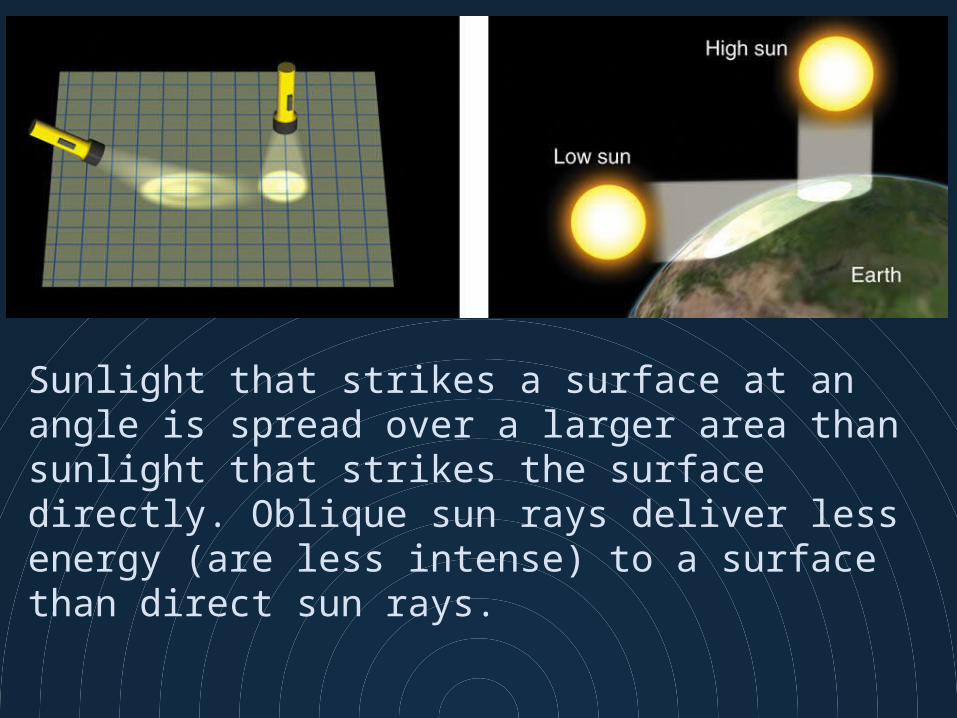
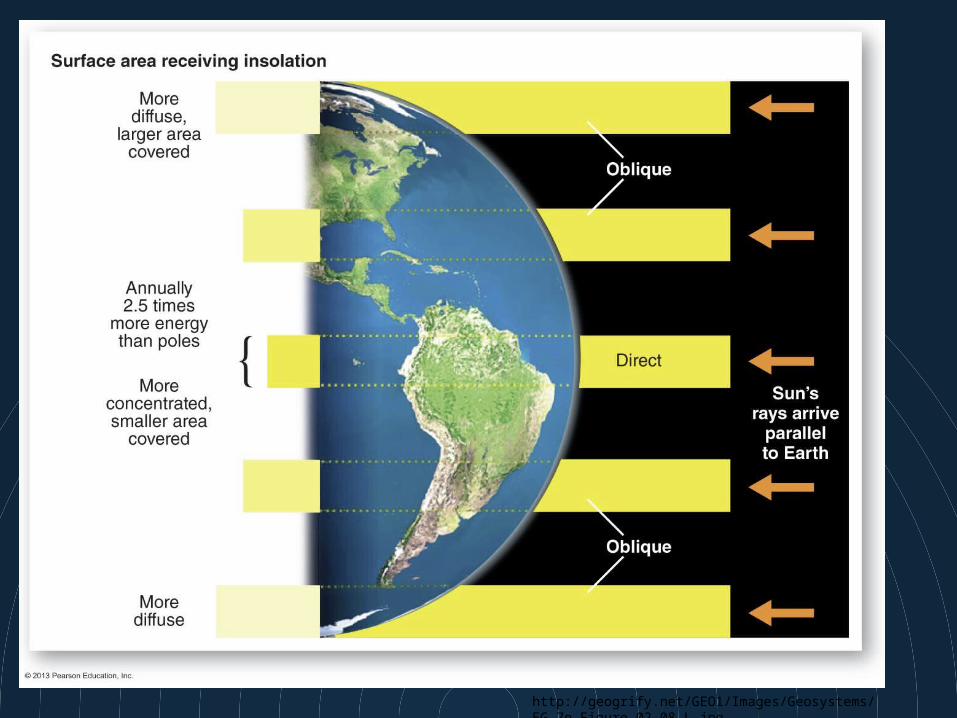
Sunlight that strikes a surface at an angle is spread over a larger area than sunlight that strikes the surface directly. Oblique sun rays deliver less energy (are less intense) to a surface than direct sun rays.
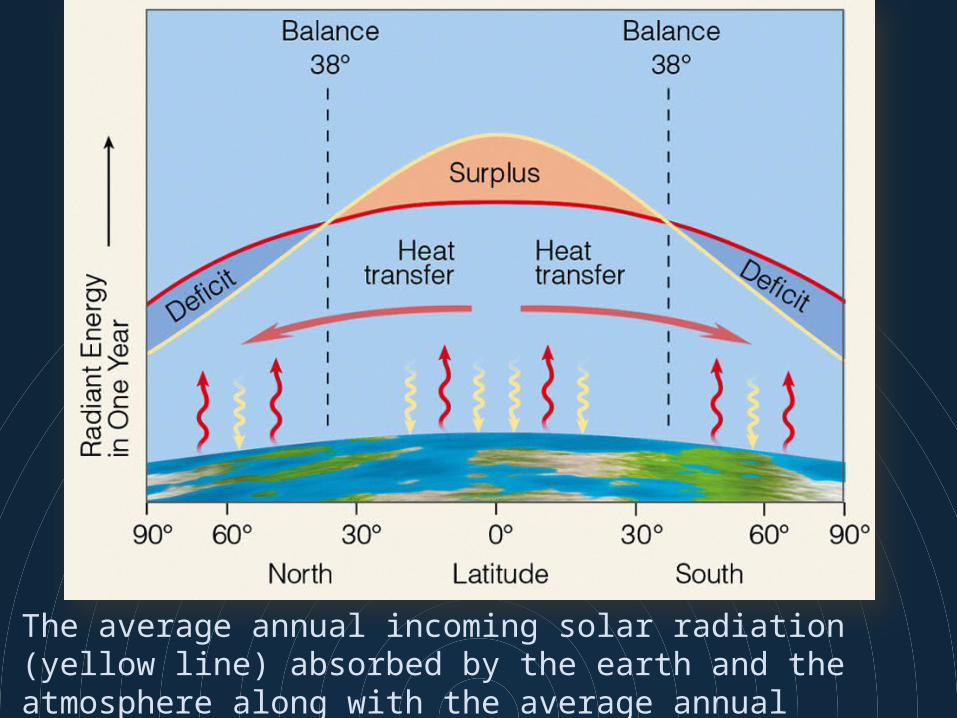
The average annual incoming solar radiation (yellow line) absorbed by the earth and the atmosphere along with the average annual infrared radiation (red line) emitted by the earth and the atmosphere.
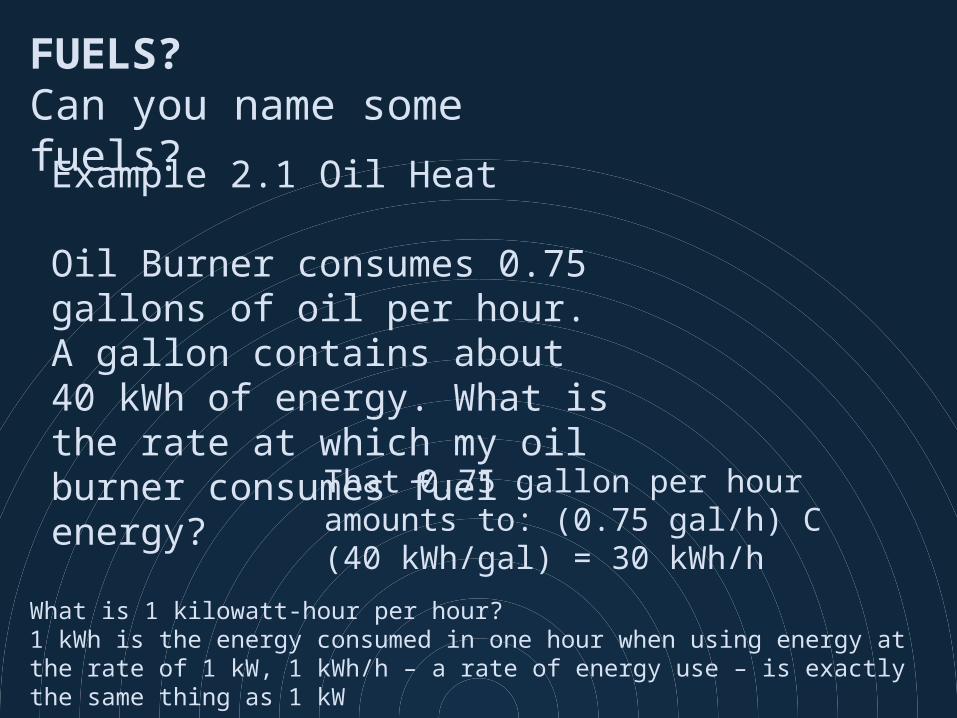
FUELS?Can you name some fuels?
Example 2.1 Oil Heat
Oil Burner consumes 0.75 gallons of oil per hour. A gallon contains about 40 kWh of energy. What is the rate at which my oil burner consumes fuel energy?
That 0.75 gallon per hour amounts to: (0.75 gal/h) C (40 kWh/gal) = 30 kWh/h
What is 1 kilowatt-hour per hour?1 kWh is the energy consumed in one hour when using energy at the rate of 1 kW, 1 kWh/h – a rate of energy use – is exactly the same thing as 1 kW

1.Stand up2.Place your hands on your hips3.Do some deep knee bends until the
guy at the front of the class stops4.Do this at a rate of about one per
second
What is the rate at which you are expending energy (in Watts)? This is the rate at which the typical person can expend energy.
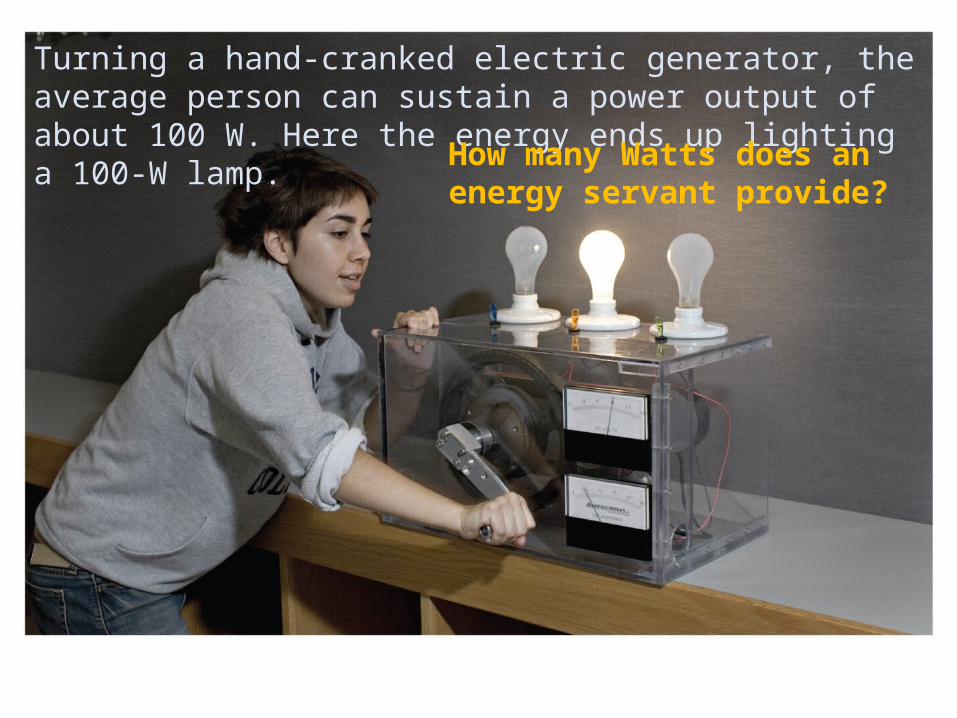
Turning a hand-cranked electric generator, the average person can sustain a power output of about 100 W. Here the energy ends up lighting a 100-W lamp. How many Watts does an energy
servant provide?
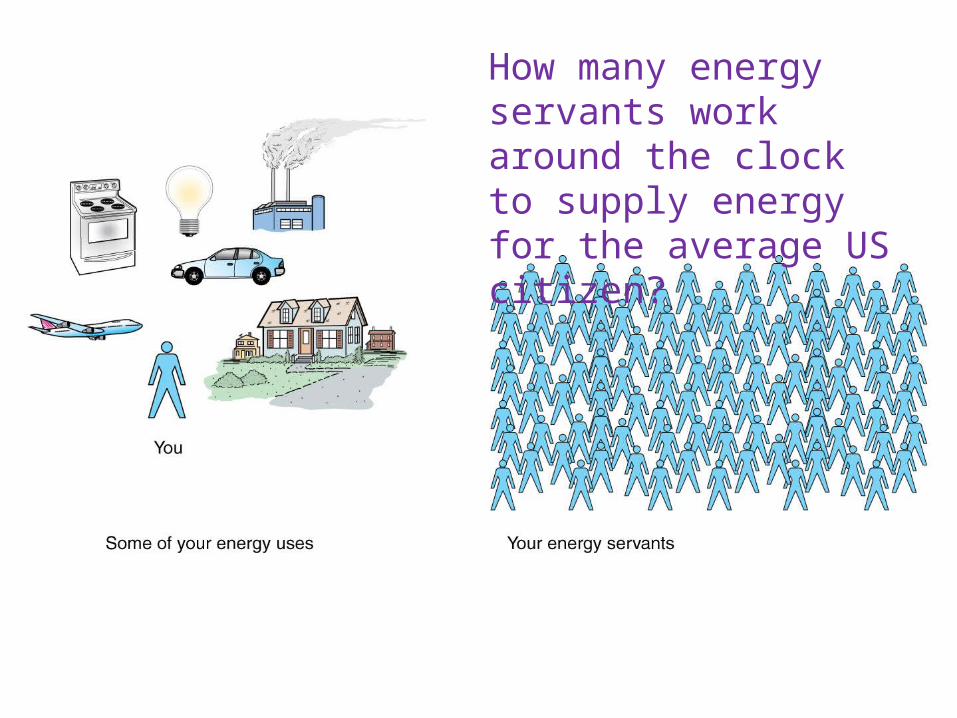
How many energy servants work around the clock to supply energy for the average US citizen?
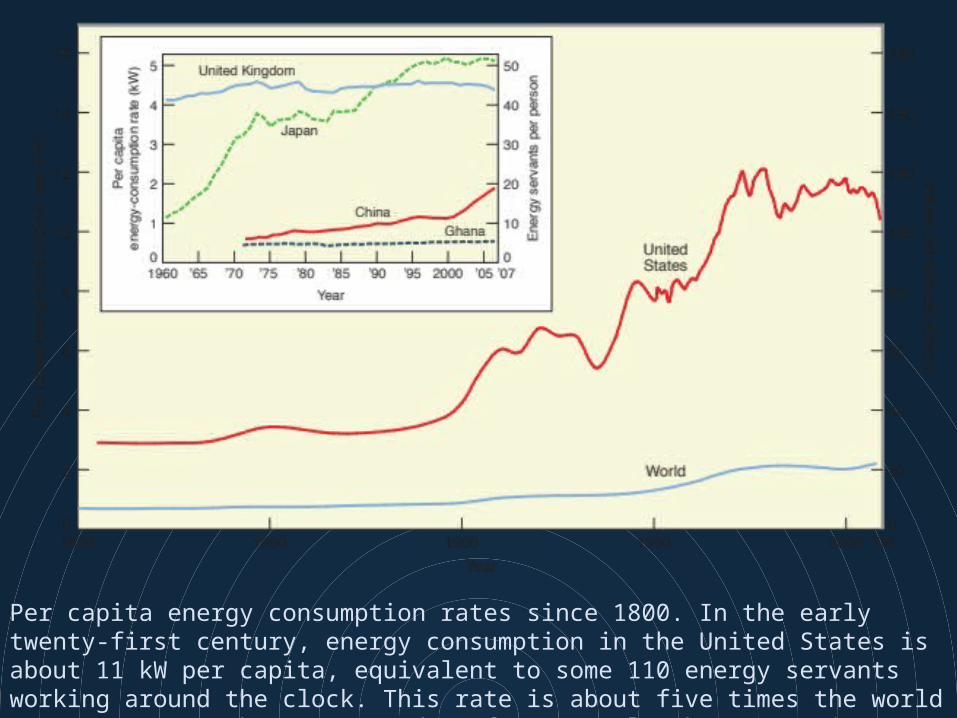
Per capita energy consumption rates since 1800. In the early twenty-first century, energy consumption in the United States is about 11 kW per capita, equivalent to some 110 energy servants working around the clock. This rate is about five times the world average. Inset shows recent data for several other countries.

End-use energy consumption, by sector, for three countries in the early twenty-first century.
Why do these countries have a different breakdown of energy uses?Japan is a compact industrialized country, with a well developed rail system, so uses a greater fraction of its energy for industry than does the USA.
Ghana is a typical developing country and has much smaller industrial and commercial sectors, so devotes most of its limited energy to residential uses.
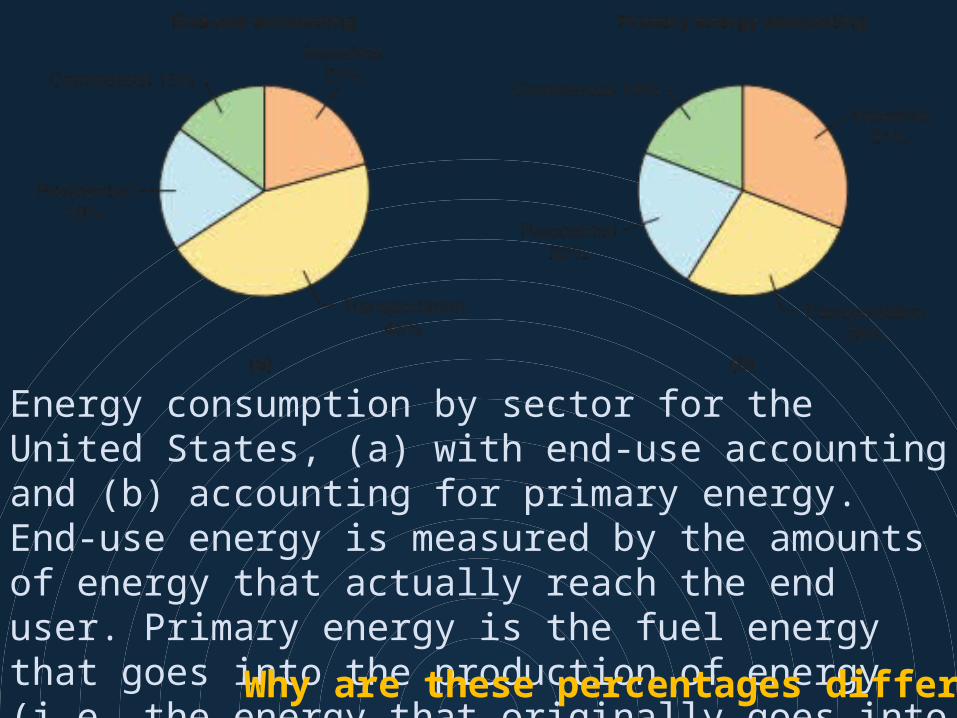
Energy consumption by sector for the United States, (a) with end-use accounting and (b) accounting for primary energy. End-use energy is measured by the amounts of energy that actually reach the end user. Primary energy is the fuel energy that goes into the production of energy (i.e. the energy that originally goes into the power plant).
Why are these percentages different?
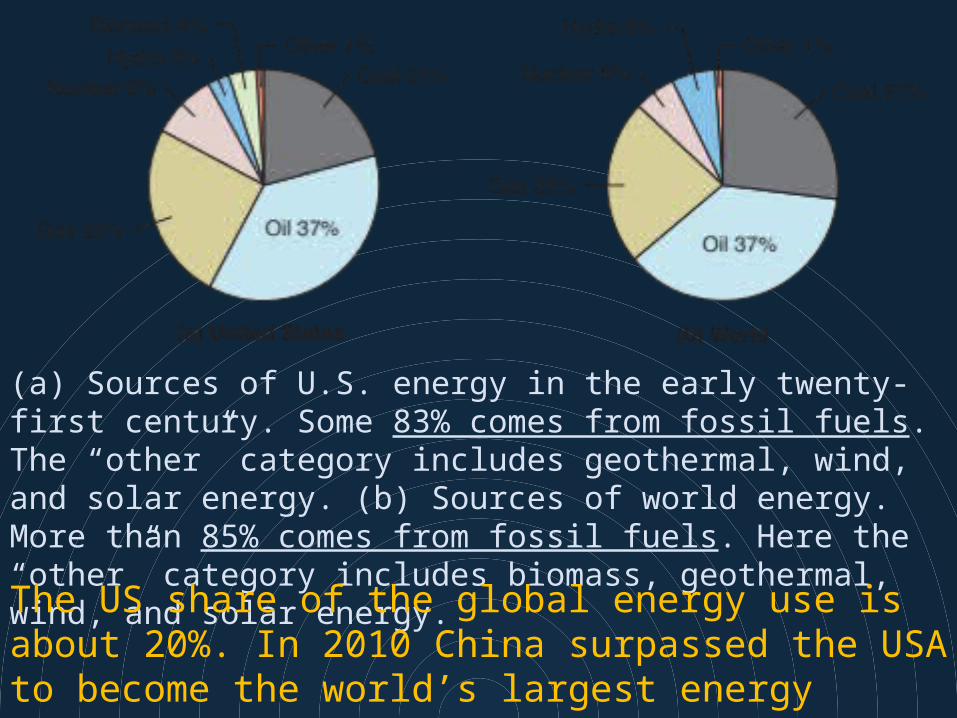
(a) Sources of U.S. energy in the early twenty-first century. Some 83% comes from fossil fuels. The “other” category includes geothermal, wind, and solar energy. (b) Sources of world energy. More than 85% comes from fossil fuels. Here the “other” category includes biomass, geothermal, wind, and solar energy.
The US share of the global energy use is about 20%. In 2010 China surpassed the USA to become the world’s largest energy consumer (though its per capita share is still far lower)
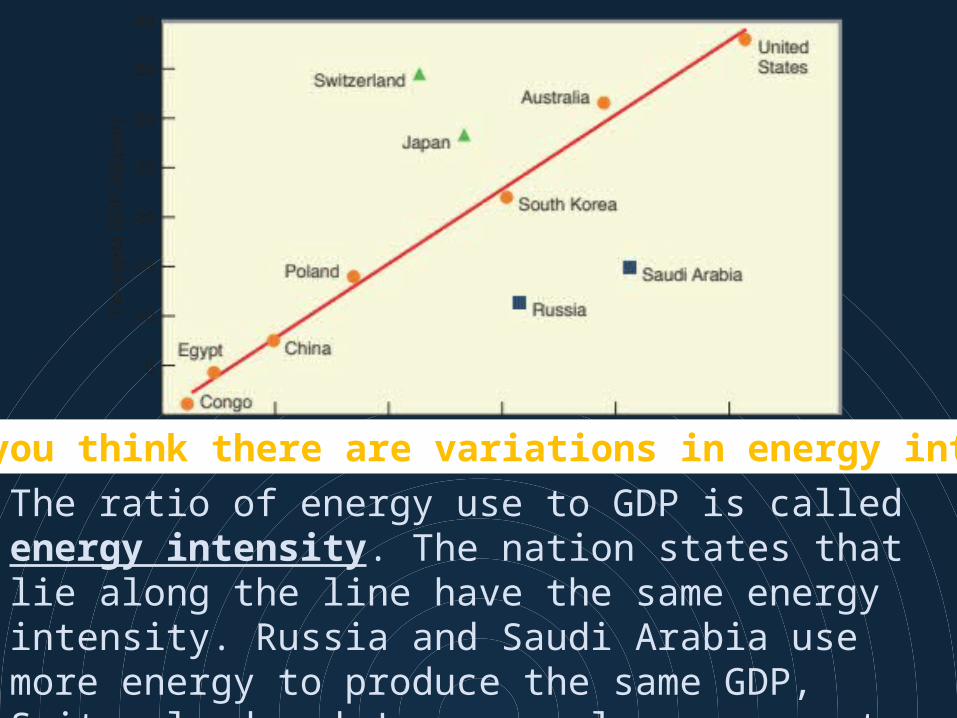
The ratio of energy use to GDP is called energy intensity. The nation states that lie along the line have the same energy intensity. Russia and Saudi Arabia use more energy to produce the same GDP, Switzerland and Japan use less energy to produce the same GDP.
Why do you think there are variations in energy intensity?
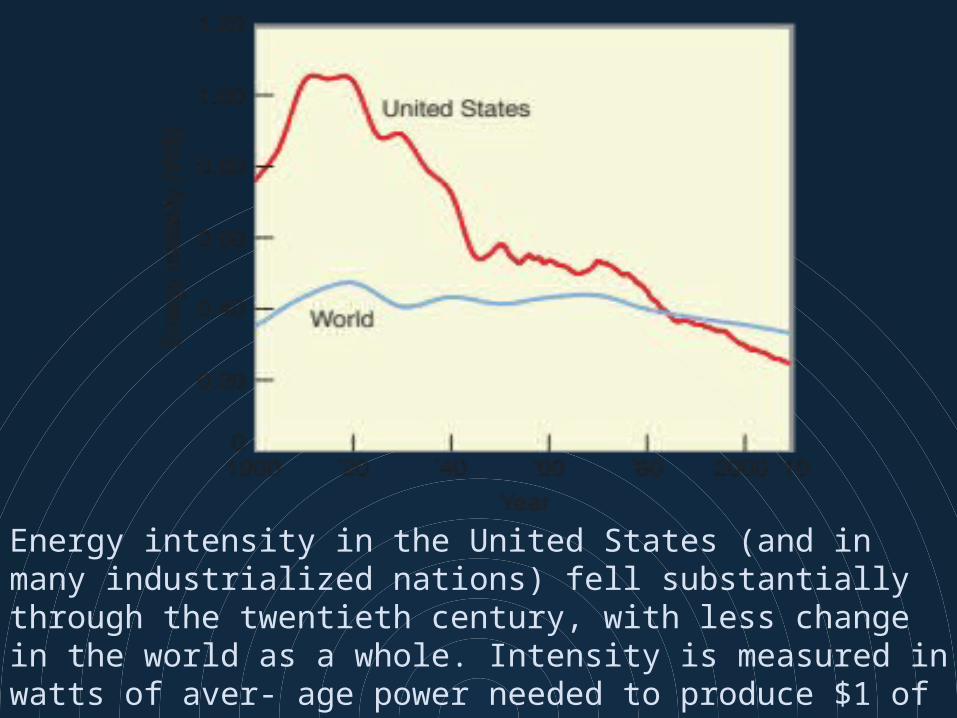
Energy intensity in the United States (and in many industrialized nations) fell substantially through the twentieth century, with less change in the world as a whole. Intensity is measured in watts of aver- age power needed to produce $1 of GDP each year (based on the value of one U.S. dollar in the year 2000).
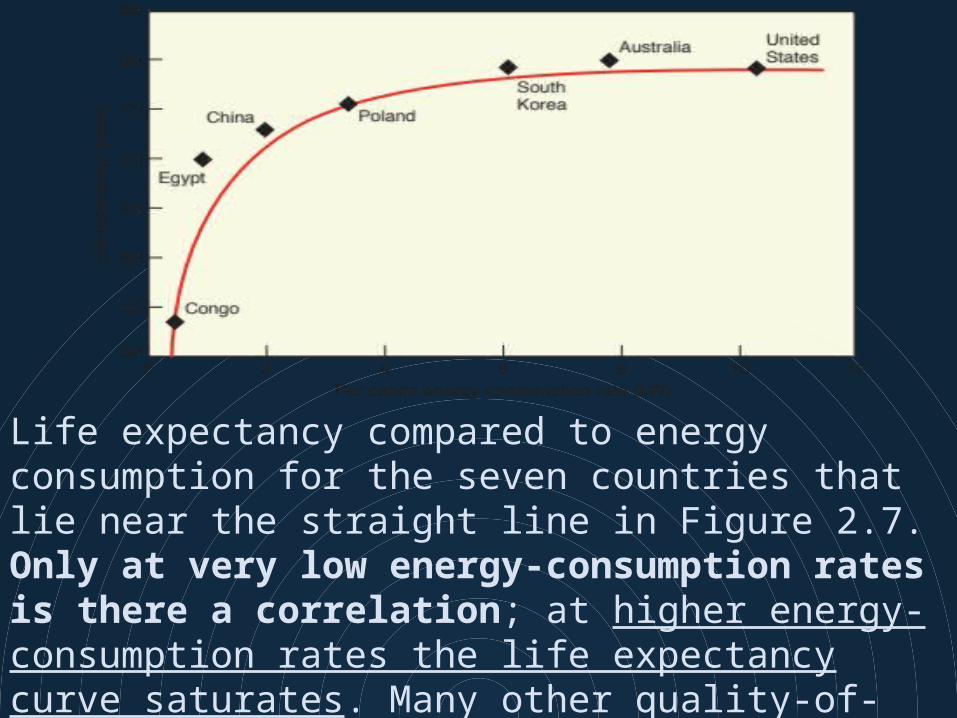
Life expectancy compared to energy consumption for the seven countries that lie near the straight line in Figure 2.7. Only at very low energy-consumption rates is there a correlation; at higher energy-consumption rates the life expectancy curve saturates. Many other quality-of-life indicators show similar behavior in relation to energy consumption.

Class Review:Energy Update!EnergySociety
Next ClassForms of EnergyMaking EnergyQuantifying EnergyWorkFrictionEstimations