Embed Size (px)
Citation preview

ENERGY STATISTICS IN MALAYSIA
NOOR AIZAH A.KARIMHead, Energy Information
Energy Commission [email protected]
The Sixth Oslo Group Meeting on Energy Statistics
Canberra, Australia
2-5 May 2011

OUTLINE
Introduction
Data Collection and Compilation
Energy Balances
Uses of Energy Statistics
Conclusions

INTRODUCTION
Timely and precise reporting of energy database is important for Malaysia, since Malaysia is a rapidly developing country that depends much on energy sources to fuel its economic growth. Understanding the importance of energy database, the Energy Commission, has created a new unit named Energy Information, among others to act as the custodian of energy data for the country and to provide analysis on current energy issues.

• The most frequently used and referred energy database for Malaysia is the National Energy Balance published annually by the Ministry of Energy, Green Technology and Water.
•Previously, the National Energy Balance is compiled by Green Technology Malaysia (formerly known as Malaysia Energy Center) for the Ministry. •However, due to the recent changes in the structure of the Green Technology Malaysia , Energy Commission was mandated by the Ministry to take over the responsibility of preparing the National Energy Balance from year 2010 onwards.
INTRODUCTION

• Also known as Suruhanjaya Tenaga (ST)..\LTST2010\ST Diamond Building
• Statutory body under the Ministry Of Energy, Green Technology and Water Malaysia.
• It was established in 2001 under the Energy Commission Act 2001.
• Regulate the electricity supply industry and piped gas supply industry in the peninsula and Sabah
• Custodian and focal point for Malaysia’s energy data
The Role Of Energy Commission

Related Acts & Regulations
Beside authority granted in the Energy Commission Act (2001) other related acts and regulations are as follow:
• Electricity Supply Act 1990 (Amendment 2001)• Gas Supply Act 1993 (Amendment 2001)• Licensee Supply Regulations 1990 (Amendment 2002)• Electricity Regulations 1994 (Amendment 2003)• Gas Supply Regulations 1997 (Amendment 2000)• Electricity Supply (Compounding of Offences) Regulations 2001• Gas Supply (Compoundable Offences) Order 2006• Gas Supply (Compounding of Offences) Regulations 2006• Efficient Management Of Electrical Energy Regulations 2008

The Roles Of Energy Information Unit
• ..\LTST2010\STRUKTUR ORG ST- 01 November 2010-BMnEng-1.pdf
• To coordinate among relevant authorities and agencies on effective energy data collection.
• To develop energy data base system inclusive reporting and dissemination mechanism
• To produce National Energy Balance report annually . ( 2010 onward )
• To produce statistics books /pamphlet on performance and statistical information for the electricity and gas supply industry in Malaysia.
• To update and maintain the database regularly and to upload some of the information in the Energy Commission’s website and intranet.
• To produce report /analysis on current energy issues.

Energy Policy
The Energy Policies maker:– The Prime Minister’s Department ( Economic
Planning Unit)• On Petroleum (Oil And Gas), Upstream activities • On Privatisation Of Electricity Sector
– The Ministry Of Energy, Green Technogy & Water• On Electricity supply industry.• On Energy efficiency.• On Renewable energy
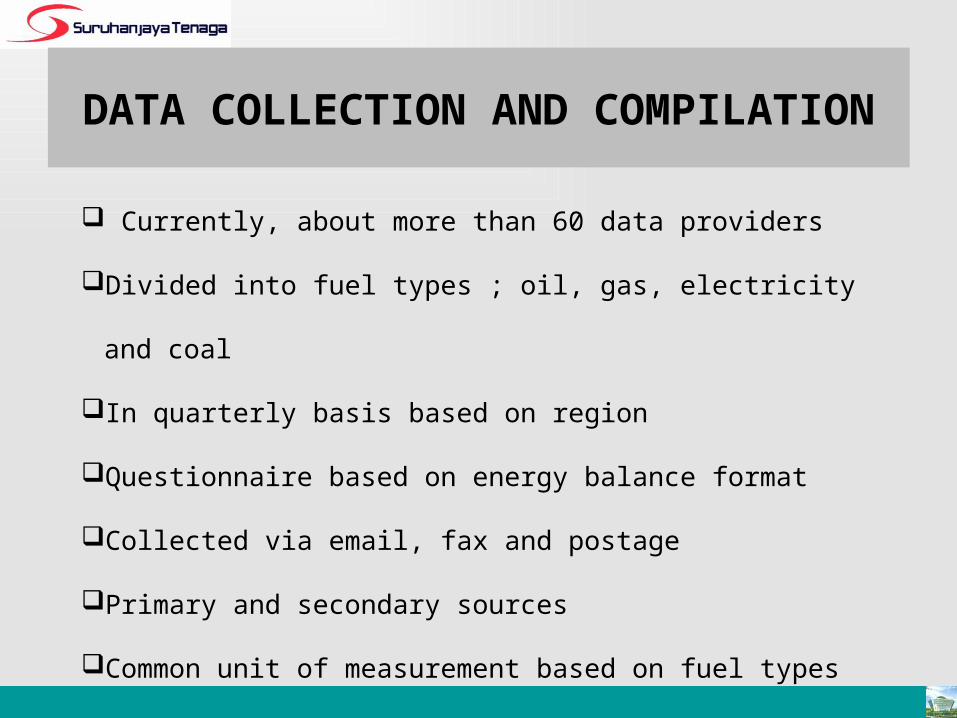
DATA COLLECTION AND COMPILATION
Currently, about more than 60 data providers
Divided into fuel types ; oil, gas, electricity and coal
In quarterly basis based on region
Questionnaire based on energy balance format
Collected via email, fax and postage
Primary and secondary sources
Common unit of measurement based on fuel types

ENERGY BALANCES
Featuring data on Malaysia’s Primary production of energy supply, secondary supply of energy and the final demand of energy.
Structured into 3 main sectors ; Primary supply, Transformation and Final Use.
Energy supply = Production + Imports - Exports - Bunkers +/- Stock change
Energy demand = Gross Inland Consumption = Final Energy Consumption + Consumption
of energy in transformation sector + Distribution losses + Non-energy Consumption

DATA COLLECTION AND COMPILATION
STAGE 1
• Data Collection
• Data Checking
• Data Verification
• Data Analysis
STAGE 2
• Draft Report Preparation
• Internal Screening
• Technical Meeting
STAGE 3
• Amendments• Final Report
Publication• Dissemination

DATA COLLECTION AND COMPILATIONData Providers

• For Oil, Gas and Coal Production• ..\..\Desktop\NEB\National Energy Balance
Form.xls
DATA COLLECTION AND COMPILATIONSample Of Questionnaires

NATIONAL ENERGY BALANCE
ELECTRICITY QUARTER1................2010 A. CONSUMPTION OF ELECTRICITY & NUMBER OF CUSTOMERS BY SECTOR
Sector Consumption
(GWh) Number of Customers
Domestic
Commercial
Industrial
Mining
Transport (KTM, LRT)
Public Lighting
TOTAL
B. UNITS OF ELECTRICITY PURCHASED & SOLD
Country/Utility Quantity (Unit GWh)
Unit Purchased From:
Units Sold to:
1Quarter 1: Total of Jan, Feb, Mar Quarter 2: Total of Apr, May, Jun Quarter 3: Total of Jul,Aug, Sept Quarter 4: Total of Oct, Nov, Dec
DATA COLLECTION AND COMPILATIONSample Of Questionnaires

C. FUEL CONSUMPTION
CONVERSION COEFFICIENTS*
Type of Prime Mover Diesel Oil unit: ..........
Light Fuel Oil unit: ..............
Natural Gas (N cum x 10)
Coal (MT)** type: ………
STEAM Oil
Gas
Coal
HYDRO Major Hydro
Mini Hydro
GAS TURBINE Oil
Gas
COMBINED CYCLE Gas
DIESEL Diesel
TOTAL
*Please specify units used **Please specify type of coal used Unit:
STOCK Opening Closing Local Purchase
Fuel Oil
Diesel
Coal

ElectricityD. UNITS OF ELECTRICITY GENERATED, SENT OUT AND SOLD
UTILITY:
TYPE OF QUARTER1 YEAR: 2010
PRIME MOVER UNITS
GENERATED (GWh) UNIT SOLD
(GWh) UNIT USED BY
STATIONS (GWh) UNIT SENT OUT FROM
STATIONS (GWh) STEAM Oil
Gas
Coal
HYDRO Major Hydro
Mini Hydro
GAS TURBINE Oil
Gas
COMBINED CYCLE Gas
Oil/Diesel
DIESEL SETS Diesel/Oil
OTHER SETS (pls specify)
TOTAL
PURCHASED
1 Quarter 1: Total of Jan, Feb, Mar Quaretr 2: Total of Apr, May, Jun Total Quarter 3: Total of Jul,Aug, Sept Quarter 4: Total of Oct,Nov,Dec
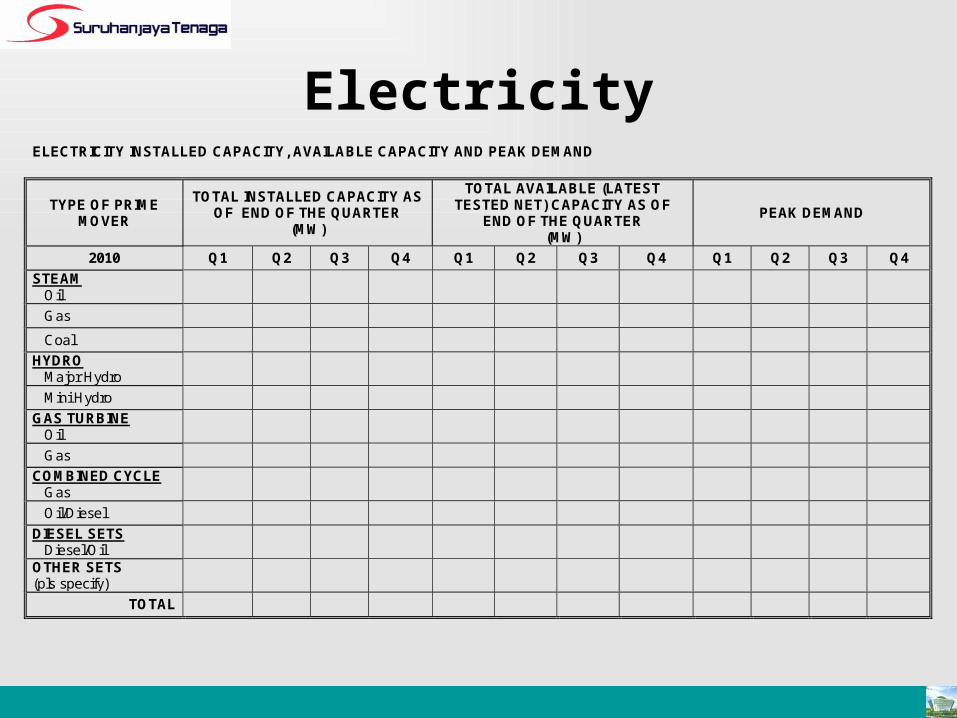
ElectricityELECTRICITY INSTALLED CAPACITY, AVAILABLE CAPACITY AND PEAK DEMAND
TYPE OF PRIME MOVER
TOTAL INSTALLED CAPACITY AS OF END OF THE QUARTER
(MW)
TOTAL AVAILABLE (LATEST TESTED NET) CAPACITY AS OF
END OF THE QUARTER (MW)
PEAK DEMAND
2010 Q1 Q2 Q3 Q4 Q1 Q2 Q3 Q4 Q1 Q2 Q3 Q4
STEAM Oil
Gas
Coal
HYDRO Major Hydro
Mini Hydro
GAS TURBINE Oil
Gas
COMBINED CYCLE Gas
Oil/Diesel
DIESEL SETS Diesel/Oil
OTHER SETS (pls specify)
TOTAL

DATA SUBMISSION FROM TNBElectricity Consumption By Sector
-
5,000
10,000
15,000
20,000
25,000
1Q 2
000
2Q 2
000
3Q 2
000
4Q 2
000
1Q 2
001
2Q 2
001
3Q 2
001
4Q 2
001
1Q 2
002
2Q 2
002
3Q 2
002
4Q 2
002
1Q 2
003
2Q 2
003
3Q 2
003
4Q 2
003
1Q 2
004
2Q 2
004
3Q 2
004
4Q 2
004
1Q 2
005
2Q 2
005
3Q 2
005
4Q 2
005
1Q 2
006
2Q 2
006
3Q 2
006
4Q 2
006
1Q 2
007
2Q 2
007
3Q 2
007
4Q 2
007
1Q 2
008
2Q 2
008
3Q 2
008
4Q 2
008
1Q 2
009
2Q 2
009
3Q 2
009
4Q 2
009
1Q 2
010
2Q 2
010
3Q 2
010
4Q 2
010
Industry Mining Commercial Residential Street Lighting Transport AgricultureGWh

ENERGY BALANCES (Supply)
Oil61%
Natural Gas28%
Coal and Coke7%
Hydropower4%
1990
Oil75%
Natural Gas21%
Coal and Coke0%
Hydropower4%
1980
Oil45%
Natural Gas45%
Coal and Coke6%
Hydropower4%
2000
Oil40%
Natural Gas41%
Coal and Coke16%
Hydropower3%
2009

ENERGY BALANCES (Demand)
Oil87%
Electricity12%
Natural Gas0%
Coal and Coke1%
1980
Oil75%
Electricity13%
Natural Gas8%
Coal and Coke4%
1990
Oil66%
Electricity18%
Natural Gas13%
Coal and Coke3%
2000
Oil59%Electricity
20%
Natural Gas17%
Coal and Coke4%
2009
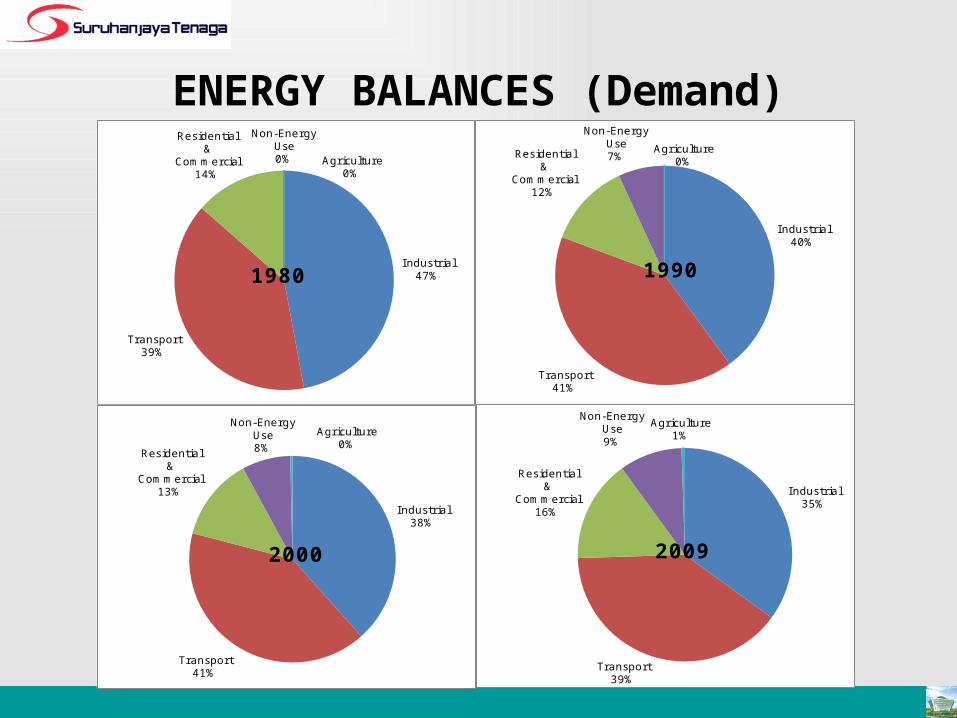
ENERGY BALANCES (Demand)
I ndustrial47%
Transport39%
Residential &
Commercial14%
Non-Energy Use0% Agriculture
0%
1980
I ndustrial40%
Transport41%
Residential &
Commercial12%
Non-Energy Use7%
Agriculture0%
1990
I ndustrial38%
Transport41%
Residential &
Commercial13%
Non-Energy Use8%
Agriculture0%
2000
I ndustrial35%
Transport39%
Residential &
Commercial16%
Non-Energy Use9%
Agriculture1%
2009

How We Disseminate Data?
WEBSITEwww.st.gov.my
PUBLICATION• Annual Energy Balance Report•Statistics Book For Electricity And Gas Industry
INTERNATIONAL ORGANIZATION
PRIVATE COGOVERNMENT AGENCIES
INTERNET VIA E-MAIL

NATIONAL ENERGY BALANCE
6th OSLO GROUP MEETING\NEB 2009-Second Draft_NEW_.pdf

STATISTICS BOOKPERFORMANCE AND STATISTICAL INFORMATION FOR ELECTRICITY SUPPLY INDUSTRY IN MALAYSIA

DATA DISSEMINATIONNEB & STATISTICS PUBLICATION
• NEB Data Providers• Selected Government Agencies• All Public Universities• Selected Public Libraries• Selected Individuals • Selected International Bodies /
Organizations

DATA DISSEMINATION TO INTERNATIONAL ORGANIZATIONS
• APEC - Annual and Quarterly Data Submission• IEA - Annual Data Submission• UN - Annual Data Submission• Monthly Data Submission Of Joint Organization
Data Initiative (JODI) Oil and JODI Gas to APEC
UN

USES OF ENERGY STATISTICS
Energy Statistics
Energy Indicators
• Social• Economic• Environment
Greenhouse Gas Emission• IPCC
Guidelines• GHG
Inventory
Energy Outlook
• National Energy Policy
• ASEAN Energy Outlook
• Mitigation NC2

THE USERS OF ENERGY STATISTICS

CONCLUSIONS
• Complete and timely energy database is important for preparation of better energy analysis and also to ensure the appropriate policy direction and decisions could be made to respond to current energy situations.
• However, previous National Energy Balance table does not contain detail of energy consumption for each subsectors, thus there is a need to relook at the current National Energy Balance structure and to see the possibility of carrying out sampling methods to obtain detail energy consumption data, i.e. for the industry sector and the residential and commercial sector.

THANK YOU
ENERGY COMMISSION, DIOMAND BUILDING PUTRAJAYA


![Energy Statistics in Malaysia[1]](https://img.pdfslide.us/doc/110x75/577d1eed1a28ab4e1e8f8c8b/energy-statistics-in-malaysia1.jpg)