Embed Size (px)
Citation preview

ENERGY SECTOR
Analysts: Brandon HarlowTaylor HortonYanbing Ji

Agenda• Sector Overview• Business Analysis• Economic Analysis• Financial Analysis• Valuation Analysis• Recommendation

SECTOR OVERVIEWSector WeightsSub-SectorsKey Players

Energy Sector Weights
Consumer Discretionary
13%
Consumer Staples9%
Energy7%
Financials17%
Healthcare15%
Industrials10%
Information Technology
21%
Materials3%
Telecommunication Services
2%
Utilities3%
Cash0%
S&P 500 SECTOR WEIGHTS
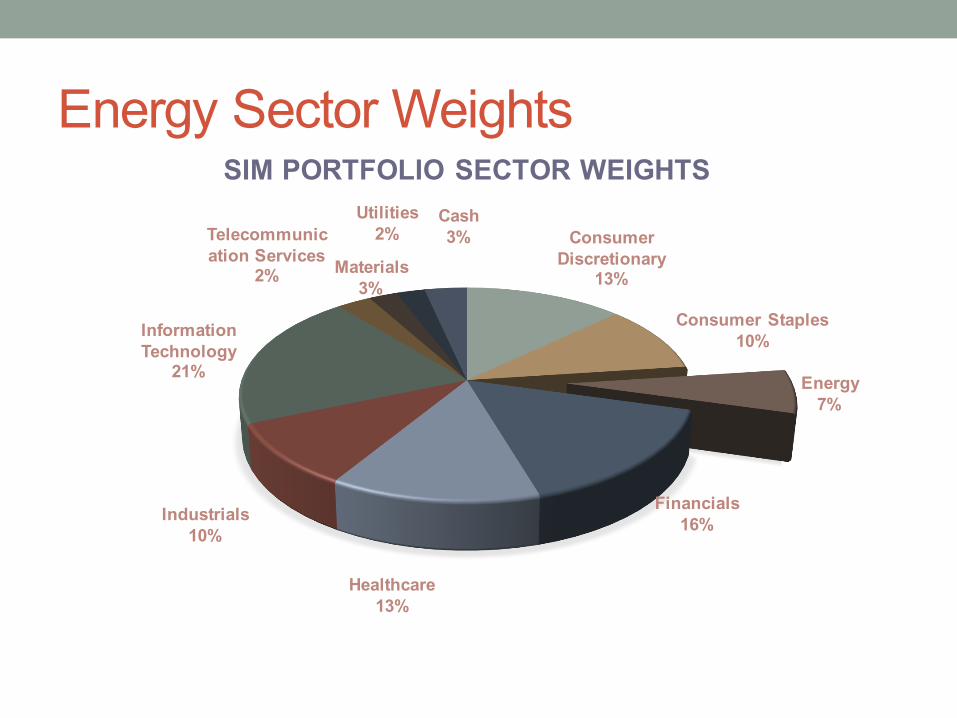
Energy Sector Weights
Consumer Discretionary
13%
Consumer Staples10%
Energy7%
Financials16%
Healthcare13%
Industrials10%
Information Technology
21%
Materials3%
Telecommunication Services
2%
Utilities2%
Cash3%
SIM PORTFOLIO SECTOR WEIGHTS

Energy Sub-Sector WeightsOil & Gas Refining
& Marketing 46%
Integrated Oil & Gas35%
Oil Related Services & Equipment
9%
Oil & Gas Exploration &
Production8%
Oil & Gas Drilling1%
Coal1%
Key Players
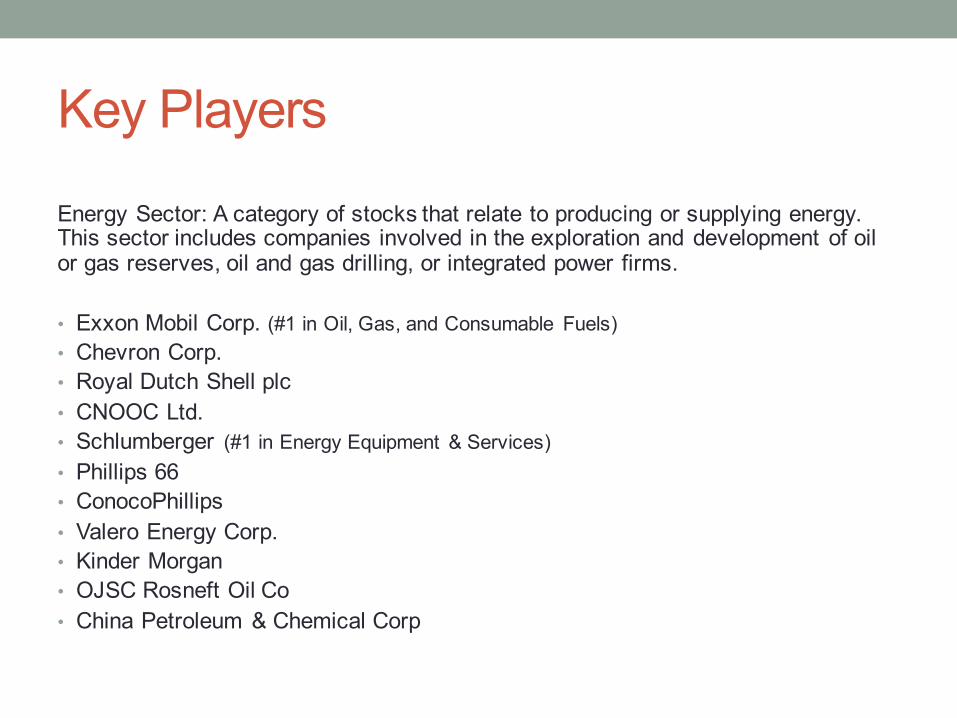
Energy Sector: A category of stocks that relate to producing or supplying energy. This sector includes companies involved in the exploration and development of oil or gas reserves, oil and gas drilling, or integrated power firms.
• Exxon Mobil Corp. (#1 in Oil, Gas, and Consumable Fuels)• Chevron Corp.• Royal Dutch Shell plc• CNOOC Ltd.• Schlumberger (#1 in Energy Equipment & Services)• Phillips 66• ConocoPhillips• Valero Energy Corp.• Kinder Morgan• OJSC Rosneft Oil Co• China Petroleum & Chemical Corp

BUSINESS ANALYSISBusiness Cycle
External Factors & Risks
Producers & Consumers
Industry Analysis

Business Cycle
External Factors & Risks• Global Political Risks• Global Political Relations affect sourcing & prices• Regulatory & Legislative changes affecting cost of
compliance• Volatile oil & gas prices• Operational Hazards and liability• Natural disasters and weather conditions• Environmental or heath restrictions and regulations• Industry Competition (substitutes)
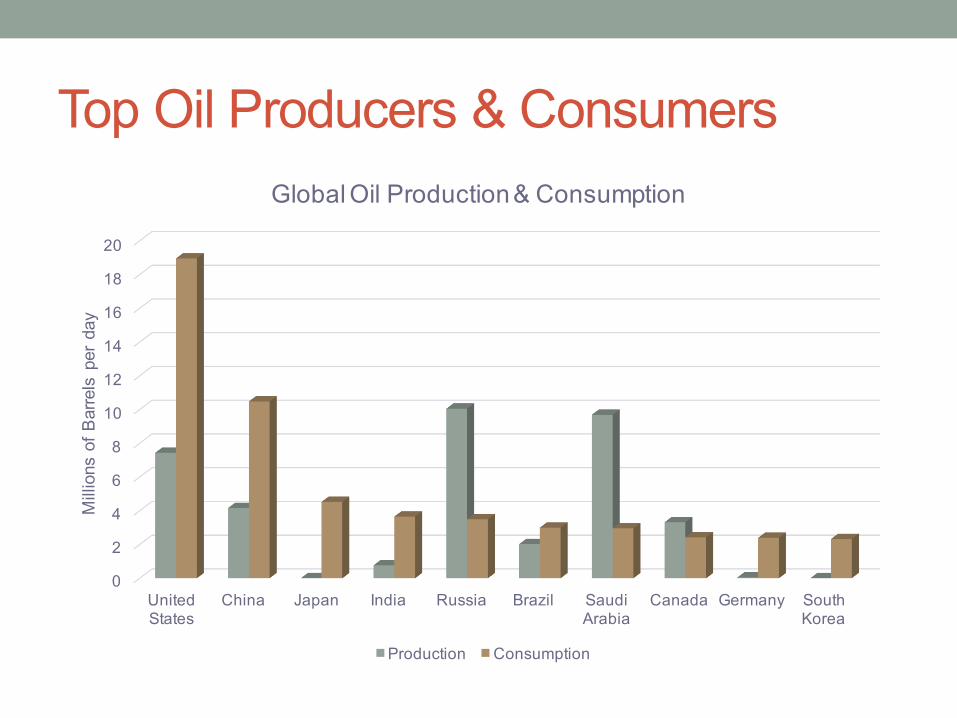
Top Oil Producers & Consumers
0
2
4
6
8
10
12
14
16
18
20
United States
China Japan India Russia Brazil Saudi Arabia
Canada Germany South Korea
Mill
ions
of B
arre
ls p
er d
ay
Global Oil Production & Consumption
Production Consumption
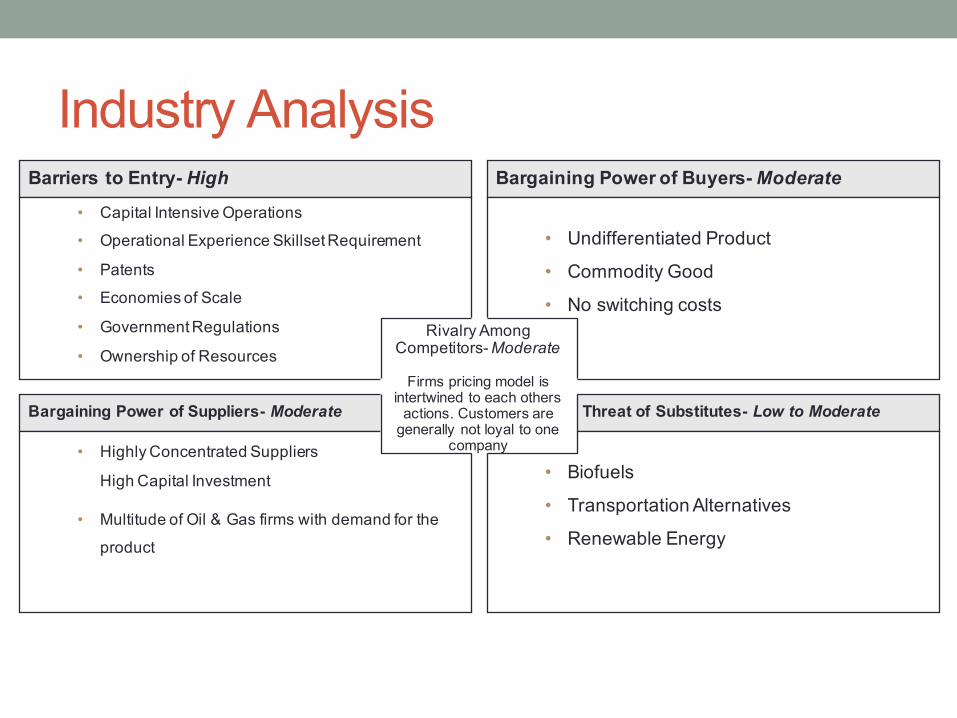
Industry AnalysisBarriers to Entry- High
• Capital Intensive Operations
• Operational Experience Skillset Requirement
• Patents
• Economies of Scale
• Government Regulations
• Ownership of Resources
Bargaining Power of Suppliers- Moderate
• Highly Concentrated Suppliers
High Capital Investment
• Multitude of Oil & Gas firms with demand for the
product
Bargaining Power of Buyers- Moderate
• Undifferentiated Product
• Commodity Good
• No switching costs
Threat of Substitutes- Low to Moderate
• Biofuels
• Transportation Alternatives
• Renewable Energy
Rivalry Among Competitors-Moderate
Firms pricing model is intertwined to each others
actions. Customers are generally not loyal to one
company
ECONOMIC ANALYSISPrimary Economic FactorsCorrelation with Oil PricesRegression Analysis

Primary Economic Driver
• Population growth
• Infrastructure investment
• applications of energy saving
Demand
• Available technology
• Geographic and climate factor
• geopolitical turmoil
Supply
• Electricity supply
• Regulation
Energy Prices
Economic Growth
GDP growth Inflation rate
Automobile industry US export growth
Industrial output

Correlation Between S5ENRS & Oil Prices

Regression Analysis

FINANCIAL ANALYSIS Price RangeSales GrowthGross MarginsProfit MarginsOperating marginsROE,ROA
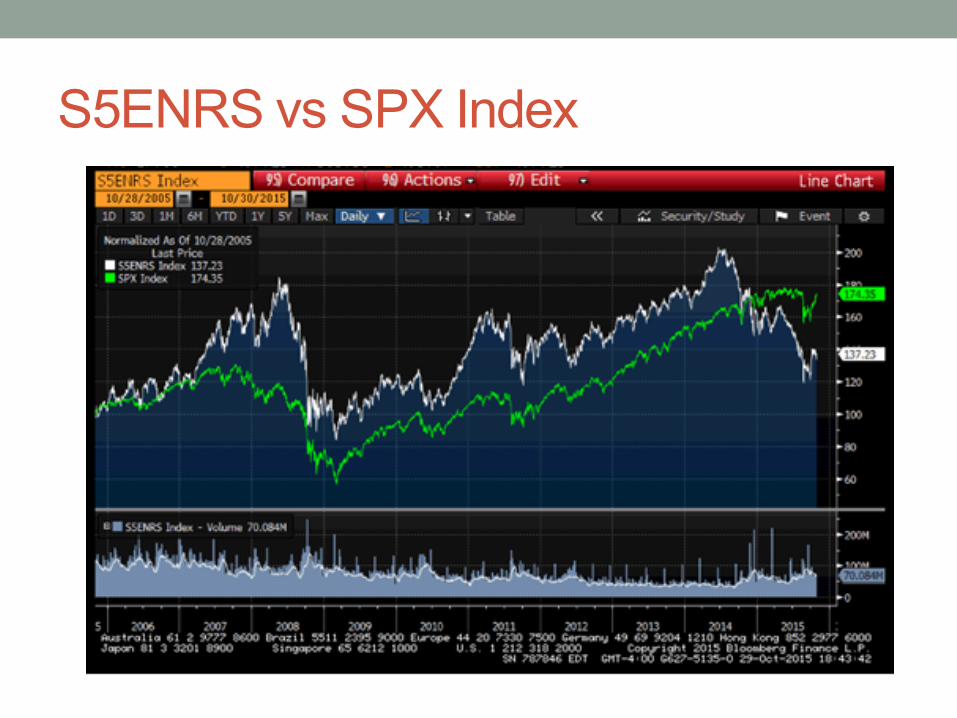
S5ENRS vs SPX Index

S5ENRS vs SPX Index-Sales

S5ENRS Index vs SPX Index--EPS
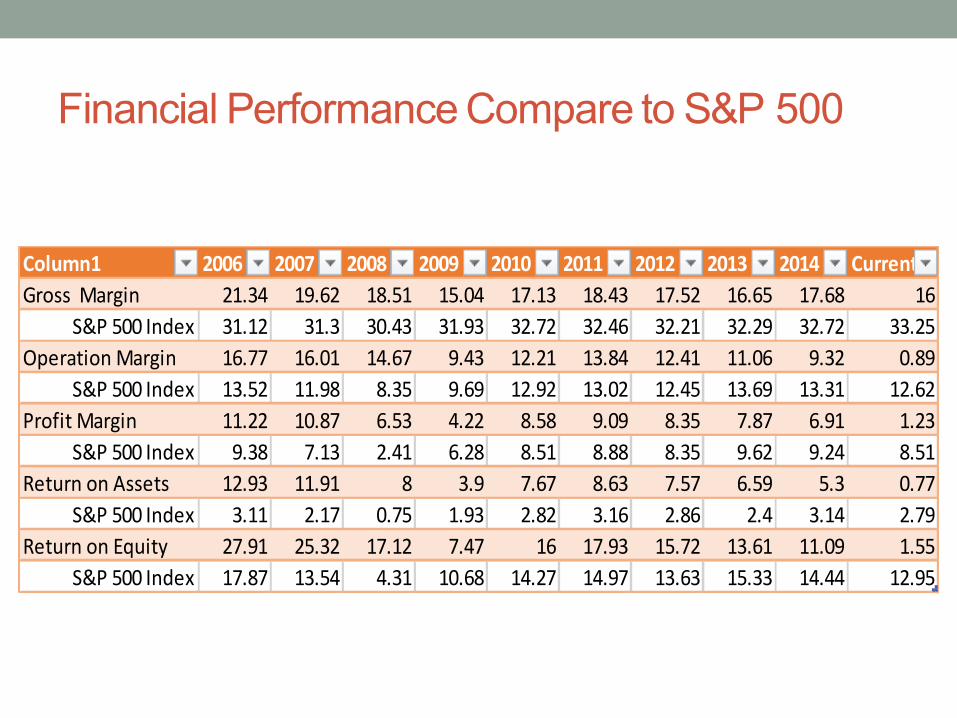
Financial Performance Compare to S&P 500
Column1 2006 2007 2008 2009 2010 2011 2012 2013 2014 CurrentGrossMargin 21.34 19.62 18.51 15.04 17.13 18.43 17.52 16.65 17.68 16
S&P500Index 31.12 31.3 30.43 31.93 32.72 32.46 32.21 32.29 32.72 33.25OperationMargin 16.77 16.01 14.67 9.43 12.21 13.84 12.41 11.06 9.32 0.89
S&P500Index 13.52 11.98 8.35 9.69 12.92 13.02 12.45 13.69 13.31 12.62ProfitMargin 11.22 10.87 6.53 4.22 8.58 9.09 8.35 7.87 6.91 1.23
S&P500Index 9.38 7.13 2.41 6.28 8.51 8.88 8.35 9.62 9.24 8.51ReturnonAssets 12.93 11.91 8 3.9 7.67 8.63 7.57 6.59 5.3 0.77
S&P500Index 3.11 2.17 0.75 1.93 2.82 3.16 2.86 2.4 3.14 2.79ReturnonEquity 27.91 25.32 17.12 7.47 16 17.93 15.72 13.61 11.09 1.55
S&P500Index 17.87 13.54 4.31 10.68 14.27 14.97 13.63 15.33 14.44 12.95

VALUATIONReturnsMultiplesIndustriesTechnical

Return on Equity

Returns
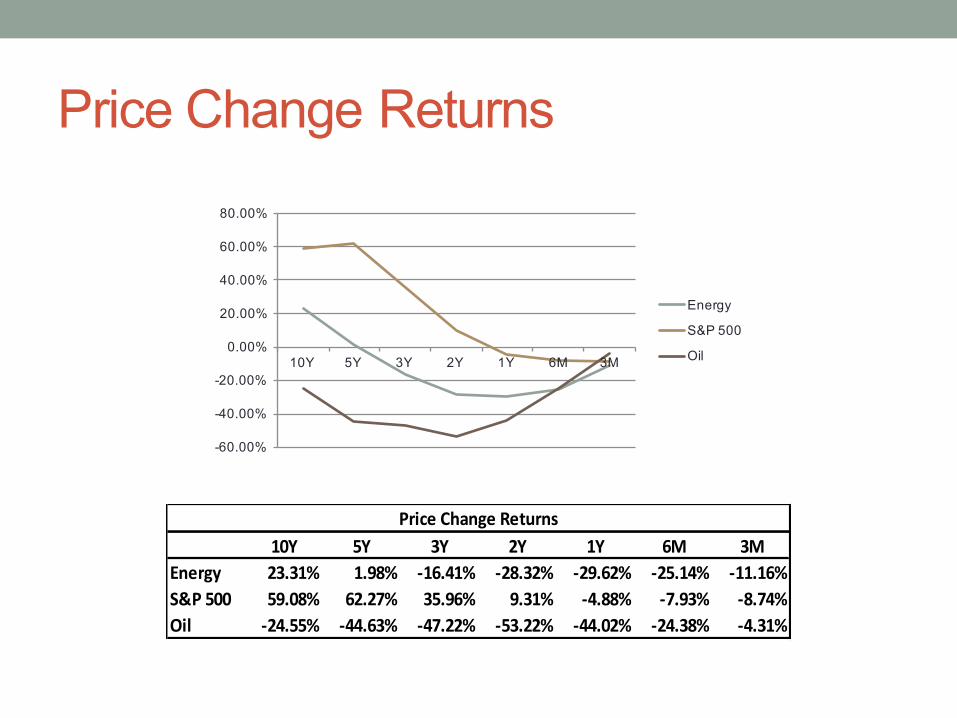
Price Change Returns
10Y 5Y 3Y 2Y 1Y 6M 3MEnergy 23.31% 1.98% -16.41% -28.32% -29.62% -25.14% -11.16%S&P500 59.08% 62.27% 35.96% 9.31% -4.88% -7.93% -8.74%Oil -24.55% -44.63% -47.22% -53.22% -44.02% -24.38% -4.31%
PriceChangeReturns
-60.00%
-40.00%
-20.00%
0.00%
20.00%
40.00%
60.00%
80.00%
10Y 5Y 3Y 2Y 1Y 6M 3M
Energy
S&P 500
Oil
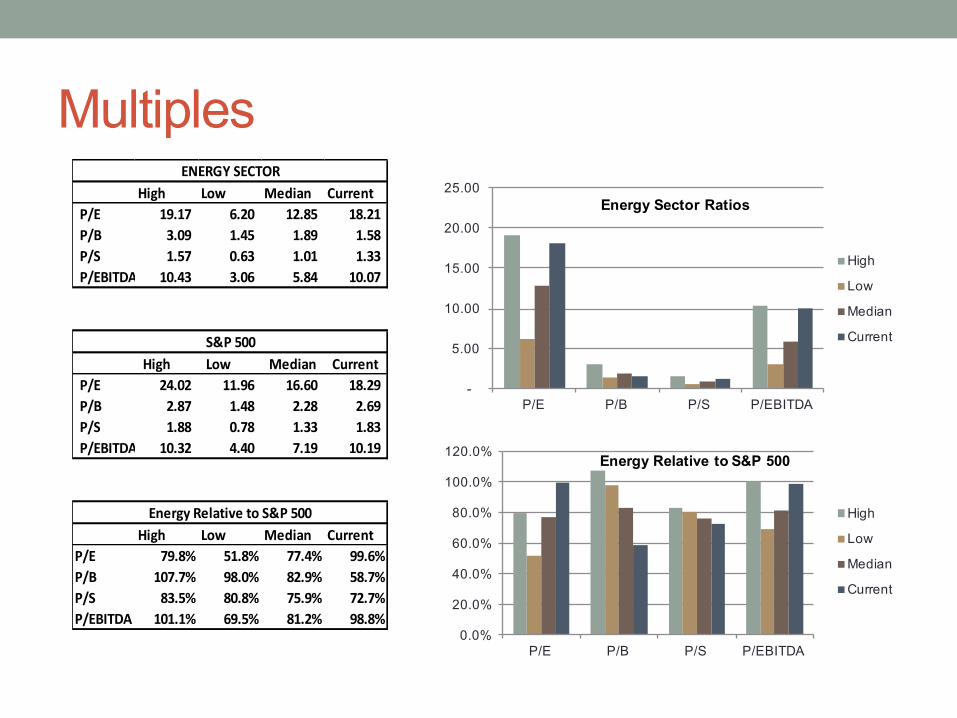
MultiplesHigh Low Median Current
P/E 19.17 6.20 12.85 18.21P/B 3.09 1.45 1.89 1.58P/S 1.57 0.63 1.01 1.33P/EBITDA 10.43 3.06 5.84 10.07
High Low Median CurrentP/E 24.02 11.96 16.60 18.29P/B 2.87 1.48 2.28 2.69P/S 1.88 0.78 1.33 1.83P/EBITDA 10.32 4.40 7.19 10.19
High Low Median CurrentP/E 79.8% 51.8% 77.4% 99.6%P/B 107.7% 98.0% 82.9% 58.7%P/S 83.5% 80.8% 75.9% 72.7%P/EBITDA 101.1% 69.5% 81.2% 98.8%
ENERGYSECTOR
S&P500
EnergyRelativetoS&P500
-
5.00
10.00
15.00
20.00
25.00
P/E P/B P/S P/EBITDA
High
Low
Median
Current
Energy Sector Ratios
0.0%
20.0%
40.0%
60.0%
80.0%
100.0%
120.0%
P/E P/B P/S P/EBITDA
High
Low
Median
Current
Energy Relative to S&P 500

Energy Ratios
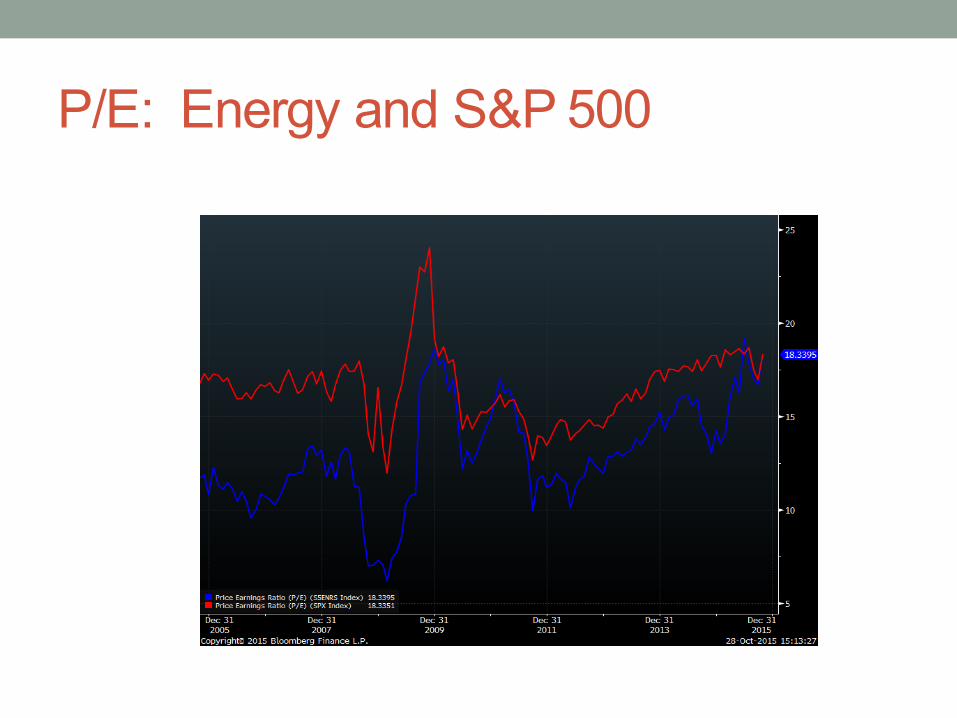
P/E: Energy and S&P 500

P/S: Energy and S&P 500
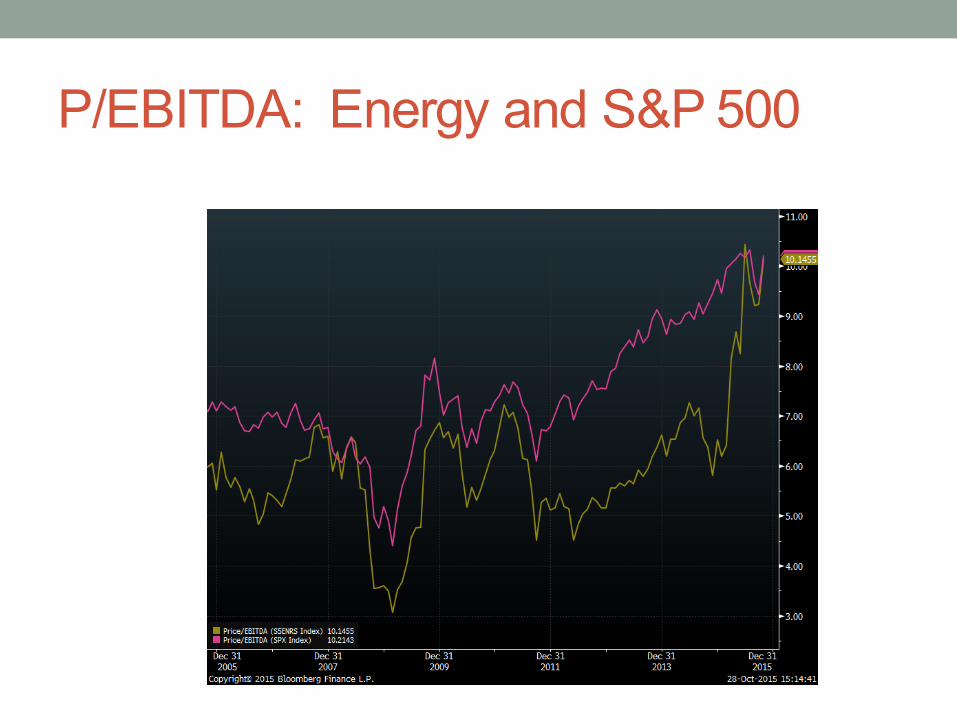
P/EBITDA: Energy and S&P 500
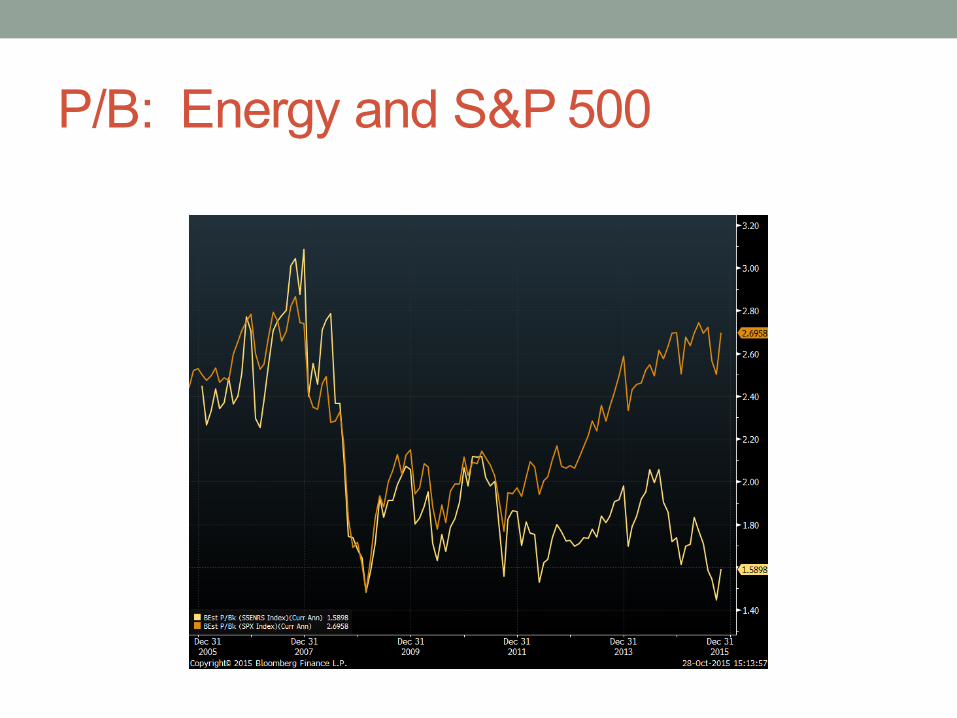
P/B: Energy and S&P 500

IndustriesIndustry Ratio RelativetoEnergySector RelativetoS&P500Oil&GasDrilling 4.62 0.25 0.25Coal&CombustibleFuels 39.75 2.18 2.17IntegratedOil&Gas 15.11 0.83 0.83Oil&GasEquipmentServices 17.54 0.96 0.96Oil&GasExploration&Production 72.76 4.00 3.98Oil&GasStorage&Transportation 25.3 1.39 1.38Oil&GasRefining&Marketing 10.14 0.56 0.55
Industry Ratio RelativetoEnergySector RelativetoS&P500Oil&GasDrilling 0.57 0.36 0.21Coal&CombustibleFuels 0.35 0.22 0.13IntegratedOil&Gas 1.59 1.01 0.59Oil&GasEquipmentServices 1.89 1.20 0.70Oil&GasExploration&Production 1.4 0.89 0.52Oil&GasStorage&Transportation 2.19 1.39 0.81Oil&GasRefining&Marketing 1.88 1.19 0.70
IndustriesP/E
IndustriesP/B
Industry Ratio RelativetoEnergySector RelativetoS&P500Oil&GasDrilling 1.18 0.89 0.64Coal&CombustibleFuels 0.54 0.41 0.30IntegratedOil&Gas 1.4 1.05 0.77Oil&GasEquipmentServices 1.79 1.35 0.98Oil&GasExploration&Production 2.53 1.90 1.38Oil&GasStorage&Transportation 1.85 1.39 1.01Oil&GasRefining&Marketing 0.38 0.29 0.21
Industry Ratio RelativetoEnergySector RelativetoS&P500Oil&GasDrilling 79.22 7.87 7.77Coal&CombustibleFuels 12.29 1.22 1.21IntegratedOil&Gas 8.14 0.81 0.80Oil&GasEquipmentServices 10.26 1.02 1.01Oil&GasExploration&Production 89.59 8.90 8.79Oil&GasStorage&Transportation 9.34 0.93 0.92Oil&GasRefining&Marketing 5.09 0.51 0.50
IndustriesP/S
IndustriesP/EBITDA

Industries
Industry P/E P/B P/S P/EBITDAOil&GasDrilling 4.62 0.57 1.18 79.22Coal&CombustibleFuels 39.75 0.35 0.54 12.29IntegratedOil&Gas 15.11 1.59 1.4 8.14Oil&GasEquipmentServices 17.54 1.89 1.79 10.26Oil&GasExploration&Production 72.76 1.4 2.53 89.59Oil&GasStorage&Transportation 25.3 2.19 1.85 9.34Oil&GasRefining&Marketing 10.14 1.88 0.38 5.09

Bollinger Bands – 1 Year
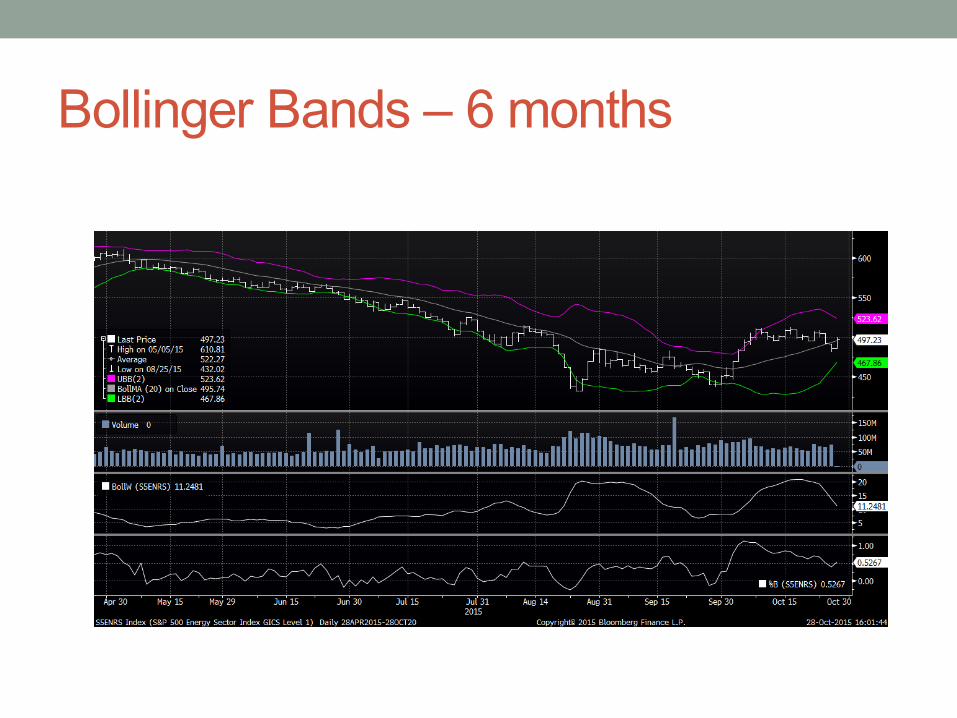
Bollinger Bands – 6 months
Recommendation
• Market weight
• Oil volatility
• Currently stabilizing or on upswing
• May have missed bottom
• Difficult to predict oil
• May take years for prices to rise to previous level

WHAT QUESTIONS DO YOU HAVE?