Embed Size (px)
Citation preview

Energy Management Guideline
Alan Brent, Nadia Sanetra and Cebo Silinga
30 October 2014
Full Title of Report Energy Management Guidelines for South African Wineries
Client Winetech
Client contact person with contact detail
Anel Andrag
Manager: WINETECH
Tel: +27 21 8073387
e-mail: [email protected]
CRSES Project Leader with contact detail
Prof Alan Brent
Centre for Renewable and Sustainable Energy Studies
Faculty of Engineering
UNIVERSITEIT STELLENBOSCH UNIVERSITY
e-mail: [email protected]
Author/s Prof Alan Brent, Nadia Sanetra and Cebo Silinga
Researcher/s Nadia Sanetra and Cebo Silinga
Project Dates Start: January 2013 End: December 2014
Report Versions and Dates
Version:02 Date:29 October 2013
CRSES Project No CRSES 1234 Stellenbosch University No
S000012
Brief project description Development of an energy management guideline based on the principles of ISO50001. Illustrate the impact of potential energy savings opportunities in financial and carbon emission equivalent at four wineries.
Key findings Opportunities exist within the wine industry to lower carbon emissions by saving energy through applying the principles of ISO50001 and implementing an Energy Management System (EnMS).
Keywords Energy Management System, Wineries,
Approval Project leader:
Reviewer:
Director:

i
ACKNOWLEDGEMENTS AND BACKGROUND
This energy management guideline was commissioned by Winetech, in collaboration with the Centre
for Renewable and Sustainable Energy Studies (CRSES) at Stellenbosch University, with the aim to
support the South African wine industry to improve energy performances and energy efficiencies,
while supporting the goals of the Confronting Climate Change project.
The guideline is based on the principles of the ISO 50001 standard for Energy Management Systems
and draws on energy guidelines from other wine industries; in Australia, the United States, the
European Union, and England. The practical examples that are contained within the guideline are
derived from energy audits that were conducted at various wineries in the Western Cape Province.
We would like to acknowledge the following authors and contributors: Bill Meffert and Liam
Mclaughlin for UNIDO and the Industrial Energy Efficiency Project (IEEP) hosted by the National
Cleaner Production of South Africa (NCPC-SA) as well as the CSIR. Also, we would like to
acknowledge the contributions of Koos Bouwer and Barry Platt in their capacity as national experts
in energy management systems and systems optimisation respectively.

ii
CONTENTS
1 Introduction .................................................................................................................................... 1
1.1 Purpose of the document .......................................................................................................... 1
1.2 Why is Energy Management important? ................................................................................... 1
1.2.1 Rising cost of Electricity ...................................................................................................... 1
1.2.2 Climate change ................................................................................................................... 2
1.2.3 Political landscape .............................................................................................................. 2
1.2.4 Consumer awareness ......................................................................................................... 2
1.2.5 Competitive advantage ...................................................................................................... 2
1.3 Best Practice Energy Management ............................................................................................ 3
2 EnMS Principles ............................................................................................................................... 4
2.1 Principle #1: Secure commitment from top management ........................................................ 4
2.2 Principle #2: There’s no ‘I’ in team – The importance of an Energy Team ................................ 5
2.3 Principle #3: You can’t manage what you don’t measure ......................................................... 5
2.4 Principle #4: The 80/20 Pareto Rule – Significant Energy Uses (SEU’s) ..................................... 5
2.5 Principle #5: Keep the momentum going – the value of communication ................................. 5
3 Energy Management System (EnMS) Steps .................................................................................... 6
3.1 Before you start – preparation and commitment actions ......................................................... 6
3.1.1 Determine the scope and boundaries of the EnMS ........................................................... 6
3.1.2 Do I have the commitment from top management? ......................................................... 6
3.1.3 Who will be included in the Energy Team? ........................................................................ 7
3.2 Plan ............................................................................................................................................. 8
3.2.1 Develop baseline and indicators ........................................................................................ 8
3.3 Do – Implementation and Operation ......................................................................................... 9
3.3.1 Communication .................................................................................................................. 9
3.4 Check ........................................................................................................................................ 10
3.4.1 Check Operations ............................................................................................................. 11

iii
3.4.2 Check the System ............................................................................................................. 11
3.4.3 Check Performance .......................................................................................................... 11
3.5 Act – Management Review ...................................................................................................... 11
3.5.1 Regular reviews ................................................................................................................ 12
3.5.2 How are we doing? ........................................................................................................... 12
3.6 What is the plan for the next period? ...................................................................................... 12
4 Case Studies .................................................................................................................................. 13
4.1 How much energy am I using? ................................................................................................. 13
4.2 Am I on a suitable tariff? .......................................................................................................... 14
4.3 Where am I using the most energy? ........................................................................................ 15
4.4 Which are significant energy users? ........................................................................................ 16
4.5 What are the best opportunities? ............................................................................................ 17
5 Case Study 1 .................................................................................................................................. 18
5.1 The background of the case study ........................................................................................... 18
5.2 Identification of Energy Minimisation Opportunities .............................................................. 18
5.2.1 Chilled Water System and Refrigeration .......................................................................... 18
5.2.2 Optimising the Existing Chilled Water System ................................................................. 19
5.2.3 Refrigeration ..................................................................................................................... 21
5.2.4 Plant equipment (Improved Pump Control) ..................................................................... 21
5.2.5 Compressed Air System .................................................................................................... 24
5.2.6 Optimising the existing compressed air system ............................................................... 26
5.3 Cost Saving Opportunities ........................................................................................................ 31
6 Case Study 2 .................................................................................................................................. 33
6.1 Background .............................................................................................................................. 33
6.2 Consumption Data ................................................................................................................... 33
6.3 Energy efficiency ...................................................................................................................... 34
6.4 Lighting initiatives .................................................................................................................... 35
6.5 Renewable energy initiatives ................................................................................................... 36

iv
6.5.1 Solar Resource Assessment .............................................................................................. 36
6.5.2 Solar PV system configuration .......................................................................................... 36
7 Access to finance ........................................................................................................................... 38
8 Service Provider Questionnaire .................................................................................................... 39
Conclusion .......................................................................................................................................... 42

v
LIST OF FIGURES
Figure 1: Cost vs Impact diagram ........................................................................................................ 4
Figure 2: Sample Energy Policy ............................................................................................................. 7
Figure 3: Example of an Energy Team in a Large Winery ..................................................................... 8
Figure 4: Typical Electricity Usage pattern in a winery. .................................................................... 13
Figure 5 Annual energy consumption and tarrif structure sensitivity ............................................... 14
Figure 6: Annual consumption pattern vs cost .................................................................................. 15
Figure 7: Typical Energy Balance for a winery .................................................................................... 17
Figure 8: Multiple pumps in parallel and multiple distribution valves .............................................. 19
Figure 9: Pump flow control method ................................................................................................. 22
Figure 10: Compressed Air Reserve Capacity ..................................................................................... 25
Figure 11: Hot and dusty conditions .................................................................................................. 26
Figure 12: Significant air leak ............................................................................................................. 27
Figure 13: Clogged Filter ..................................................................................................................... 28
Figure 14: System pressure at 7.5 bar ................................................................................................ 28
Figure 15: Single phase electric meter ............................................................................................... 32
Figure 16: Seasonal variation of electricity consumed in the winery ................................................ 33
Figure 17: Monthly sum of global irradiation [kWh/m2] ................................................................... 34
Figure 18: Energy efficiency initiatives ............................................................................................... 34
Figure 19: Cost analysis of energy efficiency initiatives ..................................................................... 35
Figure 20: PV energy share on total energy demand ......................................................................... 37

vi
LIST OF TABLES
Table 1: Typical Information that will be communicated as part of the EnMS .................................. 10
Table 2: Project costing (energy efficiency lighting) .......................................................................... 36
Table 3: PV system operating parameters ......................................................................................... 36
Table 4: Questionnaire for the service provider ................................................................................ 39

vii
GLOSSARY
Note: Definitions from ISO50001
energy
electricity, fuels, steam, heat, compressed air, and other like media
energy baseline
quantitative reference(s) providing a basis for comparison of energy performance
energy consumption
quantity of energy used
energy efficiency
ratio or other quantitative relationship between an output of performance, service, goods or energy,
and an input of energy
energy management system (EnMS)
set of interrelated or interacting elements to establish an energy policy and energy objectives, and
processes and procedures to achieve those objectives
energy management team
person(s) responsible for effective implementation of the energy management system activities and
for delivering energy performance improvements
NOTE The size and nature of the organization, and available resources, will determine the size of the
team. The team may be one person, such as the management representative
energy objective
specified outcome or achievement set to meet the organization's energy policy related to improved
energy performance
energy performance
measurable results related to energy efficiency, energy use and energy consumption
energy performance indicator (EnPI)
quantitative value or measure of energy performance, as defined by the organization
energy policy
statement by the organization of its overall intentions and direction of an organization related to its
energy

viii
performance, as formally expressed by top management
energy review
determination of the organization's energy performance based on data and other information,
leading to identification of opportunities for improvement
scope
extent of activities, facilities and decisions that the organization addresses through an EnMS, which
can include several boundaries
significant energy use
energy use accounting for substantial energy consumption and/or offering considerable potential for
energy performance improvement
top management
person or group of people who directs and controls an organization at the highest level.

Energy Management Guideline 2014
1
1 Introduction
1.1 Purpose of the document
This guideline is compiled with winery management—winemakers, assistant winemakers, and senior
cellar assistants—in mind and includes principles and suggestions that apply to wineries of all sizes.
Although other energy sources—renewable, coal, diesel, and paraffin—are considered, the focus is
on electricity.
Rather than a quick fix—there are many technical guidelines available—the guideline aims to
translate the best-practice principles of ISO50001—a technical document—into a user-friendly
format that is jargon free and action orientated.
The main objective of this document is to present the broader objective of the energy management
guideline. The guideline also highlights some of the potential energy cost savings opportunities in
the wine industry.
The guideline will help wineries to:
Identify opportunities to save energy and money.
Prioritise and evaluate the feasibility of energy saving projects.
Understand energy bills.
Set goals.
Measure and improve energy performance in a systematic way.
Make good choices for future.
Provide a framework for continuous improvement.
1.2 Why is Energy Management important?
No winery can operate entirely without energy. In recent years, there has been an increased focus
on energy efficiency, especially in the wine industry. The following drivers can be seen as
contributing to this increased focus.
1.2.1 Rising cost of Electricity
Two factors influence the cost of energy in South Africa: the security of electricity supply (capacity)
and rising energy resource prices due to limited availability.

Energy Management Guideline 2014
2
The majority of electricity in South Africa is generated in coal-fired power stations. Recently, Eskom
has been under pressure to guarantee security of supply. Coal is a non-renewable fossil resource,
which means that peak coal will become a reality. What that means is that as coal production peaks
and then begins to decline, the price of coal will increase resulting in inevitable increases in
electricity prices.
1.2.2 Climate change
The South African wine industry is vulnerable to climate change as this will affect grape growing
directly, since the result of climate change is the increase in extreme weather events such as
droughts and floods. Our electricity has a high carbon emissions factor compared to the rest of the
world. These factors make it essential for the energy users to adopt more sustainable methods of
utilising energy.
1.2.3 Political landscape
The South African government has set carbon emissions reduction targets through the National
Development Plan. This has led to stricter energy regulations as well as subsidies and rebates that
have been made available through Green Economy initiatives. Internationally, carbon taxation is a
threat for South African wine producers as our wine inherently has a high carbon footprint due to
Eskom electricity and the distance to market.
1.2.4 Consumer awareness
Consumers are increasingly becoming more aware of the impact of their product choices when
shopping. Consumers are asking more questions than ever while the internet and social media has
made ethical consumer behaviour easier. The growing prevalence of “green marketing” is indicative
of this trend. Informed consumers are likely to give preference to a product produced by a company
who is making an effort to use sustainable production methods.
1.2.5 Competitive advantage
Improving energy efficiency will reduce the cost of production, which, in turn, will increase the profit
margin on the sale of a bottle of wine. Wineries that are taking action to become more energy
efficient may be eligible to benefit from financial incentives provided by the government, such as
subsidies and rebates. By investing in renewable energy, a winery is likely to improve energy security
in the long term.

Energy Management Guideline 2014
3
1.3 Best Practice Energy Management
Typically, better energy performance can be attained in two ways:
Behavioural change.
Technical interventions.
However, it is often difficult to sustain improvement efforts over a period. Common pitfalls when
attempting to improve energy performance include:
Not enough resources are allocated – there is not enough time to focus on energy or
limited finance available for projects.
Improvements are focused on technical interventions only – employees are not aware of
energy or the influence they have as end users.
One person is responsible for energy in the winery – all knowledge resides with one
person and that knowledge is not easily accessible to the rest of the winery.
Improvements are not measured – there seems to be no change in the energy consumed
although energy savings projects have been implemented.
This Energy Management Guideline is based on the ISO50001 standard for an Energy Management
System (EnMS), which addresses these and other challenges.
The benefits of implementing an EnMS, include:
It is a system designed to save you money.
Based on world-class, best-practice, tried and tested methodology.
Based on continuous improvement (Plan – Do – Check – Act) cycle.
Allows focus on improving energy performance and not on developing a management
system.
Sustainability is built into the system.
Energy Management Guideline 2014
4
2 EnMS Principles
This section presents an overview of few guiding principles that can be extracted from ISO50001.
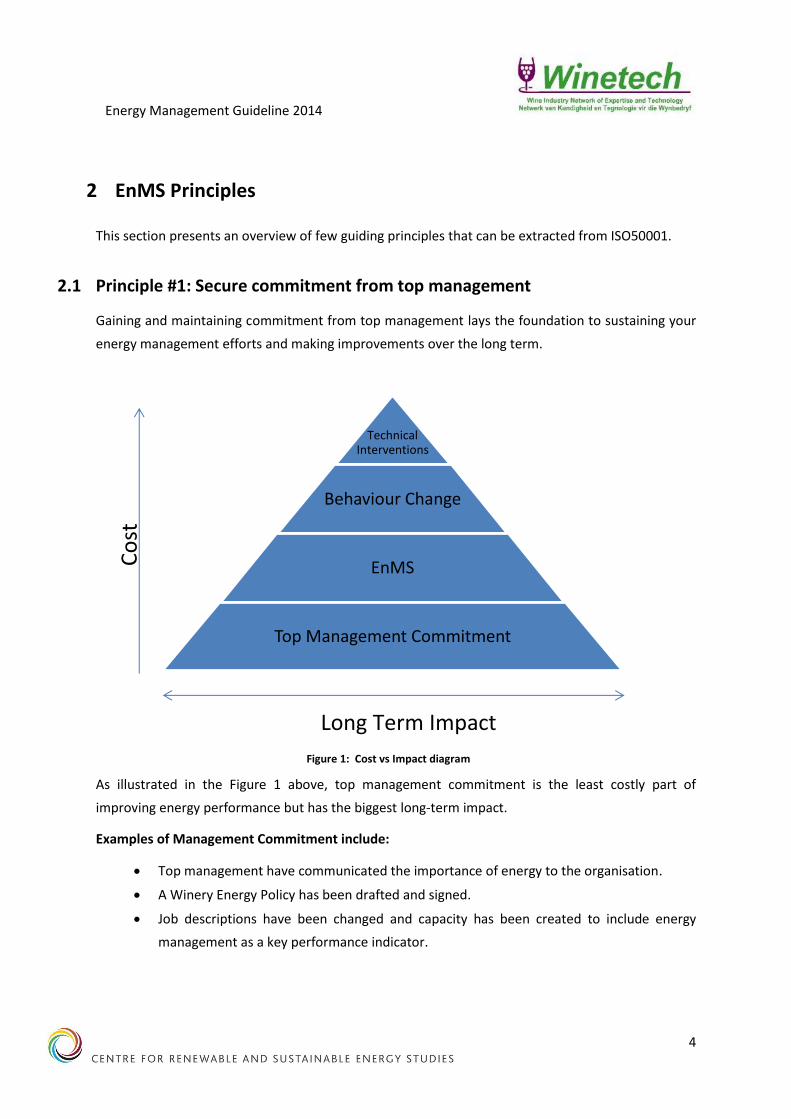
2.1 Principle #1: Secure commitment from top management
Gaining and maintaining commitment from top management lays the foundation to sustaining your
energy management efforts and making improvements over the long term.
As illustrated in the Figure 1 above, top management commitment is the least costly part of
improving energy performance but has the biggest long-term impact.
Examples of Management Commitment include:
Top management have communicated the importance of energy to the organisation.
A Winery Energy Policy has been drafted and signed.
Job descriptions have been changed and capacity has been created to include energy
management as a key performance indicator.
Co
st
Long Term Impact
Technical Interventions
Behaviour Change
EnMS
Top Management Commitment
Figure 1: Cost vs Impact diagram

Energy Management Guideline 2014
5
2.2 Principle #2: There’s no ‘I’ in team – The importance of an Energy Team
It is recommended, if capacity allows for it, to have more than one person who
understands and drives the EnMS in the winery.
It is advised to appoint a multi-disciplinary team, as a successful EnMS requires more than
just technical knowledge.
Involve people with different skill sets at different stages during implementation.
It is helpful to have a team to keep the momentum of the EnMS going.
2.3 Principle #3: You can’t manage what you don’t measure
Measuring is important because it will:
Help you to better understand your energy uses, trends and changes in trends.
Help you to identify the areas where energy savings projects will yield the fastest return
on investment.
Show whether a project or intervention was successful or not.
Keep top management and staff committed towards the EnMS.
2.4 Principle #4: The 80/20 Pareto Rule – Significant Energy Uses (SEU’s)
The 80/20 principle states that 80% of your energy consumption is likely to be from 20%
of your operations or equipment.
Focussing energy savings initiatives on the Significant Energy Uses (SEU’s) in your winery is
likely to result in more savings at a lower cost to company.
System optimisation means taking a holistic view at the system all the way from
generation, distribution to end user. This is more effective than looking at components
only.
2.5 Principle #5: Keep the momentum going – the value of communication
Communication and updates on progress are key to ensure that you keep the momentum
going, which includes communication to top management and staff.
Communication in written form as records and documents ensures that:
o Everybody has access to the same information
o Serves as evidence during an audit
o Becomes part of company collective intelligence
Energy Management Guideline 2014
6
3 Energy Management System (EnMS) Steps
This section provides a step-by-step guide through the Energy Management System’s (EnMS) Plan –
Do – Check – Act cycle.
3.1 Before you start – preparation and commitment actions
Preparation and commitment is critical to making your energy management system work and lays
the foundation for good sustained progress.
Here are some things to keep in mind:
Your winery’s EnMS should be scaled up or down to suit the needs of the organisation.
Your winery’s EnMS should be integrated into existing management systems as much as
possible – aim for no extra meetings or reports.
The process EnMS will generally take between 4 and 18 months to implement depending
on the size of the winery.
3.1.1 Determine the scope and boundaries of the EnMS
Decide which physical areas (boundaries) to include in your EnMS as well as which energy sources
(scope).
Examples: You may want to not include a restaurant in your EnMS because you have no
management control over it. You may decide to include electricity but exclude diesel because
electricity is your biggest cost.
3.1.2 Do I have the commitment from top management?
Have top management made the necessary resources available? Have they communicated the
intentions of the winery with regards to energy management and has the importance of energy
been communicated throughout the organisation? Have certain staff members been given the
responsibility, authority and capacity to focus on energy?
Examples: A signed energy policy is displayed in the staff canteen (see Figure 2). Job descriptions and
Key Performance Indicators (KPI’s) have been changed by top management. A management
representative has been appointed that will report to top management on energy performance.
Money has been set aside for additional energy metering equipment.

Energy Management Guideline 2014
7
3.1.3 Who will be included in the Energy Team?
Ultimately, energy performance on site is everyone’s responsibility. However, establishing an energy
team at your winery will allow for focussed action to improve energy management. Having a team is
important. It means that that there is redundancy built into the system and it is easier to maintain
the EnMS over a longer period. Similar to having a gym buddy, having an energy buddy will also help
to maintain enthusiasm and momentum in challenging times.
Figure 2: Sample Energy Policy

Energy Management Guideline 2014
8
Figure 3: Example of an Energy Team in a Large Winery
3.2 Plan
The planning phase will allow you to profile energy use, identify, prioritise and select energy
improvement projects that will form part of your action plan. In order to identify projects it is
important to understand what types of energy (e.g. electricity, gas, coal) are used and what the
typical pattern of usage is. The planning phase includes collecting all available information and data
you have about the winery’s energy usage.
3.2.1 Develop baseline and indicators
Before implementing an improvement project, know how you will measure the improvement. This
is important as management will want to know whether an improvement has been made due to a
project and how much you have saved. The easiest way to do this is to ask the contractor who is
doing the work to do it for you as part of the quote.
Top Management
GM/Owner
Winemaker Energy Manager
Assistant Winemaker
EEnergy Team Member
Farm Manager
Cellar Assistant
Energy Mangement Representative
Cellar Master/Cellar Manager
Energy Management Guideline 2014
9
Energy performance indicators (EnPIs) are the measures of energy performance that have been
defined by the organization. These indicators may be defined for equipment, process, department,
production line, facility or other appropriate organizational component. EnPIs are vital items to
monitor as they provide critical information about the performance of the entities for which they
have been defined.
3.3 Do – Implementation and Operation
Most people are familiar with implementing projects and following project plans. That is the primary
focus of this part of the energy management system. The other equally important element is to
develop or improve support systems for energy improvement such as communication about energy
to employees, training, and additional documentation such as checklist or work instructions. These
support systems help make energy part of how you do business. These are mostly on-going activities
such as training, communication, operational control, procurement, energy efficient design, action
plans and checking of EnPI’s, progress and the EnMS.
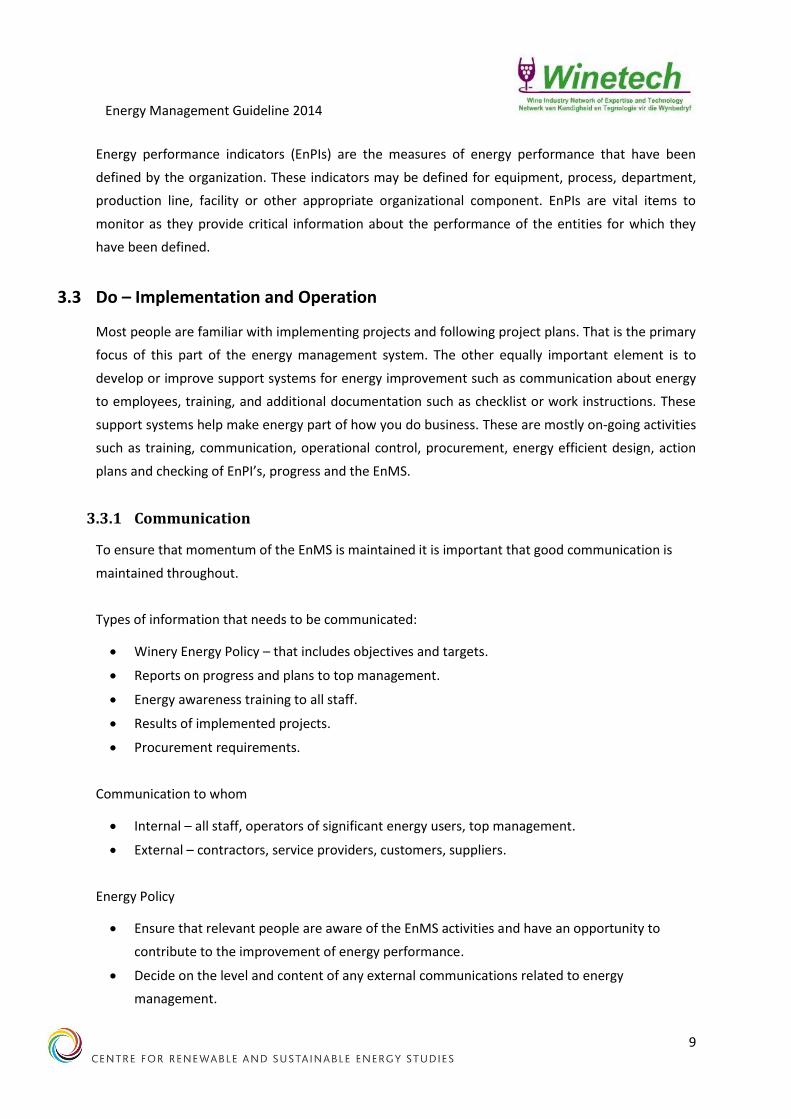
3.3.1 Communication
To ensure that momentum of the EnMS is maintained it is important that good communication is
maintained throughout.
Types of information that needs to be communicated:
Winery Energy Policy – that includes objectives and targets.
Reports on progress and plans to top management.
Energy awareness training to all staff.
Results of implemented projects.
Procurement requirements.
Communication to whom
Internal – all staff, operators of significant energy users, top management.
External – contractors, service providers, customers, suppliers.
Energy Policy
Ensure that relevant people are aware of the EnMS activities and have an opportunity to
contribute to the improvement of energy performance.
Decide on the level and content of any external communications related to energy
management.

Energy Management Guideline 2014
10
Ensure that an appropriate level of awarenesss of energy matters is promulgated.
Table 1: Typical Information that will be communicated as part of the EnMS
Who What To whom When
Inte
rnal
Top management The importance of energy to the organisation
All staff At pre-determined intervals
Management Representative
Energy Policy All Staff On-going
Energy Performance Top Management
Management Review
Roles and Responsibilities
Energy Team At pre-determined intervals
Energy Manager Energy Performance Energy Team, All Staff
At pre-determined intervals
Energy Awareness All Staff On-going
End user training Operators of SEU’s
As required
EnMS process Energy Team As required
Results of implemented projects
Management Representative
At pre-determined intervals
All staff Suggestions of how to improve the EnMS
Energy Team On-going
Exte
rnal
Energy Team Procurement requirements for Energy Efficiency
Suppliers As required
Energy Policy Service contractors, consultants, designers
At pre-determined intervals
Energy Efficient Design Requirements
Engineers, Suppliers, Consultants
As required
Public Relations Successes of the EnMS
Customers As required
3.4 Check

Energy Management Guideline 2014
11
The winery should monitor, measure and analyse key characteristics of operations that determine
energy performance at planned intervals.
Key characteristics include:
Significant Energy Uses (SEU’s).
Other outputs of energy review in the planning section.
Relevant variables related to SEU’s.
EnPI’s.
Effectiveness of action plans in achieving objectives and targets.
Evaluation of actual vs. expected energy consumption.
3.4.1 Check Operations
Check operator records for abnormalities.
Check maintenance records.
Equipment checking – Routine checking for, for example noises or leaks of major equipment
that impacts significantly on energy use. A good knowledge of normal operations is required
for this.
3.4.2 Check the System
Is everyone doing what is required?
Review roles and responsibilities.
3.4.3 Check Performance
It is important that measuring equipment should be calibrated at planned intervals or
according to manufacturer’s specifications.
Check EnPI’s.
Check trends and costs.
3.5 Act – Management Review
The Act part of the energy management system is the opportunity to evaluate your energy
management effort and to ensure that the EnMS is improved and sustained. This is the time to
determine whether you are on track with your energy improvement projects and other business
goals as they relate to energy. It is the responsibility of the top management to conduct a
management review of the system.

Energy Management Guideline 2014
12
3.5.1 Regular reviews
The management review of the system should ideally be part of a regular annual meeting. Giving
feedback to top management at planned intervals will help to keep top management committed and
involved in the EnMS.
3.5.2 How are we doing?
The following are typical agenda points for the management review:
Is energy performance improving against targets?
Problems and barriers to overcome and recommendations for improvements.
Achievements.
Review of the winery Energy Policy, Legal and other requirements.
3.6 What is the plan for the next period?
This is a perfect opportunity to get direction from top management about the planning process,
current business priorities, any internal changes that are planned and focus areas for the following
year. In addition, what resources will be needed to achieve the EnMS targets for the following
period?
Energy Management Guideline 2014
13
4 Case Studies
Different wine farms utilise various energy systems. In addition, the configuration of these energy
systems will have common features. Understanding the energy systems within the organisation is
crucial for energy efficiency and cost cutting initiatives. This section highlights the key aspects that
need to be looked at in order to understand the energy system.
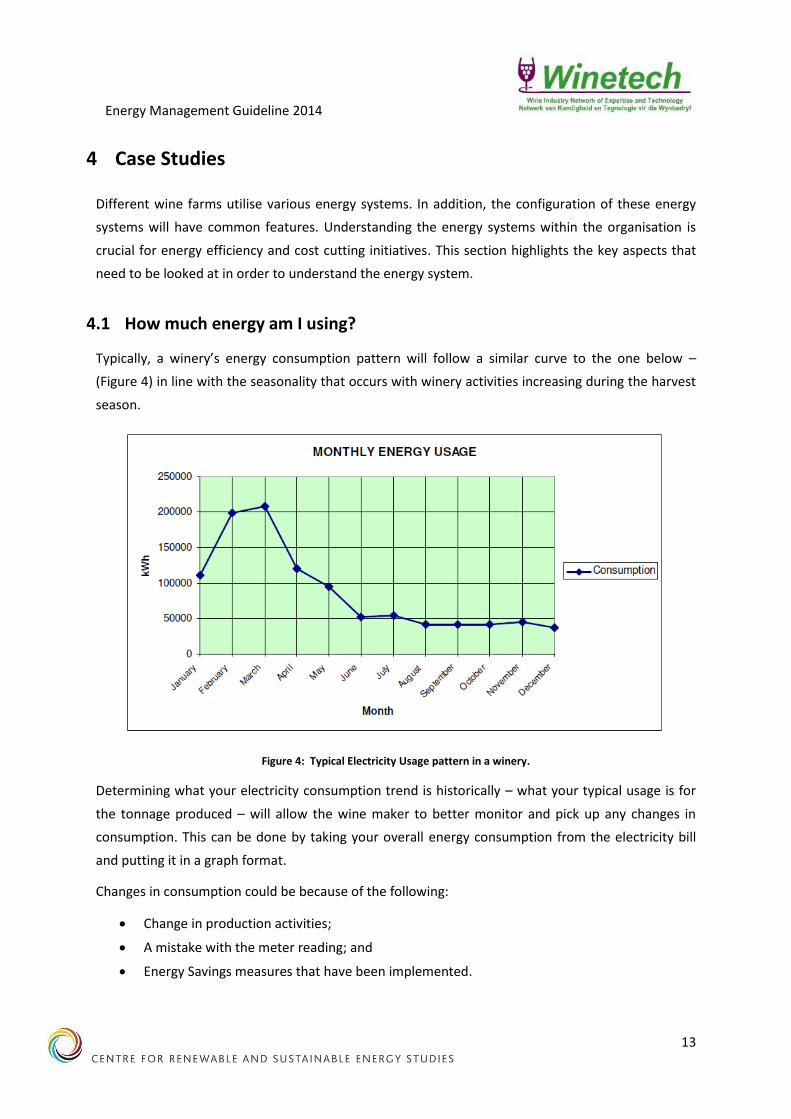
4.1 How much energy am I using?
Typically, a winery’s energy consumption pattern will follow a similar curve to the one below –
(Figure 4) in line with the seasonality that occurs with winery activities increasing during the harvest
season.
Figure 4: Typical Electricity Usage pattern in a winery.
Determining what your electricity consumption trend is historically – what your typical usage is for
the tonnage produced – will allow the wine maker to better monitor and pick up any changes in
consumption. This can be done by taking your overall energy consumption from the electricity bill
and putting it in a graph format.
Changes in consumption could be because of the following:
Change in production activities;
A mistake with the meter reading; and
Energy Savings measures that have been implemented.

Energy Management Guideline 2014
14
Other sources of energy include paraffin, diesel, liquid petroleum gas (LPG) and coal. Similarly, the
consumption of these energy sources needs to be understood and the data can also be plotted on a
graph.
4.2 Am I on a suitable tariff?
The electricity tariffs are available in various options and can either be based on fixed structure cost
or can be purchased on a pool-based structure. The two options of tariff structure – fixed tariff
structure or pool-based structure makes it crucial for the organisations to have a clear
understanding of what options that are available and suitable to them. When large load shifts to off
– peak times are possible they may be made more viable by negotiating the time of electricity use
tariff. It will help the consumer to purchase electricity at competitive costs and help the supplier to
reduce the peak load demand and increase the load factor by increasing the off peak load.
Figure 5 shows the annual electricity consumption and the costs based on the tariff structure. Figure
5 also shows that the costs of electricity are heavily influenced by the type of tariff structure. From
the graph, it is clear that the costs of purchasing electricity during peak time are not proportional to
the amount of purchased electricity. Often, changing to a Time of Use (TOU) tariff may result in cost
reduction.
Figure 5 Annual energy consumption and tarrif structure sensitivity
16% 27%
45%
46%
39% 27%
0.00
0.10
0.20
0.30
0.40
0.50
0.60
0.70
0.80
0.90
1.00
Energy [kWh] Costs [Rands]
Pe
rce
nta
ge/
rati
o
Annual energy consumption and tarrif sensitivity
Off peak
Standard
Peak

Energy Management Guideline 2014
15
The consumption of the winery is extremely seasonal because of the harvesting & wine making
taking place at the beginning of each year. Figure 6 shows the peak consumption in
December/January and a virtually flat profile for the period June to November. Cost follows
consumption quite closely but then diverges in the winter months June to September. This is
because the winter months fall in the High demand season when electricity is more expensive,
especially electricity used during peak hours.
Figure 6: Annual consumption pattern vs cost
4.3 Where am I using the most energy?
The next step is to view your winery through an energy lens. Where are the large pieces of
machinery? Which ones are consuming the most energy (kWh)? Which equipment is running
continuously? Understanding where energy is used is useful because it allows for focussed
interventions. The where could be divided according to:
A System eg. Refrigeration, Compressed Air, Waste Water Treatment.
Physical Area eg. Bottling hall, Fermentation Cellar, Restaurant, Tasting Centre.
Production function eg. Stabilisation, Blending, Fermentation.
What is important is to start thinking about how this section of the winery could be measured. If you
have additional electricity meters on different areas this could be beneficial in helping to determine
where the large energy consumers are.

Energy Management Guideline 2014
16
Sub metering and smart metering
Sub-metering and smart metering helps the winery to obtain an accurate picture of the current
energy consumption patterns, what is spent on energy in different forms and the unit costs, what it
is used for, which are essential and which are not.
The sub-metering and smart metering system includes various systems, like metering of sub-
systems. During the planning phase, it is important to measure and monitor the system, obtain
information/data in order to ascertain the feasibility of the project. Information/data that is
obtained from the improved process can then be compared to the initial measured data. If there are
external operations that are linked to the winery – maybe restaurant, sub-metering and smart
metering can be used to obtain accurate electricity bill.
4.4 Which are significant energy users?
Significant Energy Users can either be that which consumes a large percentage of the winery’s
energy or where there is great potential for improvement. This sub-section shows the energy
consumption distribution from various energy systems. The data from Figure 7 shows a typical
energy balance of a winery – data obtained from a winery in Stellenbosch. It highlights the
significant energy users that can be put on high priority for energy cost reduction projects. However,
the wine farmer can decide to start energy efficiency initiative on any of the identified energy
systems.
It is crucial to identify the biggest significant energy users. This assists in identifying the potential
costs savings opportunities. To start, ideally select one or two of these users. Embark on energy
efficiency and cost reduction initiative. In that way, it is easy to quantify the results and reduces risks
that are linked to high capital expenditure.
Typically the Significant Energy Users (SEU’s) in a winery are:
Refrigeration.
Lighting.
Compressed Air.
Pumps and Motors.
Steam generation.

Energy Management Guideline 2014
17
Figure 7: Typical Energy Balance for a winery
4.5 What are the best opportunities?
The energy management systems initiatives or energy costs savings initiatives, projects requiring
capital expenditure are almost certain to be identified. This makes it crucial to conduct a proper
analysis of the technological viability and financial feasibility of the project. This analysis will help in:
Identifying the benefits of the project and inform decision on whether the project should go
ahead.
In order to internally prioritise the project and allocate resources for the project uptake.
Financial criteria are always put on high priority when accessing the feasibility of the energy cost
saving project. Utilising appropriate technique allows the organisation to embark on projects that
are consistent with system that is used within the organisation. Some of the common used
techniques are:
Simple payback period.
Life cycle costing.
There are various methods of obtaining finance for the energy cost saving projects. These are:
Internally financed.
Externally financed.
Contract energy management.
43%
27%
14%
10%
3% 2% 1% Refrigeration and waterchilller
Pumps and Motors
Compresses air
Lighting
Fridges and airconditioning
Cooking and kitchen

Energy Management Guideline 2014
18
5 Case Study 1
As part of the guideline development, energy systems assessments were conducted on three pre-
selected wine farms located in the Stellenbosch area. The methodology included the assessment of
the compressed air, chilled water systems, refrigeration, lighting, pumps and various energy
systems. This section gives an overview of the energy assessments by highlighting the identifies
potential energy reduction initiatives and energy efficiency improvements.
5.1 The background of the case study
The overall purpose of the energy systems energy assessment was to:
Assist the company to quantify their energy consumption and identify major consumers
within their processes.
Use the assessment as a tool to identify potential opportunities for the reduction and more
efficient use of energy within the plant.
Verify whether the energy used by the facilities is efficient and that there is an on-going
programme to monitor and improve the use of these resources.
Assist in identifying opportunities for the recovery of energy from processes wherever
feasible.
5.2 Identification of Energy Minimisation Opportunities
The assessments that were conducted used the approach of identifying significant energy users.
Various energy systems were identified and assessed in order to identify the opportunities of
improvement.
5.2.1 Chilled Water System and Refrigeration
A visited winery had a large chilled water plant drawing from a 70 000 litres capacity made up of 2 x
35 000 litres tanks. There were a number of circulation pumps in parallel drawing from these tanks
and feeding via a main header to a series of valves which distributed the chilled water to various
areas of the winery.
Opportunities
The increased friction of the multiple valve system makes this effect worse and steepens the system
curve i.e. for a small increase in flow rate there is a large increase in friction losses. In fact, one can
reach a point where adding more pumps in parallel has no effect on the flow through the system.

Energy Management Guideline 2014
19
Figure 8: Multiple pumps in parallel and multiple distribution valves
If it is found that no effect is produced by adding another pump, then the energy used by that pump
has no benefit and that pump could be simply switched off. The existing pumps in the row shown
above are all similar, however Pump 2 had a smaller impeller than the rest at 168 mm compared to
175 mm. This can cause an unmatched flow and possibly reduce the performance of the system.
5.2.2 Optimising the Existing Chilled Water System
There are a number of areas where the existing system could be optimised in order to improve the
performance:
1. As an example of this, during the off-season when the requirements are reduced, it may be
possible to separate the two chilled water tanks and thus reduce the demands on the
refrigeration plant.
Reducing the capacity from 70 000 litres to 35 000 litres and assuming the required temperature
is 4 °C, achieves the following:
Assuming that the temperature difference between the chilled water going out and returning is
5 °C
Energy (cooling load would be 410 kWh for 70 000 litres)
Reducing the storage to half the size 205 kWh – 68 kWh electrical (COP of 3)
This would be 15 000 kWh per month
Applying for 9 months when only storage cooling was required
= 135 kWh
= R 130,950.00 per annum

Energy Management Guideline 2014
20
2. Increasing the temperature of the chilled water would also realise a good energy saving as the
above formula shows quite clearly.
For example if the water was kept at 6°C instead of 4°C, then the following is achieved:
Energy (cooling load would be 164 kWh for 70 000 litres)
55 kWh electrical (COP of 3)
Energy savings per month = 12 000 kWh (144 000 kWh per annum)
Savings R 140,000.00 per annum
For example, by increasing the temperature of a 10 000 litres tank by 1°C, then the following is
achieved:
Savings R 54,680.00 per annum
Some of the Chilled Water system improvement programmes could be:
Minimise cooling loss from the system – install door closers, insulation for storage and
fermentation rooms, insulation for tanks and brine lines and efficient lighting (less heat) and
locate refrigeration plant and equipment in a shaded, well ventilated area.
Educate staff – ensure that staff do not leave chilled area room doors open.
Turn off or raise temperature set points of refrigeration system during non-critical times.
Maintain and check chillers regularly – check cooling tower for damage, check for ice build
up on evaporators and delivery lines (should be suitably lagged), keep external coils clean
and free from litter and regularly check system pressure.
Ensure that chiller tank and refrigeration plant are shaded from direct sunlight – this reduces
radiant heat gain and increases energy efficiency.
Insulate wine tanks and brine lines to reduce energy use for heating and chilling.

Energy Management Guideline 2014
21
5.2.3 Refrigeration
For a successful monitoring of the refrigeration system, sufficient monitoring system equipment is
required. The efficiency of the refrigerator is expressed as the coefficient of performance (COP)
ratio. This is the ratio of the cooling effect (kW) and power input to compressor (kW). Around 70 %
of all electricity is used for refrigeration thus in terms of electricity cost it is the most expensive
system to run in the winery. It therefore makes sense to optimise this system as a small change in
usage may result is a sizeable saving. The refrigeration system comprises of two compressors, seven
circulation pumps, two cooling towers and two room chilling units.
5.2.4 Plant equipment (Improved Pump Control)
Turn equipment off whenever possible – turn air conditioning system off when not
required. Equipment that generates heating or cooling (stays warm or cold when not in
use) can use a significant amount of energy when idling. Turn equipment off during brakes
where applicable.
Consider the use of variable speed controls for motors with variable demand – VSD
controllers are appropriate for motors that spend a lot of time under partial load. The use
of a VSD is more efficient than the use of a large pump and throttling valve often used to
slow product flow.
Use the smallest, most efficient motor suitable for task – select high efficiency motors
(HEM) that operate at close to peak capacity when selecting replacement motors rather
than rewinding or purchasing cheap, inefficient motors.
If the chilled water plant, flow control method during the off-season was by partially closing control
valves then the following opportunity would apply. This method of control tends to be wasteful of
energy and it would be better controlled using VSD’s (variable speed drives) as described above.
This particular type of system is generally controlled using a system pressure set point so a drop in
pressure could be used to cause extra pumps to come on when the system pressure dropped for any
reason such as when storage tank cooling was required.
The existing control method involves having the output of the circulation pumps set by means of
throttling the discharge side of the pump. For this type of centrifugal pump, the benefits of reducing
the speed using a VSD can be seen from the Figure 9.

Energy Management Guideline 2014
22
Figure 9: Pump flow control method
It is difficult to assess exactly what savings could be achieved, however a typical pump system with 6
main circulation pumps which are rated at 18.5 kW shows the following. As can be seen from Figure
9, reducing the motor and pump speed rather than throttling using a valve could achieve significant
energy savings.
There appears to be an area which could benefit from further and more in depth measurement and
analysis in order to more accurately determine an exact energy saving value. Some in depth
discussion between the users of compressed air and chilled water and the suppliers of these
commodities needs to take place so that supply and demand can be more closely matched.
Pumps and Motors
Pumps are usually selected with safety margins in order to ensure sufficient capacity. The selected
pump for an operation may be efficient however, in general there is wasted energy consumption.
Irrespective of the type of pump that is used for the operation, the following factors may assist in
saving energy:
Reducing excess flow rate – installing pumps that operate at flow rates close to the
required system flow rate.
Reducing the pipe resistance – reducing the number of bends, T’s and fittings.
Efficient motor control – installing VSD’s, where necessary.
Circulation pumps
The VSD will ensure that the pump speed will be controlled according to the pressure needed in
the system. Thus, if the cooling on all tanks is off the motor on the pump will reduce its speed. Only
when cooling on a tank is opened will the motor on the pump speed up to supply the necessary
pressure in the system to supply the tank with chilled water. However, even though the VSD’s
improve the efficiency of the energy system, more financial analysis will be necessary for the
lifetime analysis of the energy system.

Energy Management Guideline 2014
23
Example
Suppose one of the circulation pumps (5.5 kW) runs 24/7 for 4 months. If the cost of 1 kWh = R
1.00, it would cost R 15, 840.00.
By installing a Variable Speed Drive (VSD) on one of the circulation pumps it is generally accepted
that this would save 25 % which equals R 3, 960.00.
Insulation
Insulation is essential in thermal applications because it prevents heat gain and heat losses, thereby
saving on fuel and energy costs. Insulating of hot surfaces and cold rooms is one of the simplest and
most cost-effective ways of increasing energy efficiency. The payback time for insulating a pipe is
generally less than one year. For piping, tanks and valves and fittings, immediate savings can be
realised from insulating where no insulation existed.
Apart from insulation, there are opportunities of reducing energy costs. Housekeeping opportunities
provide opportunities for costs savings. Typically, opportunities like damaged insulation and
damaged covering and finishes are identified. Retrofitting the existing system provides an
opportunity. This can be done by upgrading the existing insulation levels or review the thickness
requirements.
Hot water supply
As with domestic geysers when water is heated by electricity, it can be very costly. Savings
opportunities exist in matching the water heated with the required temperature and amount
needed.
Avoid installing oversized or in efficient hot water services – consider the benefits of solar,
instant gas/electric, storage and heat pump units when determining hot water provisions.
Use waste heat waste from refrigeration systems to pre-heat hot water.
Insulate hot water lines.

Energy Management Guideline 2014
24
Example
There are various opportunities of cost saving where water is being heated by electricity. These
opportunities can be realised by adopting other systems like heat pumps and excess steam from
the boiler.
Typical 200 litre geyser electrical element = 4.00 kW
Typically a heat pump uses 30 % of the electricity of a heating element.
Replacement heat pump power = 4.0 x 30 % = 1.20 kW
This project will typically yield a 30 % saving.
Steam
The boiler is often the largest single consumer of energy in the winery. This makes it crucial to
ensure that there is appropriate constant review of its performance. Boilers are classified according
to their size and input fuel type. The measure of the boiler performance is the specific boiler
efficiency. This is the ratio between the useful heat production and energy consumed – useful steam
over fuel consumption. Electricity is consumed in the boiler system, typically for circulating pumps,
combustion fans, etc. An electricity kWh meter can be installed to monitor the electricity
consumption profile from these systems. Steam systems are the most important place to look for
savings by insulating pipes and valves.
Lighting
Lighting is probably the most noticeable source of energy cost saving within an organisation. Lighting
provides many cost saving opportunities, ranging from simple switching off the light to utilising more
efficient types. Winery employees can play a big role in the cost saving initiatives from lighting. This
can be done by switching all the unnecessary lights or installing automatic lighting controls.
Harvesting daylight by the installation of ‘skylights’ can be considered where heat ingress is not a
problem.
5.2.5 Compressed Air System
Compressed air system is used to supply service air to the various pneumatic valves and cylinders
throughout the plant. However, during the harvest season the compressed air is also utilised to fill
the bag/batch presses for pressing the juice from the grapes. This is done in cycles with each cycle
being at a slightly higher pressure up to a maximum of 2 bar.

Energy Management Guideline 2014
25
To illustrate the energy assessment of the compressor system, a case study from a wine farm is
used. This is for a 20 Ton capacity press using 6 cycles. Typically, for this capacity, the requirements
are a flow rate of 21.23 m³/min and a storage capacity at 7.5 bar of 56.78 m³.
Figure 10: Compressed Air Reserve Capacity
We can therefore see from Figure 10 that the 3 compressor system at present can only supply
sufficient flow for a single 20 Ton press using 6 pressing cycles. The storage capacity is only 26 % of
the required capacity. This is evident when monitoring the system during pressing cycles, as the
storage pressure drops continuously as the compressors are unable to refill the tanks between
cycles.
Opportunities
There are a number of opportunities here to reduce energy consumption; however, since the
majority of the high usage is only for a short 3-month period, this has to be taken into account
when considering these options. The total energy consumption of the 3 compressors, when
running, is 135 kW which; if all are running would equate to 1 620 kWh per 12 hour day or 48 600
kWh per month. That gives a consumption of 145 800 kWh for the 3 month period. When
comparing this to the total energy consumption, the compressed air system would constitute 9 %
of this.
The following would be recommended:
1) Instead of purchasing additional compressors, the capacity of the storage should rather be
increased as this is where the system fails.
2) Discussions need to be held with the winemaker to determine exactly how many pressing
cycles are required and what pressures are needed for a specific volume of grapes to be
pressed to achieve the required results.

Energy Management Guideline 2014
26
3) In discussions with fan experts they advised that it could be possible to install high pressure
blower fans which could pre-fill the bags to close to the required pressures for most of the
cycles and only adding compressed air when the final press is cycled. A typical blower fan can
achieve an energy efficiency of 75 % whereas a compressor can only achieve 15 % energy
efficiency. This bag pressing operation is a high volume low pressure application whereas a
compressor delivers high pressure low volume. Some of the bag presses do have initial filling
using blowers; however this method could potentially fulfil the majority of the requirements.
4) The exhaust air coming out of the bags could then also be re-used by introducing it at the inlet
to the proposed blower fans. The cycles of the individual presses would have to be
synchronised to take maximum advantage of this, however, the savings would be good as the
blower fan would only have to raise the pressure of the air by whatever was lost during the
process.
5.2.6 Optimising the existing compressed air system
There are a number of areas where the existing system could be optimised in order to improve the
performance:
1) The compressors at present are situated outside in the dust and sun and this causes problems
both with the intake filters blocking up as well as the compressors drawing in heated air. It
would be beneficial to enclose the compressors with a shaded room and to duct the intake air
from the cool room through the wall behind the compressors. The increased performance due
to the cooler air can be estimated at 1 % benefit for every 5 °C reduction in inlet temperature.
At present the harvest time temperature is around 30 °C and the room temperature is closer to
15 °C so the potential energy reduction would be 3 %. This equates to a savings of 4 500 kWh
for the harvest season.
Figure 11: Hot and dusty conditions

Energy Management Guideline 2014
27
2) It was noted that there were a number of air leaks in the system and these would need to be
remedied by instituting a tagging system and a maintenance plan which would see that each
leak was noted and repaired. In general leaks account for 10 % of a typical plants air
consumption and repairing at least 70 % of these would achieve a savings of 10 000 kWh over
the same period.
Figure 12: Significant air leak
3) The clogged inlet air filters due to the dusty environment require regular cleaning and it was
noted that whilst this consultant was on site and repairs were being made to one of the
compressors, the filters were then serviced. This is apparently not done very regularly as the
filters were fairly dusty. As the filters are on the inlet side of the compressor, the effect is to
reduce the performance of the compressor. Generally it is accepted that a dirty filter can
reduce the performance by up to 5 %. This could potentially allow further savings of up to
4 000 kWh over the season.
Energy Management Guideline 2014
28
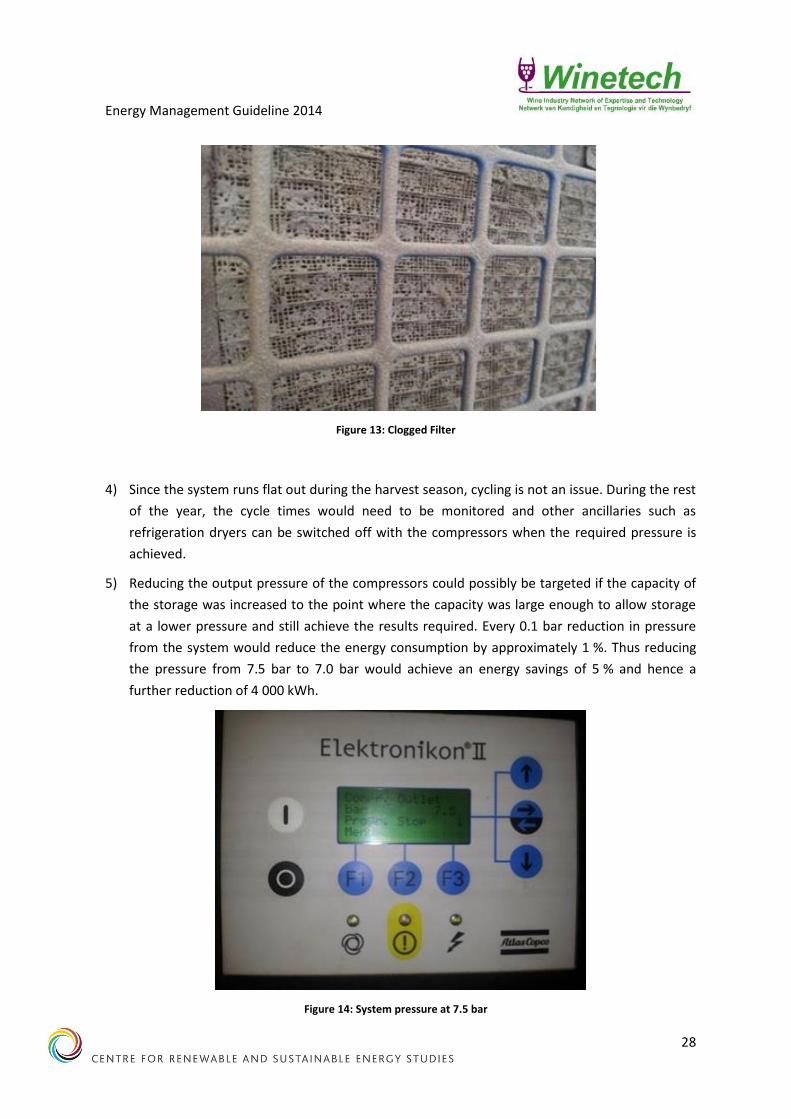
Figure 13: Clogged Filter
4) Since the system runs flat out during the harvest season, cycling is not an issue. During the rest
of the year, the cycle times would need to be monitored and other ancillaries such as
refrigeration dryers can be switched off with the compressors when the required pressure is
achieved.
5) Reducing the output pressure of the compressors could possibly be targeted if the capacity of
the storage was increased to the point where the capacity was large enough to allow storage
at a lower pressure and still achieve the results required. Every 0.1 bar reduction in pressure
from the system would reduce the energy consumption by approximately 1 %. Thus reducing
the pressure from 7.5 bar to 7.0 bar would achieve an energy savings of 5 % and hence a
further reduction of 4 000 kWh.
Figure 14: System pressure at 7.5 bar

Energy Management Guideline 2014
29
Example
In total therefore, the savings potential of optimising the existing system equates to:
Reduced inlet temperature 4 500 kWh
Reduced air leakages 10 000 kWh
Maintaining clean filters 4 000 kWh
Reducing pressure 4 000 kWh
TOTAL (for February to April) 26 500 kWh = R 25 000
Compressed Air
Example
An illustration of potential energy saving from the compressor is maintaining the compressor
pressure at required pressure. For a compressor that has 2 x 75 kW capacity – typical size that is
used at a winery, that operates for 5 days a week and 20 weeks per year, the energy costs are
expressed as follows:
(2 x 75 kW) x 60 % load x 24 hours 5 days/week x 20 weeks/year x Tariff (R1/kWh) = R180 000
If the set point was reduced from 8.5 bar to 7.5 bar the savings would be 7 % = R12 600
Space cooling
There are various ways of assessing the energy consumption for space cooling. In many cases, it is
possible to examine the records of the electricity used. Energy cost reduction of space cooling is
concerned with:
Avoiding over chilling
Minimising the heat losses through the building
Maximising the usage of the cold space

Energy Management Guideline 2014
30
Example
A storage facility kept at 12 °C can potentially result in reduced energy costs if the set
temperature is increased by 1 °C. If for example, the current room temperature is set at 12 °C,
and this could be safely increased to 15 °C then the cooling power reduction for this 3 °C increase
would result in a R 300 000.00 saving for a 60 000 m² room.
The results from this project can be realised as soon as the implementation is done. It only needs
management commitment.

Energy Management Guideline 2014
31
5.3 Cost Saving Opportunities
Tariff Optimisation
The tariff optimisation provides potential costs saving opportunities. The wine farms have the
notified maximum demand, which is agreed upon with Eskom. By exceeding this demand the wine
farm is fined. An analysis on the wine farm that has a notified maximum demand of 350 kVA shows
that there is potential costs savings opportunity. In a year, there are months (Nov 2012, Dec 2012,
Jan 2013, Feb 2013) when the demand is higher than 350 kVA. A fine is levied for these months
that equalled R 18 549.00 for the year. If there is a possibility to reduce the maximum demand
(KVA), by switching off any non-essential equipment when these peaks are likely to occur, these
fines can be avoided. Energy savings initiatives could then be implemented to prevent the demand
from going over 350 kVA. As a precaution measure a meter can be installed that will send a
notification in a form of an SMS when the demand goes higher. Non-essential equipment can then
be switched off avoid the peak kVA from measuring more than 350 kVA. The other possibility is to
increase the notified maximum demand although this will be subject to available capacity on
Eskom’s side. The increased monthly cost will have to be weighed up against avoiding the fine.
Kitchen/ outside building
The kitchen or the outside building may provide an opportunity for cost saving. For a wine farm
that was assessed which had an outside rented kitchen, it was determined that the electricity bill is
included in the rent. Based on the energy balance the kitchen consumes an estimated 2 200 kWh
amounting to R 1, 518.00 of electricity a month. Activities in the kitchen usually happen during the
morning hours in peak hours when electricity is charged at a higher rate. By installing a single
phase meter (±R 1, 000) the company will be able to accurately bill the business for electricity
used.

Energy Management Guideline 2014
32
Figure 15: Single phase electric meter
Energy Management Guideline 2014
33
6 Case Study 2
The system efficiency and potential for optimisation assessment was conducted at a Winery. The
methodology included the assessment of the energy efficiency assessment and the investigation of
the potential of integrating the renewable energy systems. This section gives an overview of the case
studies conducted and the mechanisms of integrating the renewable energy technology.
6.1 Background
The renewable energy technology uptake in the wine industry is low. This can be attributed to
various factors. One of the factors is the electricity industry structure of South Africa. The South
African electricity industry is constituted by the single vertically integrated electricity supply
system. The renewable energy technology is identified and proved as the technology that can
potentially address these challenges. However, the uptake of renewable energy in wine industry is
still low. The renewable energy assessment that is carried out in this study seeks to address the
risks and uncertainty that are associated with the integration of renewable energy systems in the
wine industry.
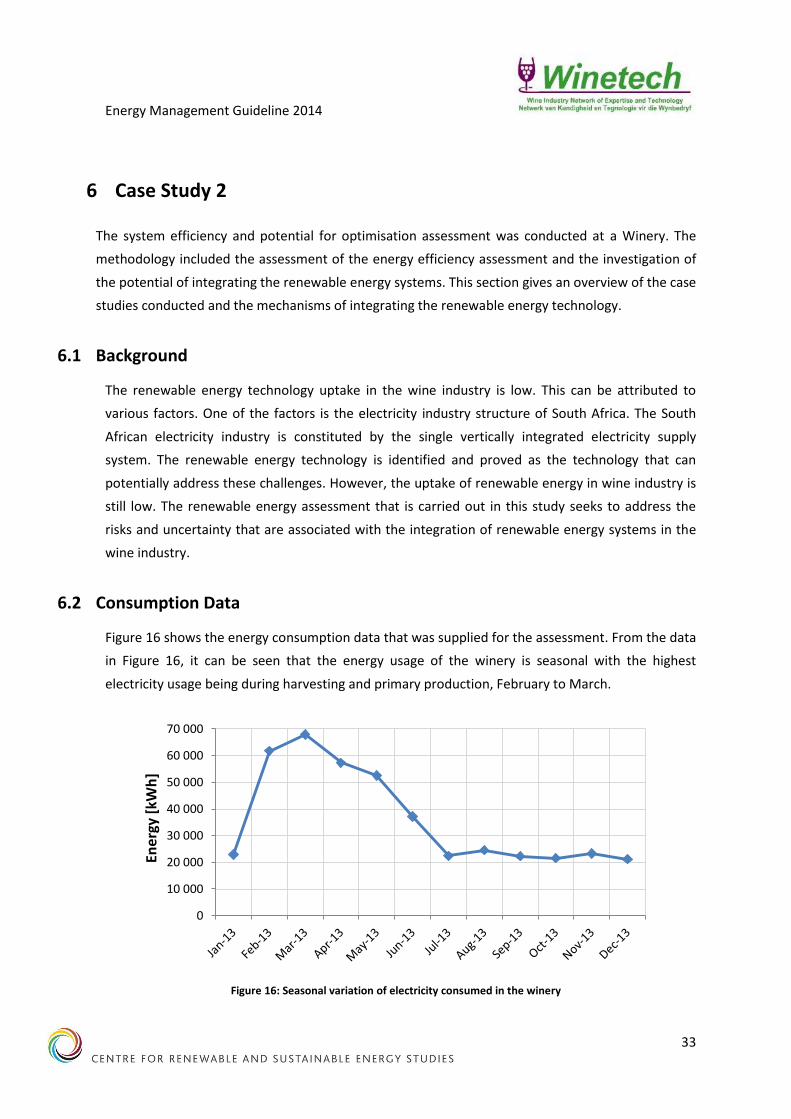
6.2 Consumption Data
Figure 16 shows the energy consumption data that was supplied for the assessment. From the data
in Figure 16, it can be seen that the energy usage of the winery is seasonal with the highest
electricity usage being during harvesting and primary production, February to March.
Figure 16: Seasonal variation of electricity consumed in the winery
0
10 000
20 000
30 000
40 000
50 000
60 000
70 000
Ener
gy [
kWh
]

Energy Management Guideline 2014
34
The load profile coincides with the solar resource availability in the region. Figure 17 shows the
solar resource availability in the same region as the wine farm. It is the monthly sum of global
irradiation. It can be seen from Figure 17 that the solar resource availability is higher during
summer, during the harvesting period. This is the period when there is higher energy consumption
in winery.
Figure 17: Monthly sum of global irradiation [kWh/m2]
6.3 Energy efficiency
It is advisable that the wine management starts with the energy efficiency initiatives first before it
considers other alternatives, like the renewable energy systems. There are existing programmes
that support the energy efficiency initiatives in wineries.
Figure 18: Energy efficiency initiatives
0
25
50
75
100
125
150
175
200
225
250
Jan Feb Mar Apr May Jun Jul Aug Sep Oct Nov Dec
kWh
/m2
0
20 000
40 000
60 000
80 000
100 000
120 000
140 000
-23% -26% -19% -31% -14% -40% -32% -27% -20% -13% -39% 4%
Jan Feb Mar Apr May Jun Jul Aug Sep Oct Nov Dec
Ene
rgy
de
man
d (
kWh
)
Energy reduction (%)_from month to month
Energy demand (kWh)_previous year month
Energy demand (kWh)_current year month

Energy Management Guideline 2014
35
The energy reduction shown in Figure 18 can be attributed to various initiatives. These can be
integration of the renewable energy systems into the energy system. However, the energy
efficiency alone can be 50 % of the reduced energy demand.
Figure 19: Cost analysis of energy efficiency initiatives
Figure 19 shows the energy costs comparisons based on year-month to year-month. The costs are
the same period as shown in Figure 18. The trajectory that is followed by the graph does not
correlate with the energy demand trajectory. Even though the energy demand graph shows that
there has been a decrease in energy demand on month to month, the costs graph shows that there
is increase in energy costs in some months. This can be attributed to various factors. One major
contributor to this is the flexi tariff structure. Even though the energy efficiency initiative might
result in reduced energy demand, however, the costs may increase. The energy demand is
increased, however, the energy consumption may be shifted to the high tariff period. This needs to
be noted during the energy efficiency initiatives.
6.4 Lighting initiatives
Uniform and consistent type of energy efficiency lighting can be implemented within the winery as
an energy efficiency initiative. Lighting constitutes about 10 % of the energy demand in wineries. If
proper lighting products are implemented, they can result in substantial savings.
The following case study was conducted in winery on lighting energy efficiency. During this energy
efficiency programme, the recommendation was to replace the older light bulbs with energy
efficient light bulbs.
Typically, for a project like the one discussed above, the total costs would be about R 200 000.00
including VAT. The estimated rebate would be about R 70 000.00. Table 2 shows the estimated
project finance for typical project.
0
10 000
20 000
30 000
40 000
50 000
60 000
70 000
80 000
90 000
-7% -8% 0% 2% -13% -14% -10% -28% 2% -13% -15% 26%
Jan Feb Mar Apr May Jun Jul Aug Sep Oct Nov Dec
Ene
rgy
cost
s (R
and
s)
Energy costs (Rands)_previous year month
Energy costs (Rands)_current year month

Energy Management Guideline 2014
36
Table 2: Project costing (energy efficiency lighting)
Energy Efficiency Lighting SP Project Costing
ROI 46%
Payback Period in Years 2.19
Energy Savings Per Annum in kWh’s 70 754
Energy Demand Reduction in kW’s 22
Financial Savings Per Annum ZAR 55 328
Lighting Energy Savings 63%
6.5 Renewable energy initiatives
This section presents the configuration of the renewable energy system, which is used for the case
study. The study focuses on the commercial available PV system. This was done by conducting a
case study on an existing PV plant on the wine farm.
6.5.1 Solar Resource Assessment
The solar resource is different from year to year. There are fluctuations on the solar resource and
the data from a single year is not representative of a typical meteorological year (TMY). These
fluctuations may be due to meteorological events and the events are not an annual occurrence.
Therefore, it is required to create a dataset for the year that is representative of the average values
of the entire period. The data (see: Figure 17), which is used to develop the TMY is for the period of
01 January 1994 to 31 May 2011. Data if Figure 17 solar resource available in Stellenbosch. As it
has been shown earlier, the higher solar resource period coincides with the high electricity demand
in wineries. This means, solar technology may make business sense in this region. Also, the energy
supply may have higher solar fraction.
6.5.2 Solar PV system configuration
There is no specific capacity of renewable energy system that a company can integrate into their
energy system. The following section demonstrates the energy contribution of PV system when
integrated into the existing energy system. Table 3 shows the PV system configurations.
Table 3: PV system operating parameters
Item Description
System size 132 kWp
System type Grid tired
Module type Polycrystalline Photovoltaic Modules
Mounting Type Roof mounted, extruded aluminium track system
Inverter Type 3 phase grid tired inverter
Payback period 6 – 7 years

Energy Management Guideline 2014
37
Except for the high electricity demand months in the winery, the PV system results in high solar
share. Figure 20 shows the electricity delivered by the PV system compared to the to the total
electricity demand. The PV system is optimised for the annual energy delivery. It is possible to
optimise the PV system for the month of high energy demand, however, that would mean that the
PV system will generate excess electricity. That could make business case if the excess electricity
could be sent to the grid.
Figure 20: PV energy share on total energy demand
0
20 000
40 000
60 000
80 000
100 000
120 000
140 000Total Energy Demand KWh Solar PV energy (KWh)

Energy Management Guideline 2014
38
7 Access to finance
Energy efficiency and cost cutting initiatives outcomes require management commitment in order
to realise through benefits. This could in the form of human capital or in the form of capital
expenditure. By looking at the initial analysis as audits, the outcomes of those audits will require
these capital expenditure. It is crucial that a detailed project feasibility analysis is done in order to
determine the financial viability and technical feasibility.
Different wine farms will have different criteria of assessing the viability of capital projects. These
criteria may be used to sell the project internally to the management, help identify true benefits of
the project and assist in decision-making.
Various criteria can be used for the initial assessment. However, the most used criteria is the
payback period analysis. It is defined as the time period that will lapse before the accumulated
savings equals the initial expenditure. It is the initial cost divided by the net annual savings
generated.
𝑃𝑎𝑦𝑏𝑎𝑐𝑘 = 𝑇𝑜𝑡𝑎𝑙 𝑐𝑎𝑝𝑖𝑡𝑎𝑙 𝑐𝑜𝑠𝑡 𝑜𝑓 𝑝𝑟𝑜𝑗𝑒𝑐𝑡
𝑁𝑒𝑡 𝑎𝑛𝑛𝑢𝑎𝑙 𝑠𝑎𝑣𝑖𝑛𝑔𝑠
There are number of ways of raising the capital required for the projects. The winery can raise the
capital internally. This can be through the winery’s capital budget. The initial analysis would have
to have a compelling argument, as it would probably be competing against other internal projects.
The winery can also raise capital through external finance. External finance could be in the form of
a straight load or other form of complicated deal. The winery could appoint an external project
management company who is then paid a proportion of the savings. Another interesting deal is
when the outside company takes over the supply of utility. In the case of an energy equipment, the
outside company would put up the required capital, install the equipment and take over the
operation completely. It then charges the host company a service charge. The advantage for the
host company is that it pays lower costs for the service without putting up capital expenditure.
Various institutions can be accessed for finance in South Africa:
Department of Energy/ EEDSM Programme (Grants) –
www.energy.gov.za/files/eee_frame.html
Development Bank of Southern Africa/ Green Fund (Grants) – www.sagreenfund.org.za
Eskom Rebates – http://www.eskom.co.za/sites/idm/Pages/Funding%20Options.aspx
IDC Green Funds (Loans) – http://www.idc.co.za/development-funds/geef

Energy Management Guideline 2014
39
8 Service Provider Questionnaire
The energy efficiency and cost cutting initiatives are usually capital intensive. It is advisable that
the winemaker approaches this systematic. The first step would be, after identifying low hanging
fruit (potential savings in the company) to engage with the service provider. This would be on high
level where the wine maker can pose all the relevant questions that would assist in decision-
making. Key critical questions would be useful to the winemaker in deciding whether to go ahead
with the project. The Table 4 below gives a questionnaire that the wine maker can use to engage
with the service provider when deciding on the viability of the project.
Table 4: Questionnaire for the service provider
Energy efficiency plan The wine maker should have a written energy efficiency plan that details
the methods of energy consumption reduction within the wine farm. This
should include energy consumption reduction strategy, training of
personnel to improve energy consumption and monitoring programmes. A
documented energy efficiency plan will assist the wine farm to achieve the
energy efficiency and cost reduction in a formal manner. A plan will
document how, when and where energy use will be monitored and how
the results will be used to improve energy efficiency.
Do you have an executive level commitment to a successful
energy management?
Have you assigned an in house energy manager to oversee
management of energy at your winery?
Do you track costs and benefits of energy management?
Have you developed an inherent system for continuous
improvement of energy management?
Energy monitoring Energy consumption data should be collected to enable detailed analysis
of the winery energy usage. Real time data will allow the wine maker to
identify peak demands and high energy usage processes that could be
targeted for energy reduction. The energy consumption records could be
in the form of monthly financial statement or in the form of:
Electricity usage (kWh)
Diesel usage (Litres)
Petrol (Litres)
Coal (tonnes)

Energy Management Guideline 2014
40
Have you established baseline using appropriate measures of
performance for each system?
Have you quantified current energy used and losses?
Do you shift electricity consumption into less expensive off-peak
times?
Have you evaluated using alternative and/or renewable energy
like wind, solar, biofuels, others?
Do you incorporate carbon footprint information in all energy
management evaluations?
Equipment servicing
and optimization
Energy efficiency should be put on high priority when purchasing new
equipment. Also, the existing equipment should be serviced regularly and
repaired whenever necessary to ensure optimum energy consumption.
Optimization of
refrigeration and
cooling efficiencies
Refrigeration and cooling system provide an opportunity for the cost
reduction and energy efficiency. This can simple be achieved by optimising
the existing equipment.
Have you reduced suction pressure to reduce compressor power
and save energy?
Do you variably adjust condenser set-point temperature to
optimize compressor pressure difference for varying ambient
temperatures?
Have you reduced excess heat gain from: interior lights (replace
with LED), inadequate defrosting, inadequate insulation, excessive
air exchange, worn weather stripping, etc.?
Have you insulated refrigeration lines?
Do you optimise tank volume?
Have you installed variable speed controls (where necessary) on
condenser and evaporator?
Are you using the most
efficient lighting
sources
Space lighting provides an opportunity for cost reduction and efficient
energy use. This can be achieved by replacing the existing light bulbs with
more energy efficient light bulbs. Also, the existing energy equipment can
be optimised for better operation.
Have you established necessary light levels for specific areas when
used and unused?
Have you reduced lighting levels where appropriate?
Do you utilize lighting controls (time clocks, by-pass/delay timers,
motion detectors)?
Do you make use of natural lighting (windows and skylights)?

Energy Management Guideline 2014
41
Utilization of
programmes to
maintain and operate
all motors, belts,
drives, fans, pumps
and compressors for
optimum energy use
Overall, there should be programmes in place for all the energy consuming
equipment in the wine farm. Energy reduction and costs cutting will not
occur homogenously, however, the combination of these programmes
may result in breakthrough improvements.
Have you installed properly sized premium efficiency motors?
Have you installed timers and sensor controls to turn off during
idle time?
Have you installed properly sized energy efficient pumps and fans?
Do you perform regular preventative maintenance?

Energy Management Guideline 2014
42
Conclusion
This Energy Management Guidelines for Wineries was compiled for review by members of
Winetech. In contrast to other international energy efficiency guidelines for wineries, the
document attempts to explain the principles and steps of an Energy Management System (EnMS)
as outlined in ISO50001 and illustrates how an EnMS may be applied to a winery situation.
Furthermore, it shows by way of case studies from South African wineries, typical energy savings
opportunities that exist.