Embed Size (px)
Citation preview
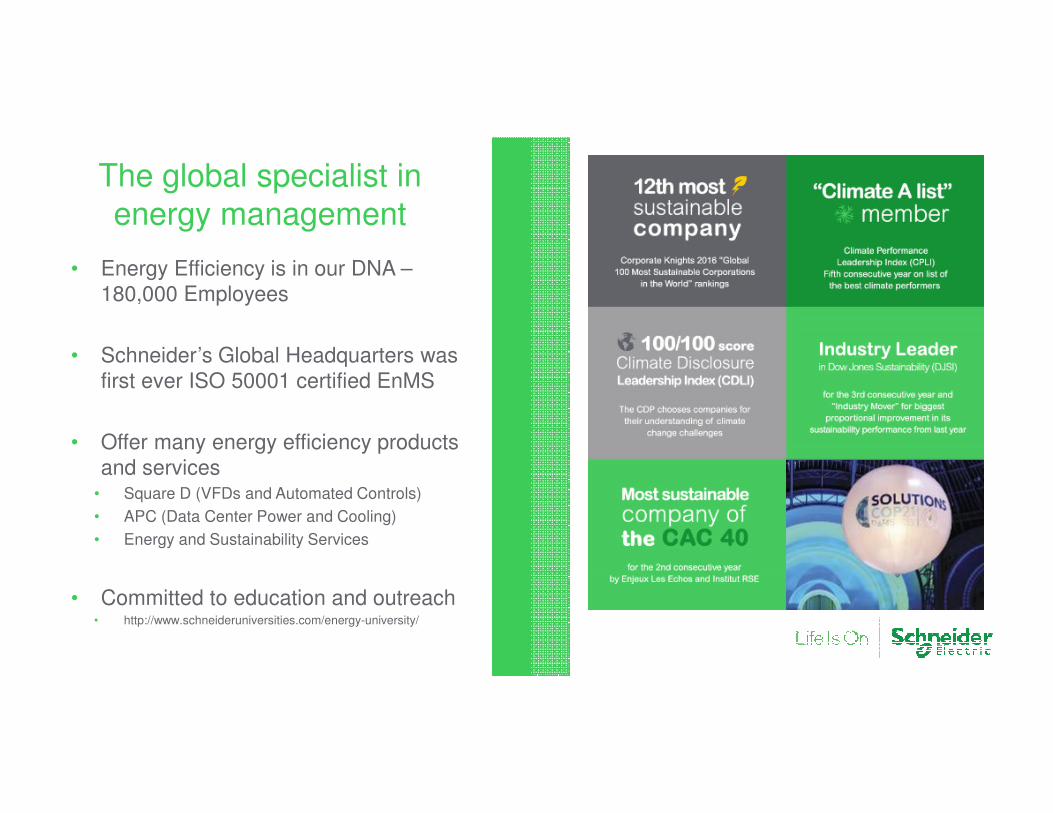
The global specialist in energy management
• Energy Efficiency is in our DNA –180,000 Employees
• Schneider’s Global Headquarters was first ever ISO 50001 certified EnMS
• Offer many energy efficiency products and services
• Square D (VFDs and Automated Controls)
• APC (Data Center Power and Cooling)
• Energy and Sustainability Services
• Committed to education and outreach• http://www.schneideruniversities.com/energy-university/
Page 3
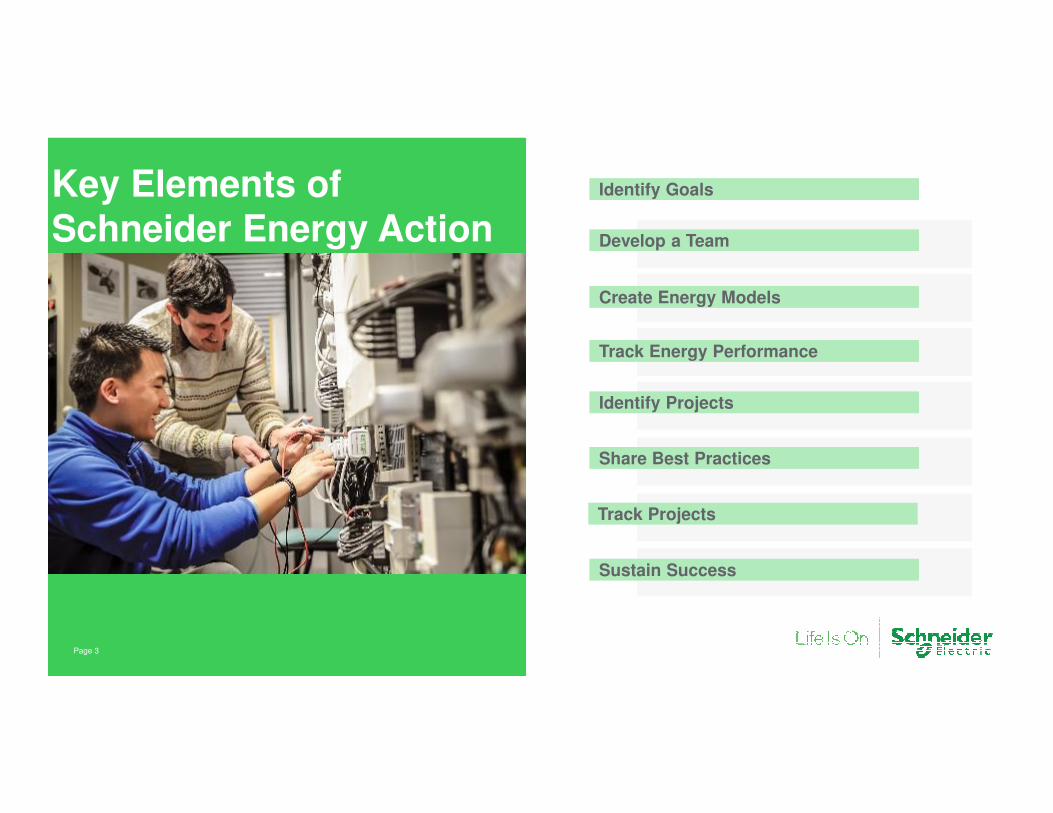
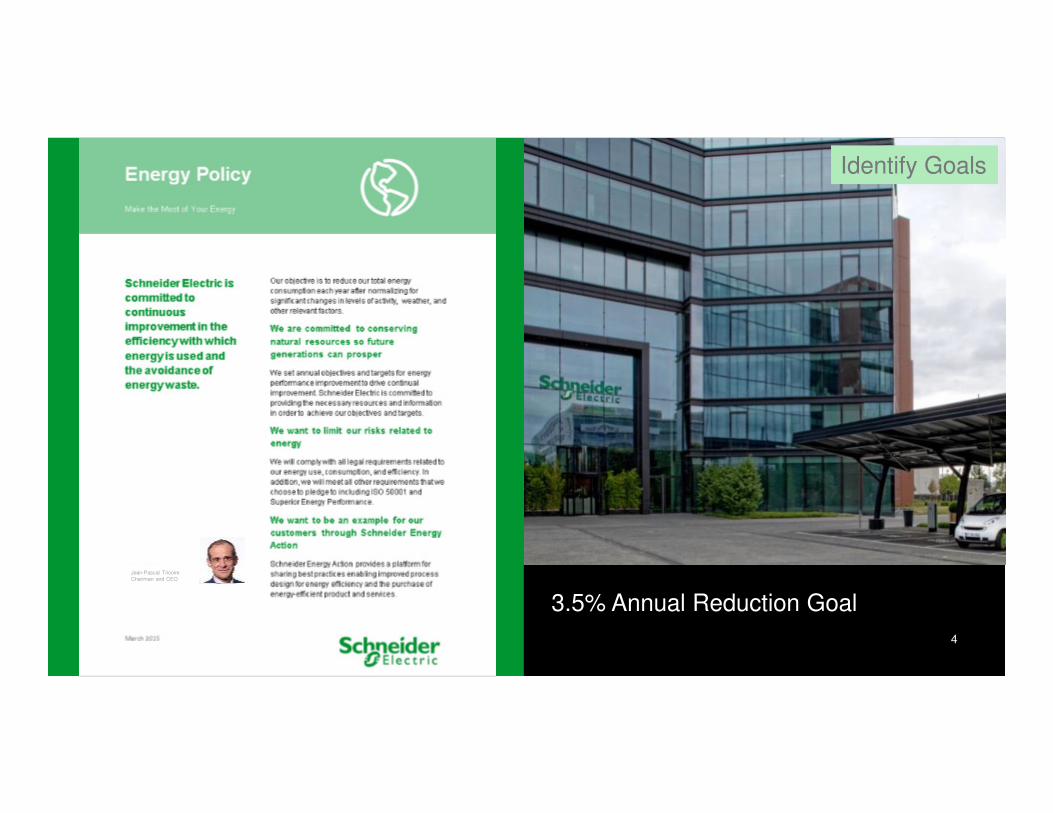
Identify Goals
Develop a Team
Create Energy Models
Track Energy Performance
Identify Projects
Share Best Practices
Track Projects
Sustain Success
Key Elements of
Schneider Energy Action
4
3.5% Annual Reduction Goal
Jean-Pascal TricoireChairman and CEO
Identify Goals
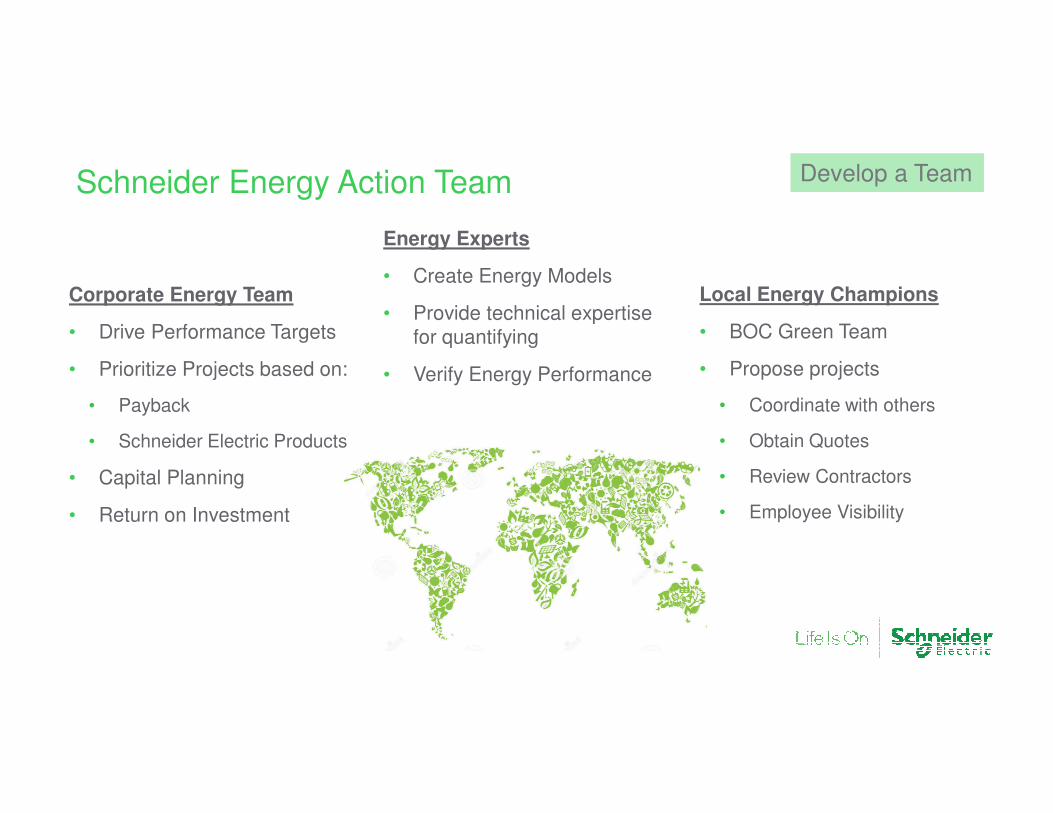
Corporate Energy Team
• Drive Performance Targets
• Prioritize Projects based on:
• Payback
• Schneider Electric Products
• Capital Planning
• Return on Investment
Energy Experts
• Create Energy Models
• Provide technical expertise for quantifying
• Verify Energy Performance
Local Energy Champions
• BOC Green Team
• Propose projects
• Coordinate with others
• Obtain Quotes
• Review Contractors
• Employee Visibility
Schneider Energy Action Team Develop a Team
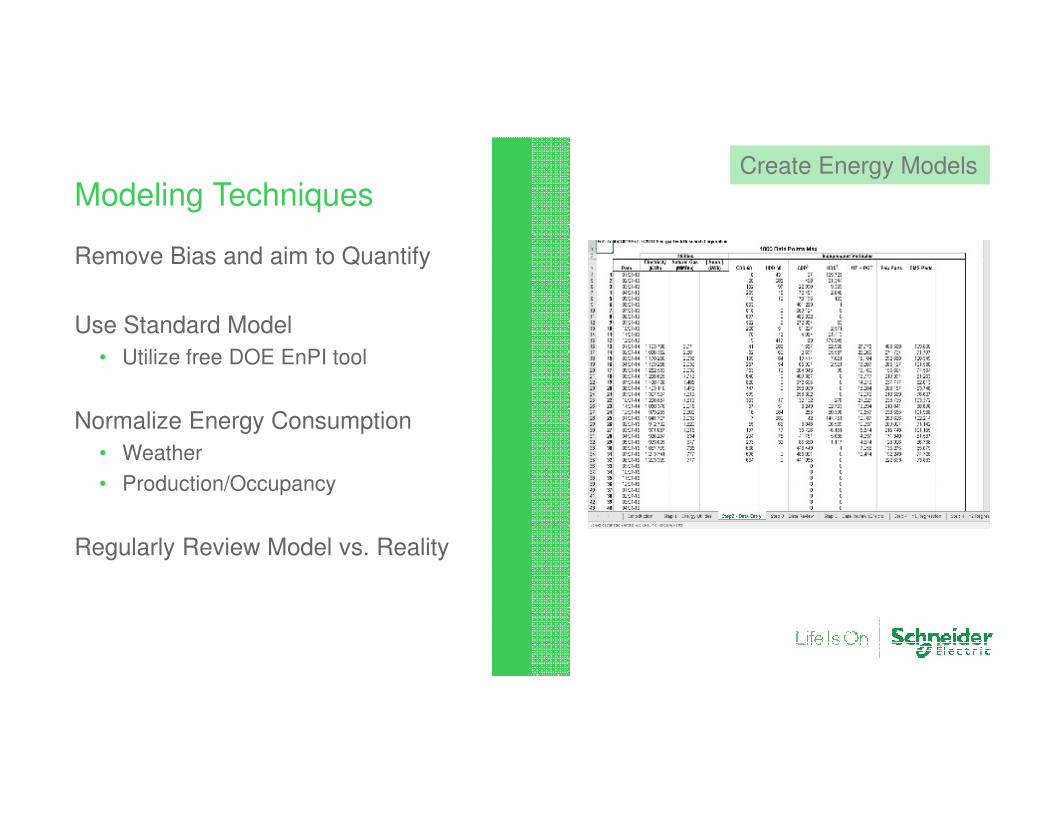
Remove Bias and aim to Quantify
Use Standard Model
• Utilize free DOE EnPI tool
Normalize Energy Consumption
• Weather
• Production/Occupancy
Regularly Review Model vs. Reality
Modeling TechniquesCreate Energy Models
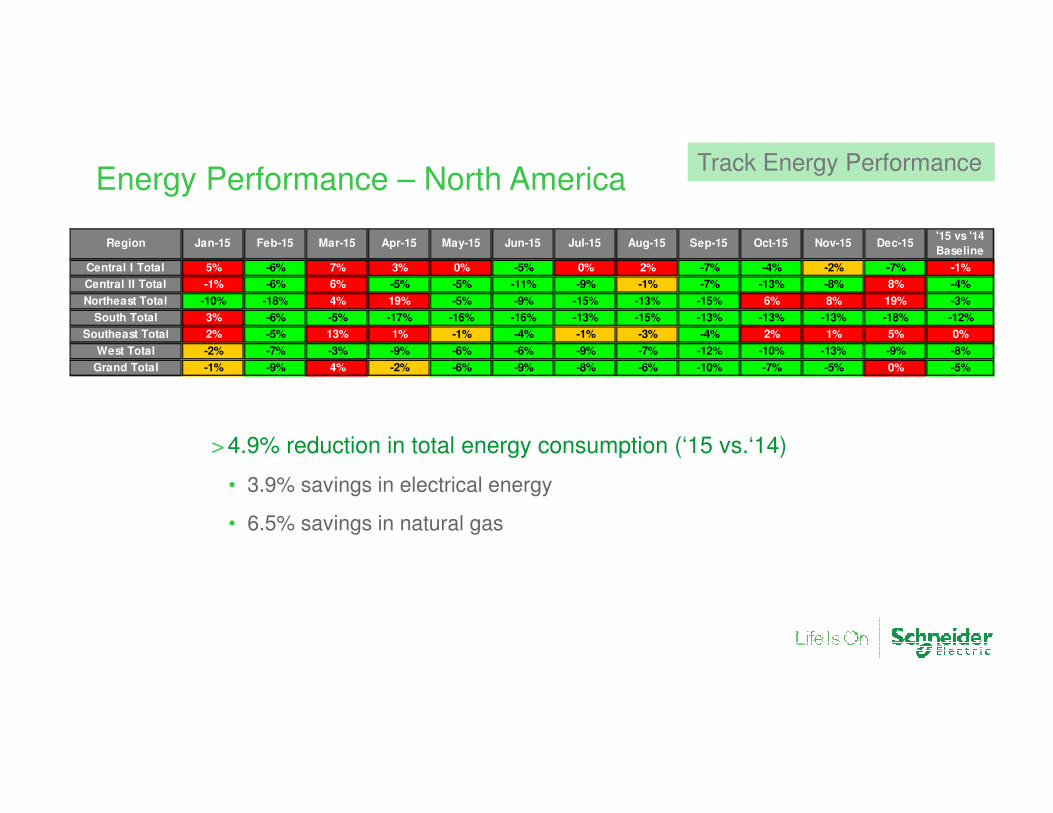
Energy Performance – North America
>4.9% reduction in total energy consumption (‘15 vs.‘14)
• 3.9% savings in electrical energy
• 6.5% savings in natural gas
Region Jan-15 Feb-15 Mar-15 Apr-15 May-15 Jun-15 Jul-15 Aug-15 Sep-15 Oct-15 Nov-15 Dec-15'15 vs '14
Baseline
Central I Total 5% -6% 7% 3% 0% -5% 0% 2% -7% -4% -2% -7% -1%
Central II Total -1% -6% 6% -5% -5% -11% -9% -1% -7% -13% -8% 8% -4%
Northeast Total -10% -18% 4% 19% -5% -9% -15% -13% -15% 6% 8% 19% -3%
South Total 3% -6% -5% -17% -16% -16% -13% -15% -13% -13% -13% -18% -12%
Southeast Total 2% -5% 13% 1% -1% -4% -1% -3% -4% 2% 1% 5% 0%
West Total -2% -7% -3% -9% -6% -6% -9% -7% -12% -10% -13% -9% -8%
Grand Total -1% -9% 4% -2% -6% -9% -8% -6% -10% -7% -5% 0% -5%
Track Energy Performance
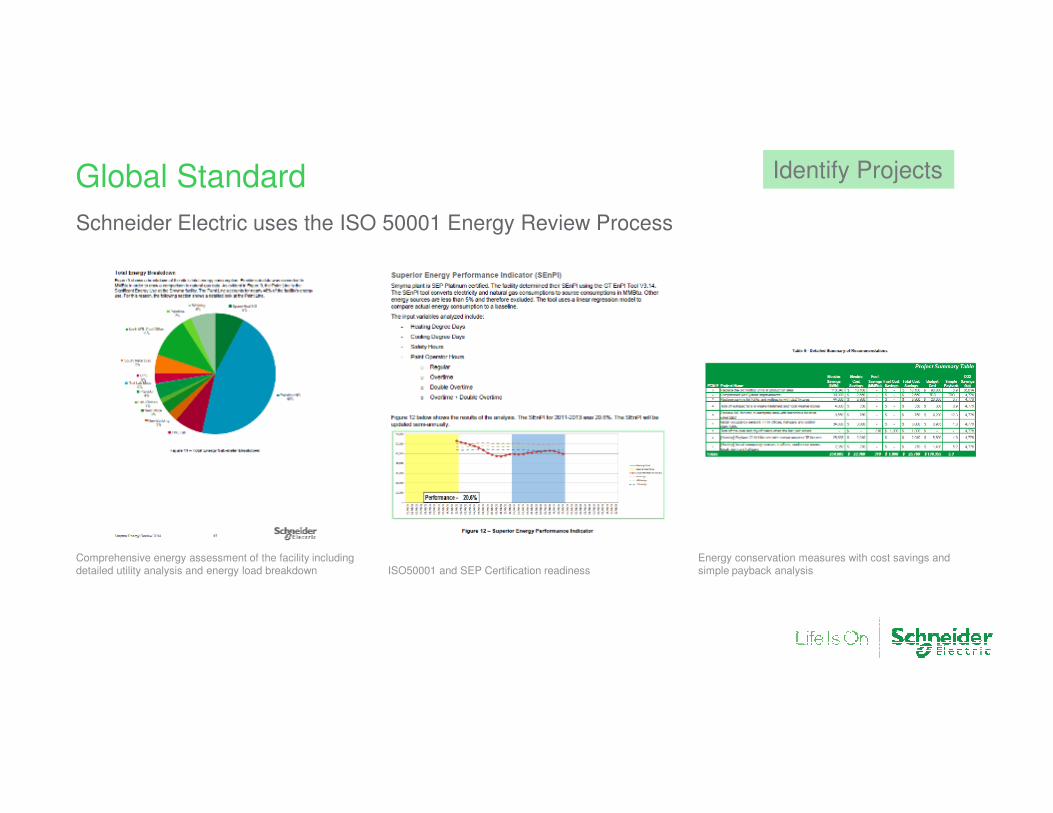
Comprehensive energy assessment of the facility including detailed utility analysis and energy load breakdown
Energy conservation measures with cost savings and simple payback analysisISO50001 and SEP Certification readiness
Global Standard
Schneider Electric uses the ISO 50001 Energy Review Process
Identify Projects

Page 9
Boston ONE CampusGreen Energy Team
Team Leader:
Chris LaFleur – Engineer Building ManagementSystems Development
Sponsor:
Barry Coflan – CTO EcoBuilding
Frequency of Meetings: ~ 6 Per Year
Mission:Voluntary initiative to investigate, plan and enableAnd communicate energy optimization solutionsfor Boston Campus, in collaboration with BOCsite management and in consultation withSchneider Subject Matter Experts.
2016 Objectives: Support for ISO 50001 CertificationSupport improvements from 2015 energy auditSupport BOC to DSP (meter data to the cloud)Support LED Parking Lights & Micro Grid
Share Best Practices
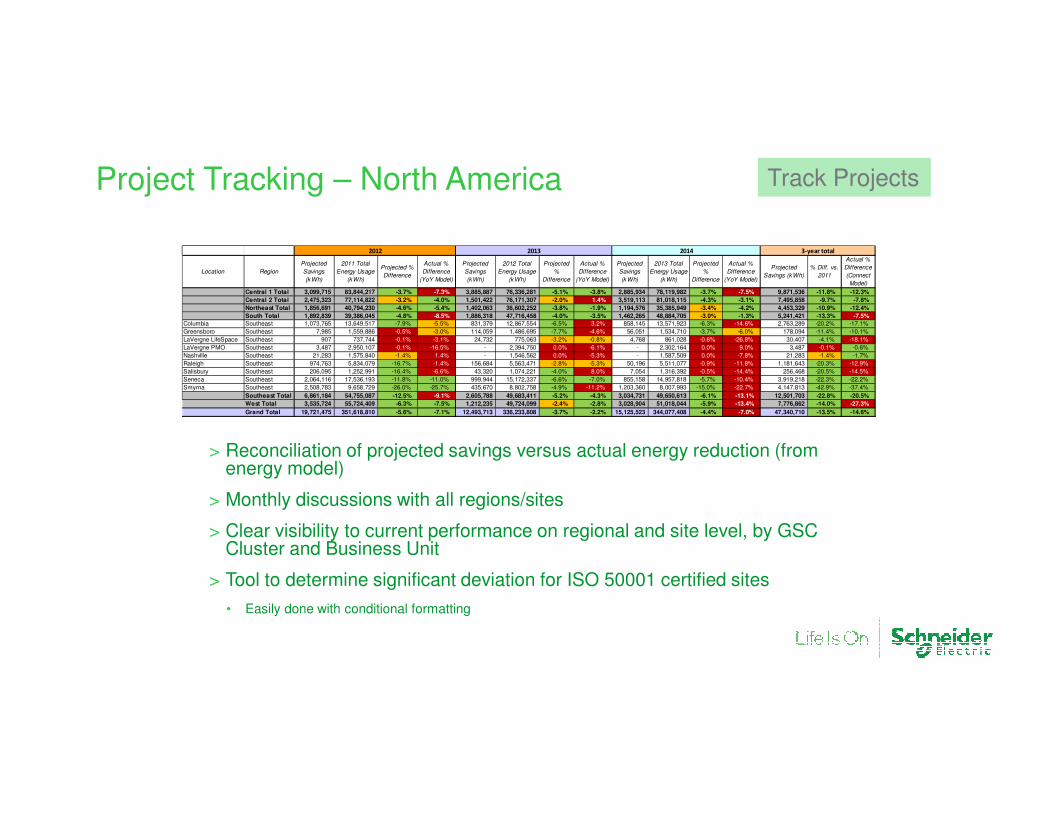
Project Tracking – North America
> Reconciliation of projected savings versus actual energy reduction (from energy model)
> Monthly discussions with all regions/sites
> Clear visibility to current performance on regional and site level, by GSC Cluster and Business Unit
> Tool to determine significant deviation for ISO 50001 certified sites
• Easily done with conditional formatting
Location Region
Projected
Savings
(kWh)
2011 Total
Energy Usage
(kWh)
Projected %
Difference
Actual %
Difference
(YoY Model)
Projected
Savings
(kWh)
2012 Total
Energy Usage
(kWh)
Projected
%
Difference
Actual %
Difference
(YoY Model)
Projected
Savings
(kWh)
2013 Total
Energy Usage
(kWh)
Projected
%
Difference
Actual %
Difference
(YoY Model)
Projected
Savings (kWh)
% Diff. vs.
2011
Actual %
Difference
(Connect
Model)
Central 1 Total 3,099,715 83,844,217 -3.7% -7.3% 3,885,887 76,336,281 -5.1% -3.8% 2,885,934 78,119,982 -3.7% -7.5% 9,871,536 -11.8% -12.3%
Central 2 Total 2,475,323 77,114,822 -3.2% -4.0% 1,501,422 76,171,307 -2.0% 1.4% 3,519,113 81,018,115 -4.3% -3.1% 7,495,858 -9.7% -7.8%
Northeast Total 1,856,691 40,794,230 -4.6% -5.4% 1,402,063 36,602,252 -3.8% -1.9% 1,194,576 35,385,949 -3.4% -4.2% 4,453,329 -10.9% -12.4%
South Total 1,892,839 39,386,045 -4.8% -8.5% 1,886,318 47,716,458 -4.0% -3.5% 1,462,265 48,884,705 -3.0% -1.3% 5,241,421 -13.3% -7.5%
Columbia Southeast 1,073,765 13,649,517 -7.9% -5.5% 831,379 12,867,554 -6.5% 3.2% 858,145 13,571,923 -6.3% -14.6% 2,763,289 -20.2% -17.1%
Greensboro Southeast 7,985 1,559,886 -0.5% -3.0% 114,059 1,486,695 -7.7% -4.6% 56,051 1,534,710 -3.7% -6.0% 178,094 -11.4% -10.1%
LaVergne LifeSpace Southeast 907 737,744 -0.1% -3.1% 24,732 775,063 -3.2% -0.8% 4,768 861,028 -0.6% -26.8% 30,407 -4.1% -18.1%
LaVergne PMO Southeast 3,487 2,950,107 -0.1% -16.5% - 2,394,750 0.0% -6.1% - 2,302,164 0.0% 9.0% 3,487 -0.1% -0.6%
Nashville Southeast 21,283 1,575,840 -1.4% 1.4% - 1,546,562 0.0% -5.3% - 1,587,509 0.0% -7.8% 21,283 -1.4% -1.7%
Raleigh Southeast 974,763 5,834,079 -16.7% -1.4% 156,684 5,563,471 -2.8% -5.3% 50,196 5,511,077 -0.9% -11.8% 1,181,643 -20.3% -12.9%
Salisbury Southeast 206,095 1,252,991 -16.4% -6.6% 43,320 1,074,221 -4.0% 8.0% 7,054 1,316,392 -0.5% -14.4% 256,468 -20.5% -14.5%
Seneca Southeast 2,064,116 17,536,193 -11.8% -11.0% 999,944 15,172,337 -6.6% -7.0% 855,158 14,957,818 -5.7% -10.4% 3,919,218 -22.3% -22.2%
Smyrna Southeast 2,508,783 9,658,729 -26.0% -25.7% 435,670 8,802,758 -4.9% -11.2% 1,203,360 8,007,993 -15.0% -22.7% 4,147,813 -42.9% -37.4%
Southeast Total 6,861,184 54,755,087 -12.5% -9.1% 2,605,788 49,683,411 -5.2% -4.3% 3,034,731 49,650,613 -6.1% -13.1% 12,501,703 -22.8% -20.5%
West Total 3,535,724 55,724,409 -6.3% -7.5% 1,212,235 49,724,099 -2.4% -2.8% 3,028,904 51,018,044 -5.9% -13.4% 7,776,862 -14.0% -27.3%
Grand Total 19,721,475 351,618,810 -5.6% -7.1% 12,493,713 336,233,808 -3.7% -2.2% 15,125,523 344,077,408 -4.4% -7.0% 47,340,710 -13.5% -14.6%
2012 2013 2014 3-year total
Track Projects
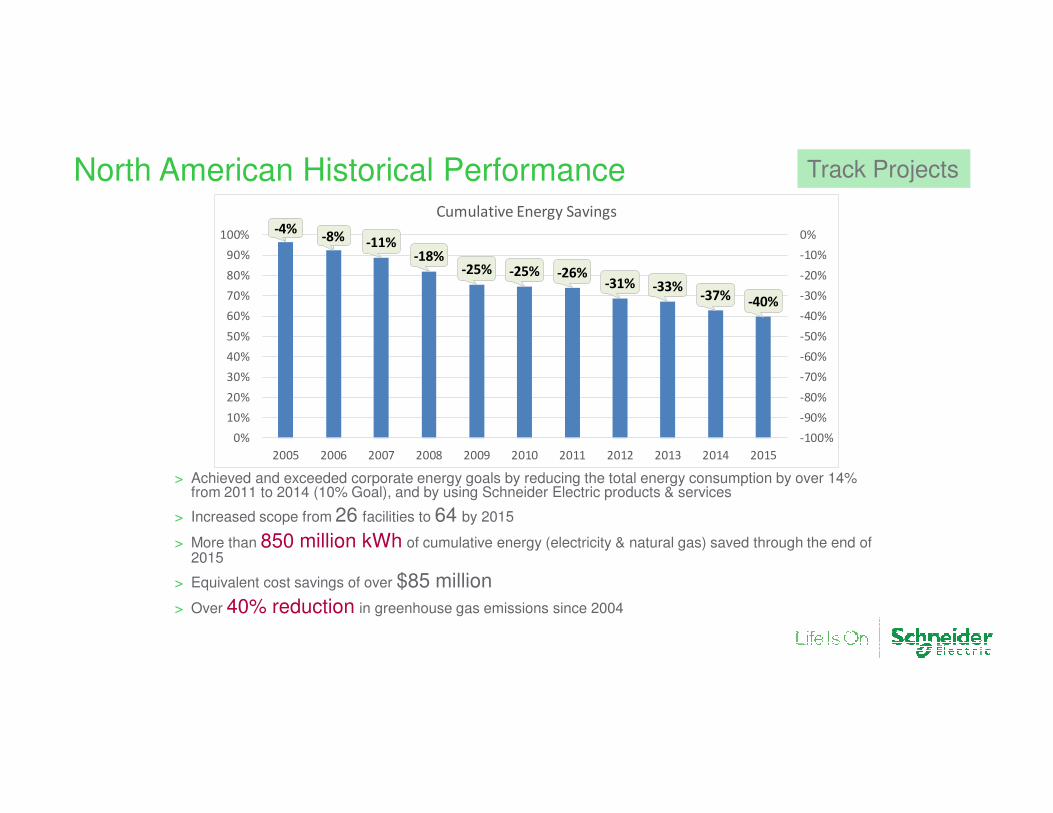
North American Historical Performance
> Achieved and exceeded corporate energy goals by reducing the total energy consumption by over 14% from 2011 to 2014 (10% Goal), and by using Schneider Electric products & services
> Increased scope from 26 facilities to 64 by 2015
> More than 850 million kWh of cumulative energy (electricity & natural gas) saved through the end of 2015
> Equivalent cost savings of over $85 million
> Over 40% reduction in greenhouse gas emissions since 2004
-4%-8% -11%
-18%-25% -25% -26%
-31% -33%-37% -40%
-100%
-90%
-80%
-70%
-60%
-50%
-40%
-30%
-20%
-10%
0%
0%
10%
20%
30%
40%
50%
60%
70%
80%
90%
100%
2005 2006 2007 2008 2009 2010 2011 2012 2013 2014 2015
Cumulative Energy Savings
Track Projects
Why Implement ISO 50001?
> ISO 50001 Builds on Existing Energy Program
• Schneider North America reduced consumption by 40% over last 10 years
• Goal is to reduce by another 10 % from 2015-2017
> Superior Energy Performance
• External recognition for energy reduction
• 3rd party validation of Schneider Energy Action
• Improves internal recognition of energy performance
> Verify Results with Enterprise-wide Action Plan
• Consistent method for tracking projects
• Allows for best practice sharing and ROI lookup for similar projects
Share Best Practices
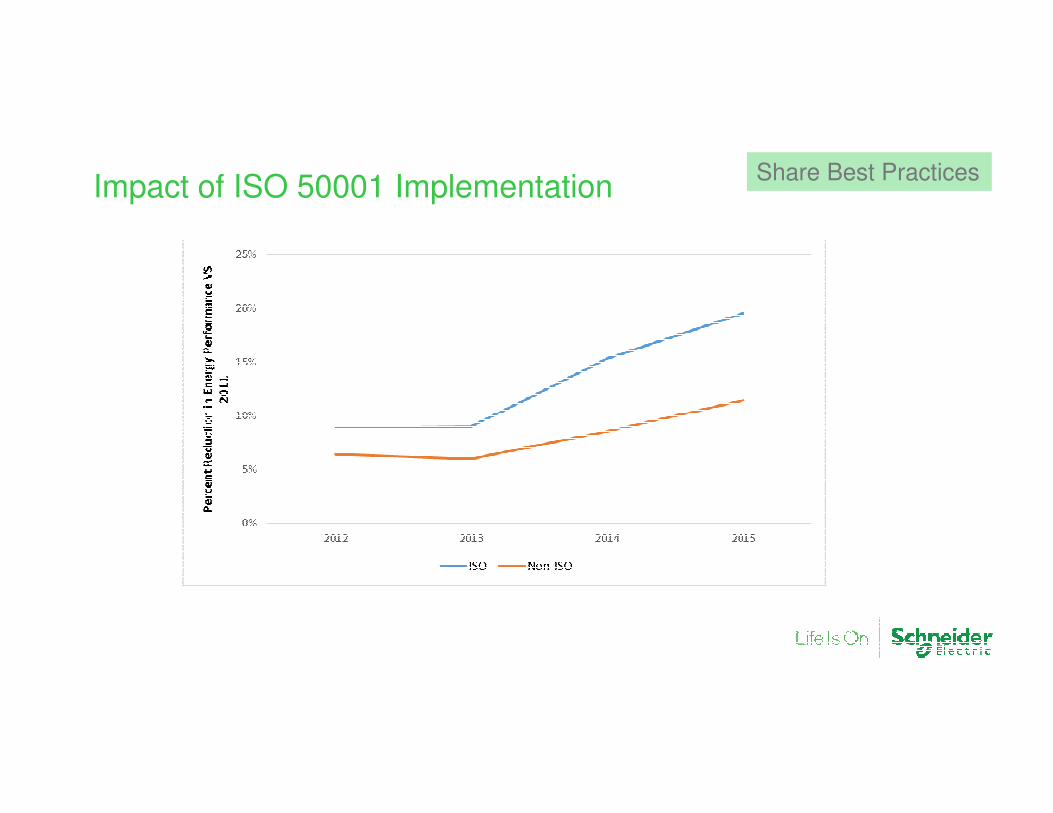
Impact of ISO 50001 ImplementationShare Best Practices
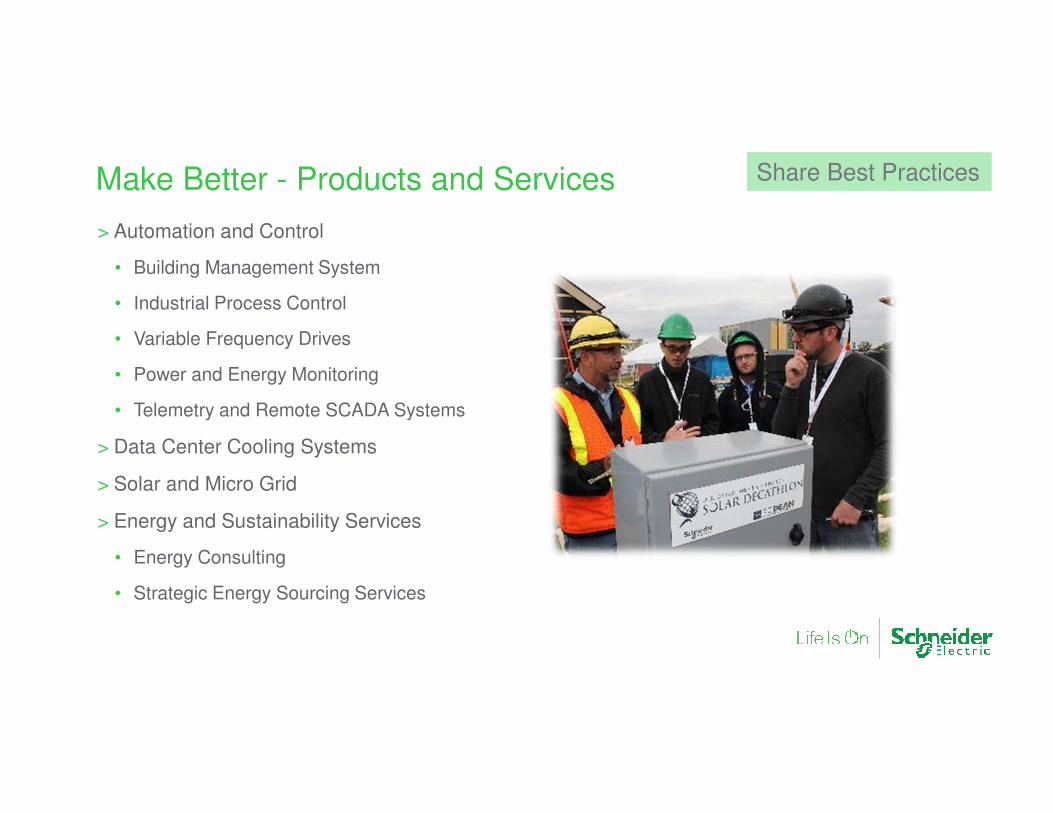
Make Better - Products and Services
> Automation and Control
• Building Management System
• Industrial Process Control
• Variable Frequency Drives
• Power and Energy Monitoring
• Telemetry and Remote SCADA Systems
> Data Center Cooling Systems
> Solar and Micro Grid
> Energy and Sustainability Services
• Energy Consulting
• Strategic Energy Sourcing Services
Share Best Practices
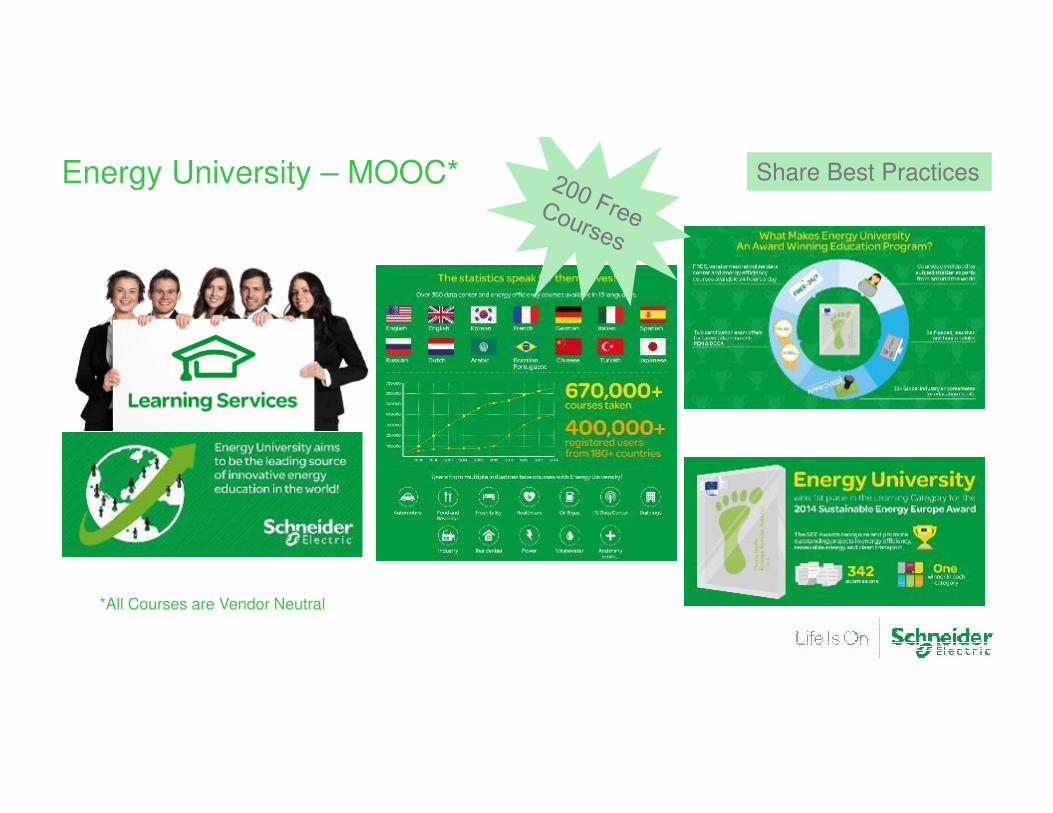
Energy University – MOOC* Share Best Practices
*All Courses are Vendor Neutral
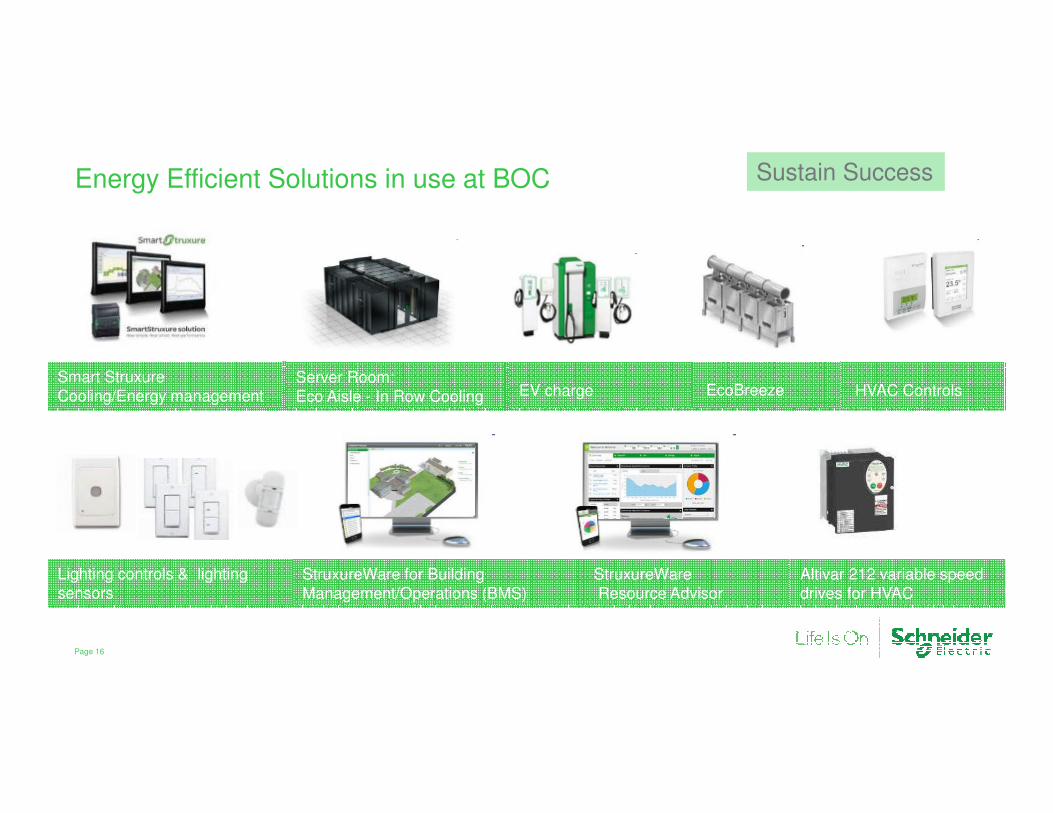
Energy Efficient Solutions in use at BOC
Page 16
Smart StruxureCooling/Energy management
Server Room:Eco Aisle - In Row Cooling EV charge EcoBreeze HVAC Controls
Lighting controls & lighting sensors
StruxureWare for Building Management/Operations (BMS)
StruxureWareResource Advisor
Altivar 212 variable speed drives for HVAC
Sustain Success
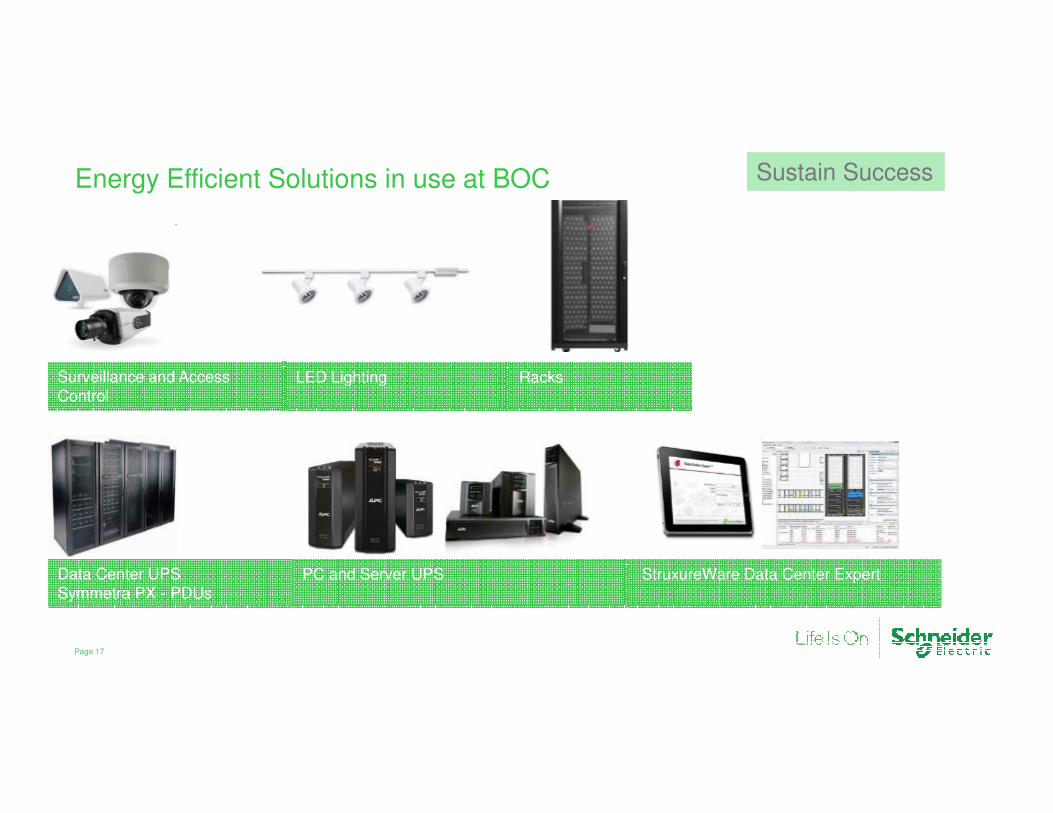
Energy Efficient Solutions in use at BOC
Page 17
Surveillance and Access Control
LED Lighting Racks
StruxureWare Data Center ExpertData Center UPSSymmetra PX - PDUs
PC and Server UPS
Sustain Success
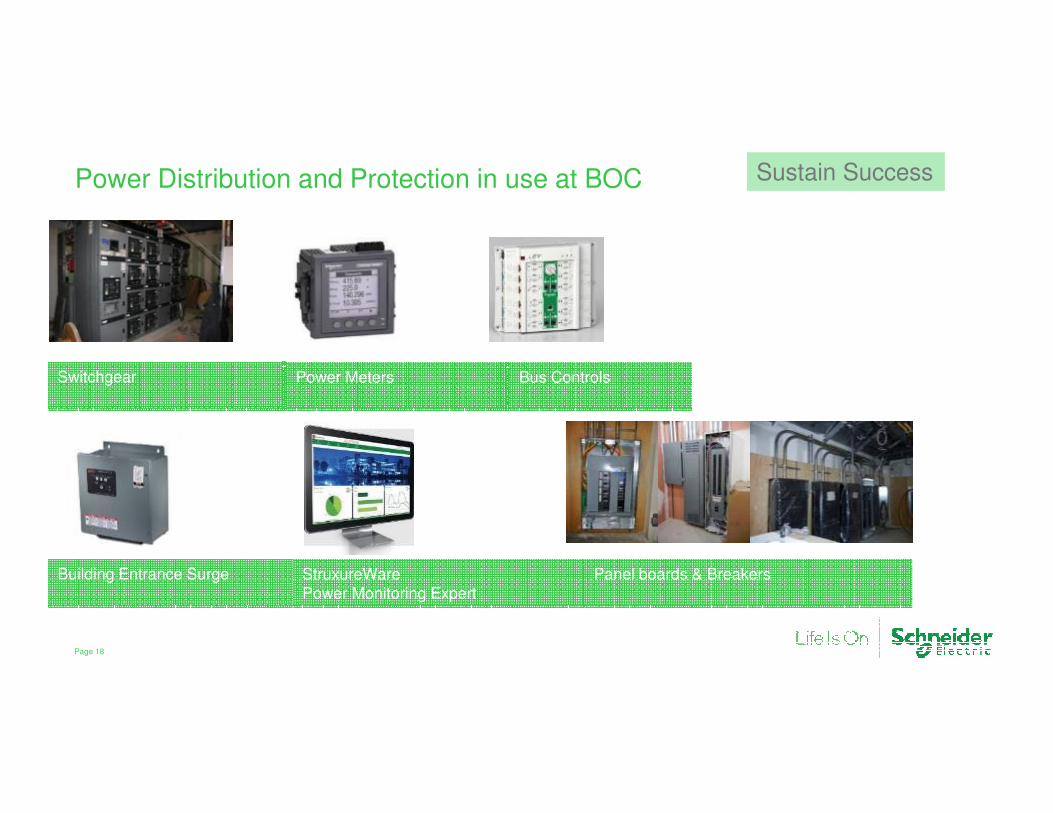
Power Distribution and Protection in use at BOC
Page 18
Switchgear Power Meters Bus Controls
Building Entrance Surge StruxureWarePower Monitoring Expert
Panel boards & Breakers
Sustain Success
Example of a microgrid at BOC
> Pilot Project – Schneider and Duke are partnering for growth and success in the emerging market for microgrids
• BOC is an opportunity to “test drive” our approach by working together – reliability, safety, and economics at scale are critical to success.
> Solution Showcase – Schneider and Duke will give customer tours of BOC to showcase the benefits of our microgrid solutions
• 400 kW of PV utilizing Schneider inverters
• Schneider’s microgrid controller and StruxureWare DSO will optimize use of PV, storage, and BOC’s existing natural gas genset during grid-connected and islanded operation
> Innovation – Schneider engineers will advance the state of the art using BOC as a “living laboratory”
• Schneider is incorporating a microgrid innovation “sandbox” that minimizes risk to essential BOC functions during microgrid R&D and customer demonstrations
Sustain Success
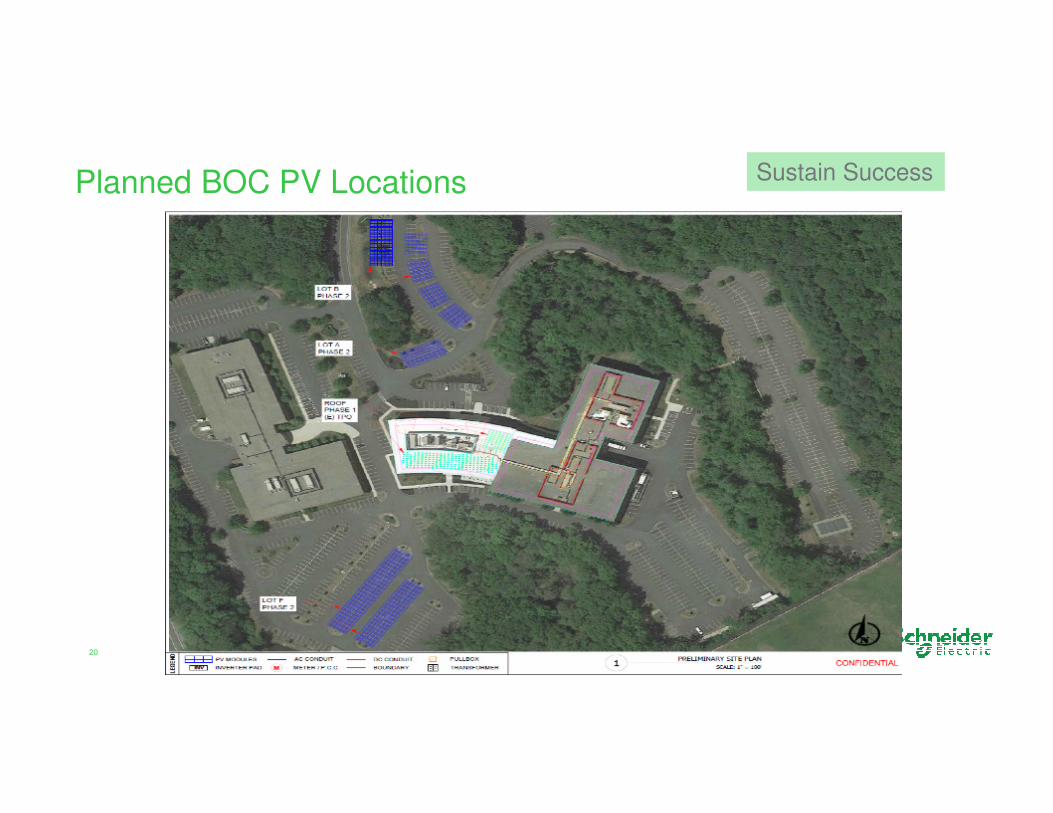
Planned BOC PV Locations
20
Sustain Success
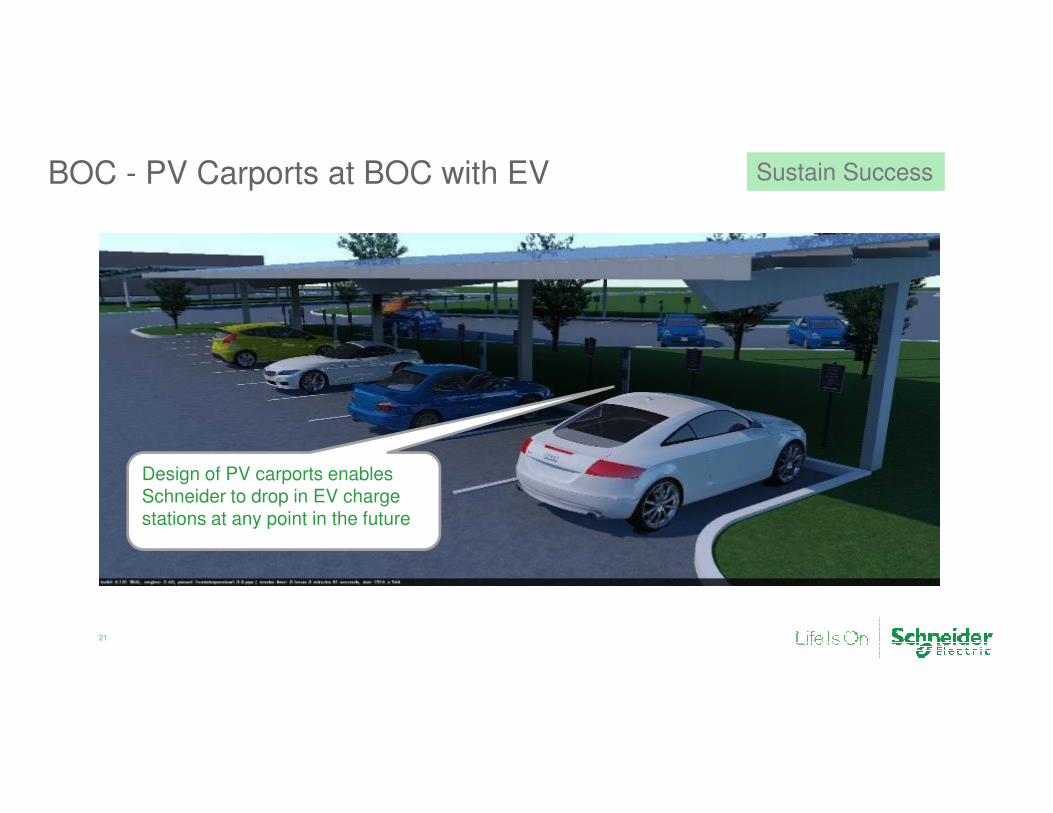
BOC - PV Carports at BOC with EV
21
Design of PV carports enables Schneider to drop in EV charge stations at any point in the future
Sustain Success