Embed Size (px)
Citation preview
Energy Conversion and Management 101 (2015) 336–342
Contents lists available at ScienceDirect
Energy Conversion and Management
journal homepage: www.elsevier .com/locate /enconman
Centrifugal compressor efficiency improvement and its environmentalimpact in waste water treatment
http://dx.doi.org/10.1016/j.enconman.2015.05.0540196-8904/� 2015 Elsevier Ltd. All rights reserved.
⇑ Corresponding author. Tel.: +358 40 1795152.E-mail address: [email protected] (J. Viholainen).
J. Viholainen a,⇑, K. Grönman a, A. Jaatinen-Värri a, A. Grönman a, P. Ukkonen b, M. Luoranen a
a Lappeenranta University of Technology, P.O. Box 20, 53850 Lappeenranta, Finlandb Sulzer Pumps Finland, Turvekuja 6, 00700 Helsinki, Finland
a r t i c l e i n f o a b s t r a c t
Article history:Received 16 January 2015Accepted 25 May 2015Available online 10 June 2015
Keywords:Centrifugal compressorEnergy efficiencyLife-cycle assessmentWaste water treatment
Energy costs typically dominate the life-cycle costs of centrifugal compressors used in various industrialand municipal processes, making the compressor an attractive target for energy efficiency improvements.This study considers the achievable energy savings of using three different diffuser types in a centrifugalcompressor supporting a typical end-use process in a waste water treatment plant. The effect of theenergy efficiency improvements on the annual energy use and the environmental impacts are demon-strated with energy calculations and life-cycle assessment considering the selected compressor task inthe waste water aeration. Besides the achievable energy saving benefits in the wastewater aeration pro-cess, the presented study shows the influence of the additional material needed in the diffuser manufac-turing on the total greenhouse gas emissions of the compressor life-cycle. According to the calculationsand assessment results, the studied diffuser types have a significant effect on the compressor energy useand environmental impacts when the compressor is operated in the aeration task. The achievable annualenergy savings in this case were 2.5–4.9% in comparison with the baseline scenario. Also, the influence ofthe additional material and energy use for manufacturing the diffuser are insignificant compared with theavoided greenhouse gas reduction potential.
� 2015 Elsevier Ltd. All rights reserved.
1. Introduction
The ongoing growth in global energy use, mainly based on fossilfuels, has increased the concentration of greenhouse gases in theatmosphere [1]. The continued greenhouse gas (GHG) emissionshave shown to result in temperature increase in the Earth’s climateleading to a pressing necessity to reduce the emissions [23]. Inaddition to the radical transform of the current energy systemsto carbon neutral systems, the increase in both production andend-use energy efficiency are among the key options to achievethe required GHG reductions [1,35,22].
Electric motors are responsible for the major part of the electri-cal energy use in industrial countries. In the EU, the share ofelectric motors is approximately 70% of the total electricity con-sumption [12]. Correspondingly, electric motor driven compres-sors are responsible for 18–25% of the industry’s electricity usein the EU, which makes the compressed-air systems an attractivetarget for energy efficiency improvements [35,5].
Centrifugal compressors are widely used for example in processindustry, oil and gas industry, waste water treatment, and
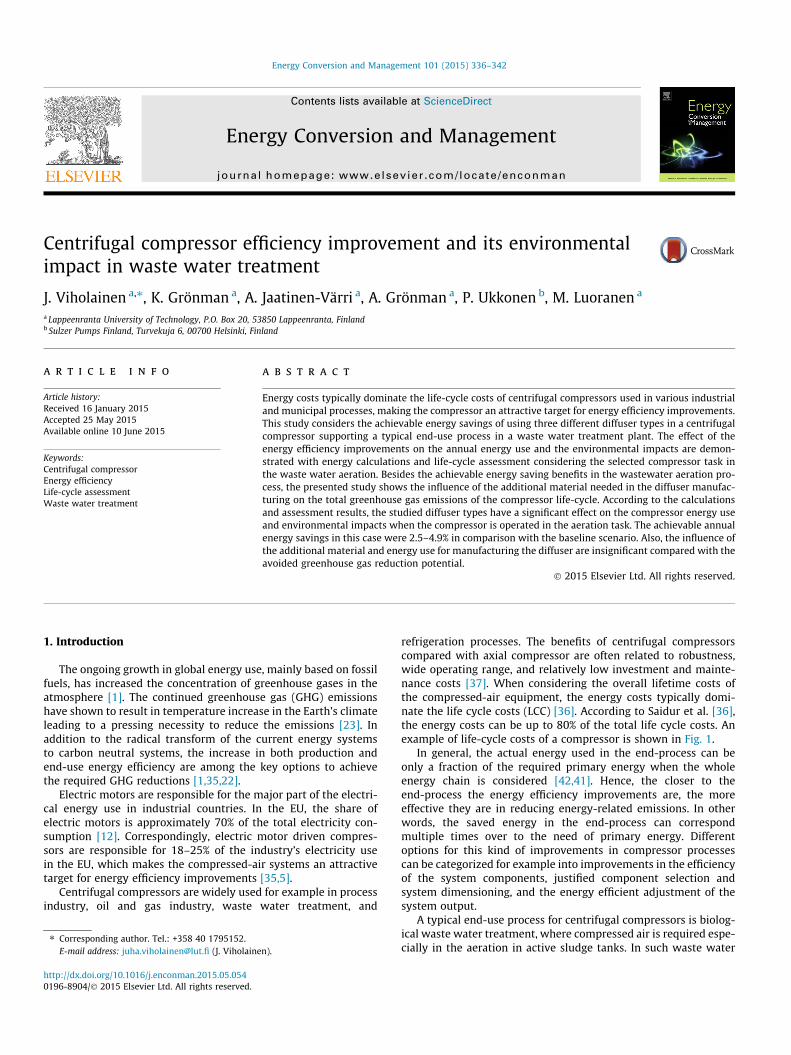
refrigeration processes. The benefits of centrifugal compressorscompared with axial compressor are often related to robustness,wide operating range, and relatively low investment and mainte-nance costs [37]. When considering the overall lifetime costs ofthe compressed-air equipment, the energy costs typically domi-nate the life cycle costs (LCC) [36]. According to Saidur et al. [36],the energy costs can be up to 80% of the total life cycle costs. Anexample of life-cycle costs of a compressor is shown in Fig. 1.
In general, the actual energy used in the end-process can beonly a fraction of the required primary energy when the wholeenergy chain is considered [42,41]. Hence, the closer to theend-process the energy efficiency improvements are, the moreeffective they are in reducing energy-related emissions. In otherwords, the saved energy in the end-process can correspondmultiple times over to the need of primary energy. Differentoptions for this kind of improvements in compressor processescan be categorized for example into improvements in the efficiencyof the system components, justified component selection andsystem dimensioning, and the energy efficient adjustment of thesystem output.
A typical end-use process for centrifugal compressors is biolog-ical waste water treatment, where compressed air is required espe-cially in the aeration in active sludge tanks. In such waste water
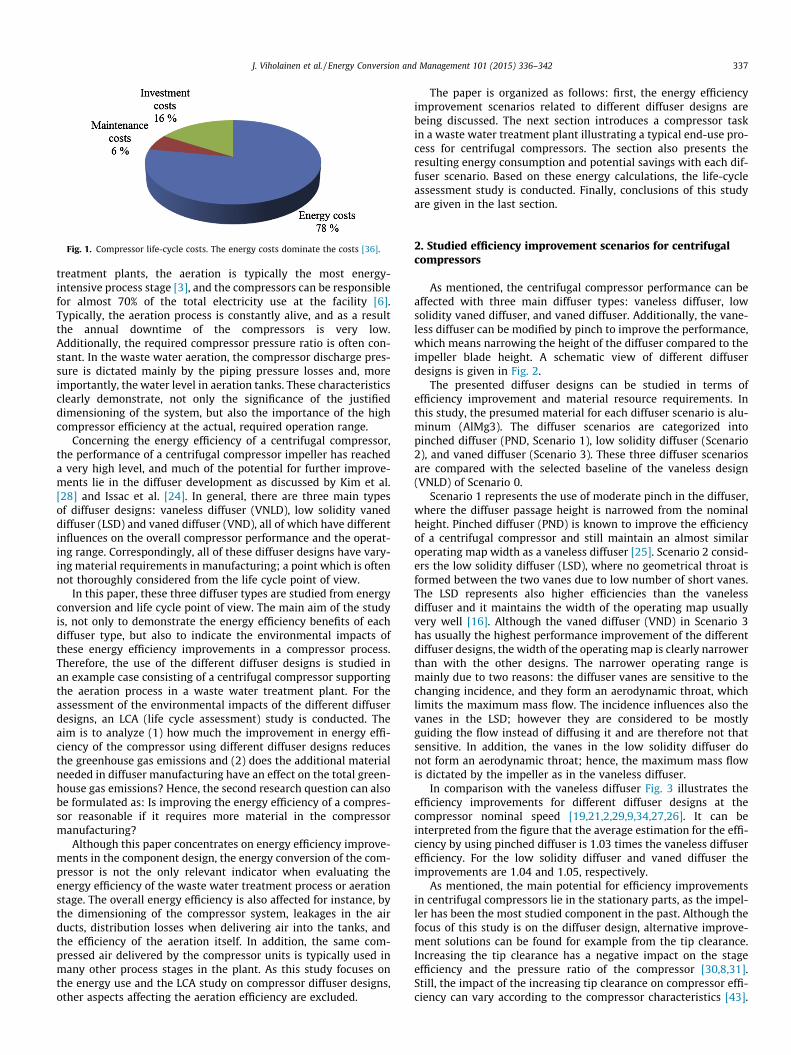
Fig. 1. Compressor life-cycle costs. The energy costs dominate the costs [36].
J. Viholainen et al. / Energy Conversion and Management 101 (2015) 336–342 337
treatment plants, the aeration is typically the most energy-intensive process stage [3], and the compressors can be responsiblefor almost 70% of the total electricity use at the facility [6].Typically, the aeration process is constantly alive, and as a resultthe annual downtime of the compressors is very low.Additionally, the required compressor pressure ratio is often con-stant. In the waste water aeration, the compressor discharge pres-sure is dictated mainly by the piping pressure losses and, moreimportantly, the water level in aeration tanks. These characteristicsclearly demonstrate, not only the significance of the justifieddimensioning of the system, but also the importance of the highcompressor efficiency at the actual, required operation range.
Concerning the energy efficiency of a centrifugal compressor,the performance of a centrifugal compressor impeller has reacheda very high level, and much of the potential for further improve-ments lie in the diffuser development as discussed by Kim et al.[28] and Issac et al. [24]. In general, there are three main typesof diffuser designs: vaneless diffuser (VNLD), low solidity vaneddiffuser (LSD) and vaned diffuser (VND), all of which have differentinfluences on the overall compressor performance and the operat-ing range. Correspondingly, all of these diffuser designs have vary-ing material requirements in manufacturing; a point which is oftennot thoroughly considered from the life cycle point of view.
In this paper, these three diffuser types are studied from energyconversion and life cycle point of view. The main aim of the studyis, not only to demonstrate the energy efficiency benefits of eachdiffuser type, but also to indicate the environmental impacts ofthese energy efficiency improvements in a compressor process.Therefore, the use of the different diffuser designs is studied inan example case consisting of a centrifugal compressor supportingthe aeration process in a waste water treatment plant. For theassessment of the environmental impacts of the different diffuserdesigns, an LCA (life cycle assessment) study is conducted. Theaim is to analyze (1) how much the improvement in energy effi-ciency of the compressor using different diffuser designs reducesthe greenhouse gas emissions and (2) does the additional materialneeded in diffuser manufacturing have an effect on the total green-house gas emissions? Hence, the second research question can alsobe formulated as: Is improving the energy efficiency of a compres-sor reasonable if it requires more material in the compressormanufacturing?
Although this paper concentrates on energy efficiency improve-ments in the component design, the energy conversion of the com-pressor is not the only relevant indicator when evaluating theenergy efficiency of the waste water treatment process or aerationstage. The overall energy efficiency is also affected for instance, bythe dimensioning of the compressor system, leakages in the airducts, distribution losses when delivering air into the tanks, andthe efficiency of the aeration itself. In addition, the same com-pressed air delivered by the compressor units is typically used inmany other process stages in the plant. As this study focuses onthe energy use and the LCA study on compressor diffuser designs,other aspects affecting the aeration efficiency are excluded.
The paper is organized as follows: first, the energy efficiencyimprovement scenarios related to different diffuser designs arebeing discussed. The next section introduces a compressor taskin a waste water treatment plant illustrating a typical end-use pro-cess for centrifugal compressors. The section also presents theresulting energy consumption and potential savings with each dif-fuser scenario. Based on these energy calculations, the life-cycleassessment study is conducted. Finally, conclusions of this studyare given in the last section.
2. Studied efficiency improvement scenarios for centrifugalcompressors
As mentioned, the centrifugal compressor performance can beaffected with three main diffuser types: vaneless diffuser, lowsolidity vaned diffuser, and vaned diffuser. Additionally, the vane-less diffuser can be modified by pinch to improve the performance,which means narrowing the height of the diffuser compared to theimpeller blade height. A schematic view of different diffuserdesigns is given in Fig. 2.
The presented diffuser designs can be studied in terms ofefficiency improvement and material resource requirements. Inthis study, the presumed material for each diffuser scenario is alu-minum (AlMg3). The diffuser scenarios are categorized intopinched diffuser (PND, Scenario 1), low solidity diffuser (Scenario2), and vaned diffuser (Scenario 3). These three diffuser scenariosare compared with the selected baseline of the vaneless design(VNLD) of Scenario 0.
Scenario 1 represents the use of moderate pinch in the diffuser,where the diffuser passage height is narrowed from the nominalheight. Pinched diffuser (PND) is known to improve the efficiencyof a centrifugal compressor and still maintain an almost similaroperating map width as a vaneless diffuser [25]. Scenario 2 consid-ers the low solidity diffuser (LSD), where no geometrical throat isformed between the two vanes due to low number of short vanes.The LSD represents also higher efficiencies than the vanelessdiffuser and it maintains the width of the operating map usuallyvery well [16]. Although the vaned diffuser (VND) in Scenario 3has usually the highest performance improvement of the differentdiffuser designs, the width of the operating map is clearly narrowerthan with the other designs. The narrower operating range ismainly due to two reasons: the diffuser vanes are sensitive to thechanging incidence, and they form an aerodynamic throat, whichlimits the maximum mass flow. The incidence influences also thevanes in the LSD; however they are considered to be mostlyguiding the flow instead of diffusing it and are therefore not thatsensitive. In addition, the vanes in the low solidity diffuser donot form an aerodynamic throat; hence, the maximum mass flowis dictated by the impeller as in the vaneless diffuser.
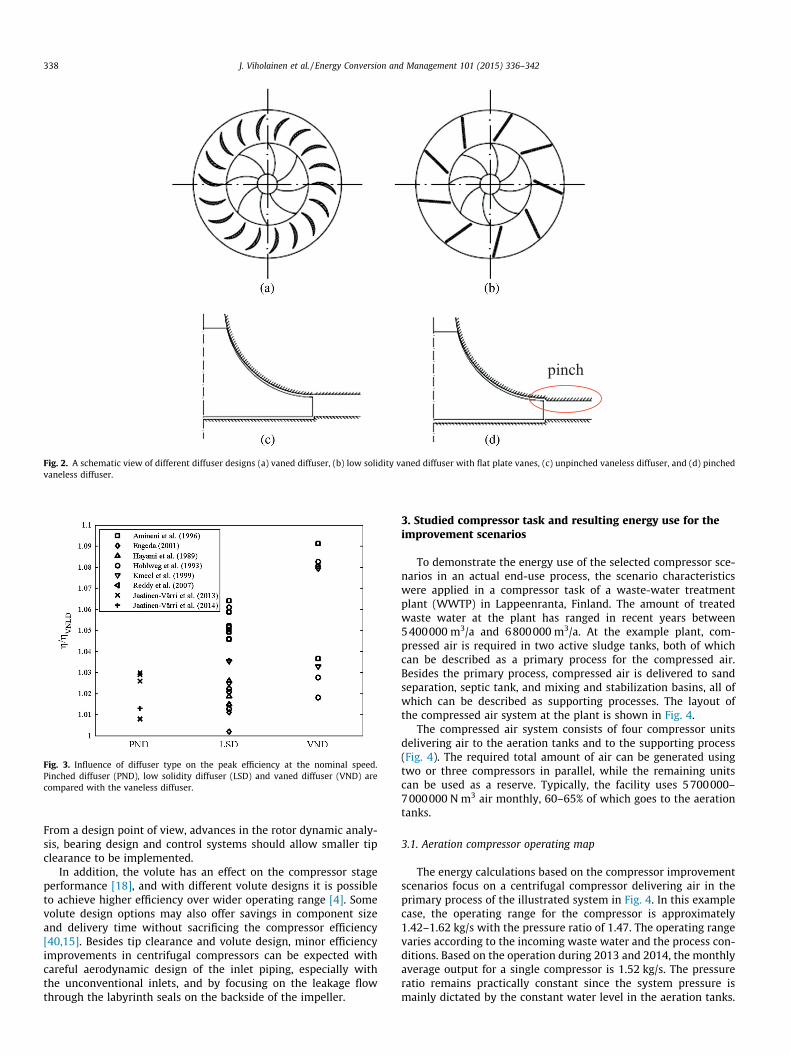
In comparison with the vaneless diffuser Fig. 3 illustrates theefficiency improvements for different diffuser designs at thecompressor nominal speed [19,21,2,29,9,34,27,26]. It can beinterpreted from the figure that the average estimation for the effi-ciency by using pinched diffuser is 1.03 times the vaneless diffuserefficiency. For the low solidity diffuser and vaned diffuser theimprovements are 1.04 and 1.05, respectively.
As mentioned, the main potential for efficiency improvementsin centrifugal compressors lie in the stationary parts, as the impel-ler has been the most studied component in the past. Although thefocus of this study is on the diffuser design, alternative improve-ment solutions can be found for example from the tip clearance.Increasing the tip clearance has a negative impact on the stageefficiency and the pressure ratio of the compressor [30,8,31].Still, the impact of the increasing tip clearance on compressor effi-ciency can vary according to the compressor characteristics [43].
pinch
Fig. 2. A schematic view of different diffuser designs (a) vaned diffuser, (b) low solidity vaned diffuser with flat plate vanes, (c) unpinched vaneless diffuser, and (d) pinchedvaneless diffuser.
Fig. 3. Influence of diffuser type on the peak efficiency at the nominal speed.Pinched diffuser (PND), low solidity diffuser (LSD) and vaned diffuser (VND) arecompared with the vaneless diffuser.
338 J. Viholainen et al. / Energy Conversion and Management 101 (2015) 336–342
From a design point of view, advances in the rotor dynamic analy-sis, bearing design and control systems should allow smaller tipclearance to be implemented.
In addition, the volute has an effect on the compressor stageperformance [18], and with different volute designs it is possibleto achieve higher efficiency over wider operating range [4]. Somevolute design options may also offer savings in component sizeand delivery time without sacrificing the compressor efficiency[40,15]. Besides tip clearance and volute design, minor efficiencyimprovements in centrifugal compressors can be expected withcareful aerodynamic design of the inlet piping, especially withthe unconventional inlets, and by focusing on the leakage flowthrough the labyrinth seals on the backside of the impeller.
3. Studied compressor task and resulting energy use for theimprovement scenarios
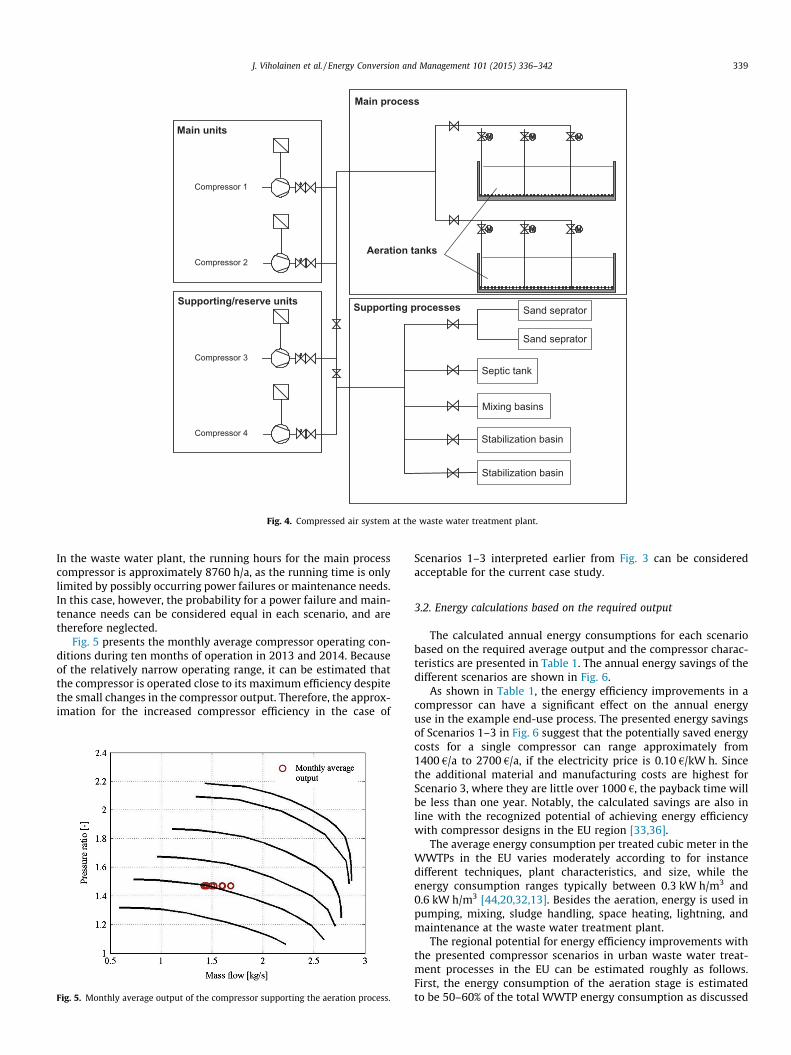
To demonstrate the energy use of the selected compressor sce-narios in an actual end-use process, the scenario characteristicswere applied in a compressor task of a waste-water treatmentplant (WWTP) in Lappeenranta, Finland. The amount of treatedwaste water at the plant has ranged in recent years between5400000 m3/a and 6800000 m3/a. At the example plant, com-pressed air is required in two active sludge tanks, both of whichcan be described as a primary process for the compressed air.Besides the primary process, compressed air is delivered to sandseparation, septic tank, and mixing and stabilization basins, all ofwhich can be described as supporting processes. The layout ofthe compressed air system at the plant is shown in Fig. 4.
The compressed air system consists of four compressor unitsdelivering air to the aeration tanks and to the supporting process(Fig. 4). The required total amount of air can be generated usingtwo or three compressors in parallel, while the remaining unitscan be used as a reserve. Typically, the facility uses 5700000–7000000 N m3 air monthly, 60–65% of which goes to the aerationtanks.
3.1. Aeration compressor operating map
The energy calculations based on the compressor improvementscenarios focus on a centrifugal compressor delivering air in theprimary process of the illustrated system in Fig. 4. In this examplecase, the operating range for the compressor is approximately1.42–1.62 kg/s with the pressure ratio of 1.47. The operating rangevaries according to the incoming waste water and the process con-ditions. Based on the operation during 2013 and 2014, the monthlyaverage output for a single compressor is 1.52 kg/s. The pressureratio remains practically constant since the system pressure ismainly dictated by the constant water level in the aeration tanks.
Compressor 1
Compressor 2
Compressor 3
Compressor 4
Sand seprator
Sand seprator
Septic tank
Mixing basins
Stabilization basin
Stabilization basin
Aeration tanks
Main units
Supporting/reserve units
Main process
Supporting processes
Fig. 4. Compressed air system at the waste water treatment plant.
J. Viholainen et al. / Energy Conversion and Management 101 (2015) 336–342 339
In the waste water plant, the running hours for the main processcompressor is approximately 8760 h/a, as the running time is onlylimited by possibly occurring power failures or maintenance needs.In this case, however, the probability for a power failure and main-tenance needs can be considered equal in each scenario, and aretherefore neglected.
Fig. 5 presents the monthly average compressor operating con-ditions during ten months of operation in 2013 and 2014. Becauseof the relatively narrow operating range, it can be estimated thatthe compressor is operated close to its maximum efficiency despitethe small changes in the compressor output. Therefore, the approx-imation for the increased compressor efficiency in the case of
Fig. 5. Monthly average output of the compressor supporting the aeration process.
Scenarios 1–3 interpreted earlier from Fig. 3 can be consideredacceptable for the current case study.
3.2. Energy calculations based on the required output
The calculated annual energy consumptions for each scenariobased on the required average output and the compressor charac-teristics are presented in Table 1. The annual energy savings of thedifferent scenarios are shown in Fig. 6.
As shown in Table 1, the energy efficiency improvements in acompressor can have a significant effect on the annual energyuse in the example end-use process. The presented energy savingsof Scenarios 1–3 in Fig. 6 suggest that the potentially saved energycosts for a single compressor can range approximately from1400 €/a to 2700 €/a, if the electricity price is 0.10 €/kW h. Sincethe additional material and manufacturing costs are highest forScenario 3, where they are little over 1000 €, the payback time willbe less than one year. Notably, the calculated savings are also inline with the recognized potential of achieving energy efficiencywith compressor designs in the EU region [33,36].
The average energy consumption per treated cubic meter in theWWTPs in the EU varies moderately according to for instancedifferent techniques, plant characteristics, and size, while theenergy consumption ranges typically between 0.3 kW h/m3 and0.6 kW h/m3 [44,20,32,13]. Besides the aeration, energy is used inpumping, mixing, sludge handling, space heating, lightning, andmaintenance at the waste water treatment plant.
The regional potential for energy efficiency improvements withthe presented compressor scenarios in urban waste water treat-ment processes in the EU can be estimated roughly as follows.First, the energy consumption of the aeration stage is estimatedto be 50–60% of the total WWTP energy consumption as discussed
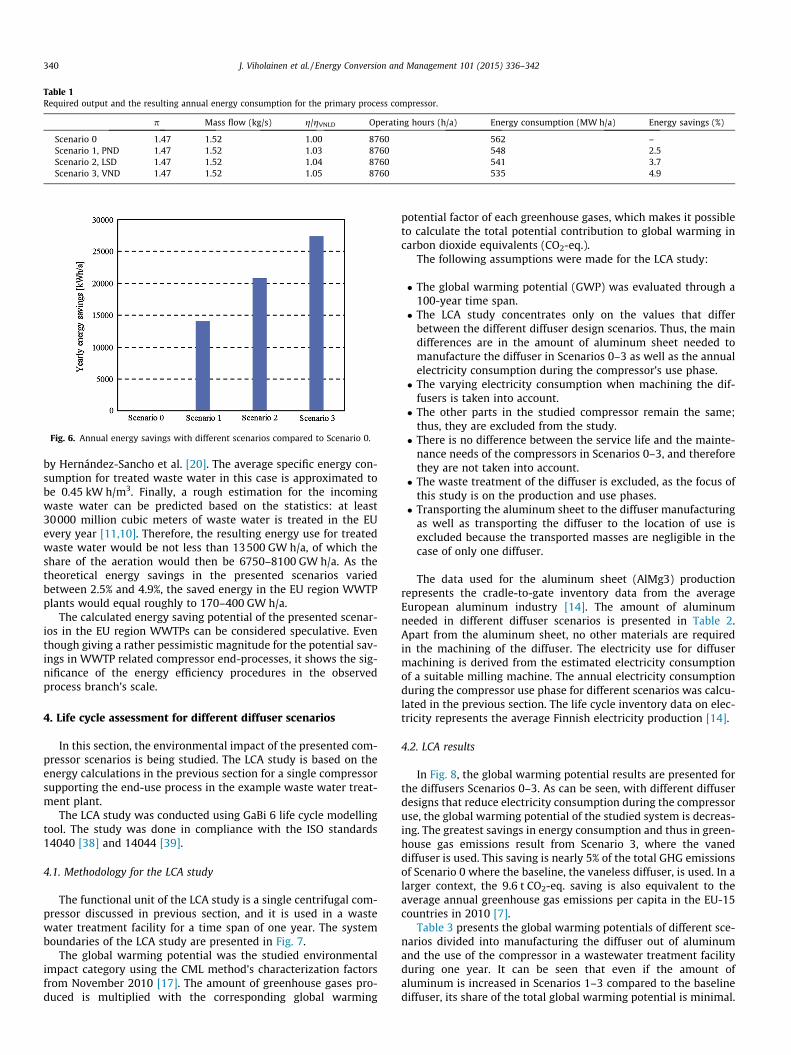
Table 1Required output and the resulting annual energy consumption for the primary process compressor.
p Mass flow (kg/s) g/gVNLD Operating hours (h/a) Energy consumption (MW h/a) Energy savings (%)
Scenario 0 1.47 1.52 1.00 8760 562 –Scenario 1, PND 1.47 1.52 1.03 8760 548 2.5Scenario 2, LSD 1.47 1.52 1.04 8760 541 3.7Scenario 3, VND 1.47 1.52 1.05 8760 535 4.9
Fig. 6. Annual energy savings with different scenarios compared to Scenario 0.
340 J. Viholainen et al. / Energy Conversion and Management 101 (2015) 336–342
by Hernández-Sancho et al. [20]. The average specific energy con-sumption for treated waste water in this case is approximated tobe 0.45 kW h/m3. Finally, a rough estimation for the incomingwaste water can be predicted based on the statistics: at least30000 million cubic meters of waste water is treated in the EUevery year [11,10]. Therefore, the resulting energy use for treatedwaste water would be not less than 13500 GW h/a, of which theshare of the aeration would then be 6750–8100 GW h/a. As thetheoretical energy savings in the presented scenarios variedbetween 2.5% and 4.9%, the saved energy in the EU region WWTPplants would equal roughly to 170–400 GW h/a.
The calculated energy saving potential of the presented scenar-ios in the EU region WWTPs can be considered speculative. Eventhough giving a rather pessimistic magnitude for the potential sav-ings in WWTP related compressor end-processes, it shows the sig-nificance of the energy efficiency procedures in the observedprocess branch’s scale.
4. Life cycle assessment for different diffuser scenarios
In this section, the environmental impact of the presented com-pressor scenarios is being studied. The LCA study is based on theenergy calculations in the previous section for a single compressorsupporting the end-use process in the example waste water treat-ment plant.
The LCA study was conducted using GaBi 6 life cycle modellingtool. The study was done in compliance with the ISO standards14040 [38] and 14044 [39].
4.1. Methodology for the LCA study
The functional unit of the LCA study is a single centrifugal com-pressor discussed in previous section, and it is used in a wastewater treatment facility for a time span of one year. The systemboundaries of the LCA study are presented in Fig. 7.
The global warming potential was the studied environmentalimpact category using the CML method’s characterization factorsfrom November 2010 [17]. The amount of greenhouse gases pro-duced is multiplied with the corresponding global warming
potential factor of each greenhouse gases, which makes it possibleto calculate the total potential contribution to global warming incarbon dioxide equivalents (CO2-eq.).
The following assumptions were made for the LCA study:
� The global warming potential (GWP) was evaluated through a100-year time span.� The LCA study concentrates only on the values that differ
between the different diffuser design scenarios. Thus, the maindifferences are in the amount of aluminum sheet needed tomanufacture the diffuser in Scenarios 0–3 as well as the annualelectricity consumption during the compressor’s use phase.� The varying electricity consumption when machining the dif-
fusers is taken into account.� The other parts in the studied compressor remain the same;
thus, they are excluded from the study.� There is no difference between the service life and the mainte-
nance needs of the compressors in Scenarios 0–3, and thereforethey are not taken into account.� The waste treatment of the diffuser is excluded, as the focus of
this study is on the production and use phases.� Transporting the aluminum sheet to the diffuser manufacturing
as well as transporting the diffuser to the location of use isexcluded because the transported masses are negligible in thecase of only one diffuser.
The data used for the aluminum sheet (AlMg3) productionrepresents the cradle-to-gate inventory data from the averageEuropean aluminum industry [14]. The amount of aluminumneeded in different diffuser scenarios is presented in Table 2.Apart from the aluminum sheet, no other materials are requiredin the machining of the diffuser. The electricity use for diffusermachining is derived from the estimated electricity consumptionof a suitable milling machine. The annual electricity consumptionduring the compressor use phase for different scenarios was calcu-lated in the previous section. The life cycle inventory data on elec-tricity represents the average Finnish electricity production [14].
4.2. LCA results
In Fig. 8, the global warming potential results are presented forthe diffusers Scenarios 0–3. As can be seen, with different diffuserdesigns that reduce electricity consumption during the compressoruse, the global warming potential of the studied system is decreas-ing. The greatest savings in energy consumption and thus in green-house gas emissions result from Scenario 3, where the vaneddiffuser is used. This saving is nearly 5% of the total GHG emissionsof Scenario 0 where the baseline, the vaneless diffuser, is used. In alarger context, the 9.6 t CO2-eq. saving is also equivalent to theaverage annual greenhouse gas emissions per capita in the EU-15countries in 2010 [7].
Table 3 presents the global warming potentials of different sce-narios divided into manufacturing the diffuser out of aluminumand the use of the compressor in a wastewater treatment facilityduring one year. It can be seen that even if the amount ofaluminum is increased in Scenarios 1–3 compared to the baselinediffuser, its share of the total global warming potential is minimal.
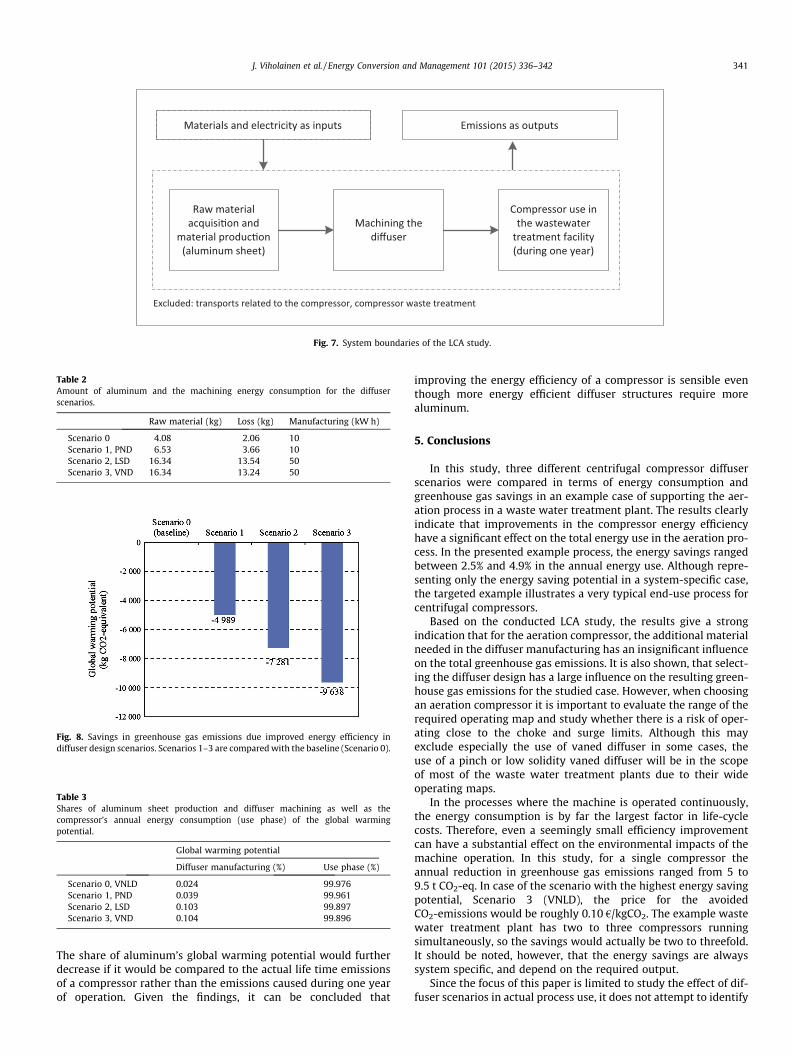
Raw material acquisi�on and
material produc�on (aluminum sheet)
Machining the diffuser
Compressor use in the wastewater
treatment facility (during one year)
Materials and electricity as inputs Emissions as outputs
Excluded: transports related to the compressor, compressor waste treatment
Fig. 7. System boundaries of the LCA study.
Table 2Amount of aluminum and the machining energy consumption for the diffuserscenarios.
Raw material (kg) Loss (kg) Manufacturing (kW h)
Scenario 0 4.08 2.06 10Scenario 1, PND 6.53 3.66 10Scenario 2, LSD 16.34 13.54 50Scenario 3, VND 16.34 13.24 50
Fig. 8. Savings in greenhouse gas emissions due improved energy efficiency indiffuser design scenarios. Scenarios 1–3 are compared with the baseline (Scenario 0).
Table 3Shares of aluminum sheet production and diffuser machining as well as thecompressor’s annual energy consumption (use phase) of the global warmingpotential.
Global warming potential
Diffuser manufacturing (%) Use phase (%)
Scenario 0, VNLD 0.024 99.976Scenario 1, PND 0.039 99.961Scenario 2, LSD 0.103 99.897Scenario 3, VND 0.104 99.896
J. Viholainen et al. / Energy Conversion and Management 101 (2015) 336–342 341
The share of aluminum’s global warming potential would furtherdecrease if it would be compared to the actual life time emissionsof a compressor rather than the emissions caused during one yearof operation. Given the findings, it can be concluded that
improving the energy efficiency of a compressor is sensible eventhough more energy efficient diffuser structures require morealuminum.
5. Conclusions
In this study, three different centrifugal compressor diffuserscenarios were compared in terms of energy consumption andgreenhouse gas savings in an example case of supporting the aer-ation process in a waste water treatment plant. The results clearlyindicate that improvements in the compressor energy efficiencyhave a significant effect on the total energy use in the aeration pro-cess. In the presented example process, the energy savings rangedbetween 2.5% and 4.9% in the annual energy use. Although repre-senting only the energy saving potential in a system-specific case,the targeted example illustrates a very typical end-use process forcentrifugal compressors.
Based on the conducted LCA study, the results give a strongindication that for the aeration compressor, the additional materialneeded in the diffuser manufacturing has an insignificant influenceon the total greenhouse gas emissions. It is also shown, that select-ing the diffuser design has a large influence on the resulting green-house gas emissions for the studied case. However, when choosingan aeration compressor it is important to evaluate the range of therequired operating map and study whether there is a risk of oper-ating close to the choke and surge limits. Although this mayexclude especially the use of vaned diffuser in some cases, theuse of a pinch or low solidity vaned diffuser will be in the scopeof most of the waste water treatment plants due to their wideoperating maps.
In the processes where the machine is operated continuously,the energy consumption is by far the largest factor in life-cyclecosts. Therefore, even a seemingly small efficiency improvementcan have a substantial effect on the environmental impacts of themachine operation. In this study, for a single compressor theannual reduction in greenhouse gas emissions ranged from 5 to9.5 t CO2-eq. In case of the scenario with the highest energy savingpotential, Scenario 3 (VNLD), the price for the avoidedCO2-emissions would be roughly 0.10 €/kgCO2. The example wastewater treatment plant has two to three compressors runningsimultaneously, so the savings would actually be two to threefold.It should be noted, however, that the energy savings are alwayssystem specific, and depend on the required output.
Since the focus of this paper is limited to study the effect of dif-fuser scenarios in actual process use, it does not attempt to identify
342 J. Viholainen et al. / Energy Conversion and Management 101 (2015) 336–342
solutions having the highest or most cost-effective potential forreducing energy consumption and greenhouse gas emissions inWWTPs. This would require a systematic approach on the technicalsolutions and energy use during each treatment phase includingprocess dimensioning and control options. In addition, the energyefficiency of the waste water treatment process should be evalu-ated considering the distribution of air and the aeration efficiencyin the aeration tanks taking into account whether the compressedair system is delivering air to other process stages.
With this study, the authors present a solid argument for theimportance of studying the operating costs of a compressor duringthe entire lifetime when selecting the operating components forthe aeration process. In other words, the presented example casedemonstrates that although the energy efficiency improvementmay bring extra costs to the investment due to additional materialuse, machinery, or other resources, it can be insignificant whencompared with the life time operating costs and environmentalimpact.
Acknowledgements
The authors gratefully acknowledge the financial contributionof the Academy of Finland and TEKES – Finnish Funding Agencyfor Innovation. The authors would also like to thankLappeenrannan Energia Oy for providing information for this work.
References
[1] Abdelaziz EA, Saidur R, Mekhilef S. A review on energy saving strategies inindustrial sector. Renew Sustain Energy Rev 2011;15:150–68.
[2] Amineni NK, Engeda A, Hohlweg WC, Direnzi GL. Performance of low solidityand conventional diffuser systems for centrifugal compressors. 96-GT-155. In:Proceedings of ASME international gas turbine and aeroengine congress andexhibition, June 10–13. UK: Birmingham; 1996.
[3] Chew K-J, Kang J. Estimating the energy independence of a municipalwastewater treatment plant incorporating green energy resources. EnergyConvers Manage 2013;75:664–72.
[4] Dai Y, Engeda A, Cave M, Di Liberti J-L. Numerical study and experimentalvalidation of the performance of two different volutes with the samecompressor impeller. Proc IMechE, Part A: J Power Energy 2009;223:157–66.
[5] de Almeida AT, Fonseca P, Falkner H, Bertoldi P. Market transformation ofenergy-efficient motor technologies in the EU. Energy Policy2003;31(6):563–75.
[6] Descoins N et al. Energy efficiency in waste water treatments plants:optimization of activated sludge process coupled with anaerobic digestion.Energy 2012;41:153–64.
[7] EAA. Greenhouse gas emission trends and projections in Europe 2012. Trackingprogress towards Kyoto and 2020 targets; 2012 [s.l.:s.n.].
[8] Eishenlohr G, Chadlek H. Thermal tip clearance control for centrifugalcompressor of an APU engine. J Turbomach 1994;116:629–34.
[9] Engeda A. The design and performance results of simple flat plate low solidityvaned diffusers. Proc IMechE, Part A: J Power Energy 2001;215:109–18.
[10] EUROSTAT. Environmental statistics and accounts in Europe. Luxembourg:Publications Office of the European Union; 2010.
[11] FAO. AQUASTAT database. Food and Agriculture Organization of the UnitedNations (FAO); 2014 [accessed 31.10.14].
[12] Ferreira FJTE, Fong C, de Almeida T. Eco-analysis of variable-speed drives forflow regulation in pumping systems. IEEE Trans Industr Electron 2011;58(6).
[13] Frijns J, Hofman J, Nederlof M. The potential of (waste)water as energy carrier.Energy Convers Manage 2013;65:357–63.
[14] GaBi. PE international: GaBi 6 software-system and databases. In: s.l.:s.n.;2012.
[15] Giachi M, Ramalingam V, Belardini E, De Bellis F, Reddy F. Parametricperformance of a class of standard discharge scrolls for industrial centrifugalcompressors. GT2014-26831. In: Proceedings of ASME Turbo, June 16–20.Germany: Düsseldorf; 2014.
[16] Grönman A, Dietmann F, Casey M, Backman J. Review and collection ofpreliminary design rules for low solidity diffusers. In: Proceedings of 10theuropean conference on turbomachinery, April 15–19. Finland: LappeenrantaUniversity of Technology; 2013.
[17] Guinée JB et al. Handbook on life cycle assessment. Operational guide to theISO standards. I:LCA in perspective. IIa: Guide. IIb: Operational annex. III:Scientific background. Dordrecht: Kluwer Academic Publishers; 2002.
[18] Hagelstein D, Hillewaert K, Van den Braembussche R, Engeda A, Keiper R,Rautenberg M. Experimental and numerical investigation of the flow in acentrifugal compressor volute. J Turbomach 2000;122:22–31.
[19] Hayami H, Senoo Y, Utsunomiya K. Application of low-solidity cascade diffuserto transonic centrifugal compressor. J Turbomach 1990;112:25–9.
[20] Hernández-Sancho F, Molinos-Senante M, Sala-Garrido R. Energy efficiency inSpanish wastewater treatment plants: a non-radial DEA approach. Sci TotalEnviron 2011;409:2693–9.
[21] Hohlweg C, Direnzi GL, Aungier RH. Comparison of conventional and lowsolidity vaned diffusers. 93-GT-098. In: Proceedings of ASME international gasturbine and aeroengine congress and exhibition, May 24–27. USA: Cincinnati;1993.
[22] IEA. World energy outlook 2012. Paris (France): IEA Publications; 2012.[23] IPCC. Climate change 2007: synthesis report. Geneva (Switzerland):
Intergovernmental Panel of Climatic Change; 2007.[24] Issac JM, Sitaram N, Govardhan M. Performance and wall static pressure
measurements on centrifugal compressor diffusers. Proc IMechE, Part A: JPower Energy 2003;217:547–58.
[25] Jaatinen A, Grönman A, Röyttä P, Turunen-Saaresti T. Effect of vaneless diffuserwidth on the overall performance of a centrifugal compressor. Proc IMechE,Part A: J Power Energy 2011;225:665–76.
[26] Jaatinen-Värri A, Grönman A, Turunen-Saaresti T, Backman J. Investigation ofthe stage performance and flow fields in a centrifugal compressor with avaneless diffuser. Int J Rotating Mach 2014;2014.
[27] Jaatinen-Värri A, Röyttä P, Turunen-Saaresti T, Grönman A. Experimental studyof centrifugal compressor vaneless diffuser width. J Mech Sci Technol2013;27:1011–20.
[28] Kim Y, Engeda A, Aungier R, Amineni NA. Centrifugal compressor stage withwide flow range vaned diffusers and different inlet configurations. ProcIMechE, Part A: J Power Energy 2002;216:307–20.
[29] Kmecl T, Ter Harkel R, Dalbert P. Optimization of a vaned diffuser geometry forradial compressors, part II: optimization of a diffuser vane profile in lowsolidity diffusers. 99-GT-434. In: Proceedings of ASME international gasturbine and aeroengine congress and exhibition, June 7–10. USA: Indianapolis;1999.
[30] Pampreen R. Small turbomachinery compressor and fan aerodynamics. J EngPower 1973;95:251–6.
[31] Palmer D, Waterman W. Design and development of an advanced two-stagecentrifugal compressor. J Turbomach 1995;117:205–12.
[32] Plappally AK, Lienhard VJH. Energy requirements for water production,treatment, end use, reclamation, and disposal. Renew Sustain Energy Rev2012;16:4818–48.
[33] Raudgen P, Blaustein E. Compressed air systems in the European Union.Energy, emissions, savings potential and policy actions. Stuttgart (Germany):LOG_X Verlag GmbH; 2001.
[34] Reddy STC, Ramana Murty GV, Prasad MVSSSM, Reddy DN. Experimentalstudies on the effect of impeller width on centrifugal compressor stageperformance with low solidity vaned diffusers. Proc IMechE, Part A: J PowerEnergy 2007;221(4):519–533.
[35] Saidur R. Review on electric motors energy use and energy savings. RenewSustain Energy Rev 2010;14:877–98.
[36] Saidur R, Rahim NA, Hasanuzzaman M. A review on compressed-air energy useand energy savings. Renew Sustain Energy Rev 2010;14:1135–53.
[37] Schiffmann J, Favrat D. Design, experimental investigation and multi-objectiveoptimization of a small-scale radial compressor for heat pump applications.Energy 2010;35:436–50.
[38] SFS-EN ISO 14040. Environmental management. Life cycle assessment.Principles and framework. In: Helsinki: Finnish Standards Association; 2006.
[39] SFS-EN ISO 14044. Environmental management. Life cycle assessment.Requirements and guidelines. In: Helsinki: Finnish Standards Association;2006.
[40] Steglich T, Kitzinger J, Seume J, Van den Braembussche R, Prinsier J. Improveddiffuser/volute combinations for centrifugal compressors. J Turbomach2008;130:011014.
[41] Subramanyam V, Parashivan D, Kumar A, Mondal MAH. Using Sankeydiagrams to map energy flow from primary fuel to end use. Energy ConversManage 2015;91:342–52.
[42] Tolvanen J, Ahonen T, Kervinen H. System optimization through co-operation. Helsinki (Finland): ABB OY; 2013.
[43] Turunen-Saaresti T, Jaatinen-Värri A. Influence of the different designparameters to the centrifugal compressor tip clearance loss. J Turbomach2013;135:011017.
[44] Venkatesh G, Brattebø H. Energy consumption, costs and environmentalimpacts for urban water cycle services: case study of Oslo (Norway). Energy2010;36:792–800.

![Energy Conversion and Managementkchbi.chtf.stuba.sk/upload_new/file/Miro/Proc... · tillation research is also extended to absorption heat transformer (AHT) [9,10], the reverse operation](https://img.pdfslide.us/doc/110x75/5f05f72a7e708231d4159d5f/energy-conversion-and-tillation-research-is-also-extended-to-absorption-heat-transformer.jpg)


![Applied Thermal Engineeringkchbi.chtf.stuba.sk/upload_new/file/Miro/Proc problemy... · 2017. 3. 12. · RH relative humidity ratio [%] S cross sectional area [m2] T temperature [](https://img.pdfslide.us/doc/110x75/6124f23ea9425612ca0176ff/applied-thermal-problemy-2017-3-12-rh-relative-humidity-ratio-s-cross.jpg)