Embed Size (px)
Citation preview

P
BMa
b
a
ARRAA
KFPMEL
1
efislpcttstasoole
mc
h0
Chemical Engineering and Processing 84 (2014) 98–108
Contents lists available at ScienceDirect
Chemical Engineering and Processing:Process Intensification
j ourna l ho me page: www.elsev ier .com/ locate /cep
rocess modelling and technology evaluation in brewing
ettina Muster-Slawitscha,∗, Matthäus Hubmanna,ichael Murkovicb, Christoph Brunnera
AEE-Institute of Sustainable Technologies, Feldgasse 19, A-8200 Gleisdorf, AustriaGraz University of Technology, Institute of Biochemistry, Petersgasse 12/II, A-8010 Graz, Austria
r t i c l e i n f o
rticle history:eceived 4 December 2013eceived in revised form 15 March 2014ccepted 18 March 2014vailable online 26 March 2014
a b s t r a c t
To reach an integrated sustainable production site, it is important to analyse effects of technology changes.A “brewery model” has been developed which allows process modelling of a brewing facility. Besides thecomparison of specific demand figures, it allows a holistic view of the production site and most impor-tantly the modelling of energy demand profiles. Energy demand profiles in brewing vary significantlybased on the chosen technology set. Furthermore they are notably influenced by production planning,
eywords:ood industryrocess modellingashing process
nergy efficiencyow temperature heat supply
heat exchanger surfaces and heat supply management. A reduction in energy intensity in the brewhouseprocesses will lead to the possibility to design heat supply equipment at lower capacity. The mashingprocess is an important candidate in considerations for heat recovery and low temperature heat supply.New temperature profiles in mashing can improve processing time, quality of the produced wort as wellas enable the integration of low temperature heat in a better way.
© 2014 Elsevier B.V. All rights reserved.
. Introduction
The European food industry is an important sector–15% of allmployees working in producing companies are employed in theood industry (Food and Drink Europe, [34]). With increasing leg-slative pressure and consumer awareness the food industry iseeking solutions for a more sustainable production. Due to itsong history, the food treatment and processing are very traditionalrocesses. In many cases the technologies applied have not beenhanged over decades. As many of these technologies stem from aime prior to energy efficiency or renewable energy considerations,hey often pose limitations when it comes to changing the energyupply. Traditionally most of the processes are steam driven andhere is a number of challenges to overcome when low temper-ture energy (such as waste heat or renewable energy in form ofolar heat) could be integrated. The widely applied stirred tank isne technology example that poses limitations to the integrationf low temperature heat due to its low heat transfer coefficient and
imited heat transfer area. Traditionally large temperature gradi-nts are applied to overcome the limitations in heat transfer. To∗ Corresponding author. Tel.: +43 3112 5886 71; fax: +43 3112 5886 18.E-mail addresses: [email protected] (B. Muster-Slawitsch),
[email protected] (M. Hubmann), [email protected] (M. Murkovic),[email protected] (C. Brunner).
ttp://dx.doi.org/10.1016/j.cep.2014.03.010255-2701/© 2014 Elsevier B.V. All rights reserved.
realise low temperature heat supply, however, retrofit changes arenecessary to enable the required heat transfer rates.
There are many recommendations and manuals on how toimprove energy efficiency in brewing, such as [1–3] or [4] andseveral case studies have been published recently, such as [5–10].Energy consumption analysis based on production data acqui-sition systems and benchmarking have become state of the artin the brewing industry and dedicated tools are available [11].The available material and the increasing environmental aware-ness in the sector have led to tremendous savings within the lastdecades [12,13]. However, as consumption figures vary widely(national data ranging between 70.6 and 243.1 MJ/hl [13]) thereis still the continuing need for improvement, and often especiallythe last steps to reach a completely carbon-free production siteare requiring detailed analysis. Recently approaches for monitor-ing and forecasting of energy consumption in brewing have beendeveloped [14,15].
To reach an integrated sustainable production site, it is impor-tant to analyse effects of technology changes by considering thewhole energy system of the production site. Process modelling is adecisive step in this evaluation: it allows a concise analysis of thestatus quo and enables parametric studies to reach an optimisedtechnology set. Process modelling for energy efficiency optimisa-
tion can be done via EINSTEIN, a general thermal energy auditingtool for industry, which allows technology comparison to someextent [16,17]. Software tools, such as BATCHES, have also beenapplied for modelling and optimisation of brewhouses [18].
B. Muster-Slawitsch et al. / Chemical Enginee
Nomenclature
MJ/hl thermal energy intensity (GJ/m3)MEDTtech minimal thermal energy demand per technologyEmainmash[j] energy demand in mash step jVmashing,mainmash[j] volume of mash in mash step jrohmashing density of mashcpmashing specific heat capacity of mashTmashstep[j] final temperature in mash step jTmashstep afterBMMix[j] temperature in mash step j (after a boil-
mash has been possibly added to the mash)j. . .n indices for each mash stepmmalt mass of maltmextract,ww mass of extract in weak wortmweakwort,rec,mash mass of weak wort which is recovered to
the mashmspgrain mass of spent grainpwater spgrain water content of spent grainTinitial initial temperatureQprocess thermal power required for process heatingmprocess mass of process mediumcpprocess specific heat capacity of process mediumtstart start timetend end timedTmin minimal temperature difference required in heat
exchangeHR heat recovery
adotiaditobtc
2
EicesbtpEotptpea
the production of CO2 and relates it to sugar consumption, reduc-
So far, there are no tools available dedicated for brewing whichllow the analysis of energy efficiency opportunities based onetailed and holistic process modelling and parametric studies ofperating conditions. The Green Brewery tool [17] was a start ofhis work with an Excel based tool for energy balancing of brew-ng sites. In this publication a “Brewery Model” is presented whichllows analysing effects of different technologies on thermal energyemand in the brewing industry. For the mashing process an exist-
ng kinetic model has been applied to analyse the effects of newemperature profiles. These optimised temperature profiles willpen the possibility to integrate low temperature energy. They haveeen validated at lab scale to show the potential of low tempera-ure energy supply which is suggested for a process and technologyhange for the mashing process.
. Methodology
A “Brewery Model” has been developed on EES (Engineeringquation Solver) to generate a holistic energy balance of a brew-ng facility. The calculation tool performs thermal energy demandalculations based on user-provided data. Further, time-variablenergy demand per process as a basis for subsequent pinch analy-is can be calculated. Visio flowsheets are used for visualisation ofasic brewing flowsheets in EES where data can be entered. Variousechnologies can be chosen for mashing, boiling, wort cooling andackaging including different heat integration options (Table 1).nergy and mass balances are performed to calculate energy flowsf each product stream. Results are presented in energy per hec-olitre of brewed beer (for brewhouse and fermentation cellar) orackaged beer (for the packaging area). Parametric studies allowhe comparison of different technology sets and/or production
arameters. The model has been set up based on the experience ofnergy auditing in various international brewing sites and is thuspplicable to various breweries with different site specifications.ring and Processing 84 (2014) 98–108 99
2.1. Thermal energy demand modelling
The following equations show a calculation example of themashing process. The energy demand is calculated per mash stepin the time-temperature profile of the mashing process. One mashstep is defined by two temperatures and the time required for therespective heating or holding.
Emainmash[j] = Vmashing,mainmash[j] ∗ rohmashing ∗ cpmashing
∗ (Tmashsteps[j] − Tmashsteps afterBMMix[j − 1]) (1)
with Tmashsteps defining the temperature which is reached at theend of the current mashing step and Tmashsteps afterBMMix taking intoaccount whether a boil mash has been mixed to the main mashprior to this mash step. Vmashing,mainmash gives the current mashingvolume, again accounting for the possibility that a certain amountof mash is currently treated in a separate decoction mash.
Next to energy balances for single processes, overall mass andcomponent balances are integrated to take into account the inter-dependences within the brewing process. An example is givenbelow for the component balance of malt husks and extract:
mmalt + mextract,ww
mweakwort∗ mweakwort,rec,mash = mextract + mextract,ww
+ mspgrain ∗ (1 − pwater spgrain) (2)
As brewing is a batch process, thermal energy demand variessignificantly over time. Therefore equations for calculating time-dependent energy demand were integrated for batch processeswhich are thermally relevant such as mashing, wort preheating,wort boiling, wort cooling and fermentation. Based on the existing(user-defined) energy supply and the given heat transfer area, theenergy demand profile over time is calculated.
T = Tinitial +∫ (
Qprocess
mprocess ∗ cpprocess; t; tstart; tend
)(3)
The following flowsheet shows the overall calculation procedurefor mashing; similar procedures have been developed for the otherthermally relevant processes (Fig. 1).
2.2. Cooling demand modelling
For modelling the cooling demand the following processes aretaken into account: brew water cooling, fermentation tanks, beercooler, yeast tanks and maturation tanks (Fig. 2). The fermentationtanks are the largest consumers of cooling energy. Cooling demandof these tanks is therefore modelled over the biochemical equationof beer fermentation which can be stated in the following simplifiedway [19].
maltose(100 g) + aminoacids(0.5 g) → yeast(5 g)
+ ethanol(48.8 g) + CO2(46.8 g) + energy(50 kcal) (4)
Of course a variety of other products, especially important for thebeer flavour, are as well generated during fermentation, howeverthey are less decisive when it comes to model the cooling require-ment during fermentation. For modelling the cooling demand itis necessary to take into account the varying cooling rate whichgoes along with the fermentation rate of the beer. Therefore mod-els from literature were evaluated to show the uptake of sugars andconversion to alcohol over time. The biochemical model proposedby Trelea et al. [33] can be used for the assessment of sugar con-sumption during the course of fermentation. It actually describes
tion of wort density and ethanol production. It also takes intoaccount some effects of operating conditions, such as tempera-ture and pressure. The model was built upon data taken from pilot

100 B. Muster-Slawitsch et al. / Chemical Engineering and Processing 84 (2014) 98–108
Table 1Technology, heat supply and heat recovery options in the brewery model for thermal brewhouse operations.
Process Technology options Heat supply options Heat recovery options
Mashing Infusion mashingDecoction mashing
Jacket heating (outside)Heating plates (inside)Steam injection(heating medium specified bytemperature and pressure)
Heat recovery from hot wort over energystorage
Boiling Specification via definition of time,temperature and pressure over the boilingduration enables modelling of most boilingtechniques, such as:Conventional boiling with natural or forcedflowDynamic low pressure boilingRectificationHigh temperature boilingSchonkochverfahren “Schoko”Varioboil
Internal boilerExternal boilerSteam injection(heating medium specified bytemperature and pressure)
Energy storage for wort preheatingEnergy storage for hot water productionEnergy storage for general energy supply toother processesMechanical vapour compressionThermal vapour compression
Wort cooling 1-stage wort cooler2-stage wort cooler
(cooling medtemperature
stbpa
Switfta
2.5.2 and MEBAK II 2.8.4.1 respectively. Sugar analysis for malt-
Fig. 1. Calculation procedure for energy variability in mashing.
cale experiments at a constant fermentation temperature. Thus,he comparison with literature data cannot be done on an exactasis, since not only operating conditions such as temperature andressure influence the results, but as well the wort compositionnd the specific yeast strain used [20].
The model was simulated with EES (Engineering Equationolver) and the outcome compared with the sugar consumption orort density reduction rates stated in other literature [21–23]. The
nitial concentration of fermentable sugars in the wort modelled in
he brewhouse section of the brewery model is the starting pointor the fermentation model. For beer fermentation it is importanto know the initial concentration of fermentable sugars in the wort,s these are converted by the yeast to alcohol and carbon dioxideia specified by)
Brew water preparationHeat recovery for process heating and brewwater preparation
as main products. Wort gravity is traditionally measured in ◦Plato.1 ◦Plato is equivalent to 1 g sucrose/100 g water. Therefore a lagerwort with a specific gravity of 12 ◦Plato (equivalent to a gravityof 1046 kg/m3) contains approximately 12.6 g extract/100 ml wort.Approximately 75 of these sugars will be fermentable and are actu-ally converted to ethanol [21]. During fermentation, cooling needsto be applied to make up for the heat generated in the exother-mic processes. The heat released can be assessed as differenceof internal energy of glucose (2880 kJ/mole glucose) and alcohol(2620 kJ/mole glucose). A certain amount of the energy difference isstored by the yeast as 2 ATPs (61 kJ/mole) [21]. The heat of reactionis therefore roughly 100 kJ/mole glucose (556 kJ/kg extract).
2.3. Kinetic model for the mashing process
To analyse the effects of temperature gradients and temperatureprofiles in the mashing process a kinetic model for the mash-ing process was integrated into the brewery model. The mashingmodels of Marc and Engasser [24] and Koljonen et al. [25] havebeen taken as basis and a model has been developed in EES. Themodel assumes instantaneous dissolution of carbohydrates alreadypresent in the malt and gradual gelatinisation according to the find-ings of Koljonen et al. Model parameters have been taken from Marcand Engasser. The model allows the prediction of the amount andcomposition of fermentable sugars based on the amylase activityin the malt and the applied temperature profile. New tempera-ture profiles were tested with the model and the results have beenverified in laboratory experiments.
2.4. Materials and methods
Energy demand measurements in industry were performedwith ultrasonic flow metres from FLEXIM and PT100 temperaturemeasurement equipment.
To prove the potential of new mashing profiles lab tests wereperformed at the University Weihenstephan in Germany. Batchtests were performed with 1500 g malt and 6 l water in an elec-trically heated stirred tank. Several samples were taken duringthe tests. Analyses of total extract, FAN (free amino nitrogen)and �-glucan were done according to MEBAK II 2.10, MEBAK II
ose, sucrose and glucose were carried out enzymatically using atestkit from Megazyme (K-MASUG) and oligomeric carbohydratesby HPLC analysis (Carboydrate analyzer, Dionex PA200).

B. Muster-Slawitsch et al. / Chemical Engineering and Processing 84 (2014) 98–108 101
ling p
3
3
sremem
Fig. 2. Flowsheet of coo
. Results and discussion
.1. Thermal energy demand modelling
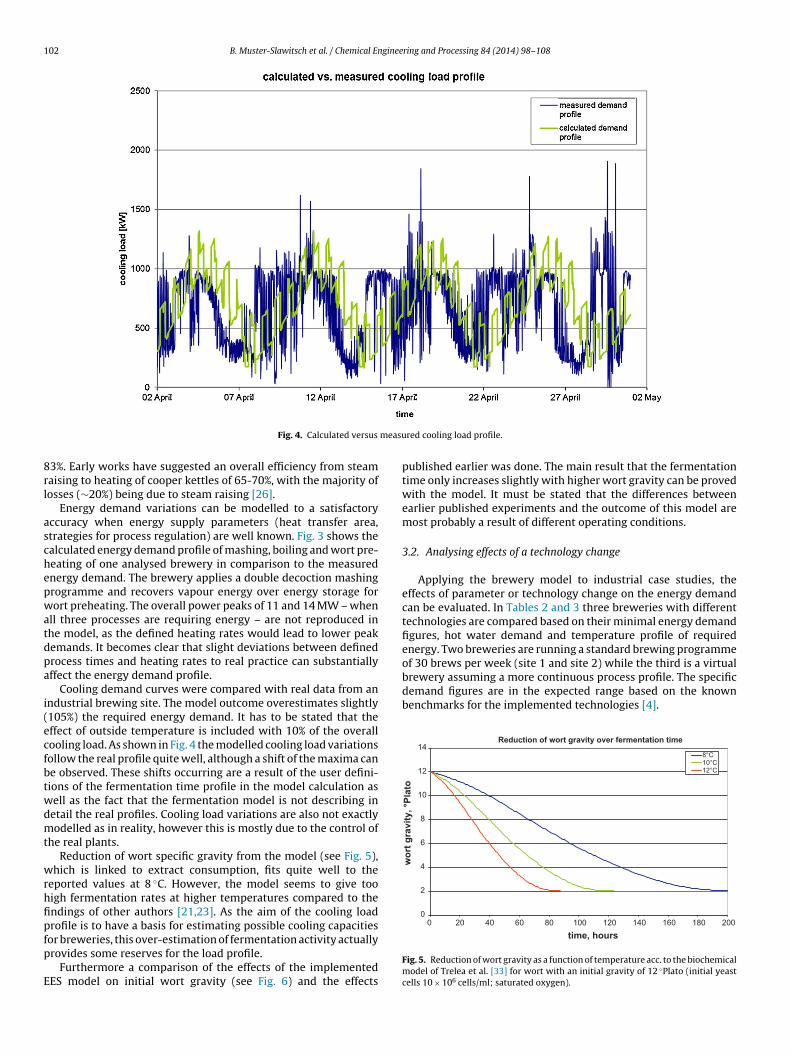
Energy demand analysis with the brewery model proved toimulate the real energy demand profiles with acceptable accu-acy. The comparison of the modelled energy demand with the realnergy demand profile of industrial brewhouses shows that the
odel accounts for 80–90% of the real energy demand. This differ-nce is mainly due to energy losses occurring on real sites as theodel performs a calculation of minimal energy demand figures
Fig. 3. Calculated versus measur
rocesses in breweries.
only considering defined (known) process inefficiencies. It couldbe shown that the model reaches real energy demand figures moreclosely for a brewery operating on hot water boilers in compari-son with breweries that use steam boilers as energy supply. Thecalculated in comparison to the measured energy demand of thebrewhouse accounts for 90% of the used thermal energy. Largerenergy losses are expected in breweries operating with steamboilers and open condensate systems. In one analysed brewery
the deviation between calculated energy demand, again includingknown process efficiencies which have been identified by measure-ments and detailed analysis, and real energy demand accounts toed energy demand profile.
102 B. Muster-Slawitsch et al. / Chemical Engineering and Processing 84 (2014) 98–108
measu
8rl
aschepwatdpa
i(ecfbtwdmt
wrhfipfp
E
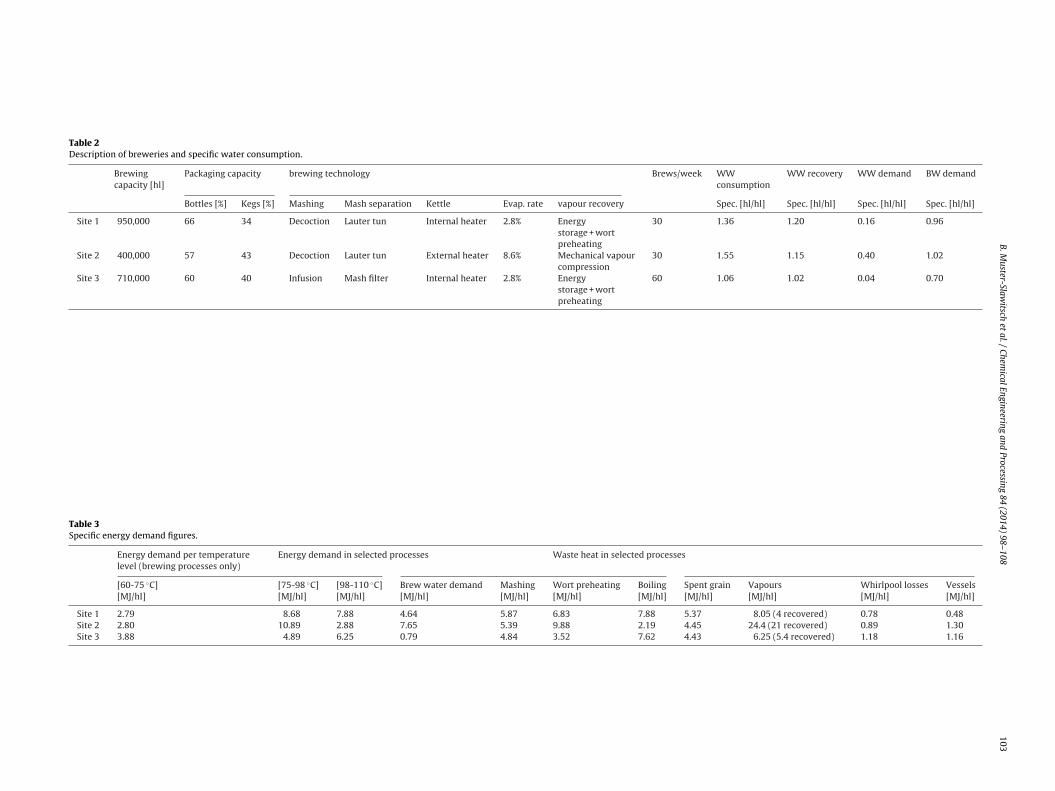
of 30 brews per week (site 1 and site 2) while the third is a virtualbrewery assuming a more continuous process profile. The specificdemand figures are in the expected range based on the knownbenchmarks for the implemented technologies [4].
Reduction of wort gravity over fermentation time
0
2
4
6
8
10
12
14
200180160140120100806040200
wor
t gra
vity
, °Pl
ato
8°C10°C12°C
Fig. 4. Calculated versus
3%. Early works have suggested an overall efficiency from steamaising to heating of cooper kettles of 65-70%, with the majority ofosses (∼20%) being due to steam raising [26].
Energy demand variations can be modelled to a satisfactoryccuracy when energy supply parameters (heat transfer area,trategies for process regulation) are well known. Fig. 3 shows thealculated energy demand profile of mashing, boiling and wort pre-eating of one analysed brewery in comparison to the measurednergy demand. The brewery applies a double decoction mashingrogramme and recovers vapour energy over energy storage forort preheating. The overall power peaks of 11 and 14 MW – when
ll three processes are requiring energy – are not reproduced inhe model, as the defined heating rates would lead to lower peakemands. It becomes clear that slight deviations between definedrocess times and heating rates to real practice can substantiallyffect the energy demand profile.
Cooling demand curves were compared with real data from anndustrial brewing site. The model outcome overestimates slightly105%) the required energy demand. It has to be stated that theffect of outside temperature is included with 10% of the overallooling load. As shown in Fig. 4 the modelled cooling load variationsollow the real profile quite well, although a shift of the maxima cane observed. These shifts occurring are a result of the user defini-ions of the fermentation time profile in the model calculation asell as the fact that the fermentation model is not describing inetail the real profiles. Cooling load variations are also not exactlyodelled as in reality, however this is mostly due to the control of
he real plants.Reduction of wort specific gravity from the model (see Fig. 5),
hich is linked to extract consumption, fits quite well to theeported values at 8 ◦C. However, the model seems to give tooigh fermentation rates at higher temperatures compared to thendings of other authors [21,23]. As the aim of the cooling loadrofile is to have a basis for estimating possible cooling capacities
or breweries, this over-estimation of fermentation activity actuallyrovides some reserves for the load profile.Furthermore a comparison of the effects of the implementedES model on initial wort gravity (see Fig. 6) and the effects
red cooling load profile.
published earlier was done. The main result that the fermentationtime only increases slightly with higher wort gravity can be provedwith the model. It must be stated that the differences betweenearlier published experiments and the outcome of this model aremost probably a result of different operating conditions.
3.2. Analysing effects of a technology change
Applying the brewery model to industrial case studies, theeffects of parameter or technology change on the energy demandcan be evaluated. In Tables 2 and 3 three breweries with differenttechnologies are compared based on their minimal energy demandfigures, hot water demand and temperature profile of requiredenergy. Two breweries are running a standard brewing programme
time, hours
Fig. 5. Reduction of wort gravity as a function of temperature acc. to the biochemicalmodel of Trelea et al. [33] for wort with an initial gravity of 12 ◦Plato (initial yeastcells 10 × 106 cells/ml; saturated oxygen).
B. M
uster-Slawitsch
et al.
/ Chem
ical Engineering
and Processing
84 (2014)
98–108
103
Table 2Description of breweries and specific water consumption.
Brewingcapacity [hl]
Packaging capacity brewing technology Brews/week WWconsumption
WW recovery WW demand BW demand
Bottles [%] Kegs [%] Mashing Mash separation Kettle Evap. rate vapour recovery Spec. [hl/hl] Spec. [hl/hl] Spec. [hl/hl] Spec. [hl/hl]
Site 1 950,000 66 34 Decoction Lauter tun Internal heater 2.8% Energystorage + wortpreheating
30 1.36 1.20 0.16 0.96
Site 2 400,000 57 43 Decoction Lauter tun External heater 8.6% Mechanical vapourcompression
30 1.55 1.15 0.40 1.02
Site 3 710,000 60 40 Infusion Mash filter Internal heater 2.8% Energystorage + wortpreheating
60 1.06 1.02 0.04 0.70
Table 3Specific energy demand figures.
Energy demand per temperaturelevel (brewing processes only)
Energy demand in selected processes Waste heat in selected processes
[60-75 ◦C] [75-98 ◦C] [98-110 ◦C] Brew water demand Mashing Wort preheating Boiling Spent grain Vapours Whirlpool losses Vessels[MJ/hl] [MJ/hl] [MJ/hl] [MJ/hl] [MJ/hl] [MJ/hl] [MJ/hl] [MJ/hl] [MJ/hl] [MJ/hl] [MJ/hl]
Site 1 2.79 8.68 7.88 4.64 5.87 6.83 7.88 5.37 8.05 (4 recovered) 0.78 0.48Site 2 2.80 10.89 2.88 7.65 5.39 9.88 2.19 4.45 24.4 (21 recovered) 0.89 1.30Site 3 3.88 4.89 6.25 0.79 4.84 3.52 7.62 4.43 6.25 (5.4 recovered) 1.18 1.16

104 B. Muster-Slawitsch et al. / Chemical Enginee
Reduction of wort gravity over fermentation time
0
2
4
6
8
10
12
14
200180160140120100806040200time, hours
wor
t gra
vity
, °Pl
ato
8°Plato10°Plato12°Plato
Fb8
fvarthroaMecffpb
gv
Ff
ig. 6. Reduction of wort gravity as a function of initial wort gravity acc. to theiochemical model of Trelea et al. [33] for wort at a fermentation temperature of◦C (initial yeast cells 10 × 106 cells/ml; saturated oxygen).
Fig. 7 shows an evaluation of specific energy demand figuresor wort preheating and boiling for two vapour recovery options:apour compression versus vapour condensation and energy stor-ge for wort preheating for a brewery at different evaporationates. Depending on the efficiency of the vapour condensation sys-em, vapour compression may be a sensible choice especially atigher evaporation rates when operated without additional steamequirement during vapour compression, which can be found inlder plants. The efficiency of vapour condensation, energy stor-ge and transfer to hot wort is also decisive in this comparison.easurements have been conducted in one brewery, showing an
fficiency of 84% in a modern brewhouse. In this graphic, vapourondensation is only considered for wort preheating leading to theact that at higher evaporation rates, vapours cannot be used fullyor recovery. In such situations additional recovery for hot waterroduction or heat integration for other process heating is a sensi-
le option.Besides this rather well known technology comparison of sin-le processes, it is decisive to evaluate technologies with a holisticiew on the overall production site. Each technology influences
ig. 7. Comparison of specific energy demand of wort preheating and boiling for two vapor wort preheating.
ring and Processing 84 (2014) 98–108
energy demand profiles and/or the water management of the brew-ery which is also influenced by brewing capacity and packagingtypes. The EES model allows a quick comparison of specific energyand water demand figures taking into account all processes on site.While site 3 has the lowest brew water demand due to the beergravity during brewing, specific warm water recovery figures arealso low. Based on its efficient warm water consumption in thepackaging area however, warm water demand and recovery arealmost balanced, leading to minimal energy demand for overallwarm water production and consequently brew water production.
Besides the evaluation of overall energy demand figures, thebrewery model allows the calculation of energy demand profiles. InFig. 8 the energy demand profiles are compared between the threebrewhouse technology sets. Results are shown as specific energydemand in kW/hl over time. Most importantly, energy demandprofiles vary significantly between the brewhouses. This provesthe importance of evaluating energy demand profiles over time forheat integration considerations and/or design of new energy supplytechnologies. Such energy demand profiles are not only influencedby basic technology choices, but as well by existing heat trans-fer area and heat supply management. In most breweries a largepeak in energy demand occurs when boiling and mashing the sub-sequent brew are performed at the same time. As energy supplyequipment is designed to cover this peak demand, the boiler is oftenoperating at part load. A reduction in energy intensity in these pro-cesses will therefore lead to the possibility to design heat supplyequipment at lower capacity avoiding losses in part load operation.
3.3. Analysing heat recovery potential based on chosentechnologies
The results of different brewing technologies on heat recoveryincluding thermal storages have been evaluated in our developedsoftware tool SOCO. These results have been recently published[27]. Besides showing the importance of re-using the hot wort forwort preheating, also the mashing process is integrated in opti-
our recovery options: mechanical vapour compression versus vapour condensation
mised heat recovery schemes for breweries. The integration ofmashing into the heat recovery has been indicated already in earlierworks [28] and is recently offered by plant engineering companies[29]. In some breweries the mashing process has proved to be a

B. Muster-Slawitsch et al. / Chemical Engineering and Processing 84 (2014) 98–108 105
e brew
gsmhio
3
rtdemc
•
•
lower enabling a more economic retrofit of mash tuns. Table 4gives the applied heating rates and mashing times for the differ-ent profiles, and Table 5 shows the modelled result of extract andsugar composition. Based on the modelling results the hypothesis
Table 4Heating rates, mashing times and final mashing temperatures for mashing pro-grammes with low heating rates.
Heating rates Mashing time Final Temperature[K/min] min–max [min] [min]
Basic conditions V1 0.29–0.71 94 75V2 0.29–0.32 94 75V3 0.29–0.43 84 75
Fig. 8. Energy demand profiles of thre
ood candidate for integrating solar process heat [30]. These factshow that low temperature heat supply (waste heat or solar ther-al) for mashing is an important topic and design requirements of
eat exchangers due to the existing temperature profiles (requir-ng large heat exchange surfaces) applied in mashing need to bevercome.
.4. Analysing the effects of new temperature profiles in mashing
In brewing many parameters are important to guarantee theequired product quality. For mashing the most important parame-ers can be classified into amylolytic parameters (evaluating starchegradation by amylase) and proteolytic parameters (evaluatingffects on filtration ability, foam stability and yeast nutrition in fer-entation). FAN, �-glucan and sugar composition were therefore
hosen as indicative parameters to evaluate new mashing profiles.
FAN (Free Amino Nitrogen): FAN levels (indicator for amino acidsnecessary for yeast metabolism) are important to enable goodyeast growth resulting in rapid fermentation. The total nitrogencontent is also important for the foam characteristics in beer [21].The FAN levels are related to the proteolytic activity in the mash.Desired values are in the range of 300-350 mg/l [31], with lowestacceptable values of 100-140 mg/l [21]. FAN levels are influencedby malt modification, finest of grist and mashing temperature(maximum proteolytic activity at around 50 ◦C). Generally, lowtemperature rests increase FAN levels, as well as finer grist whichalso results in more efficient proteolysis [31]. However, earlierstudies have shown that overall mashing parameters (tempera-ture, grist fineness) influence FAN levels only to a minor extentcompared to malt modification [31,32].�-glucan: Low �-glucan levels are desired, as �-glucan is associ-ated with a high wort viscosity resulting in a slow wort separationand slow filtration. �-Glucan is released from malt and needs to
be degraded by the action of �-glucanase which is a very heatsensitive enzyme being active at low temperatures (<50 ◦C). How-ever, malt modification reduces the amount of �-glucan releaseto such an extent, that the duration of low temperature masheries with different technology sets.
stands does not influence the �-glucan levels anymore and thesestands are no longer necessary. Well modified malt gives low �-glucan levels which are independent of the temperature profileapplied [31].
• Fermentable extract: Extract gained from starch hydrolysis inmashing is not completely fermentable. Fermentable carbohy-drates formed in mashing are glucose, maltose, maltotriose,fructose and sucrose. Higher dextrins are the major group ofunfermentable carbohydrates [21]. The extract is mainly pro-duced by the activity of amylases. To obtain a high fermentabilitythe activity of �-amylase is important. In fact, this is a major con-tributor to the degradation of dextrins to fermentable sugars [21].64-77% of extract are commonly fermentable [21].
Calculations with the implemented kinetic model have showna high potential for new temperature profiles in infusion mash-ing. The main difference of these new profiles in comparison totraditional mashing profiles is the low heating rate and shortermashing times. Such low heating rates would enable a much betterintegration of low temperature heat supply, especially for retrofit.The required power is up to 50% lower than in standard infusionmashing and additional required heat transfer areas are therefore
V4 0.26–0.29 89 75V9 0.2–0.29 89 72V6 0.1–0.36 93 75V8 0.12–0.42 78 75

106 B. Muster-Slawitsch et al. / Chemical Engineering and Processing 84 (2014) 98–108
Fig. 9. FAN and �-glucan analysis for 3 selected test runs.
Fig. 10. Total extract and sugar analysis for 3 selected test runs.
Table 5Model results for mashing programmes with low temperature heating gradients.
Final concentrations Glucose Maltose Maltotriose Dextrin Limitdextrin
Basic conditions V1 [g/l] 10.19 99.73 25.6 76.14 9.303
Deviation of test results based on basic conditions (V1)V2 [%] 3.50 2.80 0.81 −5.69 8.25V3 [%] 0.59 −3.49 0.16 3.69 1.57V4 [%] 3.87 −1.98 0.93 0.39 9.06V9 [%] 5.82 −0.19 1.39 −2.89 13.14V6 [%] 4.32 3.27 1.01 −6.82 9.94V8 [%] 1.55 −4.09 0.39 3.91 3.79
B. Muster-Slawitsch et al. / Chemical Enginee
wbhs
pdtrympFcfiFphgfitf
spmmyp
4
ttvesi
[
[
[
[
[
[
[
[
[
Fig. 11. Sugar analysis of maltotriose and higher oligomers.
as developed that such mashing profiles, that would allow foretter integration of low temperature heat supply, such as solareat and waste heat, would not influence the sugar compositionignificantly.
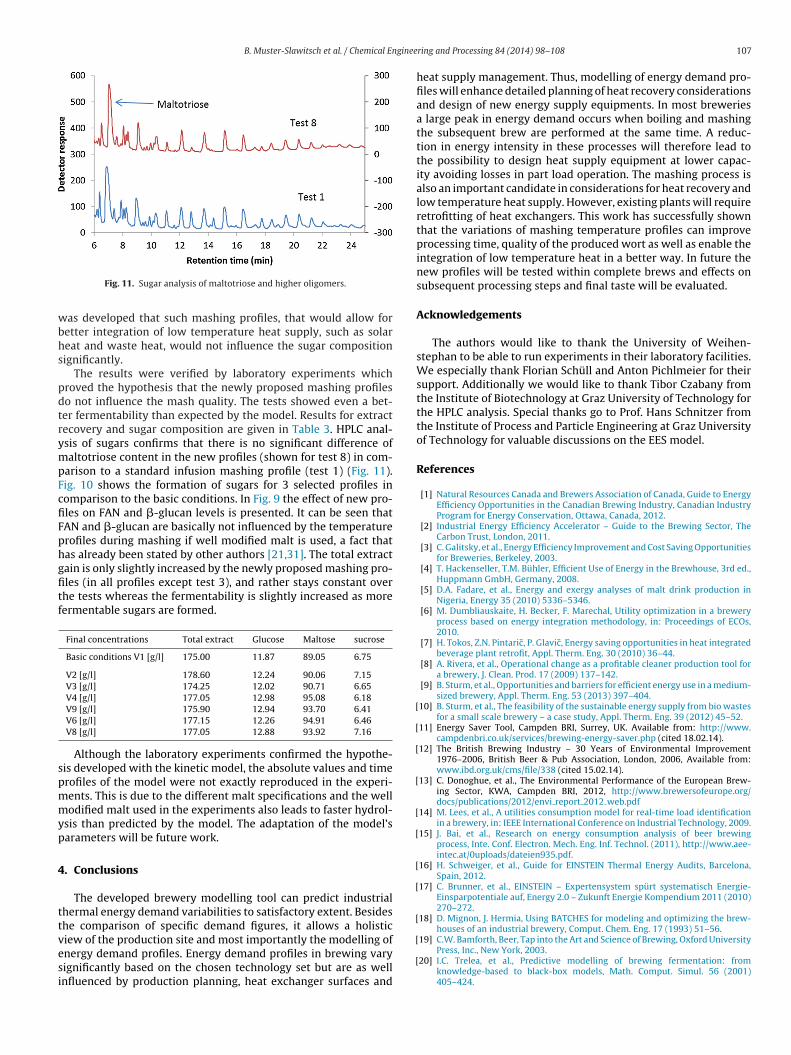
The results were verified by laboratory experiments whichroved the hypothesis that the newly proposed mashing profileso not influence the mash quality. The tests showed even a bet-er fermentability than expected by the model. Results for extractecovery and sugar composition are given in Table 3. HPLC anal-sis of sugars confirms that there is no significant difference ofaltotriose content in the new profiles (shown for test 8) in com-
arison to a standard infusion mashing profile (test 1) (Fig. 11).ig. 10 shows the formation of sugars for 3 selected profiles inomparison to the basic conditions. In Fig. 9 the effect of new pro-les on FAN and �-glucan levels is presented. It can be seen thatAN and �-glucan are basically not influenced by the temperaturerofiles during mashing if well modified malt is used, a fact thatas already been stated by other authors [21,31]. The total extractain is only slightly increased by the newly proposed mashing pro-les (in all profiles except test 3), and rather stays constant overhe tests whereas the fermentability is slightly increased as moreermentable sugars are formed.
Final concentrations Total extract Glucose Maltose sucrose
Basic conditions V1 [g/l] 175.00 11.87 89.05 6.75
V2 [g/l] 178.60 12.24 90.06 7.15V3 [g/l] 174.25 12.02 90.71 6.65V4 [g/l] 177.05 12.98 95.08 6.18V9 [g/l] 175.90 12.94 93.70 6.41V6 [g/l] 177.15 12.26 94.91 6.46V8 [g/l] 177.05 12.88 93.92 7.16
Although the laboratory experiments confirmed the hypothe-is developed with the kinetic model, the absolute values and timerofiles of the model were not exactly reproduced in the experi-ents. This is due to the different malt specifications and the wellodified malt used in the experiments also leads to faster hydrol-
sis than predicted by the model. The adaptation of the model’sarameters will be future work.
. Conclusions
The developed brewery modelling tool can predict industrialhermal energy demand variabilities to satisfactory extent. Besideshe comparison of specific demand figures, it allows a holistic
iew of the production site and most importantly the modelling ofnergy demand profiles. Energy demand profiles in brewing varyignificantly based on the chosen technology set but are as wellnfluenced by production planning, heat exchanger surfaces and[
[
ring and Processing 84 (2014) 98–108 107
heat supply management. Thus, modelling of energy demand pro-files will enhance detailed planning of heat recovery considerationsand design of new energy supply equipments. In most breweriesa large peak in energy demand occurs when boiling and mashingthe subsequent brew are performed at the same time. A reduc-tion in energy intensity in these processes will therefore lead tothe possibility to design heat supply equipment at lower capac-ity avoiding losses in part load operation. The mashing process isalso an important candidate in considerations for heat recovery andlow temperature heat supply. However, existing plants will requireretrofitting of heat exchangers. This work has successfully shownthat the variations of mashing temperature profiles can improveprocessing time, quality of the produced wort as well as enable theintegration of low temperature heat in a better way. In future thenew profiles will be tested within complete brews and effects onsubsequent processing steps and final taste will be evaluated.
Acknowledgements
The authors would like to thank the University of Weihen-stephan to be able to run experiments in their laboratory facilities.We especially thank Florian Schüll and Anton Pichlmeier for theirsupport. Additionally we would like to thank Tibor Czabany fromthe Institute of Biotechnology at Graz University of Technology forthe HPLC analysis. Special thanks go to Prof. Hans Schnitzer fromthe Institute of Process and Particle Engineering at Graz Universityof Technology for valuable discussions on the EES model.
References
[1] Natural Resources Canada and Brewers Association of Canada, Guide to EnergyEfficiency Opportunities in the Canadian Brewing Industry, Canadian IndustryProgram for Energy Conservation, Ottawa, Canada, 2012.
[2] Industrial Energy Efficiency Accelerator – Guide to the Brewing Sector, TheCarbon Trust, London, 2011.
[3] C. Galitsky, et al., Energy Efficiency Improvement and Cost Saving Opportunitiesfor Breweries, Berkeley, 2003.
[4] T. Hackenseller, T.M. Bühler, Efficient Use of Energy in the Brewhouse, 3rd ed.,Huppmann GmbH, Germany, 2008.
[5] D.A. Fadare, et al., Energy and exergy analyses of malt drink production inNigeria, Energy 35 (2010) 5336–5346.
[6] M. Dumbliauskaite, H. Becker, F. Marechal, Utility optimization in a breweryprocess based on energy integration methodology, in: Proceedings of ECOs,2010.
[7] H. Tokos, Z.N. Pintaric, P. Glavic, Energy saving opportunities in heat integratedbeverage plant retrofit, Appl. Therm. Eng. 30 (2010) 36–44.
[8] A. Rivera, et al., Operational change as a profitable cleaner production tool fora brewery, J. Clean. Prod. 17 (2009) 137–142.
[9] B. Sturm, et al., Opportunities and barriers for efficient energy use in a medium-sized brewery, Appl. Therm. Eng. 53 (2013) 397–404.
10] B. Sturm, et al., The feasibility of the sustainable energy supply from bio wastesfor a small scale brewery – a case study, Appl. Therm. Eng. 39 (2012) 45–52.
11] Energy Saver Tool, Campden BRI, Surrey, UK. Available from: http://www.campdenbri.co.uk/services/brewing-energy-saver.php (cited 18.02.14).
12] The British Brewing Industry – 30 Years of Environmental Improvement1976–2006, British Beer & Pub Association, London, 2006, Available from:www.ibd.org.uk/cms/file/338 (cited 15.02.14).
13] C. Donoghue, et al., The Environmental Performance of the European Brew-ing Sector, KWA, Campden BRI, 2012, http://www.brewersofeurope.org/docs/publications/2012/envi report 2012 web.pdf
14] M. Lees, et al., A utilities consumption model for real-time load identificationin a brewery, in: IEEE International Conference on Industrial Technology, 2009.
15] J. Bai, et al., Research on energy consumption analysis of beer brewingprocess, Inte. Conf. Electron. Mech. Eng. Inf. Technol. (2011), http://www.aee-intec.at/0uploads/dateien935.pdf.
16] H. Schweiger, et al., Guide for EINSTEIN Thermal Energy Audits, Barcelona,Spain, 2012.
17] C. Brunner, et al., EINSTEIN – Expertensystem spürt systematisch Energie-Einsparpotentiale auf, Energy 2.0 – Zukunft Energie Kompendium 2011 (2010)270–272.
18] D. Mignon, J. Hermia, Using BATCHES for modeling and optimizing the brew-houses of an industrial brewery, Comput. Chem. Eng. 17 (1993) 51–56.
19] C.W. Bamforth, Beer, Tap into the Art and Science of Brewing, Oxford UniversityPress, Inc., New York, 2003.
20] I.C. Trelea, et al., Predictive modelling of brewing fermentation: fromknowledge-based to black-box models, Math. Comput. Simul. 56 (2001)405–424.

1 ginee
[
[
[
[
[
[
[
[
[
[[
[
[
08 B. Muster-Slawitsch et al. / Chemical En
21] E. Dennis, C.A.B. Briggs, A. Peter, Brookes and Roger Stevens, Brewing – Scienceand Practice, Woodhead Publishing Limited, Cambridge, 2004.
22] B.J.M.G.-S. de Andrés-Toro, J.A. Lopez-Orozco, C. Fernandez-Conde, J.M.Peinado, F. Garcia-Ochoa, A kinetic model for beer production under industrialoperational conditions, Math. Comput. Simul. 48 (1998) 105–424.
23] R. Oonsivilai, A. Oonsivilai, Temperature profile in fermenting process usingdifferential evolution, Recent Adv. Energy Environ. (2011) 315–319, ISBN:978-960-474-159-5. Proceedings of the 5th IASME / WSEAS International Con-ference on Energy and Environment.
24] A. Marc, J.M. Engasser, A kinetic model of starch hydrolysis by alpha and betaamylase during mashing, Biotechnol. Bioeng. 25 (1983) 481–496.
25] T. Koljonen, et al., A model for predictions of fermentable sugar concentrationsduring mashing, J. Food Eng. 26 (1995) 329–350.
26] J.S. Hough, et al., Malting and Brewing Science II. Hopped Wort and Beer,Chapman and Hall, London, 1982.
27] B. Muster-Slawitsch, C. Brunner, J. Fluch, Application of an advanced PinchMethodology for the food and drink production, WIREs Energy Environ. 3(2014), http://dx.doi.org/10.1002/wene.117.
[
ring and Processing 84 (2014) 98–108
28] B. Muster-Slawitsch, et al., The green brewery concept – energy efficiency andthe use of renewable energy sources in breweries, Appl. Therm. Eng. 31 (2011)2123–2134.
29] Equitherm, Krones AG. Available from: http://www.krones.com/en/products/magazine-eqitherm.php (cited 30.11.13).
30] C. Brunner, SolarBrew 1st periodic report, FP7 Project 295660, 2013.31] F. Kühbeck, et al., Effects of mashing parameters on mash �-glucan, FAN and
soluble extract levels, J. Inst. Brew. 111 (2005) 316–327.32] F. Einsiedler, A. Schwill-Miedaner, K. Sommer, Experimentelle Untersuchungen
und Modellierung komplexer biochemischer und technologischer Prozesse amBeispiel des Maischens. Teil 1: Proteolyse, Mschr. Brauwiss. 50 (1997) 164–171.
33] I.C. Trelea, et al., Predictive modelling of brewing fermentation: fromknowledge-based to black-box models, Math. Comput. Simul. 56 (2001)
405–424.34] Food Drink Europe, Data & Trends of the European Food and DrinkIndustry 2012, Brussles, Belgium, 2013, http://www.fooddrinkeurope.eu/uploads/publications documents/Data Trends %28interactive%29.pdf [cited2013 15.11.].


![A kinetic model of starch hydrolysis by [alpha]- and …kchbi.chtf.stuba.sk/upload_new/file/Miro/Proc problemy...Kinetics of malt starch hydrolysis by endogeneous a- and &amylases](https://img.pdfslide.us/doc/110x75/5e4bb072f0085830d17bafc7/a-kinetic-model-of-starch-hydrolysis-by-alpha-and-kchbichtfstubaskuploadnewfilemiroproc.jpg)