Embed Size (px)
Citation preview
Energy consumption and savings potential of CLIC
Philippe Lebrun
CERN, Geneva, Switzerland
55th ICFA Advanced Beam Dynamics Workshop on High Luminosity Circular e+e- Colliders – Higgs Factory
Beijing, 9-12 October 2014
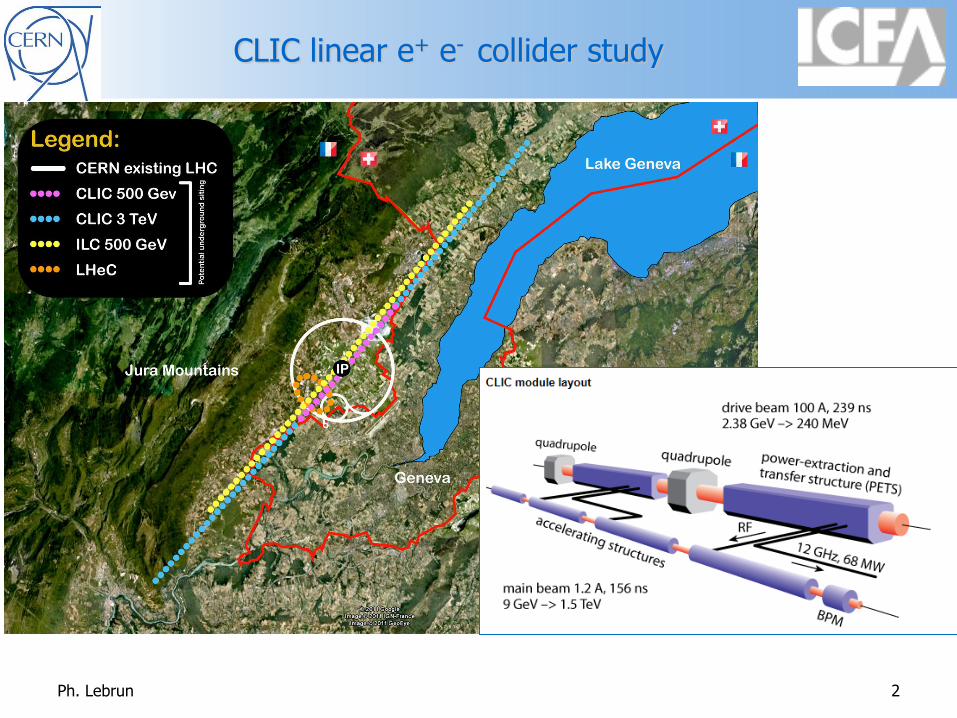
CLIC linear e+ e- collider study
Ph. Lebrun 2
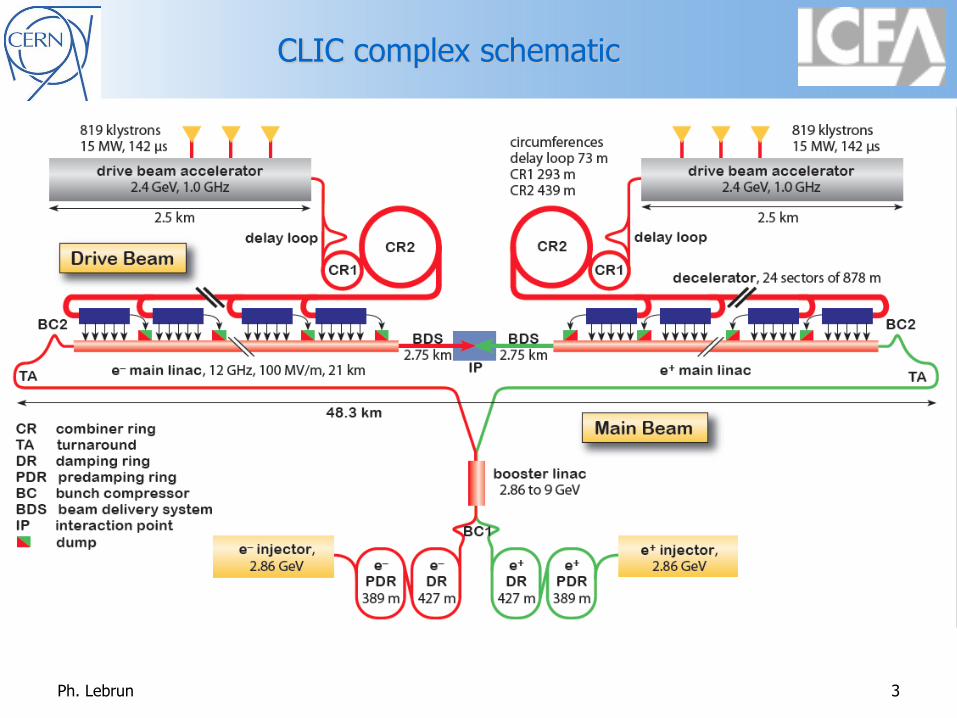
CLIC complex schematic
Ph. Lebrun 3
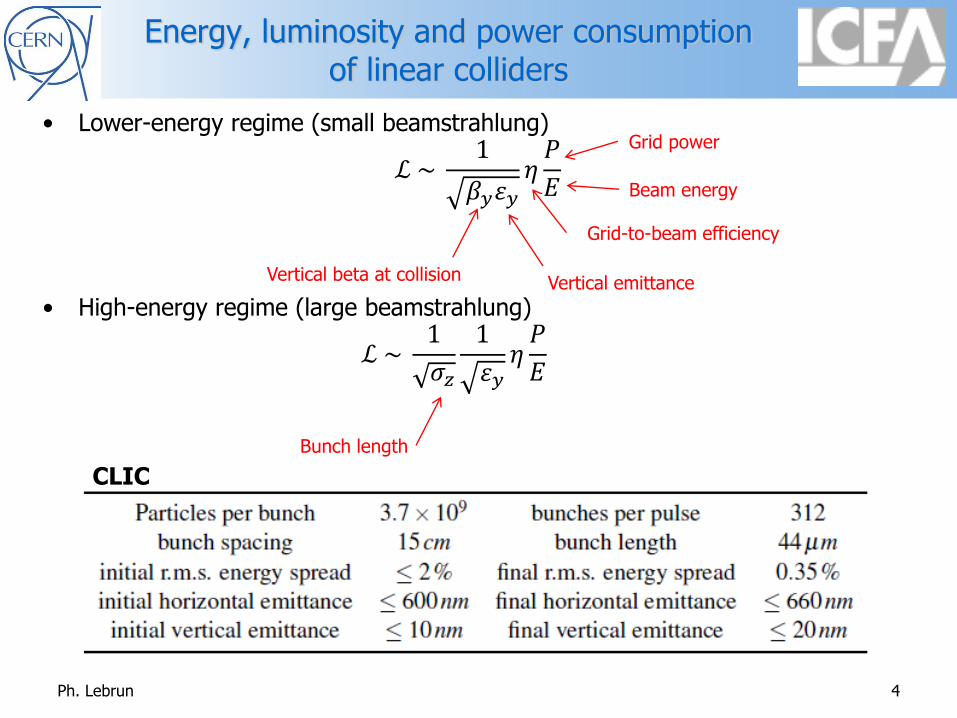
Energy, luminosity and power consumption of linear colliders
• Lower-energy regime (small beamstrahlung)
ℒ ~ 1
𝛽𝑦𝜀𝑦
𝜂𝑃
𝐸
• High-energy regime (large beamstrahlung)
ℒ ~ 1
𝜎𝑧
1
𝜀𝑦𝜂
𝑃
𝐸
Grid power
Beam energy
Grid-to-beam efficiency
Vertical beta at collision Vertical emittance
Bunch length
Ph. Lebrun 4
CLIC
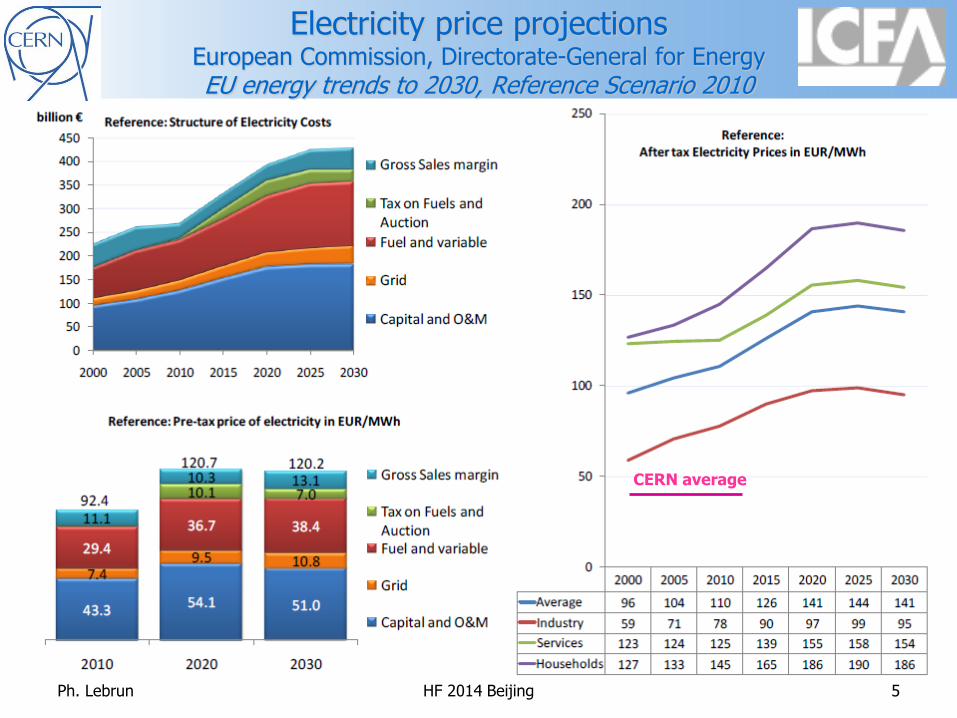
Electricity price projections European Commission, Directorate-General for Energy EU energy trends to 2030, Reference Scenario 2010
CERN average
Ph. Lebrun HF 2014 Beijing 5
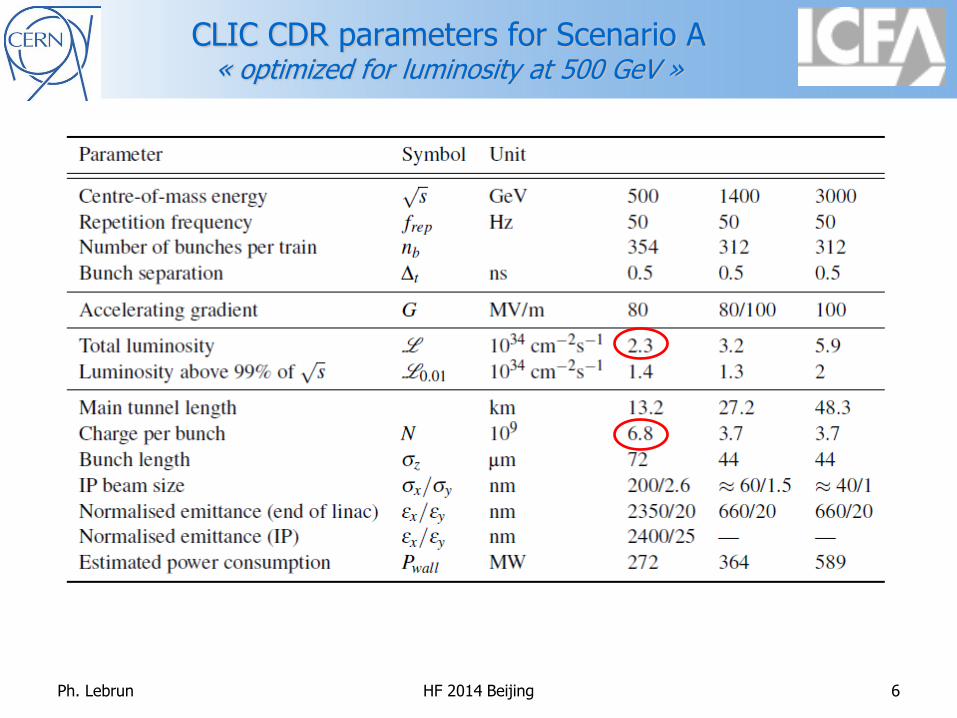
CLIC CDR parameters for Scenario A « optimized for luminosity at 500 GeV »
Ph. Lebrun HF 2014 Beijing 6
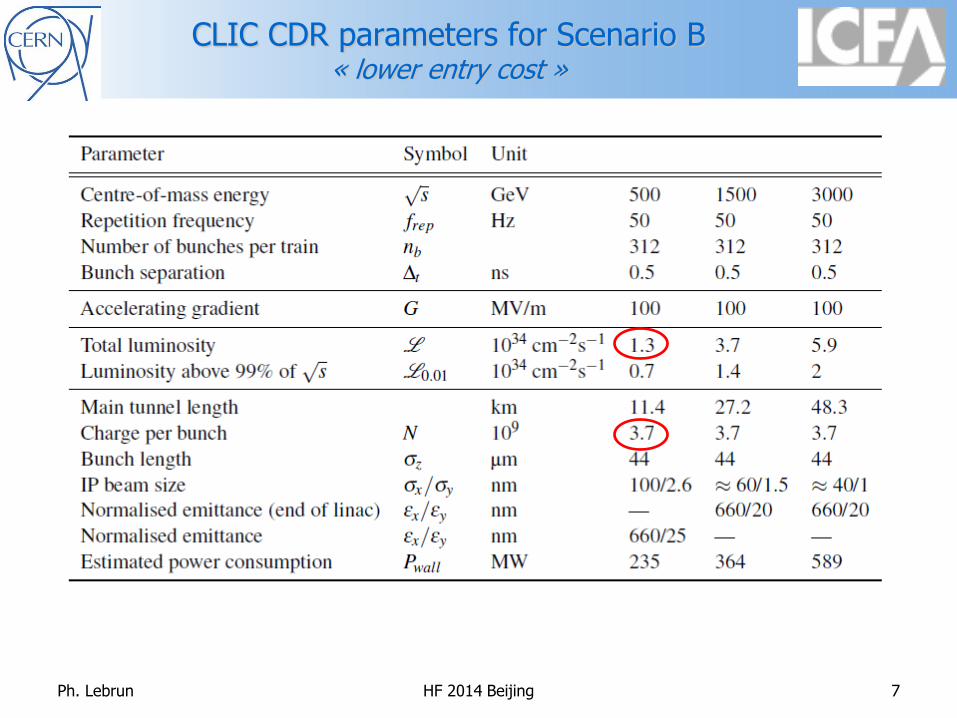
CLIC CDR parameters for Scenario B « lower entry cost »
Ph. Lebrun HF 2014 Beijing 7
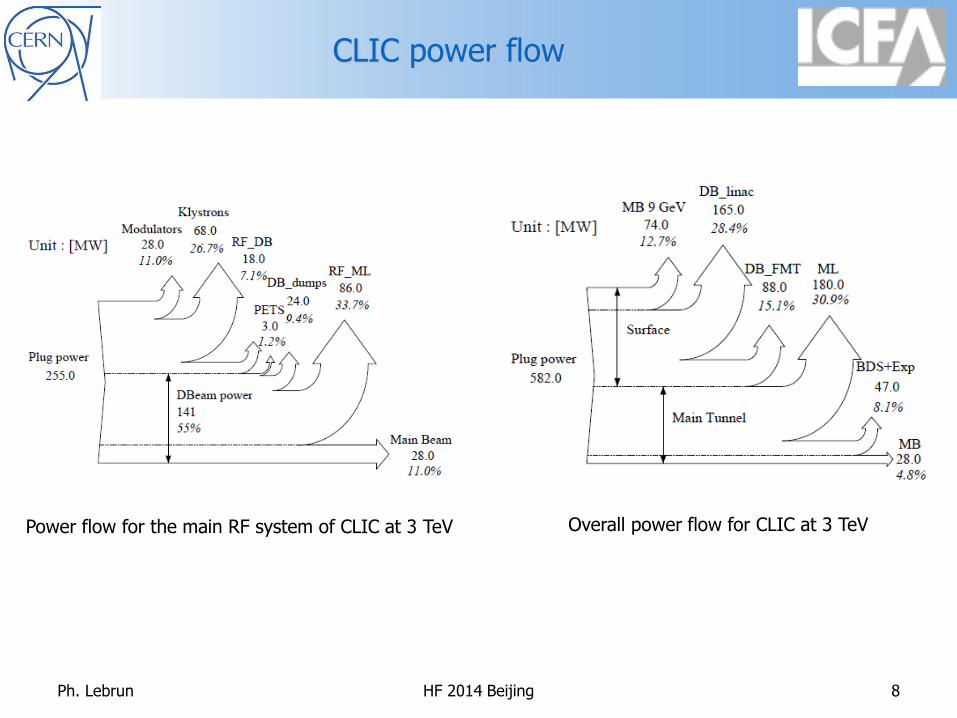
CLIC power flow
Ph. Lebrun HF 2014 Beijing 8
Power flow for the main RF system of CLIC at 3 TeV Overall power flow for CLIC at 3 TeV
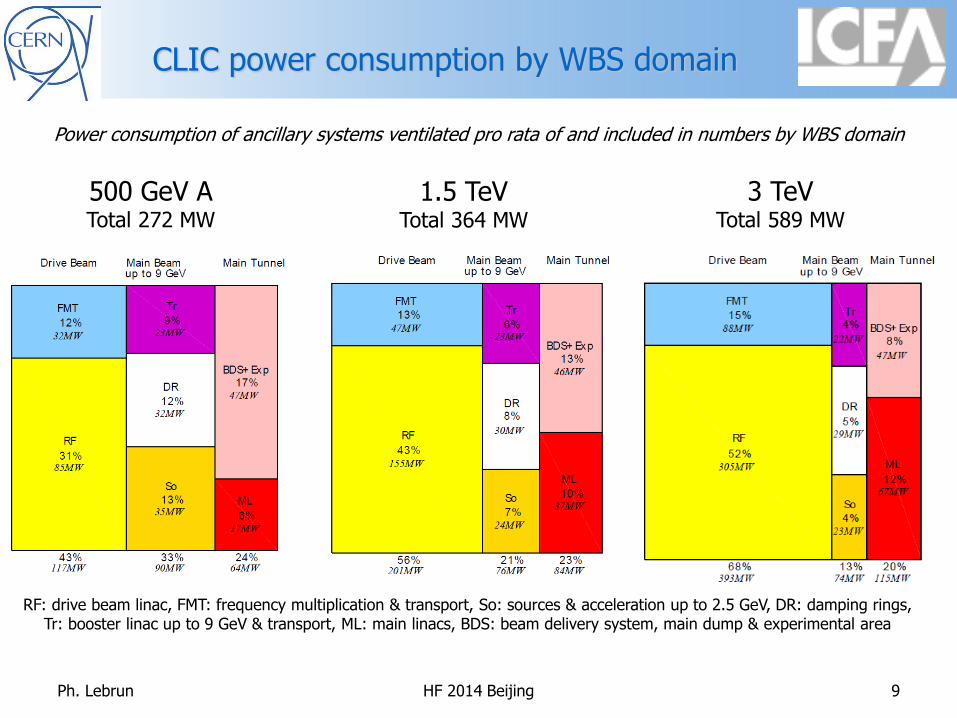
CLIC power consumption by WBS domain
500 GeV A Total 272 MW
1.5 TeV Total 364 MW
3 TeV Total 589 MW
Power consumption of ancillary systems ventilated pro rata of and included in numbers by WBS domain
RF: drive beam linac, FMT: frequency multiplication & transport, So: sources & acceleration up to 2.5 GeV, DR: damping rings, Tr: booster linac up to 9 GeV & transport, ML: main linacs, BDS: beam delivery system, main dump & experimental area
Ph. Lebrun HF 2014 Beijing 9
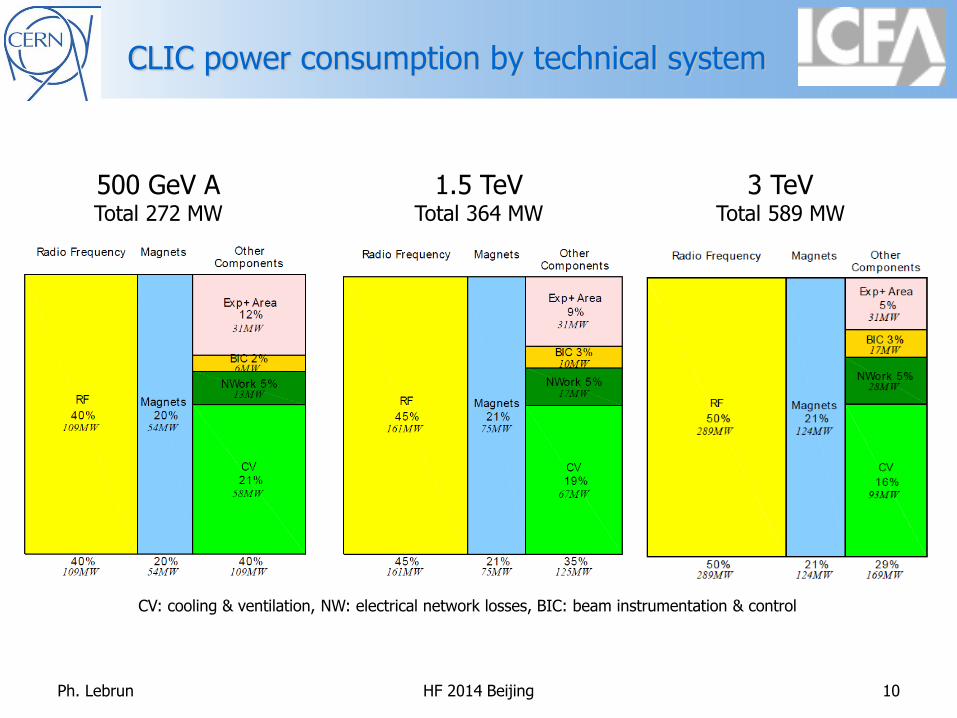
CLIC power consumption by technical system
500 GeV A Total 272 MW
1.5 TeV Total 364 MW
3 TeV Total 589 MW
CV: cooling & ventilation, NW: electrical network losses, BIC: beam instrumentation & control
Ph. Lebrun HF 2014 Beijing 10
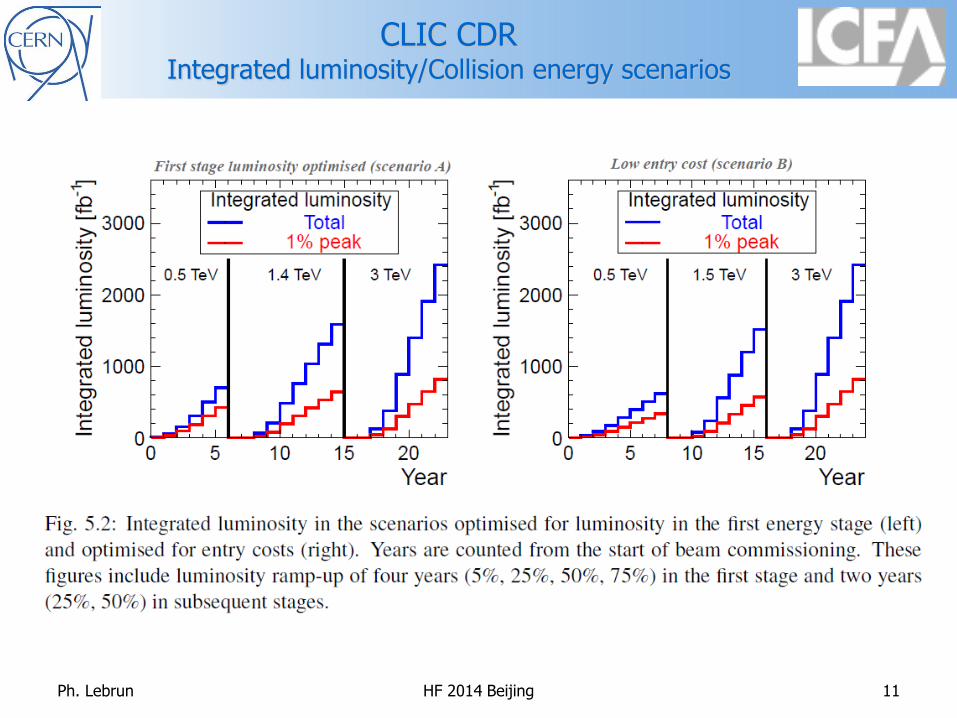
CLIC CDR Integrated luminosity/Collision energy scenarios
Ph. Lebrun HF 2014 Beijing 11
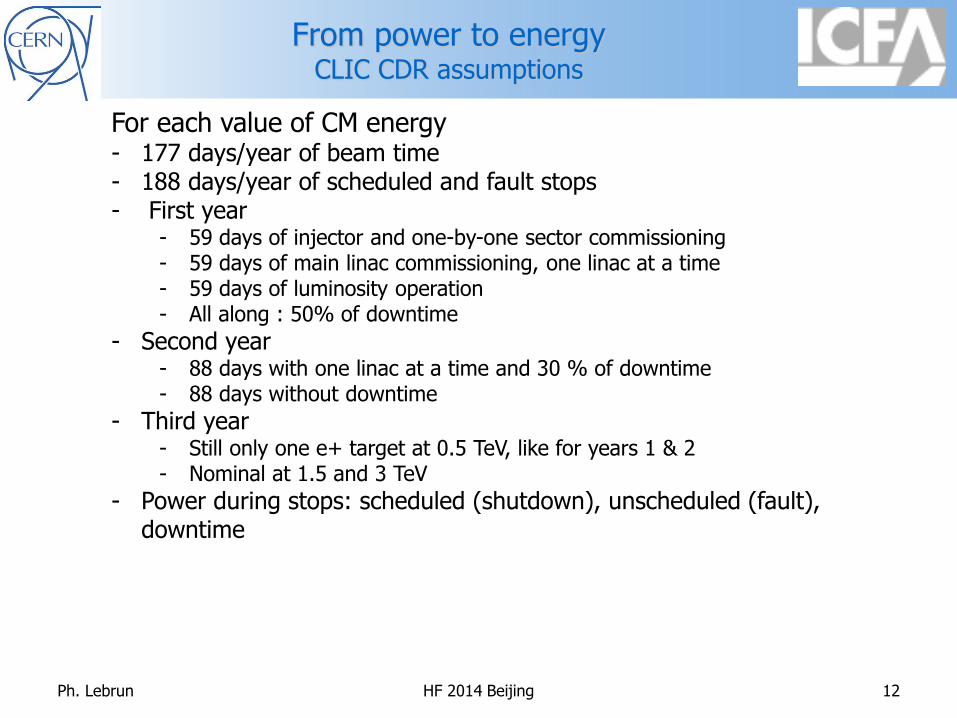
From power to energy CLIC CDR assumptions
For each value of CM energy - 177 days/year of beam time - 188 days/year of scheduled and fault stops - First year
- 59 days of injector and one-by-one sector commissioning - 59 days of main linac commissioning, one linac at a time - 59 days of luminosity operation - All along : 50% of downtime
- Second year - 88 days with one linac at a time and 30 % of downtime - 88 days without downtime
- Third year - Still only one e+ target at 0.5 TeV, like for years 1 & 2 - Nominal at 1.5 and 3 TeV
- Power during stops: scheduled (shutdown), unscheduled (fault), downtime
Ph. Lebrun HF 2014 Beijing 12
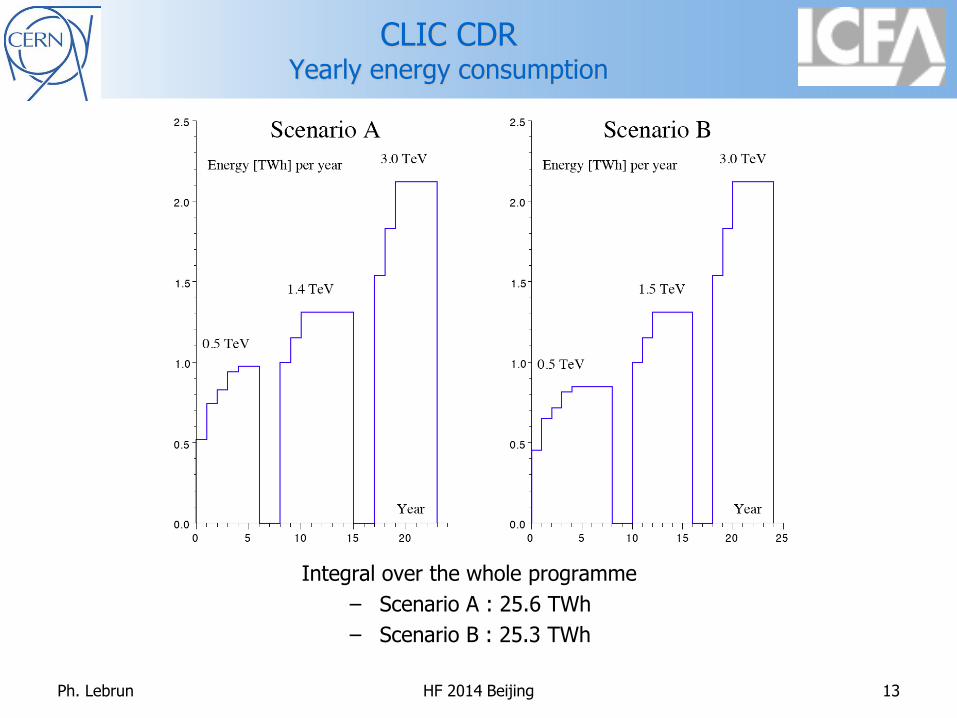
CLIC CDR Yearly energy consumption
Integral over the whole programme
– Scenario A : 25.6 TWh
– Scenario B : 25.3 TWh
Ph. Lebrun HF 2014 Beijing 13
sobriety
efficiency
energy management
waste heat recovery
The four pillars of energy economy
Ph. Lebrun HF 2014 Beijing 14
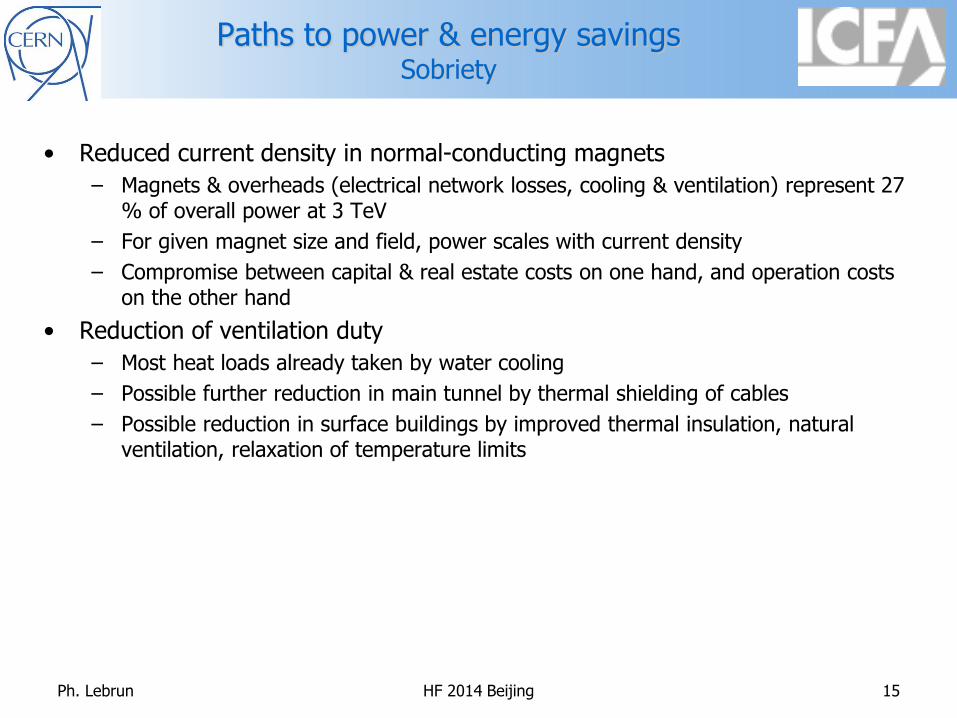
Paths to power & energy savings Sobriety
• Reduced current density in normal-conducting magnets
– Magnets & overheads (electrical network losses, cooling & ventilation) represent 27 % of overall power at 3 TeV
– For given magnet size and field, power scales with current density
– Compromise between capital & real estate costs on one hand, and operation costs on the other hand
• Reduction of ventilation duty
– Most heat loads already taken by water cooling
– Possible further reduction in main tunnel by thermal shielding of cables
– Possible reduction in surface buildings by improved thermal insulation, natural ventilation, relaxation of temperature limits
Ph. Lebrun HF 2014 Beijing 15
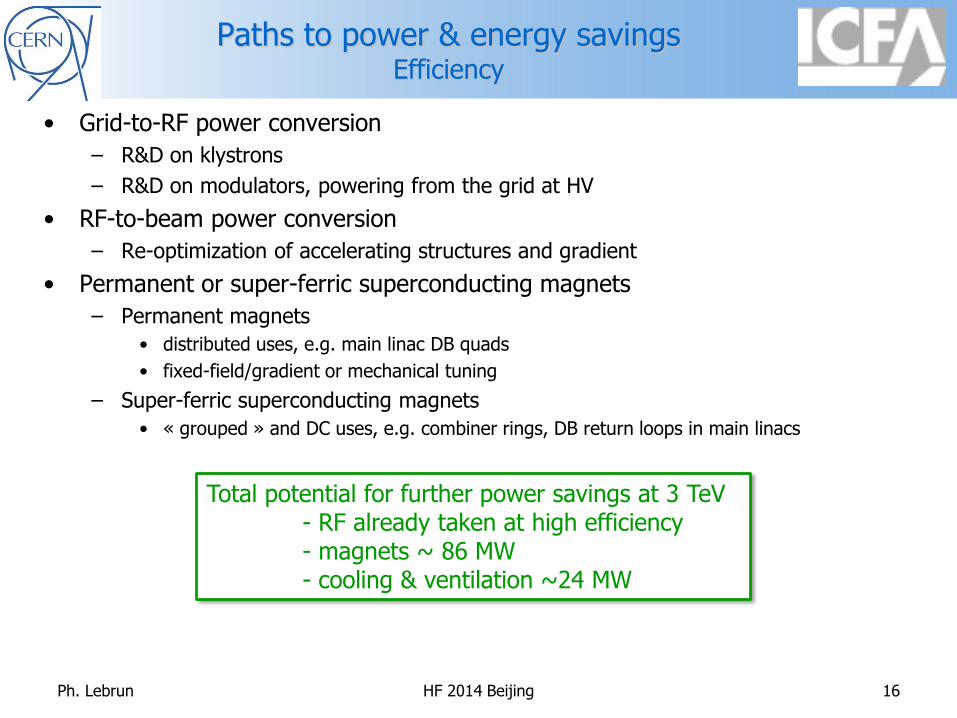
Paths to power & energy savings Efficiency
• Grid-to-RF power conversion
– R&D on klystrons
– R&D on modulators, powering from the grid at HV
• RF-to-beam power conversion
– Re-optimization of accelerating structures and gradient
• Permanent or super-ferric superconducting magnets
– Permanent magnets
• distributed uses, e.g. main linac DB quads
• fixed-field/gradient or mechanical tuning
– Super-ferric superconducting magnets
• « grouped » and DC uses, e.g. combiner rings, DB return loops in main linacs
Total potential for further power savings at 3 TeV - RF already taken at high efficiency - magnets ~ 86 MW - cooling & ventilation ~24 MW
Ph. Lebrun HF 2014 Beijing 16
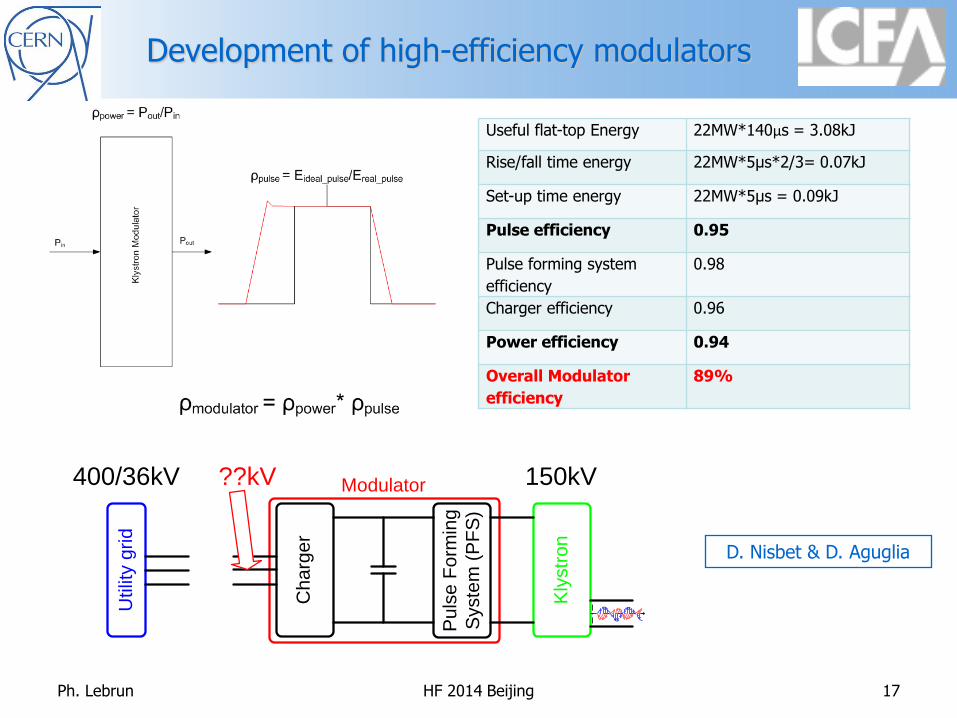
Development of high-efficiency modulators
Useful flat-top Energy 22MW*140μs = 3.08kJ
Rise/fall time energy 22MW*5μs*2/3= 0.07kJ
Set-up time energy 22MW*5μs = 0.09kJ
Pulse efficiency 0.95
Pulse forming system
efficiency
0.98
Charger efficiency 0.96
Power efficiency 0.94
Overall Modulator
efficiency
89%
Ch
arg
er
Pu
lse
Fo
rmin
g
Syste
m (
PF
S)
Modulator
Kly
str
on
Utilit
y g
rid
400/36kV 150kV??kV
D. Nisbet & D. Aguglia
Ph. Lebrun HF 2014 Beijing 17
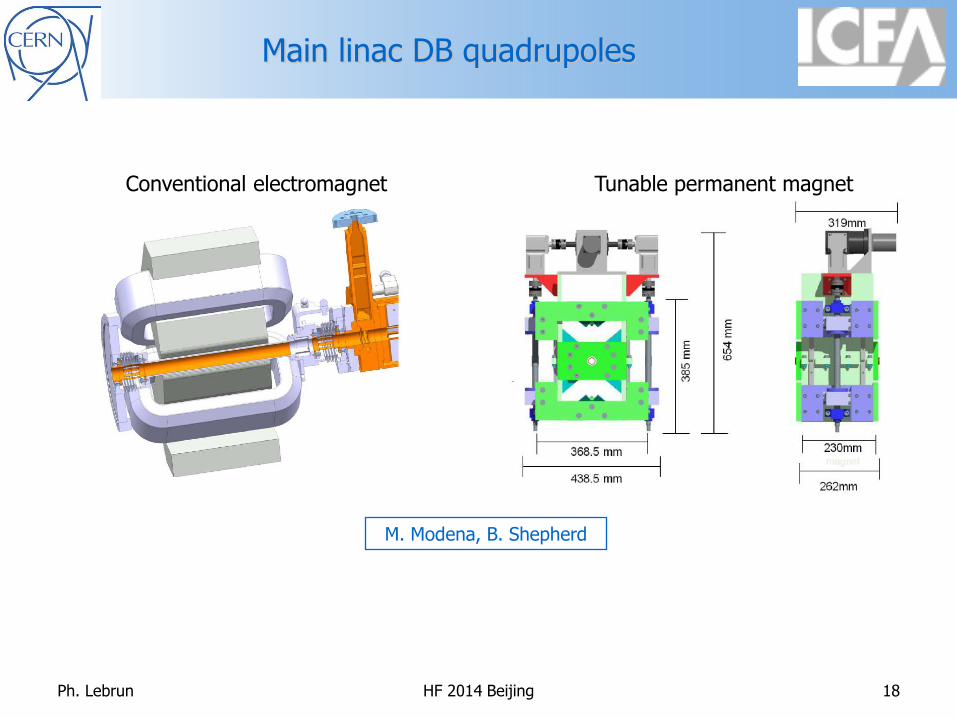
Main linac DB quadrupoles
Conventional electromagnet Tunable permanent magnet
M. Modena, B. Shepherd
Ph. Lebrun HF 2014 Beijing 18
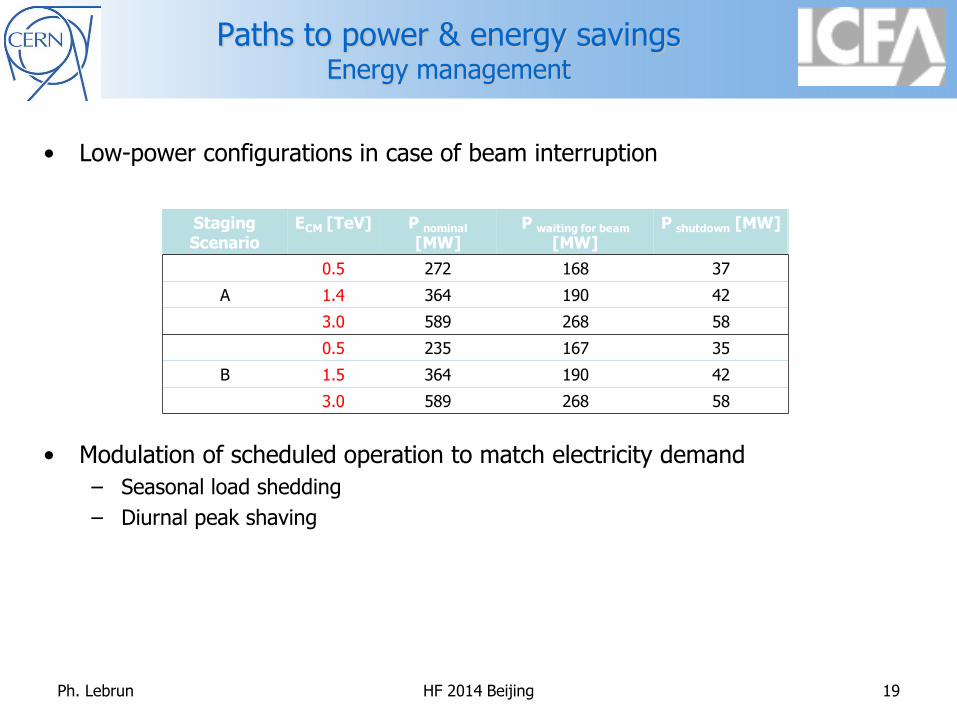
Paths to power & energy savings Energy management
• Low-power configurations in case of beam interruption
• Modulation of scheduled operation to match electricity demand
– Seasonal load shedding
– Diurnal peak shaving
Staging Scenario
ECM [TeV] P nominal
[MW]P waiting for beam
[MW]P shutdown [MW]
0.5 272 168 37
A 1.4 364 190 42
3.0 589 268 58
0.5 235 167 35
B 1.5 364 190 42
3.0 589 268 58
Ph. Lebrun HF 2014 Beijing 19
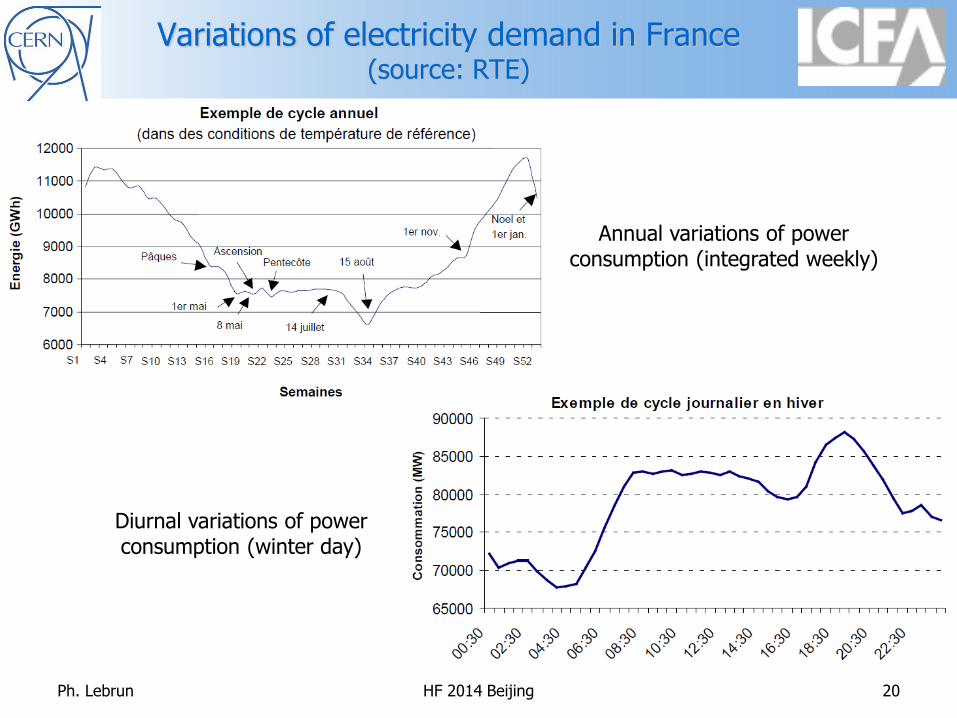
Variations of electricity demand in France (source: RTE)
Annual variations of power consumption (integrated weekly)
Diurnal variations of power consumption (winter day)
Ph. Lebrun HF 2014 Beijing 20
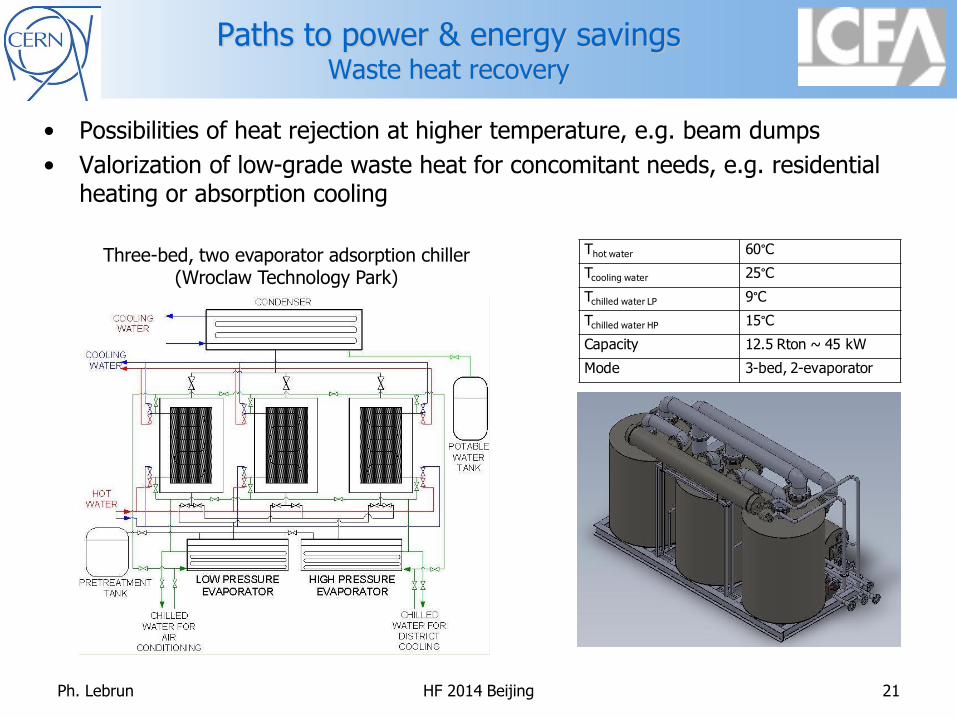
Paths to power & energy savings Waste heat recovery
• Possibilities of heat rejection at higher temperature, e.g. beam dumps
• Valorization of low-grade waste heat for concomitant needs, e.g. residential heating or absorption cooling
Thot water 60°C
Tcooling water 25°C
Tchilled water LP 9°C
Tchilled water HP 15°C
Capacity 12.5 Rton ~ 45 kW
Mode 3-bed, 2-evaporator
Three-bed, two evaporator adsorption chiller (Wroclaw Technology Park)
Ph. Lebrun HF 2014 Beijing 21
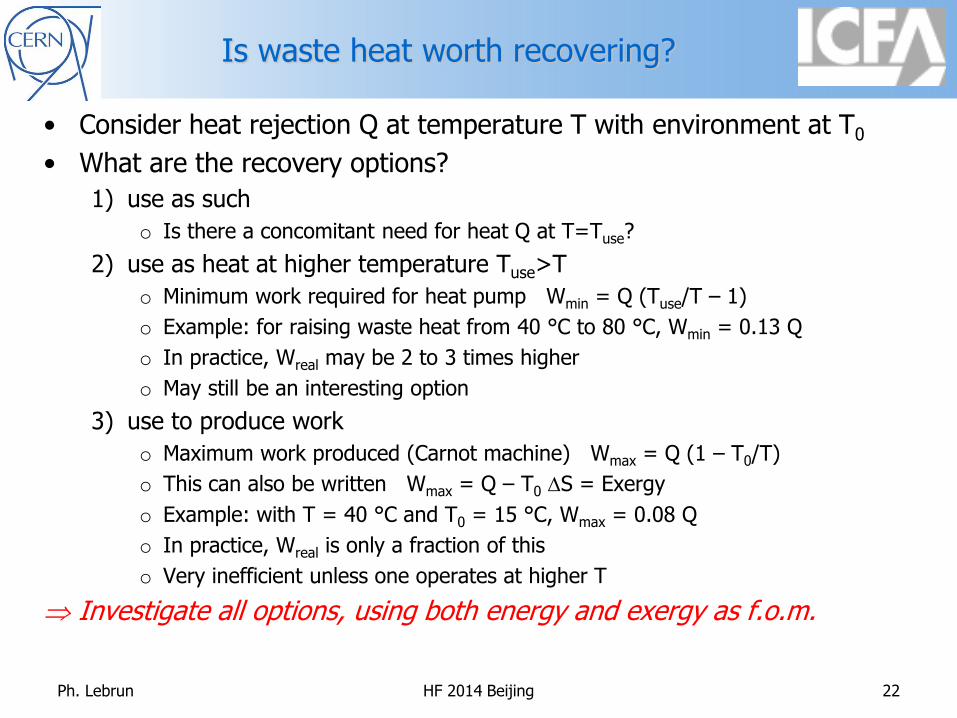
Is waste heat worth recovering?
• Consider heat rejection Q at temperature T with environment at T0
• What are the recovery options?
1) use as such
o Is there a concomitant need for heat Q at T=Tuse?
2) use as heat at higher temperature Tuse>T
o Minimum work required for heat pump Wmin = Q (Tuse/T – 1)
o Example: for raising waste heat from 40 °C to 80 °C, Wmin = 0.13 Q
o In practice, Wreal may be 2 to 3 times higher
o May still be an interesting option
3) use to produce work
o Maximum work produced (Carnot machine) Wmax = Q (1 – T0/T)
o This can also be written Wmax = Q – T0 DS = Exergy
o Example: with T = 40 °C and T0 = 15 °C, Wmax = 0.08 Q
o In practice, Wreal is only a fraction of this
o Very inefficient unless one operates at higher T
Investigate all options, using both energy and exergy as f.o.m.
Ph. Lebrun HF 2014 Beijing 22
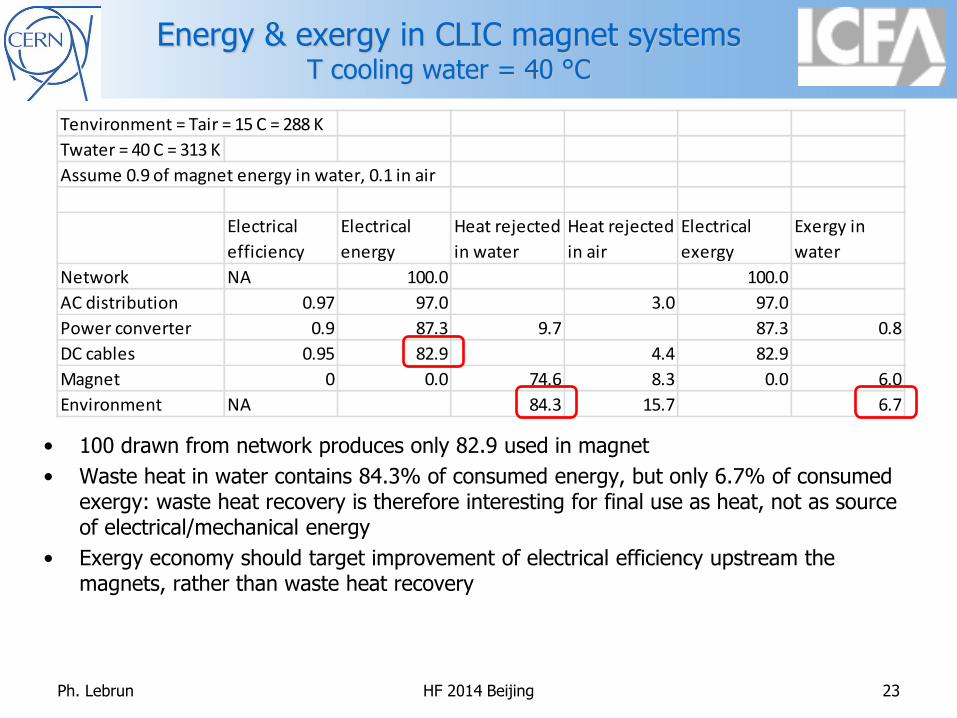
Energy & exergy in CLIC magnet systems T cooling water = 40 °C
• 100 drawn from network produces only 82.9 used in magnet
• Waste heat in water contains 84.3% of consumed energy, but only 6.7% of consumed exergy: waste heat recovery is therefore interesting for final use as heat, not as source of electrical/mechanical energy
• Exergy economy should target improvement of electrical efficiency upstream the magnets, rather than waste heat recovery
Ph. Lebrun HF 2014 Beijing 23
Tenvironment = Tair = 15 C = 288 K
Twater = 40 C = 313 K
Assume 0.9 of magnet energy in water, 0.1 in air
Electrical
efficiency
Electrical
energy
Heat rejected
in water
Heat rejected
in air
Electrical
exergy
Exergy in
water
Network NA 100.0 100.0
AC distribution 0.97 97.0 3.0 97.0
Power converter 0.9 87.3 9.7 87.3 0.8
DC cables 0.95 82.9 4.4 82.9
Magnet 0 0.0 74.6 8.3 0.0 6.0
Environment NA 84.3 15.7 6.7
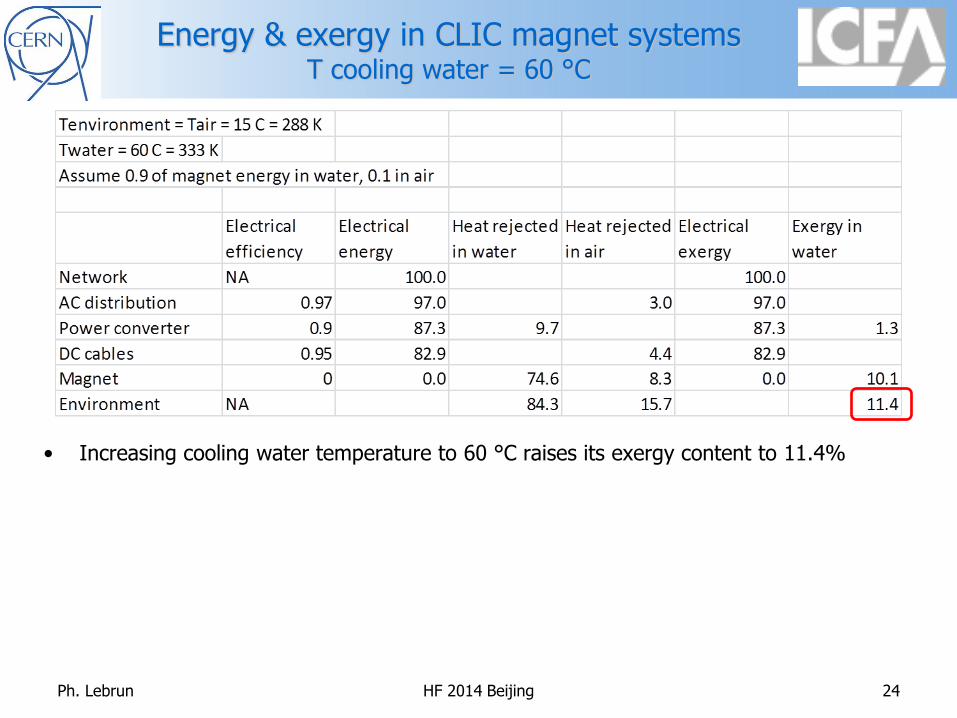
Energy & exergy in CLIC magnet systems T cooling water = 60 °C
• Increasing cooling water temperature to 60 °C raises its exergy content to 11.4%
Ph. Lebrun HF 2014 Beijing 24
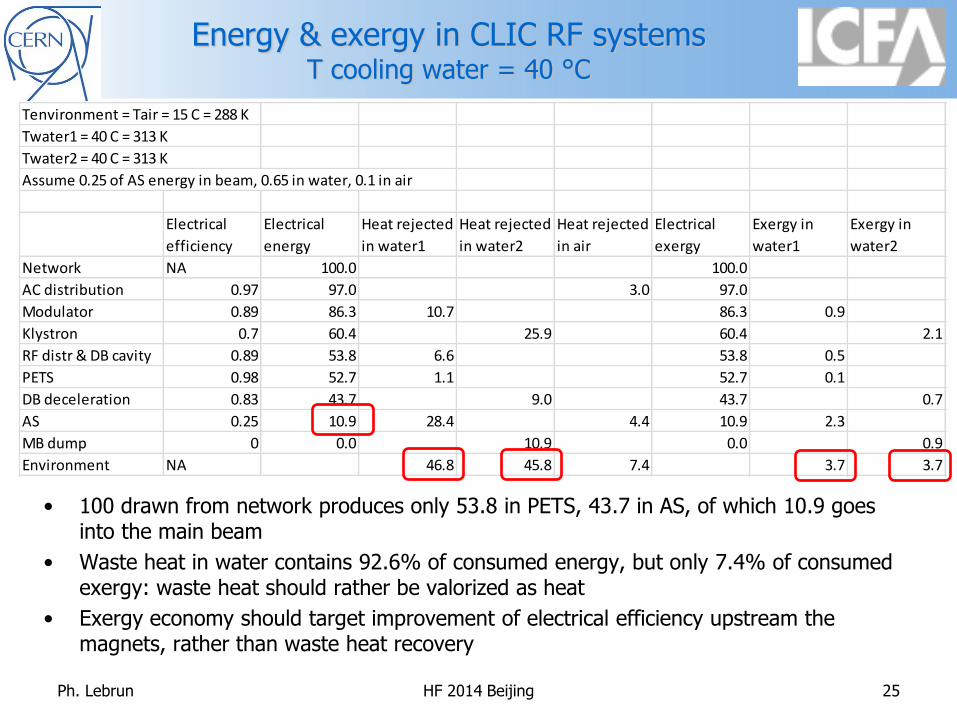
Energy & exergy in CLIC RF systems T cooling water = 40 °C
• 100 drawn from network produces only 53.8 in PETS, 43.7 in AS, of which 10.9 goes into the main beam
• Waste heat in water contains 92.6% of consumed energy, but only 7.4% of consumed exergy: waste heat should rather be valorized as heat
• Exergy economy should target improvement of electrical efficiency upstream the magnets, rather than waste heat recovery
Ph. Lebrun HF 2014 Beijing 25
Tenvironment = Tair = 15 C = 288 K
Twater1 = 40 C = 313 K
Twater2 = 40 C = 313 K
Assume 0.25 of AS energy in beam, 0.65 in water, 0.1 in air
Electrical
efficiency
Electrical
energy
Heat rejected
in water1
Heat rejected
in water2
Heat rejected
in air
Electrical
exergy
Exergy in
water1
Exergy in
water2
Network NA 100.0 100.0
AC distribution 0.97 97.0 3.0 97.0
Modulator 0.89 86.3 10.7 86.3 0.9
Klystron 0.7 60.4 25.9 60.4 2.1
RF distr & DB cavity 0.89 53.8 6.6 53.8 0.5
PETS 0.98 52.7 1.1 52.7 0.1
DB deceleration 0.83 43.7 9.0 43.7 0.7
AS 0.25 10.9 28.4 4.4 10.9 2.3
MB dump 0 0.0 10.9 0.0 0.9
Environment NA 46.8 45.8 7.4 3.7 3.7
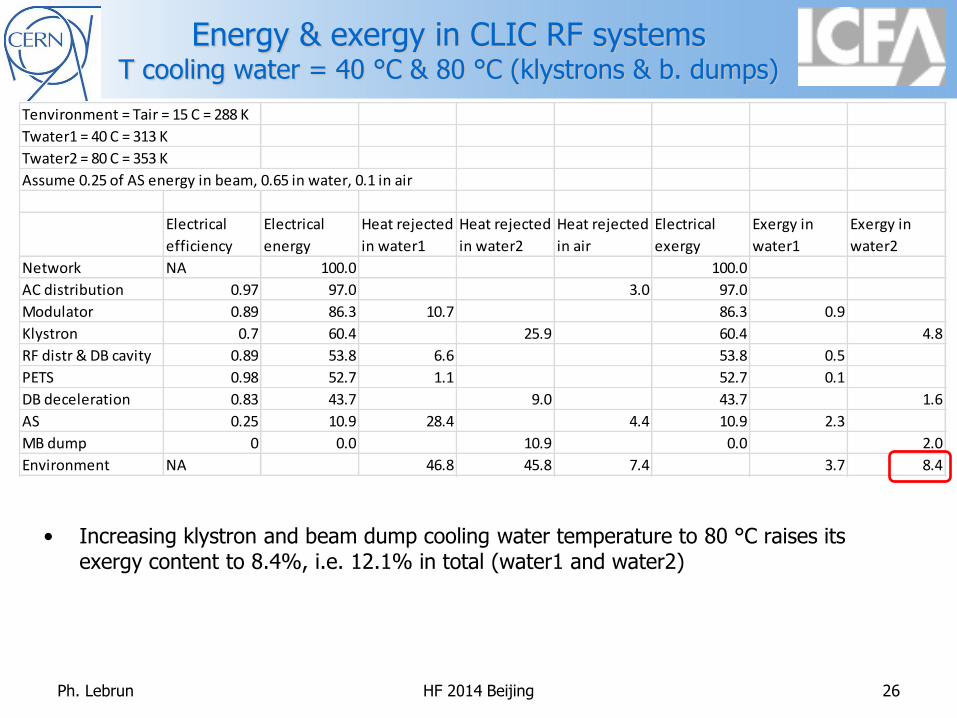
Energy & exergy in CLIC RF systems T cooling water = 40 °C & 80 °C (klystrons & b. dumps)
• Increasing klystron and beam dump cooling water temperature to 80 °C raises its exergy content to 8.4%, i.e. 12.1% in total (water1 and water2)
Ph. Lebrun HF 2014 Beijing 26
Tenvironment = Tair = 15 C = 288 K
Twater1 = 40 C = 313 K
Twater2 = 80 C = 353 K
Assume 0.25 of AS energy in beam, 0.65 in water, 0.1 in air
Electrical
efficiency
Electrical
energy
Heat rejected
in water1
Heat rejected
in water2
Heat rejected
in air
Electrical
exergy
Exergy in
water1
Exergy in
water2
Network NA 100.0 100.0
AC distribution 0.97 97.0 3.0 97.0
Modulator 0.89 86.3 10.7 86.3 0.9
Klystron 0.7 60.4 25.9 60.4 4.8
RF distr & DB cavity 0.89 53.8 6.6 53.8 0.5
PETS 0.98 52.7 1.1 52.7 0.1
DB deceleration 0.83 43.7 9.0 43.7 1.6
AS 0.25 10.9 28.4 4.4 10.9 2.3
MB dump 0 0.0 10.9 0.0 2.0
Environment NA 46.8 45.8 7.4 3.7 8.4
Conclusions
• Power consumption of CLIC and other large accelerator projects at the energy frontier has become a major issue in their technical feasibility, economic affordability and social acceptance
• Power and energy savings are therefore essential aspects of the study of such machines from the conceptual design phase
• Paths towards this goal must combine sobriety, efficiency, optimal energy management and waste heat recovery and valorisation
• Exergy content of CLIC waste heat remains low at acceptable recovery temperatures
– Conversion to mechanical work is inefficient
– Use for heating/cooling may be economical, provided one finds concomitant needs
Ph. Lebrun HF 2014 Beijing 27