Embed Size (px)
Citation preview
TRB-13-2945
FUEL CONSUMPTION AND COST SAVINGS OF CLASS 8 HEAVY-DUTY TRUCKS POWERED BY NATURAL GAS
November 15, 2012 Word Count: 7,543 (including 5 figures and 2 tables) Zhiming Gao (Corresponding Author) Oak Ridge National Laboratory National Transportation Research Center 2360 Cherahala Boulevard Knoxville, TN 37932, USA Tel.: +1-865-946-1339; Fax: + 1-865-946-1354 E-mail: [email protected] Tim J. LaClair Oak Ridge National Laboratory National Transportation Research Center 2360 Cherahala Boulevard Knoxville, TN 37932, USA Tel.: +1-865-946-1305; Fax: + 1-865-946-1541 E-mail: [email protected] C. Stuart Daw Oak Ridge National Laboratory National Transportation Research Center 2360 Cherahala Boulevard Knoxville, TN 37932, USA Tel.: +1-865-946-1341; Fax: + 1-865-946-1398 E-mail: [email protected] David E. Smith Oak Ridge National Laboratory P.O. Box 2008 MS6479 Oak Ridge, TN 37831-6479, USA Tel.: +1-865-946-1324; Fax: + 1-865-946-1262 E-mail: [email protected] Paper submitted for peer review for the 92nd Transportation Research Board Annual Meeting. Resubmission Date: November 15, 2012
TRB 2013 Annual Meeting Paper revised from original submittal.
Z. Gao, T.J. LaClair, C.S. Daw, and D.E. Smith 2
ABSTRACT 1
We compare the fuel consumption and greenhouse gas emissions of natural gas and diesel heavy-duty 2
(HD) class 8 trucks under consistent simulated drive cycle conditions. Our study includes both 3
conventional and hybrid HD trucks operating with either natural gas spark ignition (SI) or diesel engines, 4
and we compare results of the simulated fuel efficiencies, fuel costs, and payback periods. While natural 5
gas trucks achieve somewhat lower fuel economy than diesel, their CO2 emissions and costs are 6
significantly less than comparable diesel trucks. Both diesel- and natural gas-powered hybrid trucks have 7
significantly improved fuel economy, reasonable cost savings and payback time, and lower CO2 8
emissions under city driving conditions. However, under freeway-dominant driving conditions, the 9
overall benefits of hybridization are considerably less. Based on payback period alone, non-hybrid natural 10
gas trucks appear to be the most economic option for both urban and freeway driving environments. 11
Economic considerations of the impact of using natural gas as a fuel for class 8 trucks on future natural 12
gas supply and price are also presented, and the impact of a transition to natural gas use in the trucking 13
sector is expected to be quite limited. 14
TRB 2013 Annual Meeting Paper revised from original submittal.
Z. Gao, T.J. LaClair, C.S. Daw, and D.E. Smith 3
INTRODUCTION 1
Current U.S. petroleum consumption is approximately 19 million barrels per day, nearly 16% of which is 2
used as fuel for heavy-duty (HD) trucks. However, domestic petroleum production is just 7.51 million 3
barrel per day in 2010 (1). The remaining petroleum is obtained from foreign sources. Therefore, 4
developing clean and sustainable alternative energy sources for HD trucks, particularly for Class 8 HD 5
trucks, is necessary to achieve energy sustainability and support future economic development. 6
Natural gas is considered to be a cleaner burning fuel than either diesel or gasoline (2-6). Perhaps 7
most importantly, natural gas (NG) can play a vital role in reducing our reliance on foreign oil by 8
displacing the conventional oil-based fuels consumed in highway transportation (7). Although there is 9
concern that the world’s conventional oil supply will begin to decline following a supply peak (8), there is 10
a vast amount of natural gas available for domestic production. The U.S. Energy Information 11
Administration (EIA) estimates that 2,214 trillion cubic feet (TCF) of natural gas are technically 12
recoverable in the United States. At the current rate of U.S. natural gas consumption in 2010 (about 24 13
TCF per year), this volume of natural gas is sufficient to last more than 90 years (9). Of particular 14
importance, U.S. natural gas production is currently growing even faster than consumption (7), which 15
means the nation will have no need to import natural gas in the foreseeable future. Vehicle fuel use 16
currently accounts for less than 0.1% of U.S. natural gas consumption (10). The present low-cost excess 17
natural gas supply therefore represents a significant opportunity as a transportation energy source. 18
To evaluate whether HD truck transportation is an efficient and economically feasible application 19
for natural gas use, it is important to understand the real-world fuel economy, engine efficiency 20
performance, and cost savings of Class 8 HD trucks powered by natural gas as an alternative fuel to the 21
conventional diesel vehicle. It is also of interest to compare the benefits among natural gas engine 22
technology, vehicle hybridization, and the combination of both technologies as a highly efficient HD 23
truck powertrain option. This paper focuses on the simulation of both conventional and hybrid natural 24
gas-powered Class 8 HD trucks powered by spark ignition (SI) engines over multiple city and freeway-25
dominant driving cycles. We compare the fuel consumption and greenhouse gas emissions of natural gas- 26
and diesel-powered HD trucks for the same vehicle usage, and challenges associated with natural gas 27
engine efficiency and potential improvements are identified. Additionally, an analysis is performed of the 28
fuel cost savings and payback period for CNG-powered class 8 vehicles. The effect of the truck mass on 29
fuel economy and cost savings is also studied. Finally, the impact of using natural gas as a fuel for class 8 30
trucks on the future natural gas supply and price is discussed. 31
32
Literature Review of Natural Gas Fuel Economy and Cost Analysis 33
Natural gas light-duty (LD) vehicles have been successfully developed by automobile manufacturers for 34
many years (11-13). The latest natural gas LD vehicle in the current commercial market is the 2012 35
Honda Civic GX (vs. the gasoline-powered LX). These vehicles show that while meeting the Super Ultra 36
Low Emission Vehicle (SULEV) exhaust emission standards, compressed natural gas (CNG) for LD 37
vehicles achieves a comparable or slightly higher fuel economy than gasoline as a result of increasing the 38
natural gas engine’s compression ratio. The higher compression ratio is possible since natural gas has a 39
very high octane number, so knocking does not occur easily (12). Very limited studies have been 40
conducted of hybrid technology integrated with natural gas LD vehicles (14). 41
The vehicles most suited for natural gas use are medium- and heavy-duty trucks, which are 42
mainly powered by diesel. In the U.S., natural gas-powered HD trucks have been relatively uncommon in 43
the past, although truck manufacturers have recently begun to provide additional natural gas vehicle 44
offerings, including fuel storage options for both CNG and liquefied natural gas (LNG) (15). Among 45
current natural gas vehicles that are commercially available are transit buses, school buses, garbage 46
trucks, class 8 tractors, pickup trucks, and vans (3-6, 15-16). Diesel and CNG medium-duty (MD) city 47
buses were compared and it was found that the CNG MD buses averaged 17% lower in-use fuel economy 48
than the diesel buses (5). The result from a Viking Tractor powered by a 8.3-L CNG Cummins engine (6) 49
TRB 2013 Annual Meeting Paper revised from original submittal.
Z. Gao, T.J. LaClair, C.S. Daw, and D.E. Smith 4
shows a 23.2% penalty in fuel economy for the natural gas tractors. Chassis dynamometer tests for a 1
15,500 kg bus powered by a combined CNG/diesel show 11% less fuel efficiency than a comparable 2
diesel bus. The reports available for LNG-fueled vehicles are still limited, but the preliminary results 3
illustrate that LNG’s higher energy density makes its use attractive for HD vehicles with high range 4
requirements and limited fuel storage space (15, 17-18). Most of these experimental studies were carried 5
out over lab chassis dynamometer and city driving cycles. Evaluations of natural gas-powered Class 8 6
trucks driving in typical freeway-dominant conditions are still insufficient. The studies available also did 7
not account for the effect of truck mass or cargo load. Furthermore, comparison of the benefits among 8
natural gas technology, hybrid technology, and their combination have not been conducted and reported, 9
as far as we are aware. 10
Similar to the status of fuel economy for natural gas HD trucks, economic analyses of natural gas 11
and hybridized Class 8 HD trucks are limited or inadequate since materials and manufacturing costs vary 12
from year to year (4, 16, 19). A recent study found that more than 10 years were necessary to return the 13
original investment cost of a 2012 Honda CNG Civic GX (vs. the gasoline-powered LX) (20). This return 14
period is not likely to be perceived by the consumer as economically attractive. However, preliminary 15
estimations show that natural gas savings are very substantial in heavy-duty vehicles, particularly Class 8 16
HD trucks (7). This is because of the significant fuel consumption resulting from the high mileages 17
traveled annually with long-haul HD vehicles (1). Also, recent prices of natural gas have been less than 18
half the cost of diesel on a fuel energy basis, and natural gas prices have been reasonably stable to slightly 19
declining in recent years, while oil prices have been steadily rising (7, 9, 21). These price trends will 20
make the fuel price ratio between natural gas and diesel even more favorable in the future. Therefore, 21
utilizing accurate fuel economy data and up-to-date cost data to estimate the payback time and vehicle 22
lifespan cost savings for natural gas HD trucks is of particular importance for decision makers, 23
manufacturers, and HD truck fleets in order to evaluate the effectiveness and cost benefits of the 24
technology (7, 19). 25
26
ANALYSIS METHODOLOGY 27
Truck Modeling 28
The use of steady-state engine maps for conducting fuel economy analysis provides simple and accurate 29
performance estimates for vehicle transient fuel consumption simulations (22). One of the vehicle 30
simulation packages utilizing such component steady-state maps is Autonomie (23), which is a plug-and-31
play vehicle model architecture designed to evaluate powertrain technologies for improving fuel 32
economy, pollutant emissions reduction, and vehicle performance, and runs in the Matlab environment. 33
Thus, Autonomie was chosen as our vehicle simulation platform for predicting and comparing fuel 34
consumption and emissions from diesel and natural gas HD trucks. 35
A conventional Class 8 heavy-duty truck configuration was selected in Autonomie and the default 36
model has been modified to represent our HD truck baseline case. The engine parameters for the model 37
were tuned to be representative of a 15-L 6-cylinder Cummins ISX 475 diesel engine (engine rated 38
power: 475hp) and an Eaton Fuller RT-11710B 10-Speed manual transmission was selected for the 39
drivetrain. A HD diesel engine map available in Autonomie was used for the simulations, but the engine 40
model was scaled using the rated engine power of the Cummins engine. The truck coefficients of drag and 41
rolling resistance used in the simulation were 0.58 and 0.007, respectively, while the frontal area was 42
taken to be 10 m2. We also utilized Autonomie to develop a Class 8 heavy-duty hybrid truck model, the 43
hybrid powertrain of which utilized a pre-transmission parallel configuration with a single motor between 44
the clutch and gearbox and was based on details available in the open literature. The selected electric 45
motor and battery were both rated at 200 kW (24). Other powertrain components and parameters are the 46
same as those utilized in the conventional HD truck simulations, but the mass was increased by 400kg to 47
account for the battery, electric motor and control system in the hybrid version. 48
TRB 2013 Annual Meeting Paper revised from original submittal.
Z. Gao, T.J. LaClair, C.S. Daw, and D.E. Smith 5
In simulating natural gas-powered HD trucks, a 15-L natural gas spark-ignited (SI) engine with a 1
turbocharger replaced the Cummins ISX 475 engine in the above conventional and hybrid trucks without 2
changing any of the other vehicle parameters in the model, except for the vehicle weight. The natural gas 3
engine map was extracted from reference (17) and (23) and was implemented in the form of Simulink 4
functions in Autonomie. We assume that (1) both the diesel and natural gas engines are compatible with 5
the vehicle powertrain and drivetrain of the simulated vehicles; and (2) 400 kg accounts for the weight 6
penalty of the natural gas fueling and storage system. With these simple assumptions, we expect the truck 7
models can reasonably reflect the general performance trend of diesel and natural gas trucks. 8
9
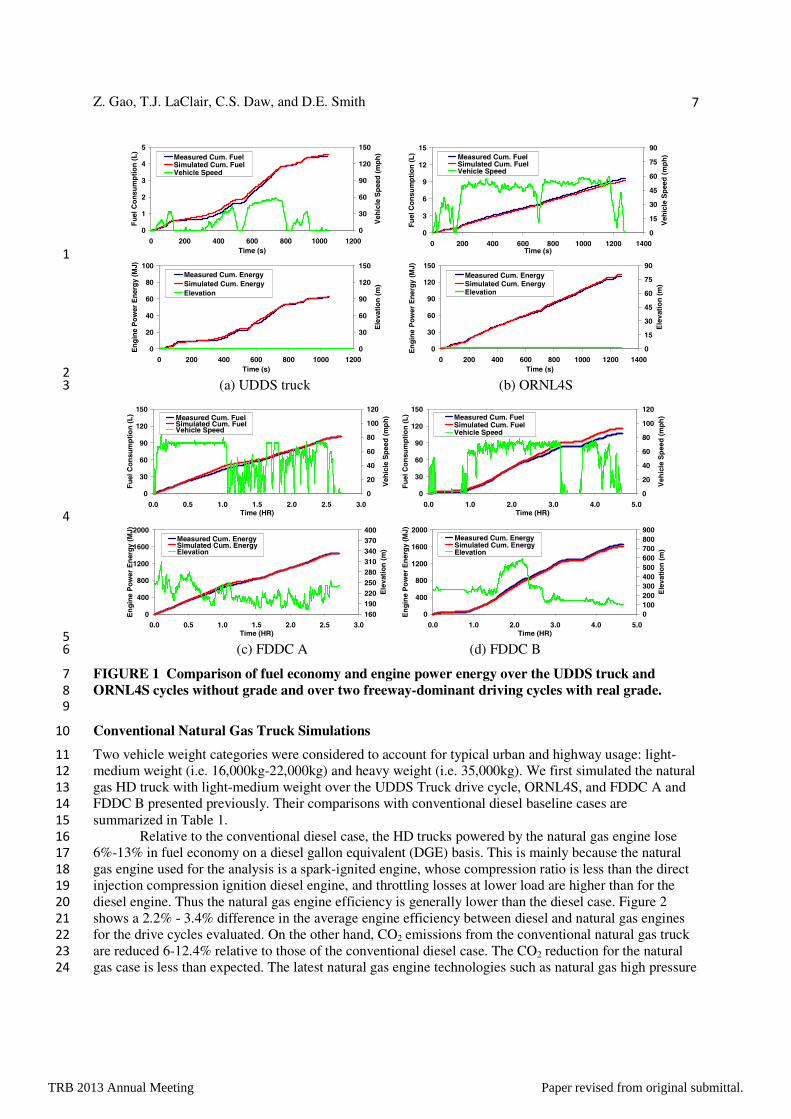
Transient Driving Cycles 10
To evaluate the fuel consumption and greenhouse gas (GHG) emissions of class 8 trucks over real road 11
conditions, we chose to simulate multiple driving cycles, including UDDS Truck and ORNL4S chassis 12
dynamometer driving cycles and freeway-dominant driving cycles (FDDC), see Figure 1. The UDDS 13
Truck cycle represents city driving conditions (i.e. 5.45 miles traveled during 1051 seconds of travel), and 14
the ORNL4S cycle presented by ORNL (25) characterizes non-interstate highway driving conditions (i.e. 15
15.40 miles traveled during 1277 s of travel). Unlike UDDS Truck and ORNL4S cycles which do not 16
consider real road conditions such as grade, two freeway-dominant driving cycles (FDDC) were selected 17
from ORNL duty cycle data (25). The drive cycles were measured during normal operations from class-8 18
tractor-trailers in a fleet engaged in freight delivery. The data include transient fuel consumption, engine 19
speed and torque, gear ratio, vehicle speed, elevation and so on. The first selected driving cycle (referred 20
to as FDDC A) represents 139 miles of travel with a maximum speed of 84.7 mph over a 2.7 hour period 21
(see Figure 1(c)). There was an overall elevation change (minimum to maximum elevation) of 133m 22
measured during the actual driving, and the variations of elevation throughout the drive cycle were 23
included in the analysis to account for the gravitational force acting on the vehicle. The second selected 24
driving cycle (referred to as FDDC B) covers 202 miles with a maximum speed of 77.7 mph during about 25
4.7 hours of driving, and the cycle included an elevation change of 470m (see Figure 1(d)). The elevation 26
variations during the drive cycle were modeled for the FDDC B analysis also. These driving cycles are 27
able to reasonably reflect the impact of real road conditions on truck fuel consumption and GHG 28
emissions over city and highway driving conditions. 29
30
Cost-Savings Analysis Methodology 31
The cost saving analysis focuses on the payback time and net vehicle lifespan cost savings for natural gas 32
and hybrid technologies in Class 8 HD trucks. The analysis presented is based on a CNG fuel system but 33
could be easily adjusted to consider a LNG fuel system as well. To simplify the analysis, we did not 34
consider truck maintenance costs and assumed the fuel price differential between diesel and natural gas to 35
be constant. The payback time was calculated using the initial investment cost for the natural gas fueling 36
system, hybridization technology or both, divided by the annual fuel consumption cost savings for each 37
vehicle relative to a conventional diesel vehicle. The net vehicle lifespan cost saving was then calculated 38
as the difference between the vehicle lifespan fuel consumption cost saving and the initial investment 39
cost. 40
The initial investment cost for natural gas fueling system accounts for fuel storage and non-41
storage-tank systems. The non-storage-tank incremental costs are assumed to be $30,000 for Class 8 42
vehicles, and fuel storage costs are about $350 per gallon diesel equivalent for CNG (26). For the 43
hybridized vehicle cases, the OEM price of a typical hybrid system depends on the type and size of the 44
vehicle, and the total vehicle can cost 40 - 70 percent more than a non-hybrid model (27). Thus we 45
estimated a Class 8 HD hybrid truck adds $60,000, which was based on the following assumptions: (1) a 46
typical heavy-duty truck chassis costs about $120,000; (2) hybrid technology increases the cost by 50% 47
relative to a non-hybrid model. This hybrid cost is very close to the recent OEM analysis (19). It is 48
expected, however, that all of these prices could be reduced with future increases in market demand. 49
TRB 2013 Annual Meeting Paper revised from original submittal.
Z. Gao, T.J. LaClair, C.S. Daw, and D.E. Smith 6
The annual cost savings due to reduced fuel cost is calculated simply as the annual fuel cost with 1
conventional diesel vehicle technology minus the annual fuel cost with the new vehicle technology. The 2
annual fuel cost is calculated as the product of vehicle fuel economy, fuel price and annual mileage. 3
Vehicle fuel economy is computed using Autonomie over the selected driving cycles. The assumed fuel 4
price is based on the 2012 Clean Cities Alternative Fuel Price Report (28), which shows the average 5
national CNG price (as of January 2012) as $2.38 on a diesel gallon equivalent (DGE) basis compared to 6
$3.86 per gallon for diesel. Vehicle annual mileage is considered as an input. Finally, the vehicle lifespan 7
fuel consumption cost is taken as the product of the annual fuel cost and the vehicle lifespan. The vehicle 8
lifespan is assumed to be 10-12 years. 9
10
RESULTS 11
Diesel Baseline Simulations 12
The baseline analysis cases for the diesel HD trucks were first conducted over the UDDS Truck and 13
ORNL4S chassis dynamometer driving cycles to ensure proper characterization of the vehicle 14
configuration in Autonomie. Test results from a vehicle with the same configuration as that simulated in 15
the baseline case were used to provide a basic validation of the model results. The predicted results were 16
compared with experimental measurements obtained by West Virginia University (WVU) of a 2005 17
18,700 kg Volvo VN 610 tractor powered by a Cummins ISX 475 15-L diesel engine with a 10-speed 18
manual transmission (the same configuration used in the diesel vehicle model). The predicted and 19
measured fuel economies were 4.58 mpg vs. 4.63 mpg (25), respectively, over the UDDS Truck cycle, 20
while the predicted fuel economy was 6.35 mpg, compared to 6.10 mpg for the measured truck over the 21
ORNL4S cycle (25). Figure 1(a) and 1(b) compare the fuel consumption and engine power energy (the 22
integral of the engine power over the drive cycle) between the simulations and WVU measurements. The 23
difference between the model prediction and the on-vehicle measurement of fuel consumption and engine 24
power energy was within 5% for each complete drive cycle. 25
Since the UDDS Truck and ORNL4S cycles are chassis dynamometer drive cycles, which do not 26
consider real road conditions such as grade, we further simulated the two freeway-dominant driving 27
cycles (i.e. FDDC A and FDDC B). One of the important parameters in simulating the fuel economy of 28
class-8 HD trucks is the vehicle mass. For FDDC A and B, the mass was determined by iteratively 29
adjusting the total vehicle mass in the model until the simulated engine power energy was in agreement 30
with the measured engine power energy in each case. Based on this approach, the total vehicle mass was 31
estimated to be 21,000 kg in FDDC A. The predicted and measured fuel economies for this drive cycle 32
were 5.20 mpg and 5.22 mpg (25), respectively. The comparison of the measured and predicted fuel 33
consumption and engine power energy is shown in Figure 1(c). During FDDC B, the simulated truck 34
weight was 16,000 kg. The predicted fuel economy is 6.56 mpg which corresponds to 8% less fuel 35
consumption than from the measured data (25), as shown in Figure 1(d). Generally, the predictions are 36
reasonably close to the measured HD truck data through most of the drive cycles, and the differences 37
observed are likely the result of variations in road and weather conditions, accessory power use, and/or 38
aftertreatment regenerations during the actual driving. Additionally, slight inaccuracies in the vehicle 39
parameter values (coefficients of aerodynamic drag and rolling resistance, etc.) used in the model could 40
contribute to the errors observed, although the parameters used have been found to provide very good fuel 41
economy estimates for the vehicles tested. 42
Unfortunately, for this study there were no experimental data available for CNG and LNG HD 43
trucks nor for diesel hybrid trucks. Since we have confirmed that the model using the selected parameters 44
for the truck configuration compared well with experimental data reported in the open literature and 45
ORNL on-road measurements, this gives us confidence that the baseline truck model is reasonable. In the 46
subsequent natural gas truck simulations, a 15-L natural gas engine map generated from direct 47
experimental measurement was used to replace the 15-L Cummins diesel engine map, so we expect that at 48
least the predicted trends should be correct. 49
TRB 2013 Annual Meeting Paper revised from original submittal.
Z. Gao, T.J. LaClair, C.S. Daw, and D.E. Smith 7
0
1
2
3
4
5
0 200 400 600 800 1000 1200Time (s)
Fu
el C
on
sum
pti
on
(L
)
0
30
60
90
120
150
Veh
icle
Sp
eed
(m
ph
)Measured Cum. FuelSimulated Cum. FuelVehicle Speed
0
3
6
9
12
15
0 200 400 600 800 1000 1200 1400Time (s)
Fu
el C
on
sum
pti
on
(L
)
0
15
30
45
60
75
90
Veh
icle
Sp
eed
(m
ph
)Measured Cum. FuelSimulated Cum. FuelVehicle Speed
1
0
20
40
60
80
100
0 200 400 600 800 1000 1200Time (s)
En
gin
e P
ow
er E
ner
gy
(MJ)
0
30
60
90
120
150
Ele
vati
on
(m
)
Measured Cum. EnergySimulated Cum. EnergyElevation
0
30
60
90
120
150
0 200 400 600 800 1000 1200 1400Time (s)
En
gin
e P
ow
er E
ner
gy
(MJ)
0
15
30
45
60
75
90
Ele
vati
on
(m
)
Measured Cum. EnergySimulated Cum. EnergyElevation
2
(a) UDDS truck (b) ORNL4S 3
0
30
60
90
120
150
0.0 0.5 1.0 1.5 2.0 2.5 3.0Time (HR)
Fu
el C
on
sum
pti
on
(L
)
0
20
40
60
80
100
120
Veh
icle
Sp
eed
(m
ph
)Measured Cum. FuelSimulated Cum. FuelVehicle Speed
0
30
60
90
120
150
0.0 1.0 2.0 3.0 4.0 5.0Time (HR)
Fu
el C
on
sum
pti
on
(L
)
0
20
40
60
80
100
120
Veh
icle
Sp
eed
(m
ph
)Measured Cum. FuelSimulated Cum. FuelVehicle Speed
4
0
400
800
1200
1600
2000
0.0 0.5 1.0 1.5 2.0 2.5 3.0Time (HR)
En
gin
e P
ow
er E
ner
gy
(MJ)
160190220250280310340370400
Ele
vati
on
(m
)
Measured Cum. EnergySimulated Cum. EnergyElevation
0
400
800
1200
1600
2000
0.0 1.0 2.0 3.0 4.0 5.0Time (HR)
En
gin
e P
ow
er E
ner
gy
(MJ)
0100200300400500600700800900
Ele
vati
on
(m
)
Measured Cum. EnergySimulated Cum. EnergyElevation
5
(c) FDDC A (d) FDDC B 6
FIGURE 1 Comparison of fuel economy and engine power energy over the UDDS truck and 7
ORNL4S cycles without grade and over two freeway-dominant driving cycles with real grade. 8
9
Conventional Natural Gas Truck Simulations 10
Two vehicle weight categories were considered to account for typical urban and highway usage: light-11
medium weight (i.e. 16,000kg-22,000kg) and heavy weight (i.e. 35,000kg). We first simulated the natural 12
gas HD truck with light-medium weight over the UDDS Truck drive cycle, ORNL4S, and FDDC A and 13
FDDC B presented previously. Their comparisons with conventional diesel baseline cases are 14
summarized in Table 1. 15
Relative to the conventional diesel case, the HD trucks powered by the natural gas engine lose 16
6%-13% in fuel economy on a diesel gallon equivalent (DGE) basis. This is mainly because the natural 17
gas engine used for the analysis is a spark-ignited engine, whose compression ratio is less than the direct 18
injection compression ignition diesel engine, and throttling losses at lower load are higher than for the 19
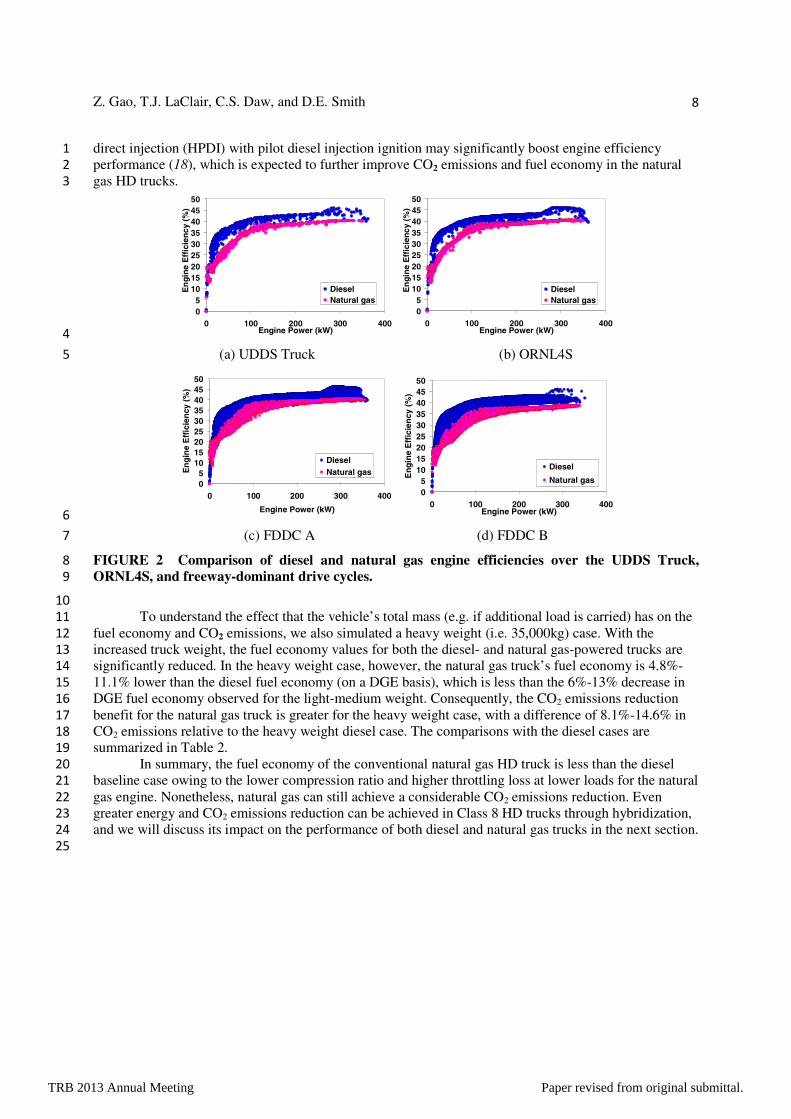
diesel engine. Thus the natural gas engine efficiency is generally lower than the diesel case. Figure 2 20
shows a 2.2% - 3.4% difference in the average engine efficiency between diesel and natural gas engines 21
for the drive cycles evaluated. On the other hand, CO2 emissions from the conventional natural gas truck 22
are reduced 6-12.4% relative to those of the conventional diesel case. The CO2 reduction for the natural 23
gas case is less than expected. The latest natural gas engine technologies such as natural gas high pressure 24
TRB 2013 Annual Meeting Paper revised from original submittal.
Z. Gao, T.J. LaClair, C.S. Daw, and D.E. Smith 8
direct injection (HPDI) with pilot diesel injection ignition may significantly boost engine efficiency 1
performance (18), which is expected to further improve CO2 emissions and fuel economy in the natural 2
gas HD trucks. 3
05
101520253035404550
0 100 200 300 400Engine Power (kW)
En
gin
e E
ffic
ien
cy (
%)
DieselNatural gas
05
101520253035404550
0 100 200 300 400Engine Power (kW)
En
gin
e E
ffic
ien
cy (
%)
DieselNatural gas
4
(a) UDDS Truck (b) ORNL4S 5
05
101520253035404550
0 100 200 300 400
Engine Power (kW)
En
gin
e E
ffic
ien
cy (
%)
DieselNatural gas
05
101520253035404550
0 100 200 300 400Engine Power (kW)
En
gin
e E
ffic
ien
cy (
%)
Diesel
Natural gas
6
(c) FDDC A (d) FDDC B 7
FIGURE 2 Comparison of diesel and natural gas engine efficiencies over the UDDS Truck, 8
ORNL4S, and freeway-dominant drive cycles. 9
10
To understand the effect that the vehicle’s total mass (e.g. if additional load is carried) has on the 11
fuel economy and CO2 emissions, we also simulated a heavy weight (i.e. 35,000kg) case. With the 12
increased truck weight, the fuel economy values for both the diesel- and natural gas-powered trucks are 13
significantly reduced. In the heavy weight case, however, the natural gas truck’s fuel economy is 4.8%-14
11.1% lower than the diesel fuel economy (on a DGE basis), which is less than the 6%-13% decrease in 15
DGE fuel economy observed for the light-medium weight. Consequently, the CO2 emissions reduction 16
benefit for the natural gas truck is greater for the heavy weight case, with a difference of 8.1%-14.6% in 17
CO2 emissions relative to the heavy weight diesel case. The comparisons with the diesel cases are 18
summarized in Table 2. 19
In summary, the fuel economy of the conventional natural gas HD truck is less than the diesel 20
baseline case owing to the lower compression ratio and higher throttling loss at lower loads for the natural 21
gas engine. Nonetheless, natural gas can still achieve a considerable CO2 emissions reduction. Even 22
greater energy and CO2 emissions reduction can be achieved in Class 8 HD trucks through hybridization, 23
and we will discuss its impact on the performance of both diesel and natural gas trucks in the next section. 24
25
TRB 2013 Annual Meeting Paper revised from original submittal.
Z. Gao, T.J. LaClair, C.S. Daw, and D.E. Smith 9
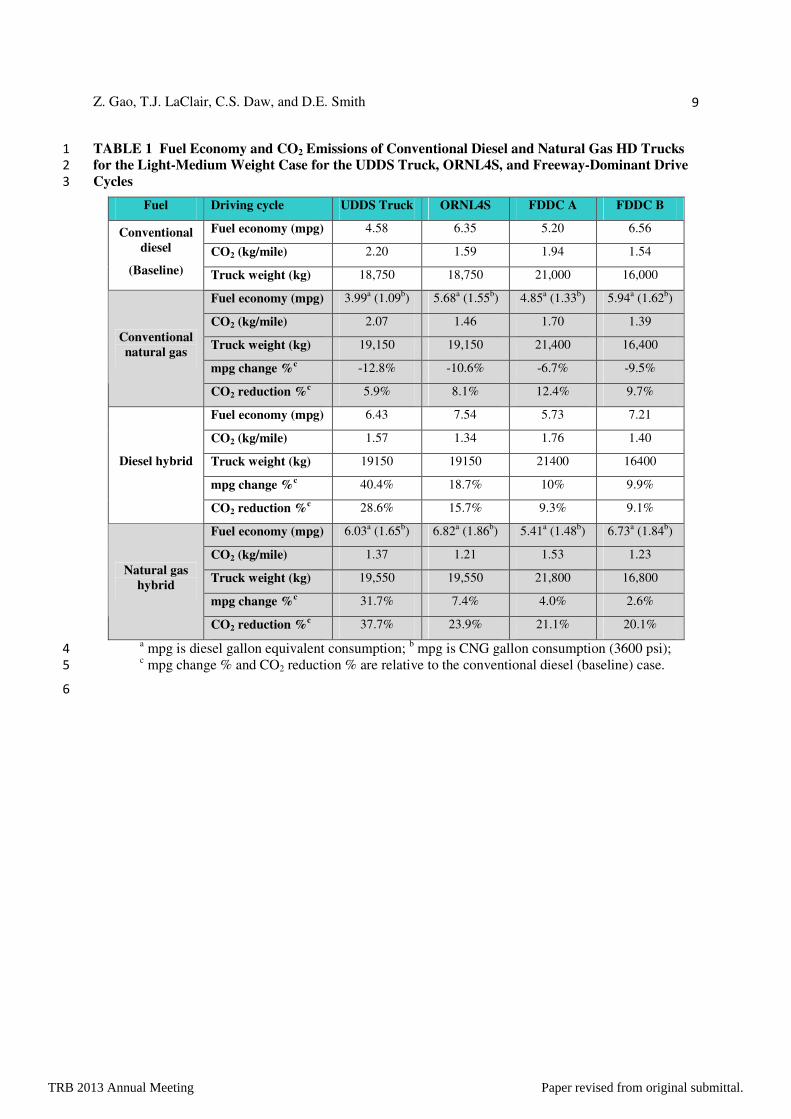
TABLE 1 Fuel Economy and CO2 Emissions of Conventional Diesel and Natural Gas HD Trucks 1
for the Light-Medium Weight Case for the UDDS Truck, ORNL4S, and Freeway-Dominant Drive 2
Cycles 3
Fuel Driving cycle UDDS Truck ORNL4S FDDC A FDDC B
Fuel economy (mpg) 4.58 6.35 5.20 6.56
CO2 (kg/mile) 2.20 1.59 1.94 1.54
Conventional diesel
(Baseline) Truck weight (kg) 18,750 18,750 21,000 16,000
Fuel economy (mpg) 3.99a (1.09b) 5.68a (1.55b) 4.85a (1.33b) 5.94a (1.62b)
CO2 (kg/mile) 2.07 1.46 1.70 1.39
Truck weight (kg) 19,150 19,150 21,400 16,400
mpg change %c -12.8% -10.6% -6.7% -9.5%
Conventional natural gas
CO2 reduction %c 5.9% 8.1% 12.4% 9.7%
Fuel economy (mpg) 6.43 7.54 5.73 7.21
CO2 (kg/mile) 1.57 1.34 1.76 1.40
Truck weight (kg) 19150 19150 21400 16400
mpg change %c 40.4% 18.7% 10% 9.9%
Diesel hybrid
CO2 reduction %c 28.6% 15.7% 9.3% 9.1%
Fuel economy (mpg) 6.03a (1.65b) 6.82a (1.86b) 5.41a (1.48b) 6.73a (1.84b)
CO2 (kg/mile) 1.37 1.21 1.53 1.23
Truck weight (kg) 19,550 19,550 21,800 16,800
mpg change %c 31.7% 7.4% 4.0% 2.6%
Natural gas hybrid
CO2 reduction %c 37.7% 23.9% 21.1% 20.1%
a mpg is diesel gallon equivalent consumption; b mpg is CNG gallon consumption (3600 psi); 4 c mpg change % and CO2 reduction % are relative to the conventional diesel (baseline) case. 5
6
TRB 2013 Annual Meeting Paper revised from original submittal.
Z. Gao, T.J. LaClair, C.S. Daw, and D.E. Smith 10
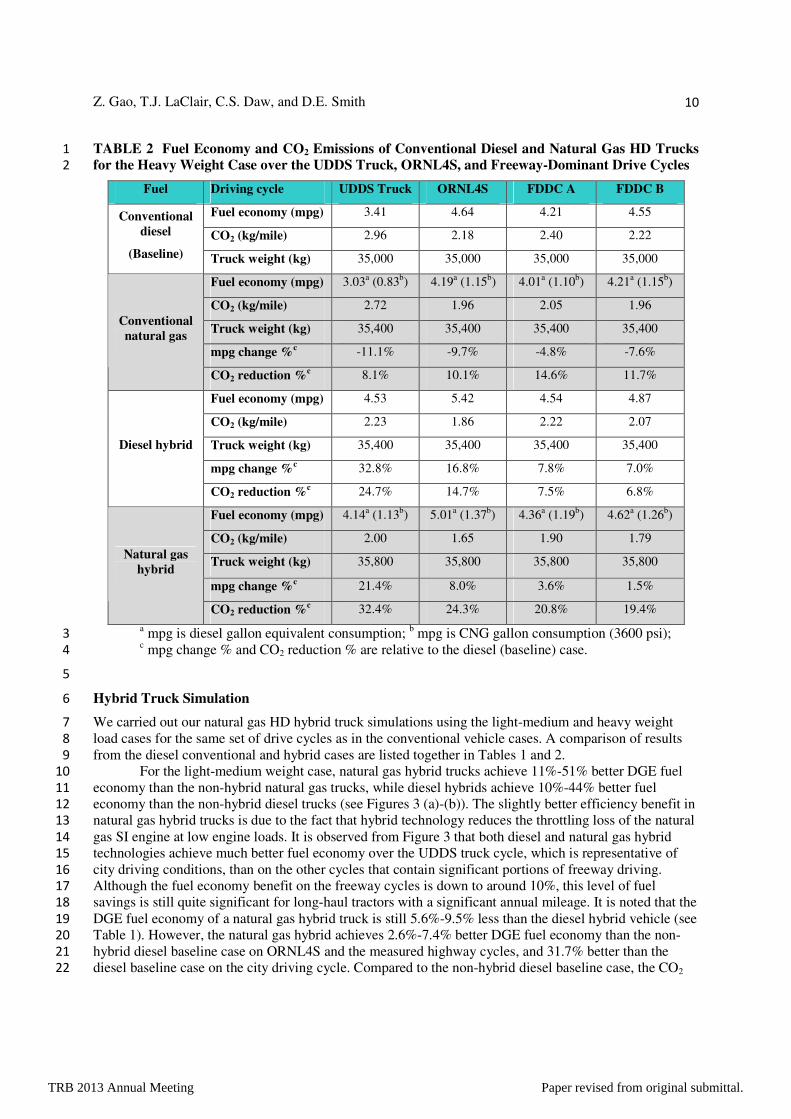
TABLE 2 Fuel Economy and CO2 Emissions of Conventional Diesel and Natural Gas HD Trucks 1
for the Heavy Weight Case over the UDDS Truck, ORNL4S, and Freeway-Dominant Drive Cycles 2
Fuel Driving cycle UDDS Truck ORNL4S FDDC A FDDC B
Fuel economy (mpg) 3.41 4.64 4.21 4.55
CO2 (kg/mile) 2.96 2.18 2.40 2.22
Conventional diesel
(Baseline) Truck weight (kg) 35,000 35,000 35,000 35,000
Fuel economy (mpg) 3.03a (0.83b) 4.19a (1.15b) 4.01a (1.10b) 4.21a (1.15b)
CO2 (kg/mile) 2.72 1.96 2.05 1.96
Truck weight (kg) 35,400 35,400 35,400 35,400
mpg change %c -11.1% -9.7% -4.8% -7.6%
Conventional natural gas
CO2 reduction %c 8.1% 10.1% 14.6% 11.7%
Fuel economy (mpg) 4.53 5.42 4.54 4.87
CO2 (kg/mile) 2.23 1.86 2.22 2.07
Truck weight (kg) 35,400 35,400 35,400 35,400
mpg change %c 32.8% 16.8% 7.8% 7.0%
Diesel hybrid
CO2 reduction %c 24.7% 14.7% 7.5% 6.8%
Fuel economy (mpg) 4.14a (1.13b) 5.01a (1.37b) 4.36a (1.19b) 4.62a (1.26b)
CO2 (kg/mile) 2.00 1.65 1.90 1.79
Truck weight (kg) 35,800 35,800 35,800 35,800
mpg change %c 21.4% 8.0% 3.6% 1.5%
Natural gas hybrid
CO2 reduction %c 32.4% 24.3% 20.8% 19.4%
a mpg is diesel gallon equivalent consumption; b mpg is CNG gallon consumption (3600 psi); 3 c mpg change % and CO2 reduction % are relative to the diesel (baseline) case. 4
5
Hybrid Truck Simulation 6
We carried out our natural gas HD hybrid truck simulations using the light-medium and heavy weight 7
load cases for the same set of drive cycles as in the conventional vehicle cases. A comparison of results 8
from the diesel conventional and hybrid cases are listed together in Tables 1 and 2. 9
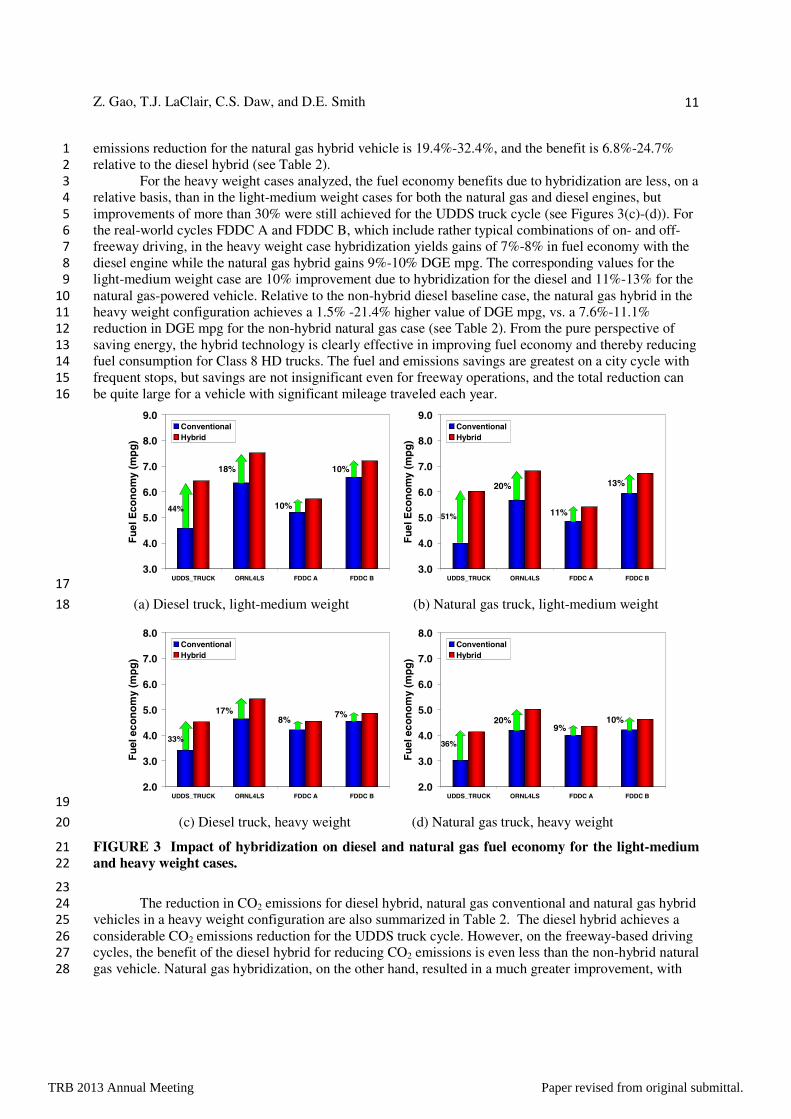
For the light-medium weight case, natural gas hybrid trucks achieve 11%-51% better DGE fuel 10
economy than the non-hybrid natural gas trucks, while diesel hybrids achieve 10%-44% better fuel 11
economy than the non-hybrid diesel trucks (see Figures 3 (a)-(b)). The slightly better efficiency benefit in 12
natural gas hybrid trucks is due to the fact that hybrid technology reduces the throttling loss of the natural 13
gas SI engine at low engine loads. It is observed from Figure 3 that both diesel and natural gas hybrid 14
technologies achieve much better fuel economy over the UDDS truck cycle, which is representative of 15
city driving conditions, than on the other cycles that contain significant portions of freeway driving. 16
Although the fuel economy benefit on the freeway cycles is down to around 10%, this level of fuel 17
savings is still quite significant for long-haul tractors with a significant annual mileage. It is noted that the 18
DGE fuel economy of a natural gas hybrid truck is still 5.6%-9.5% less than the diesel hybrid vehicle (see 19
Table 1). However, the natural gas hybrid achieves 2.6%-7.4% better DGE fuel economy than the non-20
hybrid diesel baseline case on ORNL4S and the measured highway cycles, and 31.7% better than the 21
diesel baseline case on the city driving cycle. Compared to the non-hybrid diesel baseline case, the CO2 22
TRB 2013 Annual Meeting Paper revised from original submittal.
Z. Gao, T.J. LaClair, C.S. Daw, and D.E. Smith 11
emissions reduction for the natural gas hybrid vehicle is 19.4%-32.4%, and the benefit is 6.8%-24.7% 1
relative to the diesel hybrid (see Table 2). 2
For the heavy weight cases analyzed, the fuel economy benefits due to hybridization are less, on a 3
relative basis, than in the light-medium weight cases for both the natural gas and diesel engines, but 4
improvements of more than 30% were still achieved for the UDDS truck cycle (see Figures 3(c)-(d)). For 5
the real-world cycles FDDC A and FDDC B, which include rather typical combinations of on- and off-6
freeway driving, in the heavy weight case hybridization yields gains of 7%-8% in fuel economy with the 7
diesel engine while the natural gas hybrid gains 9%-10% DGE mpg. The corresponding values for the 8
light-medium weight case are 10% improvement due to hybridization for the diesel and 11%-13% for the 9
natural gas-powered vehicle. Relative to the non-hybrid diesel baseline case, the natural gas hybrid in the 10
heavy weight configuration achieves a 1.5% -21.4% higher value of DGE mpg, vs. a 7.6%-11.1% 11
reduction in DGE mpg for the non-hybrid natural gas case (see Table 2). From the pure perspective of 12
saving energy, the hybrid technology is clearly effective in improving fuel economy and thereby reducing 13
fuel consumption for Class 8 HD trucks. The fuel and emissions savings are greatest on a city cycle with 14
frequent stops, but savings are not insignificant even for freeway operations, and the total reduction can 15
be quite large for a vehicle with significant mileage traveled each year. 16
3.0
4.0
5.0
6.0
7.0
8.0
9.0
UDDS_TRUCK ORNL4LS FDDC A FDDC B
Fu
el E
con
om
y (m
pg
)
Conventional Hybrid
44%
18%
10%
10%
3.0
4.0
5.0
6.0
7.0
8.0
9.0
UDDS_TRUCK ORNL4LS FDDC A FDDC B
Fu
el E
con
om
y (m
pg
)
Conventional Hybrid
51%
20%
11%
13%
17
(a) Diesel truck, light-medium weight (b) Natural gas truck, light-medium weight 18
2.0
3.0
4.0
5.0
6.0
7.0
8.0
UDDS_TRUCK ORNL4LS FDDC A FDDC B
Fu
el e
con
om
y (m
pg
)
Conventional Hybrid
33%
17%8%
7%
2.0
3.0
4.0
5.0
6.0
7.0
8.0
UDDS_TRUCK ORNL4LS FDDC A FDDC B
Fu
el e
con
om
y (m
pg
)
Conventional Hybrid
36%
20%9%
10%
19
(c) Diesel truck, heavy weight (d) Natural gas truck, heavy weight 20
FIGURE 3 Impact of hybridization on diesel and natural gas fuel economy for the light-medium 21
and heavy weight cases. 22
23
The reduction in CO2 emissions for diesel hybrid, natural gas conventional and natural gas hybrid 24
vehicles in a heavy weight configuration are also summarized in Table 2. The diesel hybrid achieves a 25
considerable CO2 emissions reduction for the UDDS truck cycle. However, on the freeway-based driving 26
cycles, the benefit of the diesel hybrid for reducing CO2 emissions is even less than the non-hybrid natural 27
gas vehicle. Natural gas hybridization, on the other hand, resulted in a much greater improvement, with 28
TRB 2013 Annual Meeting Paper revised from original submittal.
Z. Gao, T.J. LaClair, C.S. Daw, and D.E. Smith 12
19.4%-32.4% lower CO2 emissions than for the diesel conventional truck and 7.7%-13.3% less than the 1
diesel hybrid truck. 2
These results show that hybrid technology is quite attractive for improving fuel economy not only 3
in city driving conditions, as one would expect, but it is also rather effective for reducing fuel 4
consumption on freeway drive cycles, for which many vehicles generate very significant annual mileages. 5
However, both natural gas technology and vehicle hybridization encumber the user with significant initial 6
costs relative to a conventional diesel HD truck. The up-front cost is a serious concern for any potential 7
customer, and an economic analysis is needed to evaluate the cost benefits of these technologies. 8
9
Economic cost analysis and discussion 10
Class 8 HD trucks can be classified into Class 8A and Class 8B. Class 8A includes dump, refuse, 11
concrete, furniture, and tow trucks, in addition to city buses and fire engines, and a typical mileage driven 12
each year is around 30,000-40,000 miles (29). Class 8B includes tractor trailers, which are frequently 13
driven around 80,000 - 120,000 miles per year. Class 8A trucks typically travel in cities, whereas the 14
Class 8B trucks often run on freeways at nearly constant speeds. In reality, different applications will 15
have differing degrees of urban vs. freeway usage, and a detailed evaluation of drive cycles is needed to 16
accurately determine a characteristic drive cycle. To simplify the analysis we consider the most basic 17
cases. Thus, we chose fuel economies corresponding to the UDDS truck cycle to estimate the fuel costs 18
for Class 8A vehicles, while fuel economies corresponding to the Cycle B drive cycle were used to 19
estimate the fuel costs of Class 8B. We expect this will reasonably reflect the general trend of costs for 20
these two categories of trucks. 21
For Class 8A HD trucks, a 45 DGE natural gas fuel system is assumed since these trucks travel in 22
cities and do not drive significant distances each day. The initial cost for such a system is $45,750 23
according to (26). The initial investment cost of a hybrid system for a Class 8 HD truck (incremental cost 24
relative to a non-hybrid system) is taken to be $60,000. The combined incremental cost of a natural gas 25
hybrid system would therefore be $105,750. Based on these values, Figure 4 compares the payback time 26
and the net vehicle lifespan savings among non-hybrid natural gas, diesel hybrid, and natural gas hybrid 27
trucks for different levels of annual vehicle mileage. The vehicle lifespan considered is 12 years. The fuel 28
economy values corresponding to the UDDS truck cycle listed in Tables 1 and 2 are used in estimating 29
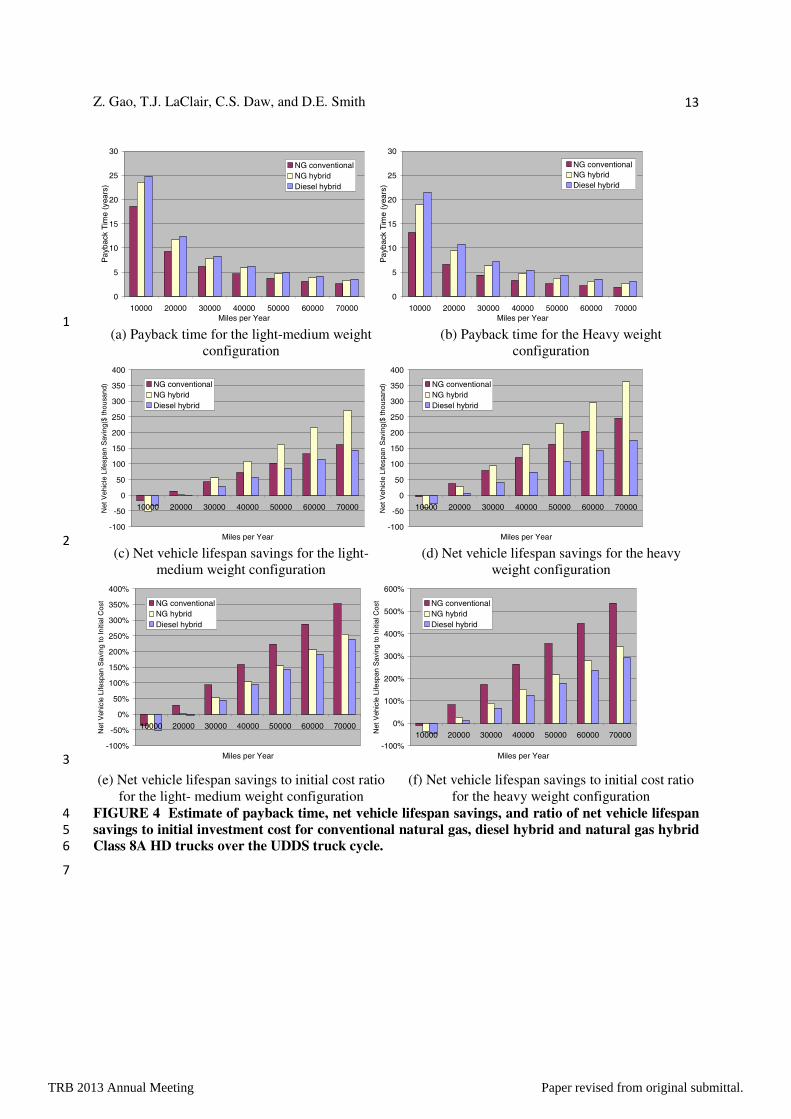
the payback time and net vehicle lifespan savings. It is evident that the payback time and net vehicle 30
lifespan savings are strongly associated with the vehicle mileage traveled annually, with a higher annual 31
mileage leading to a shorter payback time. It is observed that the conventional natural gas truck payback 32
time is the shortest; diesel hybrid payback time is the longest; and the natural gas hybrid has an 33
intermediate payback period. It is also seen that the payback time is reduced for the heavy weight vehicle 34
configuration. For a typical Class 8A HD truck traveling 40,000 miles per year, the payback time for the 35
light-medium weight configuration for the conventional natural gas, natural gas hybrid, and diesel hybrid 36
trucks is 4.64 years, 5.90 years, and 6.19 years, respectively. For the heavy weight configuration, the 37
corresponding payback times are reduced down to 3.30 years, 4.75 years, and 5.36 years, respectively. 38
These results demonstrate that natural gas technology and hybridization both provide an effective means 39
to reduce fuel costs and can quickly reimburse the customer’s initial investment costs for Class 8A trucks. 40
TRB 2013 Annual Meeting Paper revised from original submittal.
Z. Gao, T.J. LaClair, C.S. Daw, and D.E. Smith 13
0
5
10
15
20
25
30
10000 20000 30000 40000 50000 60000 70000Miles per Year
Pay
back
Tim
e (y
ears
)
NG conventionalNG hybridDiesel hybrid
0
5
10
15
20
25
30
10000 20000 30000 40000 50000 60000 70000Miles per Year
Pay
back
Tim
e (y
ears
)
NG conventionalNG hybridDiesel hybrid
1
(a) Payback time for the light-medium weight configuration
(b) Payback time for the Heavy weight configuration
-100
-50
0
50
100
150
200
250
300
350
400
10000 20000 30000 40000 50000 60000 70000
Miles per Year
Net
Veh
icle
Life
span
Sav
ing(
$ th
ousa
nd) NG conventional
NG hybridDiesel hybrid
-100
-50
0
50
100
150
200
250
300
350
400
10000 20000 30000 40000 50000 60000 70000
Miles per Year
Net
Veh
icle
Life
span
Sav
ing(
$ th
ousa
nd) NG conventional
NG hybridDiesel hybrid
2
(c) Net vehicle lifespan savings for the light- medium weight configuration
(d) Net vehicle lifespan savings for the heavy weight configuration
-100%
-50%
0%
50%
100%
150%
200%
250%
300%
350%
400%
10000 20000 30000 40000 50000 60000 70000
Miles per Year
Net
Veh
icle
Life
span
Sav
ing
to In
itial
Cos
t NG conventionalNG hybridDiesel hybrid
-100%
0%
100%
200%
300%
400%
500%
600%
10000 20000 30000 40000 50000 60000 70000
Miles per Year
Net
Veh
icle
Life
span
Sav
ing
to In
itial
Cos
t NG conventionalNG hybridDiesel hybrid
3
(e) Net vehicle lifespan savings to initial cost ratio for the light- medium weight configuration
(f) Net vehicle lifespan savings to initial cost ratio for the heavy weight configuration
FIGURE 4 Estimate of payback time, net vehicle lifespan savings, and ratio of net vehicle lifespan 4
savings to initial investment cost for conventional natural gas, diesel hybrid and natural gas hybrid 5
Class 8A HD trucks over the UDDS truck cycle. 6
7
TRB 2013 Annual Meeting Paper revised from original submittal.
Z. Gao, T.J. LaClair, C.S. Daw, and D.E. Smith 14
0
5
10
15
20
25
30
40000 60000 80000 100000 120000 140000 160000Miles per Year
Pay
back
Tim
e (y
ears
)
NG conventionalNG hybridDiesel hybrid
0
5
10
15
20
25
30
40000 60000 80000 100000 120000 140000 160000Miles per Year
Pay
back
Tim
e (y
ears
)
NG conventionalNG hybridDiesel hybrid
1
(a) Payback time for the light-medium weight configuration
(b) Payback time for the Heavy weight configuration
-100
-50
0
50
100
150
200
250
300
350
400
40000 60000 80000 100000 120000 140000 160000
Miles per Year
Net
Veh
icle
Life
span
Sav
ing(
$ th
ousa
nd) NG conventional
NG hybridDiesel hybrid
-100
0
100
200
300
400
500
40000 60000 80000 100000 120000 140000 160000
Miles per Year
Net
Veh
icle
Life
span
Sav
ing(
$ th
ousa
nd) NG conventional
NG hybridDiesel hybrid
2
(c) Net vehicle lifespan savings for the light- medium weight configuration
(d) Net vehicle lifespan savings for the heavy weight configuration
-100%
-50%
0%
50%
100%
150%
200%
250%
300%
350%
40000 60000 80000 100000 120000 140000 160000
Miles per Year
Net
Veh
icle
Life
span
Sav
ing
to In
itial
Cos
t NG conventionalNG hybridDiesel hybrid
-100%
0%
100%
200%
300%
400%
500%
600%
40000 60000 80000 100000 120000 140000 160000
Miles per Year
Net
Veh
icle
Life
span
Sav
ing
to In
itial
Cos
t NG conventionalNG hybridDiesel hybrid
3
(e) Net vehicle lifespan savings to initial cost ratio for the light- medium weight configuration
(f) Net vehicle lifespan savings to initial cost ratio for the heavy weight configuration
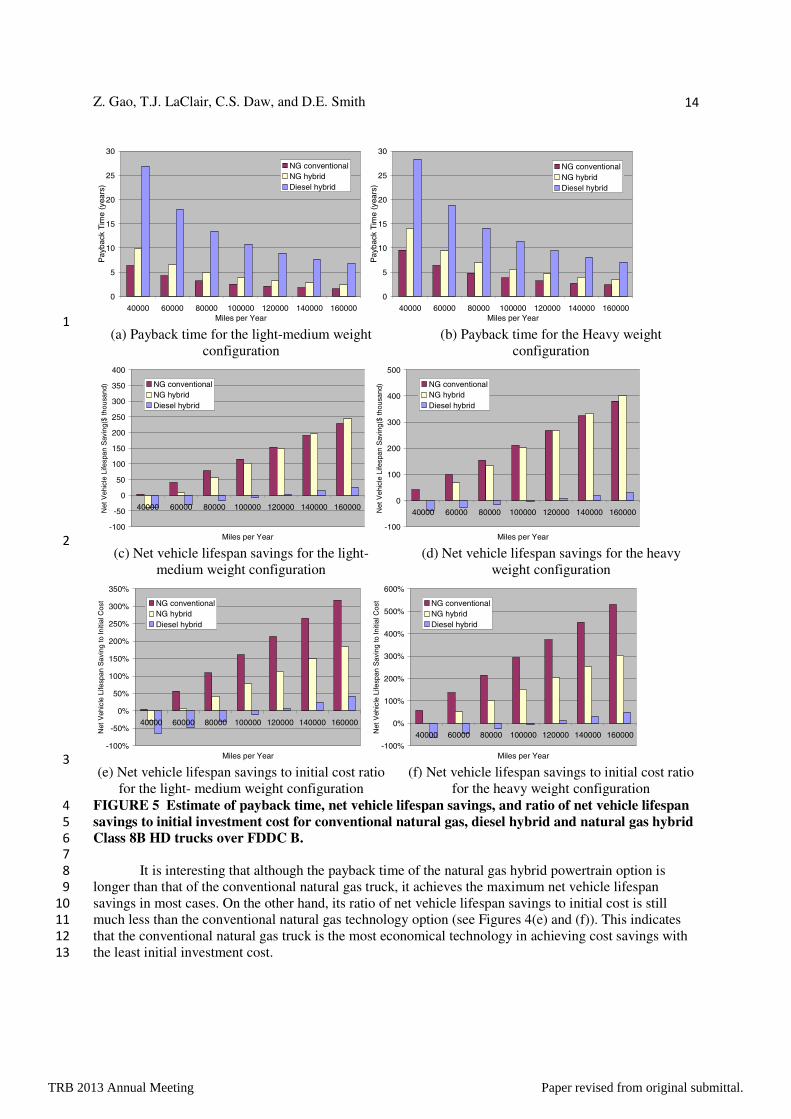
FIGURE 5 Estimate of payback time, net vehicle lifespan savings, and ratio of net vehicle lifespan 4
savings to initial investment cost for conventional natural gas, diesel hybrid and natural gas hybrid 5
Class 8B HD trucks over FDDC B. 6
7
It is interesting that although the payback time of the natural gas hybrid powertrain option is 8
longer than that of the conventional natural gas truck, it achieves the maximum net vehicle lifespan 9
savings in most cases. On the other hand, its ratio of net vehicle lifespan savings to initial cost is still 10
much less than the conventional natural gas technology option (see Figures 4(e) and (f)). This indicates 11
that the conventional natural gas truck is the most economical technology in achieving cost savings with 12
the least initial investment cost. 13
TRB 2013 Annual Meeting Paper revised from original submittal.
Z. Gao, T.J. LaClair, C.S. Daw, and D.E. Smith 15
For Class 8B HD trucks, a 120 DGE natural gas fueling system was considered because these 1
trucks normally travel for long distances each day on freeways and a severely limited range would not be 2
acceptable for this application. The estimated installation cost for a 120 DGE natural gas fuel system is 3
$72,000 (26). Since the incremental cost of the hybrid propulsion system is $60,000, the combined 4
incremental cost of the natural gas hybrid configuration becomes $132,000, while the incremental costs of 5
the diesel hybrid and natural gas conventional configurations are $60,000 and $72,000, respectively. 6
Figure 5 compares the payback time and net vehicle lifespan savings for the class 8B case. The prices of 7
diesel and natural gas DGE used here are the same as above. The Class 8B truck lifespan considered here 8
is 10 years, while the truck total lifespan mileage is taken to be 1 million miles. The truck fuel economy 9
values corresponding to FDDC B, listed in Tables 2-3, are used in estimating the payback time and cost 10
savings. If a Class 8B HD truck travels 100,000 miles per year, the payback time of the natural gas 11
conventional configuration is only around 2.54 years for the heavy weight case and 3.96 years for the 12
light-medium weight case. For the natural gas hybrid vehicle configuration, the payback period is 3.54 13
years for the heavy weight case and 5.62 years for the light-medium weight case (See Figures 5(a) and 14
(b)). Unfortunately, the payback time for the diesel hybrid option is greater than 10 years, which is close 15
to the truck lifespan. Based on the assumptions used in this analysis, it is not economically justified for 16
customers to pursue this option, although rising diesel costs and decreasing incremental costs of the 17
hybrid system could change this situation in the future. Figures 5(c)-(d) show that the net vehicle lifespan 18
savings for the conventional natural gas and natural gas hybrid are very close to each other. This indicates 19
again that the impact of Class 8B HD truck hybrid technology on cost saving is rather limited after 20
considering its initial incremental cost, even though the fuel savings from hybrid technology is 21
significant. 22
Given that there are concerns over natural gas price stability, it is appropriate to briefly discuss 23
the impact of using natural gas as a fuel for HD vehicles on natural gas demand. Historically the U.S. 24
transportation sector has used very little natural gas (1). However, increased natural gas use in 25
transportation could make an important contribution toward achieving oil independence and utilizing the 26
significant natural gas production increases (from 20.6 TCF in 2010 to 27.9 TCF in 2035) that are 27
currently projected (9). According to the ORNL Transportation Energy Data Book (1), heavy trucks were 28
responsible for fuel consumption corresponding to 6,151 trillion BTU in 2010. Class 8 trucks (primarily 29
long-haul combination vehicles) represent more than 60% of all truck fuel consumption, i.e. long-haul 30
vehicles use about 3600 trillion BTU annually. If 10% of Class 8 trucks converted to a natural gas power 31
system, the corresponding consumption would be about 360 trillion BTU, which corresponds to about 32
0.35 TCF of natural gas (standard conditions with 1012 BTU/ft3 heating value at 14.73 psia and 20°C). 33
This is only about 1% of the expected natural gas production in 2035. One would not expect this level of 34
additional demand, by itself, to significantly influence natural gas prices, and with the projected increase 35
in natural gas production, there is a need to identify additional uses for this domestically produced fuel 36
supply. 37
38
CONCLUSION 39
Our Class 8 HD truck simulation results indicate that the fuel economy and engine efficiency of natural 40
gas trucks are less than for conventional diesel-powered trucks of comparable size and configuration. 41
However, natural gas engines can achieve lower CO2 emissions due to the lower carbon fraction in the 42
fuel. The simulated reduction in CO2 emissions was less than expected due to the lower combustion 43
efficiency of the natural gas spark ignition engine. This result highlights the need to further develop and 44
utilize innovative natural gas combustion technologies that will improve fuel efficiency and CO2 45
emissions. In spite of the lower fuel economy for a natural gas-powered truck, the fuel’s lower cost makes 46
the natural gas technology economically favorable to diesel when annual mileage is at least 40,000 miles. 47
Both diesel and natural gas hybrid technologies are able to reduce fuel consumption for both city 48
and freeway driving conditions. Application of hybrid technologies was estimated to provide a 40%-50% 49
reduction in fuel consumption in city driving. Although the fuel economy benefit of hybridization was 50
TRB 2013 Annual Meeting Paper revised from original submittal.
Z. Gao, T.J. LaClair, C.S. Daw, and D.E. Smith 16
found to be no more than 10% on freeway drive cycles, the fuel savings can nevertheless be considerable 1
for Class 8 vehicles that travel more than 100,000 miles annually. 2
When considering cost savings, the story is rather different. Predicted lifetime cost savings 3
depend strongly on the truck’s application. For predominantly city driving, e.g. Class 8A trucks, a non-4
hybrid natural gas powertrain configuration provides the shortest payback time, with no more than five 5
years payback when the annual vehicle mileage is 40,000 miles or more. The payback time for diesel 6
hybrid and natural gas hybrid technologies for the same category of trucks was estimated to be around six 7
years. 8
For HD trucks engaged primarily in freeway-dominant driving, such as Class 8B long-haul 9
combination vehicles traveling 100,000 miles or more per year, the natural gas conventional powertrain 10
still gave the shortest payback time, at 2.5-3.9 years. Surprisingly, the payback time for natural gas hybrid 11
technology was estimated to be only 4.0-5.6 years for this vehicle category. On the other hand, it would 12
require nearly ten years to recover the initial hybridization cost for a typical diesel class 8B vehicle in 13
long-haul usage. This result implies that hybridization of diesel-powered long-haul trucks may not be the 14
optimal choice in the current unstable economic environment. Nonetheless, future changes in diesel fuel 15
or natural gas costs and/or reductions in hybridization costs could significantly change the economic 16
outlook. 17
In summary, our analysis reveals that fuel economy and costs are likely to act as opposing factors 18
in the utilization of hybridization in HD Class 8 trucks. As long as the price differential between natural 19
gas and diesel fuel remains at its current level, economics may tend to favor conventional (non-hybrid) 20
natural gas powered trucks, even though hybridization of both diesel and natural gas trucks offers longer-21
term reductions in emissions and fuel consumption. 22
23
24
ACKNOWLEDGEMENTS 25
This project was sponsored by US. Department of Energy’s Office of Vehicle Technologies and 26
Department of Transportation. The authors would also like to recognize J. Dong, C. Liu, O. Franzese, S. 27
Das, and S.C. Davis for their assistance and suggestions. 28
Notice: This submission was sponsored by a contractor of the United States Government under 29
contract DE-AC05-00OR22725 with the United States Department of Energy. The United States 30
Government retains, and the publisher, by accepting this submission for publication, acknowledges that 31
the United States Government retains, a nonexclusive, paid-up, irrevocable, worldwide license to publish 32
or reproduce the published form of this submission, or allow others to do so, for United States 33
Government purposes. 34
35
REFERENCE 36
1. Davis, S.C., S.W. Diegel, and R.G. Boundy. Transportation Energy Data Book, 30th ed. Publication 37
ORNL-6986. Oak Ridge national laboratory, Oak Ridge, Tenn., 2011. 38
2. Wang, M.Q., and H.-S. Huang. A Full Fuel-Cycle Analysis of Energy and Emissions Impacts of 39
Transportation Fuels Produced from Natural Gas. Publication ANL/ESD-40, Argonne National 40
Laboratory, Argonne, Ill., 1999. 41
3. McCormick, R., M. Graboski, T. Alleman, A. Herring, P. Nelson. In-Use Emissions from Natural 42
Gas Fueled Heavy-Duty Vehicles. SAE Technical Paper 1999-01-1507, 1999. 43
4. Clark, N., W. Wayne, A. Khan, D. Lyons, M. Gautam, D. Mckain, G. Thompson, and R. Barnett. 44
Effects of Average Driving Cycle Speed on Lean-Burn Natural Gas Bus Emissions and Fuel 45
Economy. SAE Technical Paper 2007-01-0054, 2007. 46
TRB 2013 Annual Meeting Paper revised from original submittal.
Z. Gao, T.J. LaClair, C.S. Daw, and D.E. Smith 17
5. Frailey, M., P. Norton, N. Clark, and D. Lyons. An Evaluation of Natural Gas versus Diesel in 1
Medium-Duty Buses. SAE Technical Paper 2000-01-2822, 2000. 2
6. Kamel, M., E. Lyford-Pike, M. Frailey, M. Bolin, N. Clark, R. Nine, and S. Wayne. An Emission 3
and Performance Comparison of the Natural Gas Cummins Westport Inc. C-Gas Plus versus Diesel 4
in Heavy-Duty Trucks. SAE Technical Paper 2002-01-2737, 2002. 5
7. Wellkamp, N., and D.J. Weiss. American Fuel: Developing Natural Gas for Heavy Vehicles. Center 6
for American Progress, http://www.americanprogress.org/issues/2010/04/american_fuel.html. 7
Accessed July 15, 2012. 8
8. Hirsch, R., R. Bezdek, and R. Wendling. Peaking of World Oil Production: Impacts, Mitigation & 9
Risk Management. http://www.netl.doe.gov/publications/others/pdf/oil_peaking_netl.pdf. Accessed 10
July 15, 2012. 11
9. U.S. Energy Information Administration. Annual Energy Outlook 2012 Early Release Reference 12
Case. http://media.sais-jhu.edu/archive/sites/default/files/event-files/howard_01232012.pdf. 13
Accessed July 15, 2012. 14
10. U.S. Energy Information Administration. Natural Gas Consumption by End Use. 15
http://www.eia.gov/dnav/ng/ng_cons_sum_dcu_nus_m.htm. Accessed July 15, 2012. 16
11. Suga, T., B. Knight, and S. Arai. Near-Zero Emissions Natural Gas Vehicle, Honda Civic GX. SAE 17
Technical Paper 972643, 1997. 18
12. Kato, K., K. Igarashi, M. Masuda, K. Otsubo, A. Yasuda, and T. Sato. Development of Engine for 19
Natural Gas Vehicle. SAE Technical Paper 1999-01-0574, 1999. 20
13. Vermiglio, E., T. Jenkins, M. Kieliszewski, J. Lapetz, B. Povinger, R. Willey, J. Herber, K. 21
Sahutske, M. Blue, and R. Clark. Ford's SULEV dedicated natural gas trucks, SAE Technical Paper 22
971662, 1997. 23
14. Boland, D. Optimization of a CNG Driven SI Engine Within a Parallel Hybrid Powertrain by Using 24
EGR and an Oversized Turbocharger with Active-WG Control. SAE Technical Paper 2010-01-0820, 25
2010. 26
15. Volvo Trucks United States. Volvo Trucks Details Comprehensive “Blue Power” Natural Gas 27
Strategy for North America. http://www.volvotrucks.com/trucks/na/en-28
us/news_and_events/news_releases/_layouts/CWP.Internet.VolvoCom/NewsItem.aspx?News.ItemId29
=123985&News.Language=en-gb. Accessed July 15, 2012. 30
16. Addy, J., A. Bining, P. Norton, E. Peterson, K. Campbell, and O. Bevillaque. Demonstration of 31
Caterpillar C10 Dual Fuel Natural Gas Engines in Commuter Buses. SAE Technical Paper 2000-01-32
1386, 2000. 33
17. Bassi, A. Liquefied Natural Gas (LNG) as Fuel for Road Heavy Duty Vehicles Technologies and 34
Standardization. SAE Technical Paper 2011-24-0122, 2011. 35
18. Mills, K. Westport ISX G overview. Presented at Natural Gas Vehicle Technology Forum, Downey, 36
Cali., November, 2008. 37
19. Beaver, K. Hybrid Refuse Collection Vehicles: Market Analysis and Forecasts –From the Hauler’s 38
Perspective. Environmental Solution Group, Chattanooga, Tenn., May, 2012. 39
20. Murphy, P. Natural Gas as a Vehicle Transportation Fuel. 40
http://www.jbs.cam.ac.uk/programmes/mphil_techpol/consortium/downloads/murphy_gas.pdf. 41
Accessed July 15, 2012. 42
TRB 2013 Annual Meeting Paper revised from original submittal.
Z. Gao, T.J. LaClair, C.S. Daw, and D.E. Smith 18
21. U.S. Energy Information Administration. Energy Prices by Sector and Source, AEO2012 early 1
release overview. http://www.eia.gov/forecasts/aeo/er/tables_ref.cfm. Accessed July 15, 2012. 2
22. Gao, Z., J.C. Conklin, C.S. Daw, and V.K. Chakravarthy. A Proposed Methodology for Estimating 3
Transient Engine-out Temperature and Emissions from Steady-State Maps. International Journal of 4
Engine Research, Vol. 11, 2010, pp.137-151. 5
23. Argonne National Laboratory. Autonomie, http://www.autonomie.net. Accessed July 15, 2012. 6
24. Karbowski, D., A. Delorme, and A. Rousseau. Modeling the Hybridization of a Class 8 Line-Haul 7
Truck. SAE Technical Paper 2010-01-1931, 2010. 8
25. Capps, G., O. Franzese, B. Knee, M.B. Lascurain, and P. Otaduy, Class-8 Heavy Truck Duty Cycle 9
Project Final Report. Publication ORNL/TM-2008/122, Oak Ridge national laboratory, Oak Ridge, 10
Tenn., 2008. 11
26. U.S. Energy Information Administration. Transportation from Market Trends. 12
http://www.eia.gov/forecasts/aeo/sector_transportation_all.cfm#heavynatgas. Accessed July 15, 13
2012. 14
27. Than, K. Trucks Could Be Next Electric Power Frontier. 15
http://news.nationalgeographic.com/news/2010/06/100606-energy-trucks-hybrid-electric. Accessed 16
July 15, 2012. 17
28. U.S. Department of Energy. Clean Cities Alternative Fuel Price Report. 18
http://www.afdc.energy.gov/pdfs/afpr_jan_12.pdf. Accessed July 15, 2012. 19
29. Union of Concerned Scientist. Benefits of Greener Trucks and Buses. 20
http://www.ucsusa.org/assets/documents/clean_vehicles/rs_ch4.pdf. Accessed July 15, 2012. 21
TRB 2013 Annual Meeting Paper revised from original submittal.