Embed Size (px)
Citation preview

Water Conservation and Resources
Efficiency in Industries
Energy Audits in Industry- exploiting the
opportunity-best practices and international
experience
Savvas Louizidis - Head of Energy Unit
23/1/2019
CONTENTS
1. INTRODUCTION-LEGAL CONTEXT
2. ENERGY AUDIT STEPS – GOOD PRACTICES
3. EXAMPLES-OPPORTUNITIES FOR EE
4. INTERNATIONAL EXPERIENCE
2

3

▪ Industry: historically a major energy consumer
▪ In EU accounted for 28% of FEC
▪ Trends in improvement of energy intensity
▪ About 2% per year in European industries
▪ BUT there is substantial unexploited potential
4
1.1 Unexploited potential for industrial EE
Source: ABB, Trends in global energy efficiency 2011, An analysis of industry and utilities
Source: IEA, Tracking Clean Energy Progress, 2015Obstacles for exploitation
4
Source: JRC, 2017

• technically simple
• no and low costmeasures
• complicatedapplications
• medium & highcost measures
• system audits• capital intensive
projects
Preliminary
energy audit
Detailed
energy auditMonitoring audit
(follow up)
Formulation / Revision of investment plan5
1.2 Definition-standards
Standards
• ISO 50002
• EN 16247-1: General Requirements
• EN 16247-2: Buildings
• EN 16247-3: Industrial Processes
• EN 16247-4: Transport
• EN 16247-5: Energy Auditors qualifications
Energy audit ...
“A systematic procedure with the purpose of obtaining adequate knowledge of the existing energy consumption profile of a building or group of buildings, an industrial or commercial operation or installation or a private or public service, identifying and quantifying cost-effective energy savings opportunities, and reporting the findings”, Directive 27/2012/EU
5

6
1.3 Mandatory requirement-Legal context
DIRECTIVE 27/2012/EC
Member States (MS) shall: o promote the availability to all final customers of high quality energy audits which are cost-
effective and either carried out in an independent manner by qualified and/or accredited experts according to qualification criteria; or implemented and supervised by independent authorities under national legislation
o establish transparent and non-discriminatory minimum criteria for energy audits (to guarantee their quality)
o develop programmes to encourage SMEs to undergo energy audits and the subsequent implementation of the recommendations from these audits
o may set up support schemes for SMEs, including if they have concluded voluntary agreements, to cover costs of an energy audit and of the implementation of highly cost-effective recommendations from the energy audits, if the proposed measures are implemented
o MS shall ensure that enterprises that are not SMEs are subject to an energy audit by …… and at least every four years from the date of the previous energy audit
6

7

Step 1. Preparation-data collection
Step 2. Walk-through visit
Step 3. Analysis of energy data
Step 4- Measurements
Step 5. Data analysis
Step 6. Report
Initial meeting
Initial visit
Data collection
Preliminary analysis
Measurements
Detailed analysis
EE proposals
Financial analysis
Reporting
Presentation
Final reportComments
2.1 Energy Audit steps
8

2.2 Energy Audit report
Chapter ContentsExecutive Summary • Procedures followed
• Key figures on baseline• List of all measures and outlook of techno-economic results• Recommended action plan.
CHAPTER 1 Introduction- Site description
• Brief outlook of installations• Description processes-buildings• Description of utilities• Raw materials-products-waste• Energy management, monitoring and accounting procedures followed - current sub-
metering practices
CHAPTER 2
Current energy consumption-performance
• Fuel supply and Electricity supply• Electrical and thermal energy usage• Other resources utilisation• Detailed presentation of on site measurements and analysis
Chapter3
Energy efficiency assessment -benchmarking
• Allocation of energy to ECC-energy balances• Baseline energy consumption• Specific energy consumption per product unit or other key parameter• Comparison with international (benchmarking)• CUSUM analysis if data is available .
Example-A1
9

2.2 Energy Audit report
Chapter ContentsCHAPTER 4
EE proposals
• Technical description• Estimation of CAPEX, OPEX• Calculation of energy savings and other resource savings• Calculation of GHG emissions reduction• Financial savings
CHAPTER 5
Proposals for processimprovement
• Possibilities for improvement in the processes that can result to:• Process optimization• Raw material savings• Increase in quality of production• Modernization of production procedures• Improvement of regular operation and management
CHAPTER 6
Financial analysis
▪ Assumptions (tariffs, discount rate etc)▪ Lifecycle costs per measure▪ Cash-flow analysis▪ Extraction of financial indicators (IRR and NPV)▪ Risk-sensitivity analysis
CHAPTER 7
Conclusions
▪ Key findings report▪ Proposal of financially viable improvements▪ Follow up- action plan
Annexes - Measurement data- Technical calculation data sheets- Financial analysis flow sheets etc.
10

2.3 Minimum criteria for an audit
Demand Addressing
Be based on up-to-date, measured,traceable operational data on energyconsumption
• Methodology for systematic collection of primaryinformation.
• Targeted measurements for the acquisition ofintegrated and reliable data needed for energy balances
Comprise a detailed review of theenergy consumption profile ofbuildings or groups of buildings,industrial operations or installations,including transportation
• Analysis at discrete Energy Cost Centres to be definedat early stage.
Build, whenever possible, on life-cyclecost analysis (LCCA) instead of SimplePayback Periods (SPP)
• Analytical approach and calculation of O&M costs of eachaction
• Tools for financial viability analysis
• Risk and sensitivity analysis .
Be proportionate, and sufficientlyrepresentative to permit the drawingof a reliable picture of overall energyperformance and the reliableidentification of the most significantopportunities for improvement.
• Transparent criteria for selection of targeted objects
• Determine relationship of energy vs critical parameters(production etc), interactive effects
11

12
2.4 Good practices-analysis
Detailed- Allocation of energy use
Detailed - Correlation of energy with critical parameters
Representative periods
Representative – appropriate baseline consumption

2.5 Good practices-justificationDetailed: Benchmarking
13
Measured: Justification of need-scope
34.6°C
139.4°CSP01
SP02
SP03
SP04
SP05SP06
SP07
SP08
SP09
SP10
EE proposals:
1. Clear and analytical, with technical evidence
Example-A2
37oC
34-37oC
20-25oC
28oC
28-32oC
38oC
Direct Heat Exchange
HEAT PUMP
T40 A/B
To Heat Pumpe
Raw waste water

14
2.6 Good practices-measures
4. Financial analysis :based on LCCA
Example-A3
Example-A4
5. Assess Risks: conduct Sensitivity analysis
14
3. Put focus on processes2. Target on no/low cost measures

15

Low payback measures
16
3.1 Examples of BATs
Measure Energy savingpotential until
2030
Integrated control systems 17.3%
Sub-metering 13.8%
Flue gas monitoring (boilers-furnaces) 8.3%
High Efficiency burners (furnaces) 8.1%
Flue gas heat recovery 5%
Combustion optimisation (furnace) 3.8%
Steam trap optimisation 1.9%
Preventive furnace maintenance 1.6%Source: ICF, 2015 [3]
16

Sources of waste heat
17
Area Waste heat source Utilisation
Boilers Flue gas EconomisersPreheat combustion air
Boilers BlowdownCondensate
Preheat boiler feedwater
Refrigeration Waste heat from Condenser
High grade heat from de-superheaterLow-grade heat recovery from condenser
Ventilation systems
Exhaust air Heat wheelRun-around coil Heat pipesHeat pumps
Industrial processes
Heating at industrial processes Drying Heat stored in productsetc.
Low temperature waste heat High temperature waste heat
RESULTS
Heat use before=22772 MWh/yHeat used after = 9678 MWh/yGas savings = 261885 EUR/y
CAPEX: = 500,000 EURAuxiliaries: = 125,000 EUR
Simple Payback = 2.4 years
Example: HR in ventilation in agribusiness
3.2 Example: Heat recovery
17

Concept: adiabatic evaporative pre-cooling system- Cooling the incoming air without increasing its humidity ratio- Sprays fine water mist to cool intake air- Instant evaporation without touching the condenser - Intake air reduces between 10-20°C through this process- Increased efficiency (>20%) and cooling capacity- Minimal water consumption
18
RESULTS
Energy use before = 1,210 MWh/yEnergy used after = 995 MWh/ySavings = 18,000 EUR/yEnergy Savings: = 18% or 56 kWh/tn
CAPEX: = 36,000 EURSimple Payback = 2 years
3.3 Example: Smart Cooling
18
Example: Adiabatic Cooling in pharmaceutical industry (TRANE RTAC 200 HE)
Source: Smart Cooling

3.4 Example: Ice Storage
Concept: adiabatic evaporative pre-cooling system- Ice-making mode: Stores heat during nighttime by using off-peak electricity- Ice-melting mode: Produces chilled water during daytime replacing chiller's output- Viable when used with multiple tariff
RESULTS
Energy use before = 1,399 MWh/yEnergy used after = 761 MWh/ySavings = 19,263 EUR/y
CAPEX: = 87,000 EUR
Simple Payback = 4.5 years
19
Source: Calmac
Example: Ice Storage in chocolate manufacturing industry
0
200
400
600
800
1,000
1,200
1,400
Po
wer
Dem
and
, kW
Cooling Design Day - Energy Demand Profile
Period tariff
(€/kWh)
Demand
(kW)
Chiller Use for
Cooling
(kW)
Ice Storage
System
Discarge
(contribution)
Charging
Power
(kW)
Storage
System Mode
Charge/Discharge
(%)
1:00 0.088 466 466 0 253 Charging 19%
2:00 0.088 466 466 0 253 Charging 33%
3:00 0.088 453 453 0 253 Charging 46%
4:00 0.088 426 426 0 253 Charging 60%
5:00 0.088 453 453 0 253 Charging 73%
6:00 0.088 453 453 0 253 Charging 87%
7:00 0.088 480 480 0 253 Charging 100%
8:00 0.099 520 520 0 0 StandBy 100%
9:00 0.099 546 546 0 0 StandBy 100%
10:00 0.099 626 626 0 0 StandBy 100%
11:00 0.099 813 813 0 0 StandBy 100%
12:00 0.099 959 879 80 0 Discharging 96%
13:00 0.099 1066 879 187 0 Discharging 87%
14:00 0.099 1146 879 266 0 Discharging 75%
15:00 0.099 1199 879 320 0 Discharging 60%
16:00 0.099 1239 879 360 0 Discharging 43%
17:00 0.099 1199 879 320 0 Discharging 28%
18:00 0.099 1159 879 280 0 Discharging 15%
19:00 0.099 1052 879 173 0 Discharging 7%
20:00 0.099 919 879 40 0 Discharging 5%
21:00 0.099 733 733 0 0 StandBy 5%
22:00 0.099 653 653 0 0 StandBy 5%
23:00 0.099 546 546 0 0 StandBy 5%
0:00 0.088 493 493 0 253 Charging 5%

3.5 Example: Insulation
20
Surface heat losses: must be < 2% of heat input at maximum boiler capacityCan reach 10% if insulation is in poor condition
RESULTS
Savings > 5% of thermalenergy useCAPEX: <0.1 EUR/kWh savedPayback: < 1 year
20

3.6 EE measures key results
21

3.7 EE measures key results
22

3.7 Energy maturity sequence
23

24
4. International experience

25
Source: Ricardo, Article 8 of EED; challenges for
large enterprises, 2016
4.1 Energy audits in EU-key facts
Size of obliged companies
25
Number of obliged companies
Independent non SME
a) have more than 250 employees ORb) less than 250 employees but annual turnover exceeds 50 MEUR and balance sheet exceeds 43 MEUR
Exemption Companies that implement certifiedsystems for energy and environmental management, certified by an independent body
- 26
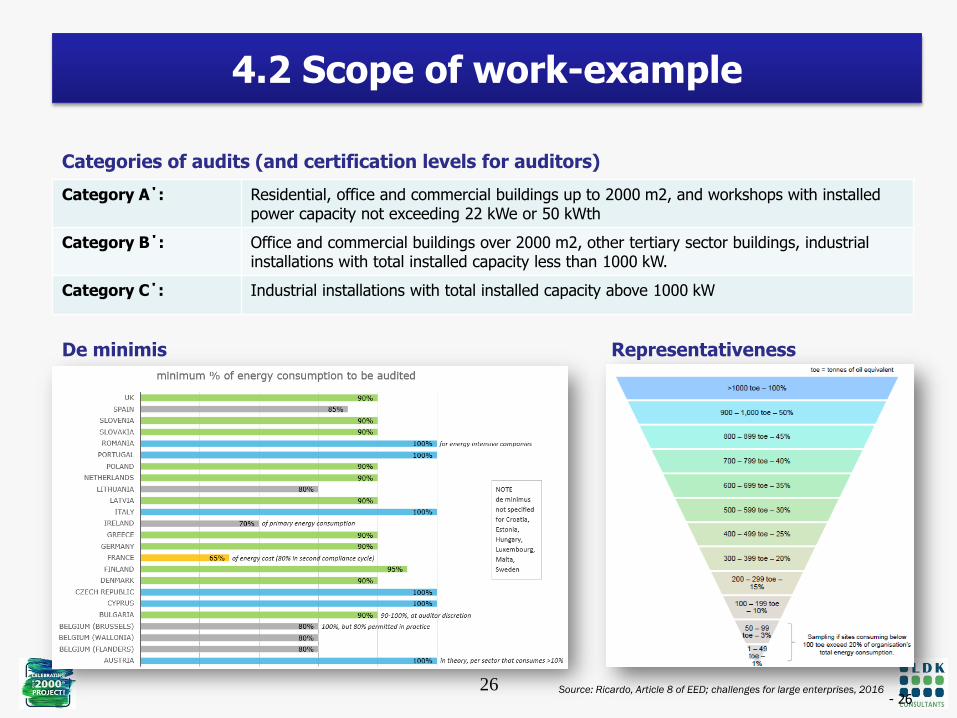
4.2 Scope of work-example
Category Α΄: Residential, office and commercial buildings up to 2000 m2, and workshops with installed power capacity not exceeding 22 kWe or 50 kWth
Category Β΄: Office and commercial buildings over 2000 m2, other tertiary sector buildings, industrial installations with total installed capacity less than 1000 kW.
Category C΄: Industrial installations with total installed capacity above 1000 kW
Categories of audits (and certification levels for auditors)
26
Representativeness
Source: Ricardo, Article 8 of EED; challenges for large enterprises, 2016
De minimis

4.3 Identified-implemented energy savings
Source: Ricardo, 2018
27
Realized energy savings (D)Identified energy savings
Source: https://deep.eefig.eu/viewcharts/industry/

4.4 ISO 50001
28
Main elements
Energy Management is a systematic approach to the continuous setting, implementation and monitoring of energyperformance of a company/organization, aiming to reduce energy consumption, along with assuring thesustainability of results in the long-term..!!!ISO 50001: ISO standard that specifies requirements for establishing, implementing, maintaining and improving an energy management system.
Aim of energy management
Production
Ene
rgy
cons
umpt
ion
Energy consumptionwithout energymanagement
Energy consumptionwith energymanagement
Key area Main issues
Policy Energy management policy statement
Planning Significant energy systems identified and reviewed Measurable energy objectives and targets set Programme with responsibilities and time frame defined
Implementation and operation
Roles and responsibilities: Energy manager/energy team with job description appointed Training and Awareness: personnel associated with energy are familiar with EE and EM programme Communication: Information on energy performance communicated to employees Documentation and control of documents Operational control: instructions on equipment operation, consideration of EE in procurement of equipment and services
Checking-Monitoring
Energy use and costs being monitored and reported Progress against plan being monitored Control of records-non conformity assessment Internal audit regularly performed
Review Effectiveness of EMS reviewed by top management

Energy policy
Energy planning
Implementation & operation
Checking
Monitoring, measurement and analysis
Nonconformities, correction, corrective
and preventive action
Internal audits of EnMS
Management review
Continual improvement
Energy planning-legal
-energy Review-energy Baseline
-EnPI's-objectives, targets, action plans
-communications Plan-training Plan- set-up EMIS
Implementation & operation
-competency, training & awareness
-communications-documentation
-operational Control-design
-procurement
Checking-monitoring,
measurement & analysis-legal & other requirements-internal audit
-non-conformities-control of records
EnMS systemEnergy PolicyISO Standard
EnMS Manual & Procedures
Management review- inputs
- outputs
System Diagram, including the ISO 50001 Standard elements
M & T
Plan-Do-Check-Act Model
4.5 ISO 50001
29

4.6 ISO 50001
30
Target setting
SN Phase Responsible Approval Implementation timing
1. Programming of energy audit Energy Manager General Management
From the start of the EM plan and every 3 years or
when there is process/equipment
replacement
2. Implementation of energy audit
Supervision: O&M Manager
(if implemented internally then energy audit is also under the
O&M)
From the start of the EM plan and every 3 years or
when there is process/equipment
replacement
3.Definition of significant energy
uses (SEUs) and Energy Performance indicators (EnPIs)
Ο&Μ Manager Energy Manager After every energy audit
4.Definition of Objectives, Targets
και Action PlansEnergy Manager / EM
Unit General Management
After every energy audit and after every Management
Review
5.Filing and maintaining of energy
audits, methods and criteria used
H&S Manager After every energy audit
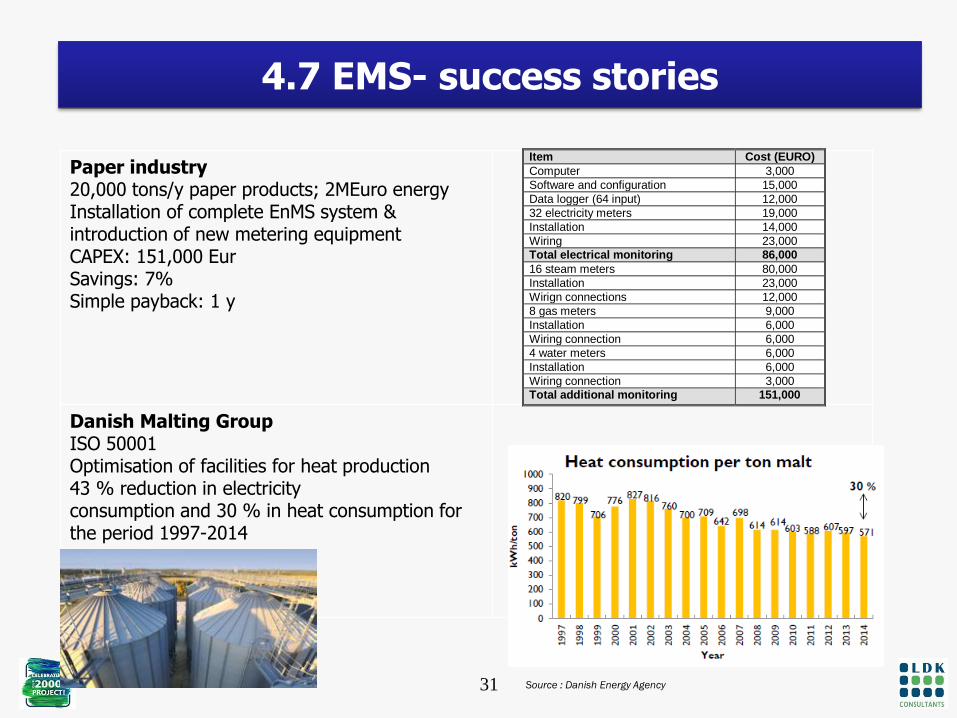
4.7 EMS- success stories
31
Paper industry 20,000 tons/y paper products; 2MEuro energyInstallation of complete EnMS system & introduction of new metering equipmentCAPEX: 151,000 EurSavings: 7%Simple payback: 1 y
Danish Malting Group ISO 50001Optimisation of facilities for heat production 43 % reduction in electricityconsumption and 30 % in heat consumption forthe period 1997-2014
Item Cost (EURO)
Computer 3,000
Software and configuration 15,000
Data logger (64 input) 12,000
32 electricity meters 19,000
Installation 14,000
Wiring 23,000 Total electrical monitoring 86,000
16 steam meters 80,000
Installation 23,000
Wirign connections 12,000
8 gas meters 9,000
Installation 6,000
Wiring connection 6,000
4 water meters 6,000
Installation 6,000
Wiring connection 3,000 Total additional monitoring 151,000
Source : Danish Energy Agency

Source: P. Waide, European Experience with
energy management, 2017
4.8 Implementation of ISO 50001
Source: EC , 2016
32

• Quality: requirement for minimum criteria should prevail over cost-effectiveness
• Added value: lead to actions or are tools for compliance??
• Availability of support actions
o Experience on energy audit programmes in industry show that if ran in isolation, have limited impacts
o Benefits are multiplied if combined with complementary measures
o Need: incentive and support schemes, including SMEs, for the implementation of recommendations from energy audits and similar measures
4.9 Key issues
Source: A study in energy efficiency in enterprises, EC, DNV, 2016
Source: Dept of Business Energy and Industrial Strategy, UK, 2017
33

• Provision of incentives: financing EE measures
• Minimisation of risks: Certification of EE projects including project development and QA (eg ICP Europe)
• Mandatory energy performance targets?
4.10 Maximising impacts
Source;
https://www.erc.go.ke/index.php?option=com_content&view=arti
cle&id=249:public-notice-the-energy-energy-management-
regulations-2012&catid=108&Itemid=700
KENYA
THE ENERGY (ENERGY MANAGEMENT) REGULATIONS, 2012Energy conservation measures.8. (1) The owner or occupier shall take measures to realize at least fifty percent of the identified andrecommended energy savings specified in the energy investment plan by the end of three years andthereafter at every audit reporting date.
Source: UNIDO, 2018
34
Example: Instruments in Denmark

LDK Consultants
o Established in 1968 in Athens, Greece
o Comprising 6 companies (including subsidiaries
in Romania, Belgium, Cyprus, Serbia & Kenya)
o 80 employees
o Fields of expertise: Energy, Environment and
Water,Buildings & Infrastructure, Socio-economic
Development
o Average revenues: 13m €
o Assignments in more than 70 countries world-
wide
o Largest Integrated Consulting &
Engineering Services Company in Greece,
with 85% of revenues generated internationally
o κε το 1968 στην Αθήνα/ 6 εταιρείες (με γραφεία
σε Κύπρο, Ρουμανία, Βουλγαρία, Σερβία, Βέλγιο,
Κένυα)
o 105 Μόνιμοι εργαζόμενοι & Συνεργάτες
o Πυλώνες Εξειδίκευσης: Ενέργεια / Περιβάλλον &
Υδάτινοι πόροι Κτίρια & Υποδομές Κοινωνικό-
Οικονομική ανάπτυξη
Σελίδα 35
SN Project Country Period
1 Energy Audits at Hellenc Brewery Greece 4-6/2018
2 Energy Audits at FAMAR pharmaceutical company Greece 4-6/2018
3 Resource Efficiency audit at Enzym Yeast plant Ukraine 9-11/2017
4 Energy Audit at JORMAG magnesia plant Jordan 5-8/2017
5 Energy Audit at grain facilities in Tunisia Tunisia 5-8/2017
6 Energy audit at 2 sugar plants in Kyrgyz republic Kyrgyzstan 5-7/2017
7 Energy audits at 5 buildings (schools/kindergartens/hospitals) in Yerevan
Armenia 9-12/2016
8 Energy audits at 5 buildings (schools/kindergartens/hospitals) in Chisinau
Moldova 9-12/2016
9 Energy Audits at 7 sites of Coca Cola Hellas as per EN16247 standards
Greece 4-12/2016
10Energy Audits at UKPF poultry complex Kazakhstan
11/2015-1/2016
11 Energy Audits at the buildings of Nokia Hellas (4 buildings)
Greece9/2015-11/2015
12Energy Audit at Zernoff Group (Agribusiness) Moldova
8/2015-10/2015
13Energy Audit at Khask (adhesive tapes) Ukraine
7/2015-9/2015
14Energy Audit at Rustavi Azot Georgia
4/2015-7/2015
15Energy Audits at BMI and KMN copper plants Azerbaijan
3/2015-6/2015
35

Off 21, Thivaidos st.
Gr-145 64, Kifissia, Athens
T: +30 210 8196700
W: www.ldk.gr
THANK YOU!!!

A1. Summary sheet
37
BACK

A2.Data sheetsProject No PI-1A
Biogas generation-separation
SN AREA UNIT VALUE COMMENT
Assumptions
a Electricity tariff Eur/MWh 93.3 Assumed green tariff
b Gas tariff EUR/Nm3 0.46 Average 2015
c Gas tariff EUR/MWh 62.49 Average 2015
d LPG LHV MJ/Nm326.477 assumed
e Green Tariff EURO/MWh 127
f Present
g Gas consumption boiler Nm3/y 43,915 baseline assumed
h Gas consumption boiler MWh/y 323 g x d /3.6/1000
i Boiler efficiency (current) % 95% assumed present
j Heat demand MWh/y 307 h x i
k Gas costs €/y 20,184 b x g /1000
l Electricity consumption MWh/y 1,271 total plant's consumption
m Electricity Costs EUR/y 118,607 a x l
n Income
o Electrical capacity MW 0.347
p Electrical capacity (own) MW 0.151 costs included in O&M
q electrical efficiency % 38% average of all units
r Heat efficiency % 42% average of all units
s Heat Capacity MWth 0.38 o x r / q
t Fuel input MW 0.99 o/ q
u Operation h/y 8,760 see analysis
v Thermal energy UF % 43%
w Power generation MWh/y 3,040 o x u
x Income from electricity sale Euro/y 283,606 a x w
y Biogas kWh/y 8,684,914
z Generated heat MWh/y 1,445 u x s
A Saved gas MWh/y 1,445
B Saved gas Euro/y 90,282 A x b /1000
C Nitrogen fertilizer Euro/y 22,690 see analysis
D P2O5-fertilizer Euro/y 47,994 see analysis
E K2O-fertilizer Euro/y 8,265 see analysis
F Liquid fertiliser Euro/y 188,856
G Total income from fertilisers Euro/y 267,805 assumed 0 as baseline
H Total income Euro/y 641,693
I Expenses
J Gas needed for CHP Nm3/y 0 NA
K Gas for CHP costs Euro/y 0 NA
L Electricity costs Euro/y 24,928 10% parasitic consumption
M Personnel costs Euro/y 40,000 2 employees
N Maintenance of installations Euro/y 290,225 mechanical + CHP
O Total expenses -355,153
P Investment Cost
Q Specific cost Eur/kWe 8,287
R Investment EURO 2,875,418 see analysis
S GHG emissions reduction
T Emission factor-electricity tCO2/MWhe 0.521 source: EBRD
U Emission factor-gas tCO2/MWh fuel 0.202 source: EC
V CO2 emissions reduction tCO2/y 1,584 w x T + U x zBACK 38
Project No yyyy-5
Replacement of lamps with energy efficient
SN AREA UNIT VALUE COMMENT
Assumptions
a Electricity Tariff UAH/kWh 1.4670 Tariff for 2017
b Electricity Tariff EUR/kWh 0.049
c Present
d Electrical capacity lamps kW 66.0
e Average operating time h/y 7,300 Caclulated
f Electricity consumption kWh/y 482,004 calculated
g Electricity Costs EUR/y 23,570 b x f
h After
i New capacity (LED ) kW 30.6 with LED
j Average operating time h/y 7,300 year round operation
k Electricity consumption kWh/y 223,643 Caclulated
l Electricity Costs EUR/y 10,936 k x b
m Savings
n Energy Savings MWh/y 258 f - k
o Energy Cost Savings EUR/y 12,634 n x b
p % of savings % 53.6% based on capacities
q Reduction in O&M costs EUR/y 3,190 divided in yearly units
r Total Cost savings EUR/y 15,824
s Investment Cost
t Investment EUR 46,090 see calculations
u GHG emissions reduction
v Emission factor-electricity tCO2/MWhe 0.896 source: EBRD
w CO2 emissions reduction tCO2/y 231.5 v x n

Project No yyyy-3
Optimisation of refrigerators
Key Input data Results
Cost/
Description Unit Benefit Description Unit Value
Saved electricity EUR 5,195 Net Present Value (NPV) EUR 71,992
Saved fuel EUR 28,506 Pay-Back Period years 4.3
Total Energy Saving EUR 33,701 Benefit Cost Ratio (BCR) 1.4
Water savings EUR 0 Internal Rate of Return (IRR) % 17.33%
Investment Cost EUR 160,000
Reduction in O&M costs EUR -3,200
Aditional Income from increased sales EUR 0
Inflation % 0%
Project Lifetime years 15
Tax Rate % 0
Discount Rate % 10%
Discounted Cash Flow Calculations (yearly) [ in EURO]
Operation Period 0 1 2 3 4 5 6 7 8 9 10 11 12 13 14 15
Operation Year 2018 2019 2020 2021 2022 2023 2024 2025 2026 2027 2028 2029 2030 2031 2032 2033
Benefits from Energy Savings 33,701 33,701 33,701 33,701 33,701 33,701 33,701 33,701 33,701 33,701 33,701 33,701 33,701 33,701 33,701
Water savings 0 0 0 0 0 0 0 0 0 0 0 0 0 0 0
Additional Income from increased sales 0 0 0 0 0 0 0 0 0 0 0 0 0 0 0
Reduction in O&M costs -3,200 -3,200 -3,200 -3,200 -3,200 -3,200 -3,200 -3,200 -3,200 -3,200 -3,200 -3,200 -3,200 -3,200 -3,200
Gross Profit 30,501 30,501 30,501 30,501 30,501 30,501 30,501 30,501 30,501 30,501 30,501 30,501 30,501 30,501 30,501
Investment costs -160,000
Net Cash Flow -160,000 30,501 30,501 30,501 30,501 30,501 30,501 30,501 30,501 30,501 30,501 30,501 30,501 30,501 30,501 30,501
Discounted Cash Flow -160,000 27,728 25,207 22,916 20,833 18,939 17,217 15,652 14,229 12,935 11,759 10,690 9,719 8,835 8,032 7,302
A3.Financial analysis
BACK
39

A4. Sensitivity analysis
BACK
40

41
References
41
1. DEEP-De-risking energy efficiency platform; https://deep.eefig.eu/factsheet/quick/#2. European Industrial Energy Efficiency Good practices platform; http://www.eumerci-portal.eu/web/guest/home3. Concerted actions, European Energy Efficiency Directive; https://www.ca-eed.eu/Expert-areas/Expert-Areas/Energy-audits-and-
management-systems4. Reference documents under the IPPC Directive and the IED; http://eippcb.jrc.ec.europa.eu/reference/5. RICARDO Development of recommendations on the implementation of certain aspects of Article 8 and Annex VI of the Energy
Efficiency Directive , 2018; https://ec.europa.eu/energy/sites/ener/files/final_report_-_development_of_guidelines_and_recommendations_on_the_impl.pdf
6. Waide, European Experience With Energy Management , 20177. European Commission, A Study on Energy Efficiency in Enterprises: Energy Audits and Energy Management Systems; 2016;
https://ec.europa.eu/energy/sites/ener/files/documents/EED-Art8-Implementation-Study_Task12_Report_FINAL-approved.pdf8. REPORT FROM THE COMMISSION TO THE EUROPEAN PARLIAMENT AND THE COUNCIL;2017;
https://ec.europa.eu/info/sites/info/files/171011-ssm-review-report_en.pdf9. JRC; Energy Consumption and Energy Efficiency Trends in the EU-28 2000-2015; 2018;
http://publications.jrc.ec.europa.eu/repository/bitstream/JRC110326/efficiency_trends_2017__final_lr.pdf10. EVALUATION OF THE ENERGY SAVINGS OPPORTUNITY SCHEME, Impact evaluation scoping report , 2017;
https://assets.publishing.service.gov.uk/government/uploads/system/uploads/attachment_data/file/650881/Evaluation_of_ESOS_Impact_evaluation_scoping_report.pdf.
11. Energy Efficiency Trends and Policies In Industry , ODYSEE-MURE;2015; http://www.odyssee-mure.eu/publications/br/energy-efficiency-trends-policies-industry.pdf
12. ICF, STUDY ON ENERGY EFFICIENCY AND ENERGY SAVING POTENTIAL IN INDUSTRY AND ON POSSIBLE POLICY MECHANISMS, 2015, https://ec.europa.eu/energy/sites/ener/files/documents/151201%20DG%20ENER%20Industrial%20EE%20study%20-%20final%20report_clean_stc.pdf
13. G. Kukushkina, Indirect adiabatic cooling, 2011, https://www.theseus.fi/bitstream/handle/10024/32531/Kukushkina_Galina.pdf?sequence=1
14. Investors Confidence Project, http://europe.eeperformance.org/15. M. Matteini, L. Barbier, Requirements of EED Article 8 and implementation experiences and challenges from different countries,
UNIDO, 2018, http://www.economy.ge/uploads/files/2017/reitingebi/samrecvelo_energoefeqturoba/2_1_eu_eed_article_8.pdf16. DEA, Energy Policy Toolkit on Energy Efficiency in Industries, Experiences from Denmark, 2015;
https://ens.dk/sites/ens.dk/files/Globalcooperation/ee_in_industries_toolkit.pdf17. DTU, Best Practices and Case Studies for Industrial Energy Efficiency Improvement; 2016; http://www.unepdtu.org/-
/media/Sites/energyefficiencycentre/Publications/C2E2%20Publications/Best-Practises-for-Industrial-EE_web.ashx?la=da


![Tailoring Innovation to Achieve Financially-Viable Energy ... · Management Fact Sheet: Energy Conservation, Office of Water, 2006]. b Based on many life cycle assessments that have](https://img.pdfslide.us/doc/110x75/5f6a195a98af306d8a415ef7/tailoring-innovation-to-achieve-financially-viable-energy-management-fact-sheet.jpg)