Embed Size (px)
Citation preview
http://www.interreg-central.eu/Content.Node/ENERGYATSCHOOL.html
Edited by Unione Bassa Romagna
In cooperation with Naxta Ltd
N. DELIVERABLE D.T2.1.1 Version 01
20 06 2017
ENERGY AUDIT REPORT SCUOLA MEDIA INFERORE
(SECONDARY SCHOOL) "RENATO EMALDI" - FUSIGNANO (RA)
REQUIRING DEVELOPMENT OF AN ENERGY GUARDIAN SMART
SCHOOL MANAGEMENT PLAN

Page 1
Index 1. Background .................................................................................................. 2
2. Summary ..................................................................................................... 4
3. Generalities of the school ................................................................................. 6
4. Description of the current state .......................................................................... 9
4.1. Building ................................................................................................... 10
4.2. Water and energy supply ............................................................................... 11
4.3. Builiding automation system ........................................................................... 11
4.4. Recording Energy Consumption ........................................................................ 11
4.5. Energy Performance Indicators ........................................................................ 14
4.6. Energy consumers ....................................................................................... 15
5. Ways to improve energy efficient ....................................................................... 16
5.1. Building envelope ........................................................................................ 16
5.2. Replace light with LED .................................................................................. 18
5.3. Install Energy Saving Switch and Presence Sensors ................................................. 18
5.4. Electrical energy reduction with PV system ......................................................... 19
5.5. Install a solar thermal system ......................................................................... 19
5.6. Install building automation system ................................................................... 20
5.7. Change end-user behaviour ............................................................................ 21
6. Timeline for implementation ............................................................................. 23

Page 2
1. Background
In Fusignano (RAVENNA - Italy) there are 4 municipal schools. In 3 of them, a systematic inventory was carried out in the autumn of 2016, on the initiative of the European research project energy@school, on the basis of which a comprehensive report of the inventory of each city was prepared (Deliverable D.T1 .1.3, January 30, 2017, edited by CertiMaC, Italy).
The goal of ENERGY @ SCHOOL is to simplify the introduction of smart energy schools. With an integrated approach, teachers and students are trained as Senior and Junior Energy Guardians (EGs).
They are committed to a sustainable increase in the energy efficiency of buildings and an understanding of the appropriate energy consumption ("energy culture") of a school building.
ENERGY @ SCHOOL aims to achieve the following results:
I. Optimization of energy consumption in schools,
II. Concrete and progressive increase of EE and RES use in schools not only thanks to technical application of smart solutions, but also to non-technical factors such as a better management capacity and responsible behavior toward energy use,
III. Increase of capacity of public sector to deal with increase of EE and RES use in schools thanks to strategy, action plans, tools (methods, approaches), trainings, pilot actions defined and implemented within the project,
IV. Increase in managerial and organizational competences as well as in human resources to ensure the progressive and sustainable energy efficiency and renewable energy se in public schools (trainings),
V. Creation of conditions for new job opportunities (trainings), VI. Creation of “energy culture”, thus responsible attitude towards energy use, thanks to
education and raising awareness activities, as it is demonstrated that amount of saved energy can noticeably increase if energy retrofit interventions are associated to behavioral changes.
In the research project, 12 project partners (PP) from seven Central European countries are represented:
PP 1. Union of Municipalities of Low Romagna Region , Lead Partner – Italy PP 2. CertiMaC s.c.r.l. - Italy PP 3. City of Bydgoszcz - Poland PP 4. ENERGY AGENCY OF SAVINJSKA, ŠALEŠKA AND KOROŠKA REGION - Slovenia PP 5. City of Karlovac - Croatia PP 6. University of Bologna - Dept of Industrial Chemistry - Italy PP 7. Municipality of the CITY Szolnok with County Rank - Hungary PP 8. Local Government of Town Újszilvás - Hungary PP 9. City of Stuttgart - Germany

Page 3
PP 10. Klagenfurt - Austria PP 11. Graz Energy Agency - Austria PP 12. City Municipality of Celje - Slovenia
From the examined schools, five schools joined up to be actively involved in energy@school.
These schools receive an individual report on the energy audit with this document. This report is intended to serve as the basis for the development of an energy action plan (Energy Guardian Smart School Management Plans - EGSMPs) to the school's managers and, in addition to inventory analysis, includes investive and non-investive measures for energy saving.
These actions help to develop individual actions in the respective school and a common strategy for smart schools (CSSS).
Further information are available at the following link http://www.interreg-
central.eu/Content.Node/ENERGYATSCHOOL.html

Page 4
2. Summary
The examined school had an average energy performance indicator of electricity of 34,38 kWh/m² per year and 27.09 m3 of natural gas per year for m2. The share of renewable energies in the electricity sector is 0 % in the heating sector 0 %.
Energy Performance Indicators
Total consumpti
on per year
Consumption per volume
Consumption per heated
area
Consumption per
classrooms area
Consumption per number of students
Consumption per number
of days
Total energy consumption
per year
kg CO2 equivalent per year
Tonnes of oil equivalent per year
Energy carrier/Fuel/ Power
source
u.m. u.m. u.m./m3 u.m./m2 u.m./m2 u.m./student u.m./day kWh kg CO2 equiv
tep
Electricity kWhel 66695 5,73 34,38 54,83 323,76 226,85 66695 28892 12
Natural gas Sm3 52553 4,51 27,09 43,20 255,11 178,75 504508 10500 44
Fuel oil/Diesel
t 0 0 0
GPL t 0 0 0
Biomass t 0 0 0
District heating
kWht 0 0 0
District cooling
kWhf 0 0 0
Photovoltaics
kWhel 0 0 0
Solar thermal collectors
kWht 0 0 0
Geothermal
kWht 0 0 0
Other - energy produced
0 0 0 0
Tonnes of oil
equivalent tep
56,41 0,00 0,03 0,05 0,27 0,19
39392 56
Table 1 - Energy performance indicators

Page 5
The following measures are recommended for the order of implementation.
Measure
Investment
costs
€
energy
savings
kWh/a
cost
savings
€/a
return of
invest
a
Kg CO2-
savings
to (CO2)/a
Measure 1: Retrofit external walls with insulation
723.133,00
414.506,15 24.279 29,8 6.930
Measure 2: Replace lights
with LED 6.525 10.128 (-57%) 2.430,72 2,7 4387
Measure 3: Install Energy
Saving Switch and
Presence Sensors 12.500 1780 (-10%) 427,2 29 771
Measure 4: Install a
photovoltaic system 32.000,00 22.000 5.280 6 9.530
Measure 5: Install a solar
thermal system 2.400 1.600 120 20 33
Measure 6: Install building
automation system
(automatic centralized
control of a building's
heating, ventilation and
air conditioning, lighting…) 48500
(10%)
69.282,50 5.929 8,2 3939
Measure 7: Change end-
user behaviour: control
devices stand-by
(monitors, PCs, laboratory
equipment, lights, etc.) 0 (5%) 2.964,5 0 1969,5

Page 6
3. Generalities of the school
Figure 1 1 shows the Scuola media inferiore “Renato Emaldi” – Fusignano (Secondary School). School building was built in several steps: first block in 1900, following several exlargement in 1920, 1960 and a refurbishment of the south facace.
Fig 1 - Renato Emaldi Secondary School
GENERALITIES
GEOGRAPHICAL LOCATION AND WEATHER CONDITIONS
School type Secondary
Country Italy
Student age range 11-14
City Fusignano (RA)
BUILDING GEOMETRY
OCCUPATION AND USE OF THE BUILDING
Total floor heated area [m2] 1940
Number of students 206
Volume [m3] 11640
Total days of use 294
S/V 0,62
Daily hours of use 8
Total area allocated to classrooms [%] 64

Page 7
General information about the climate
Picture 2- Graphic representation of monthly average temperature [°C]
Picture 3 - Graphic representation of the Horizontal solar irradiation [Wh/m2/day] per Months. This value is the monthly/yearly average of the sum of the solar radiation energy that hits one square meter in a horizontal plane in one day.
Page 8
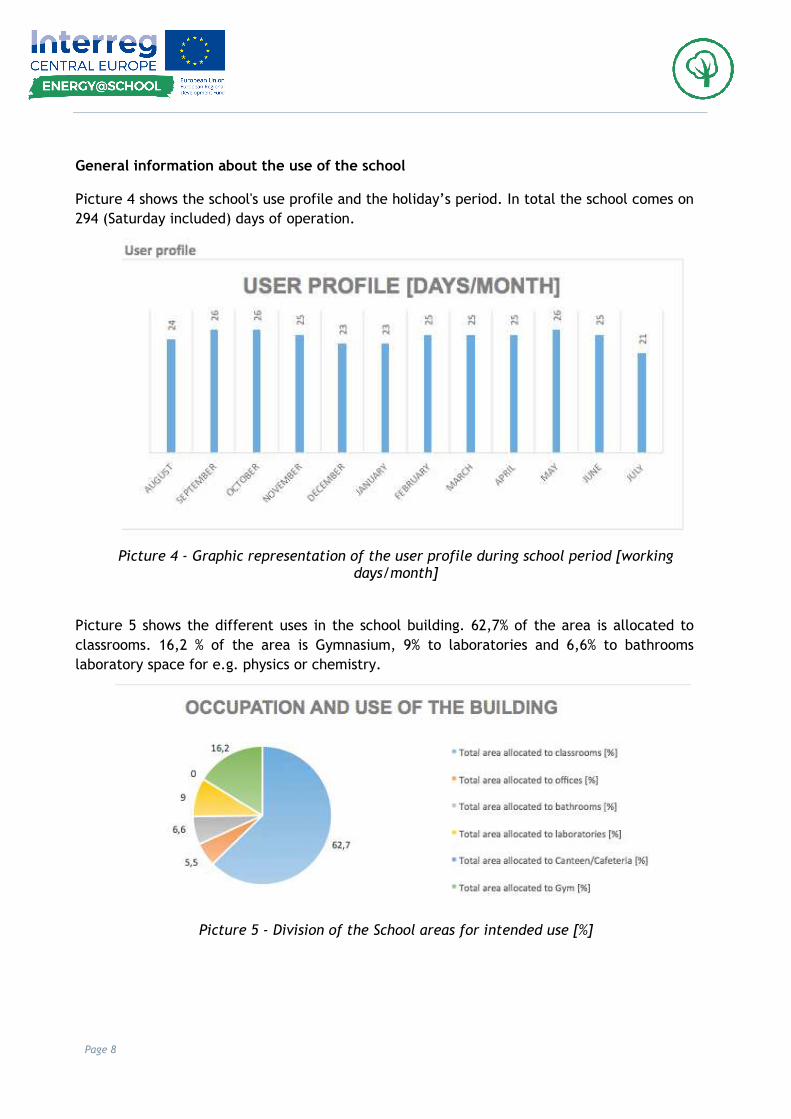
General information about the use of the school
Picture 4 shows the school's use profile and the holiday’s period. In total the school comes on
294 (Saturday included) days of operation.
Picture 4 - Graphic representation of the user profile during school period [working days/month]
Picture 5 shows the different uses in the school building. 62,7% of the area is allocated to
classrooms. 16,2 % of the area is Gymnasium, 9% to laboratories and 6,6% to bathrooms
laboratory space for e.g. physics or chemistry.
Picture 5 - Division of the School areas for intended use [%]

Page 9
4. Description of the current state
General information about the current state
The building is entirely used as a school plexus and energy consumption is due to heating, lighting and power supplies.
Picture 6: average monthly consumption (electricity and gas) during a school year
Page 10
4.1. Building
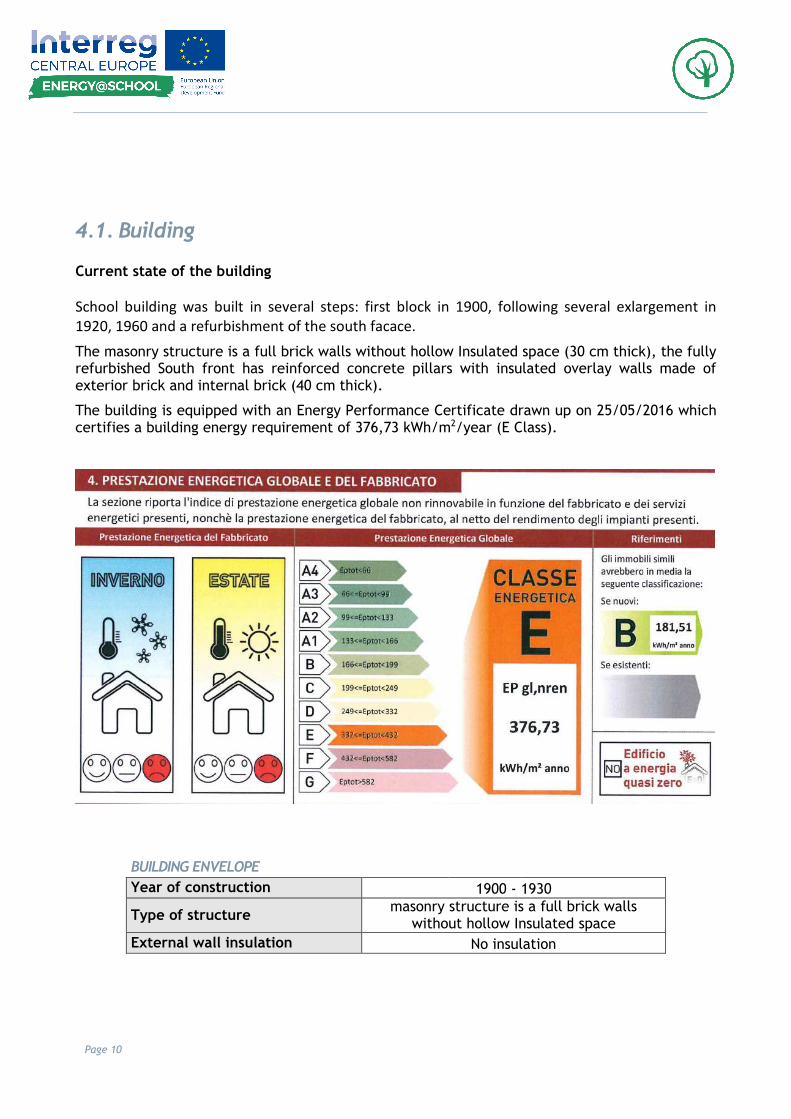
Current state of the building
School building was built in several steps: first block in 1900, following several exlargement in 1920, 1960 and a refurbishment of the south facace.
The masonry structure is a full brick walls without hollow Insulated space (30 cm thick), the fully refurbished South front has reinforced concrete pillars with insulated overlay walls made of exterior brick and internal brick (40 cm thick).
The building is equipped with an Energy Performance Certificate drawn up on 25/05/2016 which certifies a building energy requirement of 376,73 kWh/m2/year (E Class).
BUILDING ENVELOPE
Year of construction 1900 - 1930
Type of structure masonry structure is a full brick walls
without hollow Insulated space
External wall insulation No insulation

Page 11
4.2. Water and energy supply
Current state of the energy suply
The heating system of the schools is provided by a district heating system whose thermal plant is located in a specially built exterior building.
In the latter there are 4 boilers (cascading) that are connected to 3 branch units, characterized by pumps that circulate the hot water in the building to which they are responsible.
HVAC AND RES SYSTEMS
Heat generation system
Natural gas boiler
RES systems
None
4.3. Builiding automation system
General information about the builging automation system
There is a temperature control thermostat. There are no separate heat accounting systems
or other building automation or home automation systems.
4.4. Recording Energy Consumption
There is monitor Energy consumption for lighting but no monitoring for other energy use. The
energy and costs have been elaborated from the energy invoices.
There is no solar generated electricity. (Picture 6, Picture 7) show the monthly consumption
values.

Page 12
Picture 6 - Average monthly electricity consumptions during a school year [kWhe]
Picture 7 - Natural gas consumptions during a school year [Sm3]
The higher demand of both types of energy is clearly visible in winter. While the higher
demand of electricity is influenced in particular by the longer lighting time in winter, the
heating energy demand depends on the weather and/or on the outside temperature.
Page 13
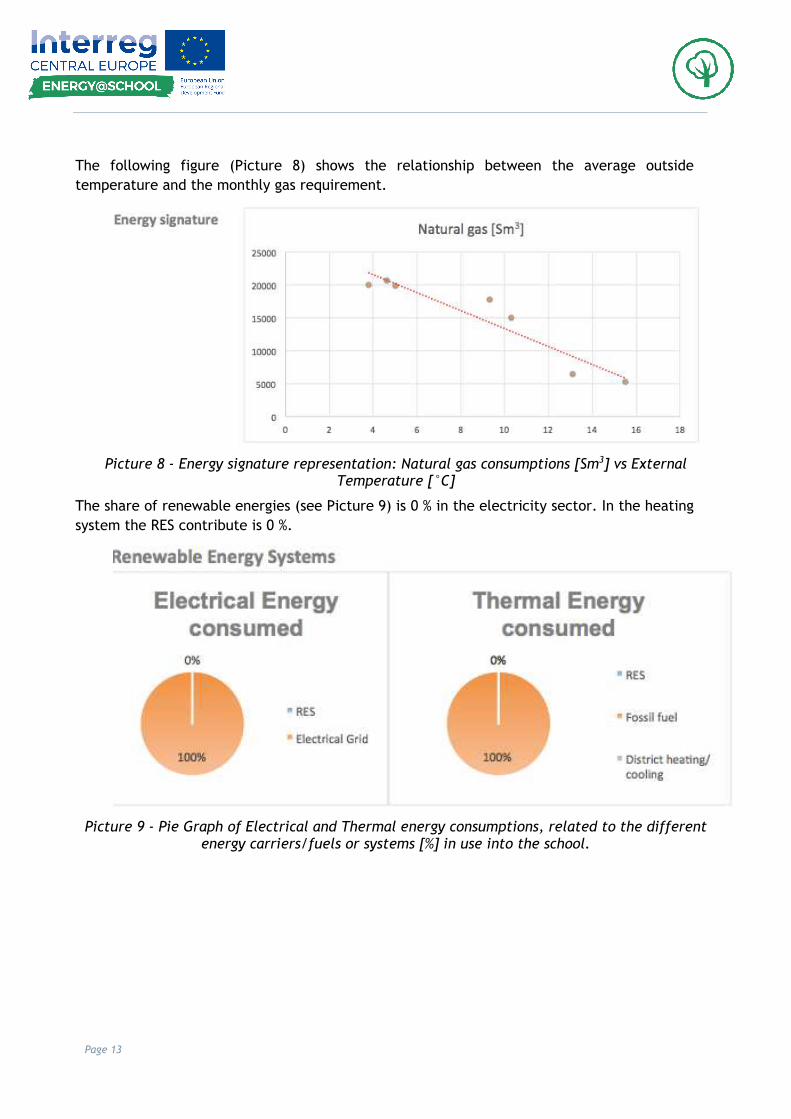
The following figure (Picture 8) shows the relationship between the average outside
temperature and the monthly gas requirement.
Picture 8 - Energy signature representation: Natural gas consumptions [Sm3] vs External Temperature [°C]
The share of renewable energies (see Picture 9) is 0 % in the electricity sector. In the heating
system the RES contribute is 0 %.
Picture 9 - Pie Graph of Electrical and Thermal energy consumptions, related to the different energy carriers/fuels or systems [%] in use into the school.

Page 14
4.5. Energy Performance Indicators
General information about energy performance indicators
Energy performance indicators are necessary for comparability with other schools. There are
constant reference values, such as, e.g. the heated area or the volume, or slightly
fluctuating reference variables such as the number of pupils or the working days.
A very important reference is the heating degree-days. Over the past few years, these have
seen a deviation of approx. +/- 12%.
The heating performance indicator in relation to the area and the heating degree-days
therefore allows a consideration of the consumption figures irrespective of the weather.
Table 2 shows the indicators of the examined school.
Table 2 - Energy performance indicators

Page 15
4.6. Energy consumers
The analysis of the energy consumers is intended to show the most important consumption points with the highest potential.
In the case of heat supply, the heat requirement for the domestic hot water supply and the heat demand play a role.
The heat demand for space heating is the sum of the heat loss caused by the transmission of heat through the walls and windows and the heat loss due to the ventilation of the windows minus the solar gains over the window surfaces.
Simplified, the heat required for the shower water is very low (we are in a primary school). In the school building, the fresh air demand is only realized with window ventilation.
The underlying value is therefore based on a fresh air requirement of 30 m³ / h per person. The share of end users for electricity and heat demand is shown in Picture 10.
Picture 10 - Natural gas and electricity consumptions subdivision [%] for each final intended use
The lighting mainly influences the electricity consumption. The electricity requirement of the
electric water heaters on the hand-washing basins is based on the fact that each user needs an
average of about one liter of hot water.

Page 16
Picture 11 shows that a share of 99% is used for lighting.
Picture 11 - Electrical consumptions subdivision [%] for each final intended use
5. Ways to improve energy efficient
The following section is concerned to ways to improve energy efficiency.
5.1. Building envelope
General information about the improvement at the buildingside
The exterior walls of the existing buildings correspond to the constructional "non" insulation standard of the builted year. Subsequent insulation of the walls, together with roof insulation, reduces heat losses by 66%.
Windows replacement have not been considered because of the total amount of the costs, referred to the energy saving.
Measure 1: Retrofit the external walls and roof with insulation
The building envelope also offers opportunities for the user to actively contribute to energy saving. For example, sun protection can be used specifically to influence the solar gains: in winter they can reduce heating requirements and counteract heat build-up in the summer. Furthermore, the energy consumption can also be reduced to the necessary extent by means of a demand-oriented window ventilation.

Page 17
Measure
Investment costs
Energy savings Cost savings Return of invest CO2-savings
€ kWh/a €/a years kg (CO2)/a
Retrofit external walls with insulation and retrofit roof
723.133,00 414.506,15 24.279 29,8 6.930
Note: the evaluation of the investment doesn't take care of incentives. In affirmative case,
the incentves is 40% of the total costs of the investment.

Page 18
5.2. Replace light with LED
Replacing current lamps with new LED lamps gives an estimated 57% energy saving as regards electricity consumption. In the case of school, lighting is the almost exclusive cause of electricity consumption.
Even though LEDs reduce power consumption, Junior Energy Guardians can always check that energy is not wasted by illuminating the classrooms when they are not busy (recreation or lunch time, ecc.).
Measure 2
Investment
costs
€
Energy
savings
kWh/year
Cost
savings
€/year
Return of
invest
year
CO2-savings
to (CO2)/year
Replace lights with
LED 6.525 10.128 (-57%) 2.430,72 2,7 4387
Measure 2: replacement of the light with LED
5.3. Install Energy Saving Switch and Presence Sensors
The luminous flux regulators affect the amount of light to be delivered. The adjustment process, called "dimming", adjusts the amount of artificial light according to the amount of light set. A brightness sensor allows you to estimate the amount of light present in the compartment and to reduce the amount of artificial light depending on the presence of natural light, ensuring both an energy-efficient system, but above all a properly illuminated indoor environment depending on the activities that It takes place (studyng, working, ecc.).
The presence sensors, on the other hand, eliminate artificial light delivery if nobody is in the room, bathroom, ecc. This device is really useful for rooms that are used in a non-continuous manner such as bathrooms and storage rooms.
In the school it could also be useful for the classrooms to prevent the lights from turning on when students and teachers go away. This last activity, before the installation of presence sensors, may be carried out by the Junior Energy Guardian.
Measure 3
investment
costs
€
energy
savings
kWh/a
cost
savings
€/a
return of
invest
a
CO2-savings
to (CO2)/a

Page 19
Measure 3
investment
costs
€
energy
savings
kWh/a
cost
savings
€/a
return of
invest
a
CO2-savings
to (CO2)/a
Install Energy
Saving Switch
and Presence
Sensors 12.500 1780 (-10%) 427,2 29 771
Measure 3: Install Energy Saving Switch and Presence Sensors
5.4. Electrical energy reduction with PV system
The electricity used by the school is totally taken from the national electricity grid. A photovoltaic installation calculated on the possible 100% self-consumption will reduce the energy demand by self-production (when the school is open) and to avoid CO2 emissions because it should be Renewable Energy Source. The cost saving has been calculated with a 0,24€ per kWh of the actual costs, referred to the invoices.
Measure 4
Investment
costs
€
Energy
savings
kWh/year
Cost savings
€/year
Return of
invest
year
CO2-savings
to
(CO2)/year
Install a
photovoltaic
system 32.000,00 22.000 5.280 6 9.530
Measure 4: Photovoltaic system for electricity production
5.5. Install a solar thermal system
Solar collectors are devices installed outside the building (usually on the roof). These are elongated tanks that contain water that, thanks to solar radiation, warms up. Heated water is accumulated in a tank and can be used as sanitary hot water without any needing of "energy" to heat it.
In summer time, the use of hot water from the exhaled collector allows the boiler not to activate (avoiding gas consumption) or not to use the electric boilers in the bathrooms (avoiding electricity consumption).
Some built-in systems allow you to use the collector's hot water in synergy with the heating system because, especially in the autumn, during sunny days the collector allows to heat the water thus "working" less the boiler.

Page 20
As the collector water is heated (for free) from the sun, the produced energy is considered to be produced from a completely renewable source. In addition, sunbathing is completely free.
Measure 5
Investment
costs
€
Energy
savings
kWh/year
Cost
savings
€/year
Return of
invest
year
CO2-savings
to (CO2)/year
Install a solar
thermal system 2.400 1.600 120 20 33
Measure 5: solar thermal system for thermal production (hot water)
5.6. Install building automation system
Building Automation systems allow you to monitor and manage integrated building systems. The main elements handled by automation systems refer to:
• Lighting; • Heating and cooling; • Intrusion and safety; • Sensor presence; • Fire.
Some of these system, such as lighting and heating, have a direct impact on building energy consumption, and their optimal management allows you to streamline your energy consumption, as well as having a good indoor comfort for studying and working, checking temperature, humidity, air exchange and lighting.
The system consists of sensors that control the settled parameters, an electronic control unit that receives sensor data and, based on the fixed settings, sends signals to the respective systems that handle the various functions. The control unit therefore receives data on temperature, illumination level, etc. ... and then asks the boiler or electrical system to attenuate or increase the "energy flow".
These are systems that have both a hardware component (sensors) and a software component (the control unit) and which need to be "customized" to the desired parameters case-by-case.

Page 21
Measure 6
Investment
costs
€
Energy
savings
kWh/year
Cost
savings
€/year
Return of
invest
years
CO2-savings
to
(CO2)/year
Install building
automation system
(automatic
centralized control of
a building's heating,
ventilation and air
conditioning,
lighting…) 48500
(10%)
69.282,50 5.929 8,2 3939
Measure 6: building automation system (automatic centralized control of a building's
heating, ventilation and air conditioning, lighting…)
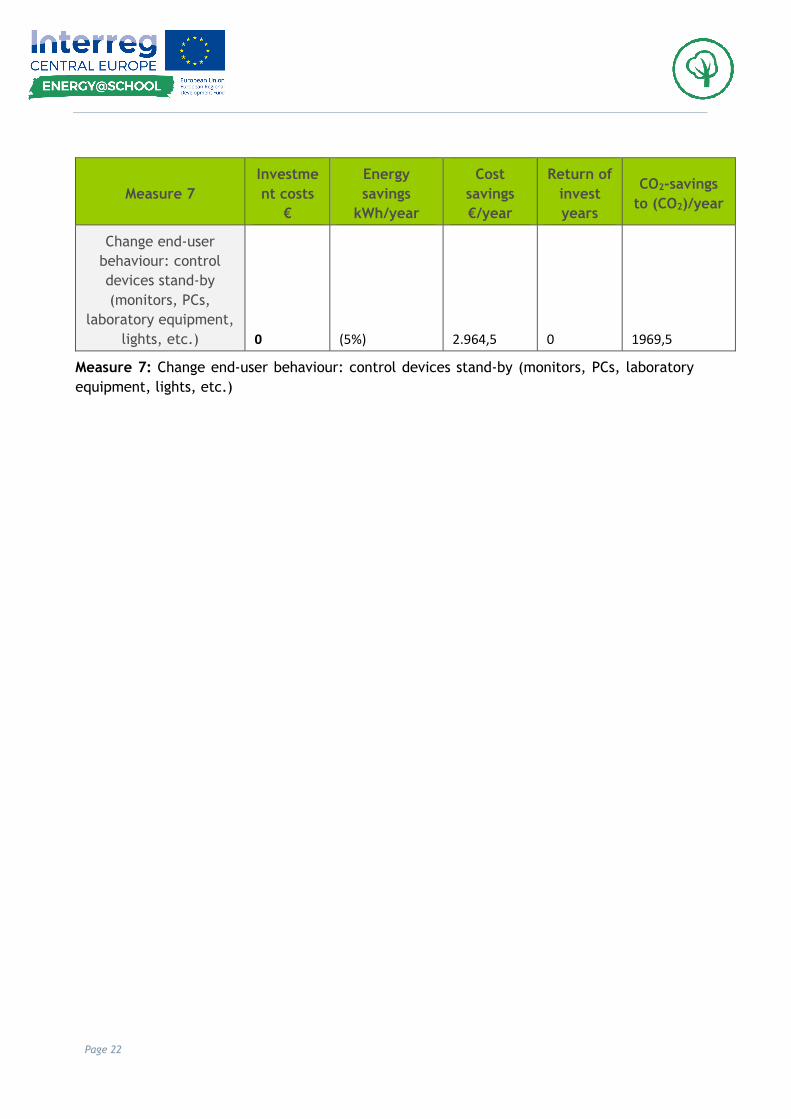
5.7. Change end-user behaviour
Some of our behaviors and habits directly affect the energy consumption of the building, especially at home but also at school.
Acquiring awareness of how our behaviors affect or not affect on energy consumption and indirectly on the environment and climate is one of the main goals of any energy initiative, directive or research initiative.
To get a conscious behavior especially in school age helps to grow people who will mater this behavior and become a spokesman for a culture of sustainability. Specifically, it is to learn how to eliminate waste or to choose one thing rather than another one in function of the impact it generates.
What does it mean to choose to go to school by bike or on foot rather than by car? Is it true that the lights should be turned on because if I turn it off and turn it on, I use more energy? Is it true that computers consume electricity even when they are off?
Awareness helps to understand how much our daily actions affect the environment and how we can reduce our impact (ecological and environmental footprint) to preserve the environment for future generations.
Page 22
Measure 7
Investme
nt costs
€
Energy
savings
kWh/year
Cost
savings
€/year
Return of
invest
years
CO2-savings
to (CO2)/year
Change end-user
behaviour: control
devices stand-by
(monitors, PCs,
laboratory equipment,
lights, etc.) 0 (5%) 2.964,5 0 1969,5
Measure 7: Change end-user behaviour: control devices stand-by (monitors, PCs, laboratory
equipment, lights, etc.)

Page 23
6. Timeline for implementation
The implementation of the measures must be adapted to the project duration of energy@school (from July 2016 to June 2018). In Table 3, the implementation of the measures is listed separately in times for planning or data collection and implementation or initiation.
Measure - planning / implementation
school year 16/17 vac school year 17/18 vac school year 18/19 vac school year 19/20
1 2 3 4 5 6 7 8 9 10 11 12 1 2 3 4 5 6 7 8 9 10 11 12 1 2 3 4 5 6 7 8 9 10 11 12 1 2 3 4
Retrofit external walls with insulation
P
I
Replace lights with LED P
I
Install Energy Saving Switch and Presence Sensors
P
I
Install a photovoltaic system P
I
Install a solar thermal system P
I Install building automation system (automatic centralized control of a building's heating, ventilation and air conditioning, lighting…)
P
I
Change end-user behaviour: control devices stand-by (monitors, PCs, laboratory equipment, lights, etc.)
P
I
Table 3 - timeline for implementation

Page 24

http://www.interreg-central.eu/Content.Node/ENERGYATSCHOOL.html
Edited by Unione Bassa Romagna (Rita Ricci e Laura Dalpiaz)
In cooperation with Naxta Ltd (Federico Fileni e Giulia Righetti)
N. DELIVERABLE D.T2.1.1 Version 01
20 06 2017
ENERGY AUDIT REPORT SCUOLA ELEMENTARE LUIGI
BATTAGLIA A FUSIGNANO (RA) REQUIRING DEVELOPMENT OF AN
ENERGY GUARDIAN SMART
SCHOOL MANAGEMENT PLAN

Page 1
Index 1. Background .................................................................................................. 2
2. Summary ..................................................................................................... 4
3. Generalities of the school ................................................................................. 6
4. Description of the current state .......................................................................... 9
4.1. Building .................................................................................................... 9
4.2. Water and energy supply ............................................................................... 10
4.3. Builiding automation system ........................................................................... 11
4.4. Recording Energy Consumption ........................................................................ 11
4.5. Energy Performance Indicators ........................................................................ 14
4.6. Energy consumers ....................................................................................... 15
5. Ways to improve energy efficient ....................................................................... 17
5.1. Building ................................................................................................... 17
5.2. Install thermostatic valves ............................................................................. 18
5.3. Replace light with LED .................................................................................. 19
5.4. Electrical energy reduction with PV system ......................................................... 20
6. Timeline for implementation ............................................................................. 21
7. Appendix .................................................................................................... 22
7.1. Economic efficiency calculation Measure 1: Retrofit the external walls and roof with
insulation ....................................................................................................... 23
7.2. Measure 6: Lighting: Replace lights with LED ....................................................... 24
Page 2
1. Background
In Fusignano (RA) there are 4 schools that belongs to the "Istituto comprensivo Luigi Battaglia":
1. Scuola Secondaria di primo grado "Emaldi" 2. Scuola primaria "Luigi Battaglia" - sede 3. Scuola primaria - succursale 4. Scuola dell'infanzia
In 3 of them, a systematic inventory was carried out in the autumn of 2016, on the initiative of the European research project energy@school, on the basis of which a comprehensive report of the inventory of each city was prepared (Deliverable D.T1 .1.3, January 30, 2017, edited by CertiMaC, Italy).
The goal of ENERGY @ SCHOOL is to simplify the introduction of smart energy schools. With an integrated approach, teachers and students are trained as Senior and Junior Energy Guardians (EGs).
They are committed to a sustainable increase in the energy efficiency of buildings and an understanding of the appropriate energy consumption ("energy culture") of a school building.
ENERGY @ SCHOOL aims to achieve the following results:
I. Optimization of energy consumption in schools,
II. Concrete and progressive increase of EE and RES use in schools not only thanks to technical application of smart solutions, but also to non-technical factors such as a better management capacity and responsible behavior toward energy use,
III. Increase of capacity of public sector to deal with increase of EE and RES use in schools thanks to strategy, action plans, tools (methods, approaches), trainings, pilot actions defined and implemented within the project,
IV. Increase in managerial and organizational competences as well as in human resources to ensure the progressive and sustainable energy efficiency and renewable energy se in public schools (trainings),
V. Creation of conditions for new job opportunities (trainings), VI. Creation of “energy culture”, thus responsible attitude towards energy use, thanks to
education and raising awareness activities, as it is demonstrated that amount of saved energy can noticeably increase if energy retrofit interventions are associated to behavioral changes.
In the research project, 12 project partners (PP) from seven Central European countries are represented:
PP 1. Union of Municipalities of Low Romagna Region , Lead Partner – Italy PP 2. CertiMaC s.c.r.l. - Italy

Page 3
PP 3. City of Bydgoszcz - Poland PP 4. ENERGY AGENCY OF SAVINJSKA, ŠALEŠKA AND KOROŠKA REGION - Slovenia PP 5. City of Karlovac - Croatia PP 6. University of Bologna - Dept of Industrial Chemistry - Italy PP 7. Municipality of the CITY Szolnok with County Rank - Hungary PP 8. Local Government of Town Újszilvás - Hungary PP 9. City of Stuttgart - Germany PP 10. Klagenfurt - Austria PP 11. Graz Energy Agency - Austria PP 12. Municipality of Celje - Slovenia
From the examined schools, five schools joined up to be actively involved in energy@school.
These schools receive an individual report on the energy audit with this document. This report is intended to serve as the basis for the development of an energy action plan (Energy Guardian Smart School Management Plans - EGSMPs) to the school's managers and, in addition to inventory analysis, includes investive and non-investive measures for energy saving.
These actions help to develop individual actions in the respective school and a common strategy for smart schools (CSSS).

Page 4
2. Summary
The examined school had an average energy performance indicator of electricity of 43,18 kWh/m² per year and 27.09 m3 of natural gas per year for m2. The share of renewable energies in the electricity sector is 0 % in the heating sector 0 %.
Total
consumption
per year
consumption
per volume
consumption
per heated
area
consumption
per number
of students
total energy
consumption
per year
kg CO2
equivalent
per year
Tons of oil
equivalent
per year
Energy
carrier/fuel/pow
er source u.m. u.m./m3 u.m./m2 u.m./student kWh
Kg CO2 equivalent TEP
electricity 61.531,00 7,20 43,18 221,33 61.531,00 26.655,23 11,51
naural gas 38.602,00 4,51 27,09 138,86 370.579,20 7.712,68 32,27
fuel oil/diesel
GPL
Biomass
District heating
District cooling
Photovoltaics
Solar thermal
collectors
Geothermal
Other - energy
produced
Tonnes of oil
equivalent 43,78 0,01 0,03 0,16 34.367,91 43,78

Page 5
Table 1 - Energy performance indicators
The following measures are recommended for the order of implementation.
Measure
investment
costs
€
energy
savings
kWh/a
cost
savings
€/a
return of
invest
a
CO2-savings
to (CO2)/a
Measure 4:
Photovoltaic system
for electricity
productionRetrofit
external walls with
insulation and
retrofit roof
424.419,00
240.876,48 15.054,78 28,19 5013,24
Fehler!
Verweisquelle
konnte nicht
gefunden
werden.Install
thermostatic
valves 2.235,00 7.411,58 463,22 4,82 203,97
Measure 3: replace
light with LED 5.200,00 7.588,15 2.276,45 2,28 1,42
Fehler!
Verweisquelle
konnte nicht
gefunden
werden.electrical
energy reduction
with PV system 32.000,00 22.000
6.600,00 3,33 4,11

Page 6
3. Generalities of the school
Figure 1 1 shows the Luigi Battaglia Primary School. School building built in 2000 and featuring two ground floors with reinforced concrete frame and full brick wall facing walls.
Fig 1 - Luigi Battaglia Primary School- main entrance
GENERALITIES
GEOGRAPHICAL LOCATION AND WEATHER CONDITIONS
School type Primary
Country Italy
Student age range 6-11
City Fusignano (RA)
BUILDING GEOMETRY
OCCUPATION AND USE OF THE BUILDING
Total floor heated area [m2] 1425
Number of students 278
Volume [m3] 8550
Total days of use 201
S/V 0,50
Daily hours of use 11
Total area allocated to classrooms [%] 94
Page 7
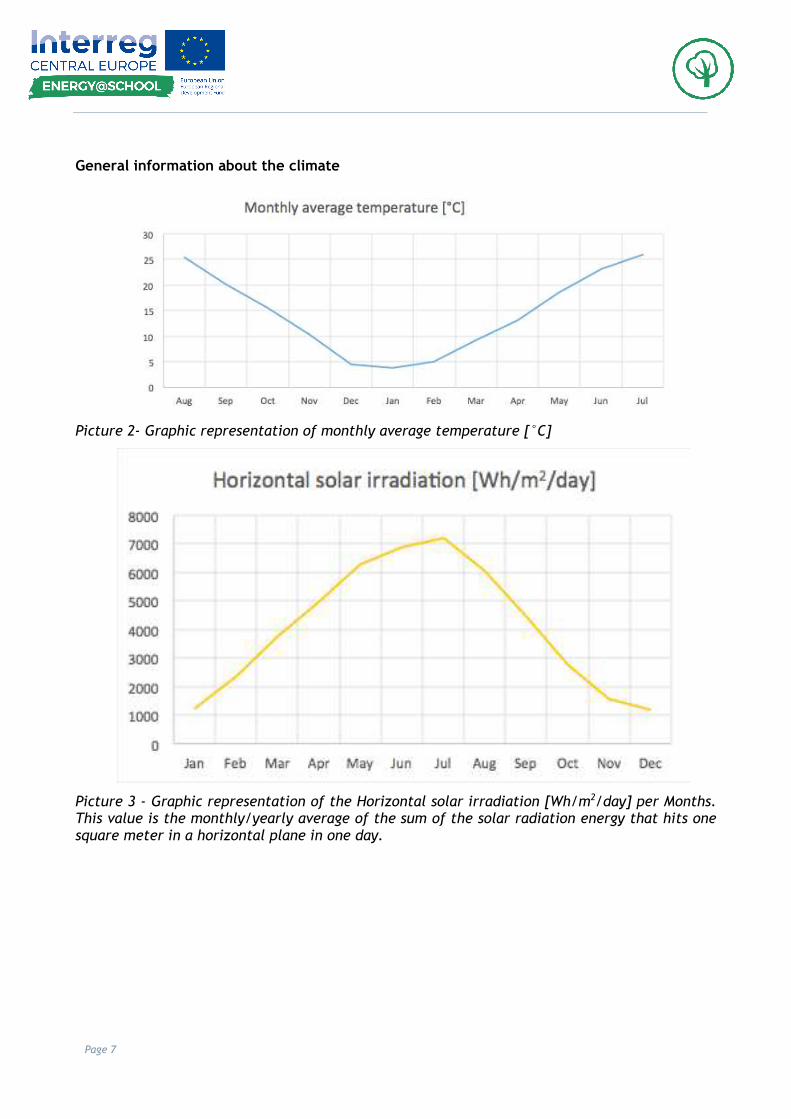
General information about the climate
Picture 2- Graphic representation of monthly average temperature [°C]
Picture 3 - Graphic representation of the Horizontal solar irradiation [Wh/m2/day] per Months. This value is the monthly/yearly average of the sum of the solar radiation energy that hits one square meter in a horizontal plane in one day.

Page 8
General information about the use of the school
Picture 4 shows the school's use profile and the holiday’s period. In total the school comes on
201 days of operation.
Picture 4 - Graphic representation of the user profile during school period [working days/month]
Picture 5 shows the different uses in the school building. 94% of the area is allocated to
classrooms. 5,4% of the area is laboratory space for e.g. physics or chemistry.
Picture 5 - Division of the School areas for intended use [%]
Page 9
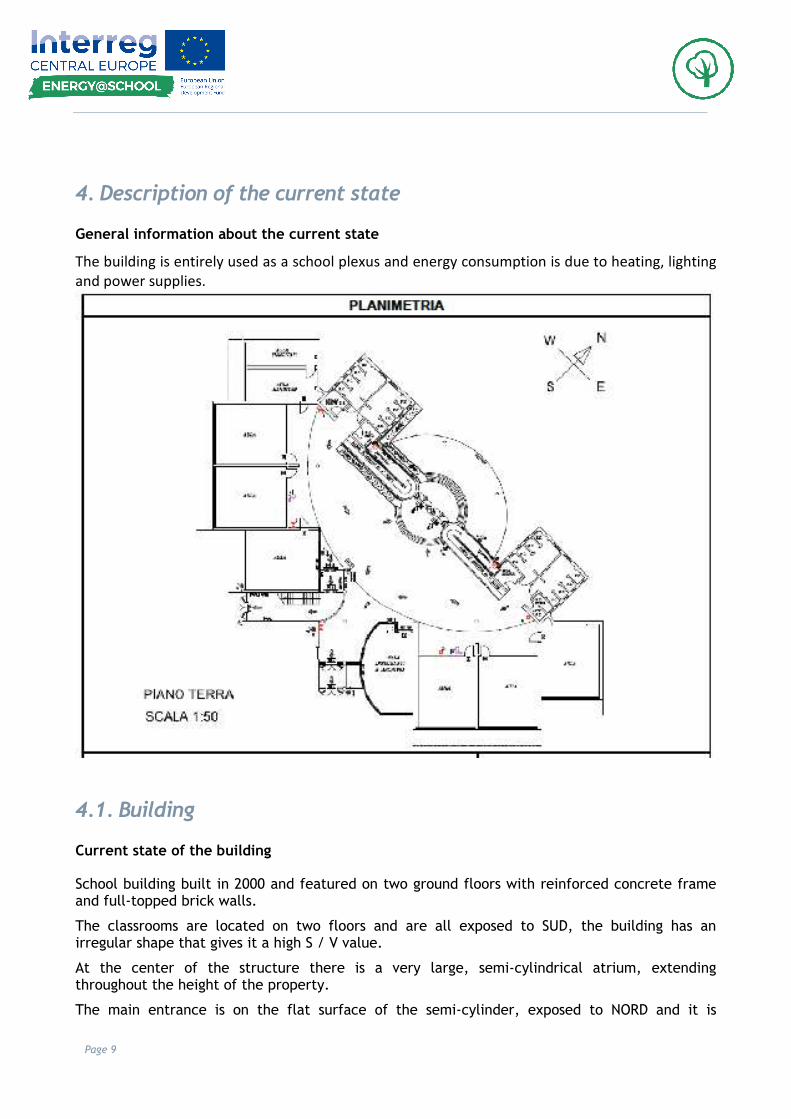
4. Description of the current state
General information about the current state
The building is entirely used as a school plexus and energy consumption is due to heating, lighting and power supplies.
4.1. Building
Current state of the building
School building built in 2000 and featured on two ground floors with reinforced concrete frame and full-topped brick walls.
The classrooms are located on two floors and are all exposed to SUD, the building has an irregular shape that gives it a high S / V value.
At the center of the structure there is a very large, semi-cylindrical atrium, extending throughout the height of the property.
The main entrance is on the flat surface of the semi-cylinder, exposed to NORD and it is

Page 10
characterized by a large glazed surface.
The building is equipped with an Energy Performance Certificate drawn up on 25/05/2016 which certifies a building energy requirement of 363.05 kWh / m3 / year
BUILDING ENVELOPE
Year of construction 2000
Type of structure Armored frame and solid brick wall to face
External wall insulation No insulation
4.2. Water and energy supply
Current state of the energy suply
The heating system of the school, together with two other school buildings, is provided by a district heating system whose thermal plant is located in a specially built exterior building.
In the latter there are 4 boilers (cascading) that are connected to 3 branch units, characterized by pumps that circulate the hot water in the building to which they are responsible.
HVAC AND RES SYSTEMS
Heat generation system
Natural gas boiler

Page 11
RES systems None
4.3. Builiding automation system
General information about the builging automation system
There is a temperature control thermostat. There are no separate heat accounting systems
or other building automation or home automation systems.
4.4. Recording Energy Consumption
There is no Energy consumption monitoring in the building. The energy and costs have been
elaborated from the energy invoices.
There is no solar generated electricity. (Picture 6, Picture 7) show the monthly consumption
values.
Picture 6 - Average monthly electricity consumptions during a school year [kWhe]

Page 12
Picture 7 - Natural gas consumptions during a school year [Sm3]
The higher demand of both types of energy is clearly visible in winter. While the higher
demand of electricity is influenced in particular by the longer lighting time in winter, the
heating energy demand depends on the weather and/or on the outside temperature.
The following figure (Picture 8) shows the relationship between the average outside
temperature and the monthly gas requirement.

Page 13
Picture 8 - Energy signature representation: Natural gas consumptions [Sm3] vs External Temperature [°C]
The share of renewable energies (see Picture 9) is 0 % in the electricity sector. In the heating
system the RES contribute is 0 %.
Picture 9 - Pie Graph of Electrical and Thermal energy consumptions, related to the different energy carriers/fuels or systems [%] in use into the school.

Page 14
4.5. Energy Performance Indicators
General information about energy performance indicators
Energy performance indicators are necessary for comparability with other schools. There are
constant reference values, such as, e.g. the heated area or the volume, or slightly
fluctuating reference variables such as the number of pupils or the working days.
A very important reference is the heating degree-days. Over the past few years, these have
seen a deviation of approx. +/- 12%.
The heating performance indicator in relation to the area and the heating degree-days
therefore allows a consideration of the consumption figures irrespective of the weather.
Table 2 shows the indicators of the examined school.
Table 2 - Energy performance indicators

Page 15
4.6. Energy consumers
The analysis of the energy consumers is intended to show the most important consumption points with the highest potential.
In the case of heat supply, the heat requirement for the domestic hot water supply and the heat demand play a role.
The heat demand for space heating is the sum of the heat loss caused by the transmission of heat through the walls and windows and the heat loss due to the ventilation of the windows minus the solar gains over the window surfaces.
Simplified, the heat required for the shower water is very low (we are in a primary school). In the school building, the fresh air demand is only realized with window ventilation.
The underlying value is therefore based on a fresh air requirement of 30 m³ / h per person. The share of end users for electricity and heat demand is shown in Picture 10.
Picture 10 - Natural gas and electricity consumptions subdivision [%] for each final intended use
The lighting mainly influences the electricity consumption. The electricity requirement of
the electric water heaters on the hand-washing basins is based on the fact that each user
needs an average of about one liter of hot water. The current requirement for the equipment
is set according to the values in Table 3 over the operating days.

Page 16
Table 3 - power and operating time of equipment and machines

Page 17
Picture 11 shows that a share of 99% is used for lighting.
Picture 11 - Electrical consumptions subdivision [%] for each final intended use
5. Ways to improve energy efficient
The following section is concerned to ways to improve energy efficiency.
5.1. Building
General information about the improvement at the buildingside
The exterior walls of the existing buildings correspond to the constructional insulation standard of the builted year. Subsequent insulation of the walls, together with roof insulation, reduces heat losses by 65%.
Windows replacement have not been considered because of the total amount of the costs, referred to the energy saving.
Measure 1: Retrofit the external walls and roof with insulation
The building envelope also offers opportunities for the user to actively contribute to energy saving. For example, sun protection can be used specifically to influence the solar gains: in winter they can reduce heating requirements and counteract heat build-up in the summer. Furthermore, the energy consumption can also be reduced to the necessary extent by means of a demand-oriented window ventilation.

Page 18
Measure
investment costs
energy savings cost
savings return of invest CO2-savings
€ kWh/a €/a a kg (CO2)/a
Retrofit external walls with insulation and retrofit roof
424.419,00 240.876,48 15.054,78 28,19 5.013,24
5.2. Install thermostatic valves
Thermostatic valves on radiators allow you to adjust the temperature on each radiator but especially in each classroom separately.
By this way, you can have the ideal temperature, avoiding waste and taking advantage of free energy supplies such as solar radiation, the presence of many people, and so on. It has been

Page 19
estimated 2% of energy savings on heat demand (natural gas consumption) but in addition to the energy savings the thermostatic valves allow to improve the climate inside the classrooms.
Thermal regulation should be a task of the JEGs (Junior Energy Guardians).
Measure
Investment
costs
€
Energy
savings
kWh/a
Cost
savings
€/a
Return of
invest
a
CO2-savings
to (CO2)/a
Fehler!
Verweisquelle
konnte nicht
gefunden
werden.Install
thermostatic valves 2.235 7.411,58 463,22 4,82 203,97
Measure 2: install thermostatic valves
5.3. Replace light with LED
Replacing current lamps with new LED lamps gives an estimated 57% energy saving as regards electricity consumption. In the case of school, lighting is the almost exclusive cause of electricity consumption.
Even though LEDs reduce power consumption, JEGs can always check that energy is not wasted by illuminating classrooms when they are not used (recreation or lunch time, etc.).
Measure
Investment
costs
€
Energy
savings
kWh/a
Cost
savings
€/a
Return of
invest
a
CO2-savings
to (CO2)/a
Measure 3: replace
light with LED 5.200,00 7.588,15 2.276,45 2,28 1,42
Measure 3: replace existing light with LED

Page 20
5.4. Electrical energy reduction with PV system
The electricity used by the school is totally taken from the national electricity grid. A photovoltaic installation calculated on the possible 100% self-consumption will reduce the energy demand by self-production (when the school is open) and to avoid CO2 emissions because it should be Renewable Energy Source.
Measure
Investment
costs
€
Energy
savings
kWh/a
Cost
savings
€/a
Return of
invest
a
CO2-savings
to (CO2)/a
Fehler!
Verweisquelle
konnte nicht
gefunden
werden.electrical
energy reduction
with PV system 32.000 22.000
6.600,00 3,33 4,11
Measure 4: Photovoltaic system for electricity production

Page 21
6. Timeline for implementation
The implementation of the measures must be adapted to the project duration of energy@school (from July 2016 to June 2018). In Table 4, the implementation of the measures is listed separately in times for planning or data collection and implementation or initiation.
Table 4 - timeline for implementation

Page 22
7. Appendix

Page 23
7.1. Economic efficiency calculation Measure 1: Retrofit the external walls and
roof with insulation
Page 24
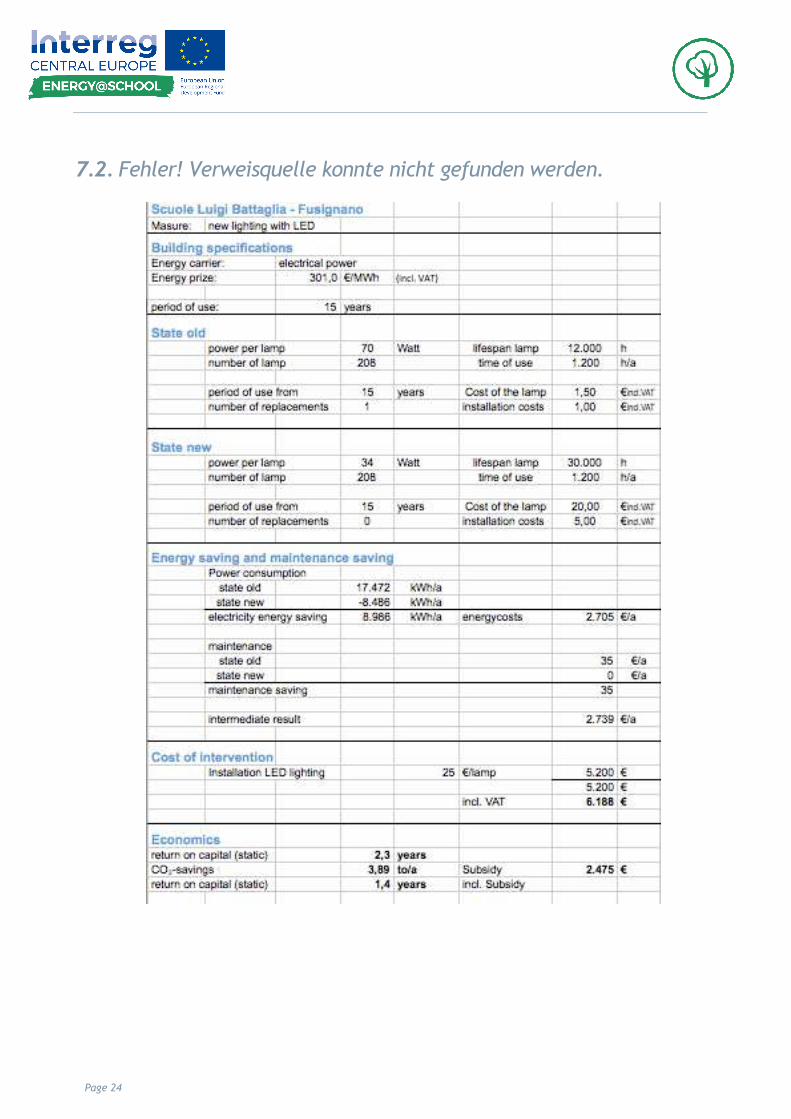
7.2. Fehler! Verweisquelle konnte nicht gefunden werden.

http://www.interreg-central.eu/Content.Node/ENERGYATSCHOOL.html
Edited by Unione Bassa Romagna (Rita Ricci and Laura Delpiaz)
In cooperation with Naxta Ltd (Federico Fileni and Giulia Righetti)
N. DELIVERABLE D.T2.1.1 Version 01
06 07 2017
ENERGY AUDIT REPORT PRIMARY SCHOOL "IL CERCHIO"
(BRANCH) FUSIGNANO (RA) REQUIRING DEVELOPMENT OF AN
ENERGY GUARDIAN SMART SCHOOL
MANAGEMENT PLAN
Page 1
Index 1. Background .................................................................................................. 2
2. Summary ..................................................................................................... 4
3. Generalities of the school ................................................................................. 6
4. Description of the current state ......................................................................... 10
4.1. Building ................................................................................................... 11
4.2. Water and energy supply ............................................................................... 12
4.3. Builiding automation system ........................................................................... 12
4.4. Recording Energy Consumption ........................................................................ 12
4.5. Energy Performance Indicators ........................................................................ 15
4.6. Energy consumers ....................................................................................... 16
5. Ways to improve energy efficient ....................................................................... 17
5.1. Building envelope ........................................................................................ 17
5.2. Install thermostatic valves ............................................................................. 19
5.3. Replace light with LED .................................................................................. 19
5.4. Install Energy Saving Switch and Presence Sensors ................................................. 20
5.5. Electrical energy reduction with PV system ......................................................... 20
5.6. Install a solar thermal system ......................................................................... 21
5.7. Install building automation system ................................................................... 21
5.8. Change end-user behaviour ............................................................................ 22
6. Timeline for implementation ............................................................................. 24

Page 2
1. Background
In Fusignano (RAVENNA - Italy) there are 4 municipal schools belonging to the "Istituto comprensivo Luigi Battaglia":
1. Scuola Secondaria di primo grado "Emaldi" 2. Scuola primaria "Luigi Battaglia" - sede 3. Scuola primaria - succursale 4. Scuola dell'infanzia
In 3 of them, a systematic inventory was carried out in the autumn of 2016, on the initiative of the European research project energy@school, on the basis of which a comprehensive report of the inventory of each city was prepared (Deliverable D.T1 .1.3, January 30, 2017, edited by CertiMaC, Italy).
The goal of ENERGY @ SCHOOL is to simplify the introduction of smart energy schools. With an integrated approach, teachers and students are trained as Senior and Junior Energy Guardians (EGs).
They are committed to a sustainable increase in the energy efficiency of buildings and an understanding of the appropriate energy consumption ("energy culture") of a school building.
ENERGY @ SCHOOL aims to achieve the following results:
I. Optimization of energy consumption in schools,
II. Concrete and progressive increase of EE and RES use in schools not only thanks to technical application of smart solutions, but also to non-technical factors such as a better management capacity and responsible behavior toward energy use,
III. Increase of capacity of public sector to deal with increase of EE and RES use in schools thanks to strategy, action plans, tools (methods, approaches), trainings, pilot actions defined and implemented within the project,
IV. Increase in managerial and organizational competences as well as in human resources to ensure the progressive and sustainable energy efficiency and renewable energy se in public schools (trainings),
V. Creation of conditions for new job opportunities (trainings), VI. Creation of “energy culture”, thus responsible attitude towards energy use, thanks to
education and raising awareness activities, as it is demonstrated that amount of saved energy can noticeably increase if energy retrofit interventions are associated to behavioral changes.
In the research project, 12 project partners (PP) from seven Central European countries are represented:
PP 1. Union of Municipalities of Low Romagna Region , Lead Partner – Italy

Page 3
PP 2. CertiMaC s.c.r.l. - Italy PP 3. City of Bydgoszcz - Poland PP 4. ENERGY AGENCY OF SAVINJSKA, ŠALEŠKA AND KOROŠKA REGION - Slovenia PP 5. City of Karlovac - Croatia PP 6. University of Bologna - Dept of Industrial Chemistry - Italy PP 7. Municipality of the CITY Szolnok with County Rank - Hungary PP 8. Local Government of Town Újszilvás - Hungary PP 9. City of Stuttgart - Germany PP 10. Klagenfurt - Austria PP 11. Graz Energy Agency - Austria PP 12. City Municipality of Celje - Slovenia
From the examined schools, five schools joined up to be actively involved in energy@school.
These schools receive an individual report on the energy audit with this document. This report is intended to serve as the basis for the development of an energy action plan (Energy Guardian Smart School Management Plans - EGSMPs) to the school's managers and, in addition to inventory analysis, includes investive and non-investive measures for energy saving.
These actions help to develop individual actions in the respective school and a common strategy for smart schools (CSSS).
Further information are available at the following link http://www.interreg-
central.eu/Content.Node/ENERGYATSCHOOL.html

Page 4
2. Summary
The examined school had an average energy performance indicator of electricity of 37,74 kWh/m² per year and 27.09 m3 of natural gas per year for m2. The share of renewable energies in the electricity sector is 0 % in the heating sector 0 %.
Energy Performance Indicators
Total consumpti
on per year
Consumption per volume
Consumption per heated
area
Consumption per number of students
Consumption per number
of days
Total energy consumption
per year
kg CO2 equivalent per year
Tonnes of oil equivalent per year
Energy carrier/Fuel/ Power
source
u.m. u.m. u.m./m3 u.m./m2 u.m./student u.m./day kWh kg CO2 equiv
tep
Electricity kWhel 46085 6,29 37,74 415,18 190,43 46085 19964 9
Natural gas Sm3 33076 4,51 27,09 297,98 136,68 317528 6609 28
Fuel oil/Diesel
t 0 0 0
GPL t 0 0 0
Biomass t 0 0 0
District heating
kWht 0 0 0
District cooling
kWhf 0 0 0
Photovoltaics
kWhel 0 0 0
Solar thermal collectors
kWht 0 0 0
Geothermal
kWht 0 0 0
Other - energy produced
0 0 0 0
Tonnes of oil
equivalent tep
36,27 0,00 0,03 0,33 0,15
26573 36
Table 1 - Energy performance indicators

Page 5
The following measures are recommended for the order of implementation.
Measure
Investment
costs
€
energy
savings
kWh/year
cost
savings
€/year
return of
invest
years
Kg CO2-
savings
to
(CO2)/year
Measure 1: Retrofit external walls with insulation
411.806 (66%)
241.842 17.452 23,6 48.320
Measure 2: install
thermostatic valves 932
(2%)
7.320 534 1,7 1.462
Measure 3: Replace lights
with LED 4.050 4.204 (-57%) 1.009 4 1821
Measure 4: Install Energy
Saving Switch and
Presence Sensors 8.500
(-10%)
740 180 45 320
Measure 5: Install a
photovoltaic system 32.000,00
(-48%)
22.000 5.280 6 9.530
Measure 6: Install a solar
thermal system 2.400 1.600 120 20 33
Measure 7: Install building
automation system
(automatic centralized
control of a building's
heating, ventilation and
air conditioning, lighting…) 30525
(10%)
36361 3421 8,8 8340
Measure 8: Change end-
user behaviour: control
devices stand-by
(monitors, PCs, laboratory
equipment, lights, etc.) 0
(5%)
18.180 1710 0 8340

Page 6
3. Generalities of the school
Figure 1 shows the Primary School "Il Cerchio" in Fusignano (RA). The school building was built in two different steps, the U-shaped central body was built in 1900 and has an accessible basement, while the two lateral wings, subsequently constructed, have the accessible basement. In 1960, the building, which was characterized by a brick-filled masonry, was subjected to several renovation works that mainly affected the floors.
The classrooms (9 in total) are located only on the first floor and are exposed to SUD, while on the ground floor there is a canteen and some spaces dedicated to the polyvalent center that are used as art workshops.
Fig 1 - Primary School "Il Cerchio"
GENERALITIES
GEOGRAPHICAL LOCATION AND WEATHER CONDITIONS
School type Primary
Country Italy
Student age range 6-11
City Fusignano (RA)
BUILDING GEOMETRY
OCCUPATION AND USE OF THE BUILDING

Page 7
Total floor heated area [m2] 1221
Number of students 111
Volume [m3] 7326
Total days of use 242
S/V 0,56
Daily hours of use 7
Total area allocated to classrooms [%] 72%

Page 8
General information about the climate
Picture 2- Graphic representation of monthly average temperature [°C]
Picture 3 - Graphic representation of the Horizontal solar irradiation [Wh/m2/day] per Months. This value is the monthly/yearly average of the sum of the solar radiation energy that hits one square meter in a horizontal plane in one day.

Page 9
General information about the use of the school
Picture 4 shows the school's use profile and the holiday’s period. In total the school comes on
242 days of operation.
Picture 4 - Graphic representation of the user profile during school period [working days/month]
Picture 5 shows the different uses in the school building. 71,5% of the area is allocated to
classrooms. 16,1 % of the area is canteen, 8,6 to bathrooms and 3,8 to laboratories-
Picture 5 - Division of the School areas for intended use [%]

Page 10
4. Description of the current state
General information about the current state
The building is entirely used as a school plexus and energy consumption is due to heating, lighting and power supplies.
Picture 6: average monthly consumption (electricity and gas) during a school year
Page 11
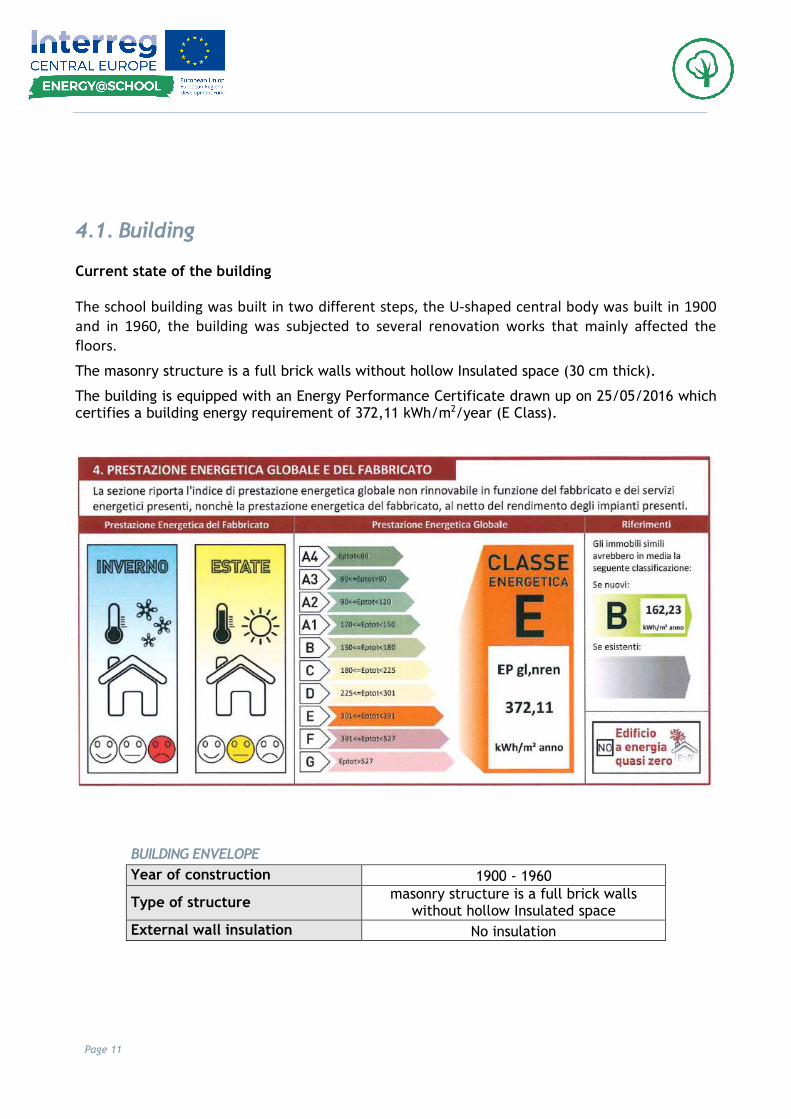
4.1. Building
Current state of the building
The school building was built in two different steps, the U-shaped central body was built in 1900 and in 1960, the building was subjected to several renovation works that mainly affected the floors.
The masonry structure is a full brick walls without hollow Insulated space (30 cm thick).
The building is equipped with an Energy Performance Certificate drawn up on 25/05/2016 which certifies a building energy requirement of 372,11 kWh/m2/year (E Class).
BUILDING ENVELOPE
Year of construction 1900 - 1960
Type of structure masonry structure is a full brick walls
without hollow Insulated space
External wall insulation No insulation

Page 12
4.2. Water and energy supply
Current state of the energy suply
The heating system of the schools is provided by a district heating system whose thermal plant is located in a specially built exterior building.
In the latter there are 4 boilers (cascading) that are connected to 3 branch units, characterized by pumps that circulate the hot water in the building to which they are responsible.
HVAC AND RES SYSTEMS
Heat generation system
Natural gas boiler
RES systems
None
4.3. Builiding automation system
General information about the builging automation system
There is a temperature control thermostat. There are no separate heat accounting systems
or other building automation or home automation systems.
4.4. Recording Energy Consumption
There is monitor Energy consumption for lighting but no monitoring for other energy uses.
The energy and costs have been elaborated from the energy invoices.
There is no solar generated electricity. (Picture 6, Picture 7) show the monthly consumption
values.
Page 13
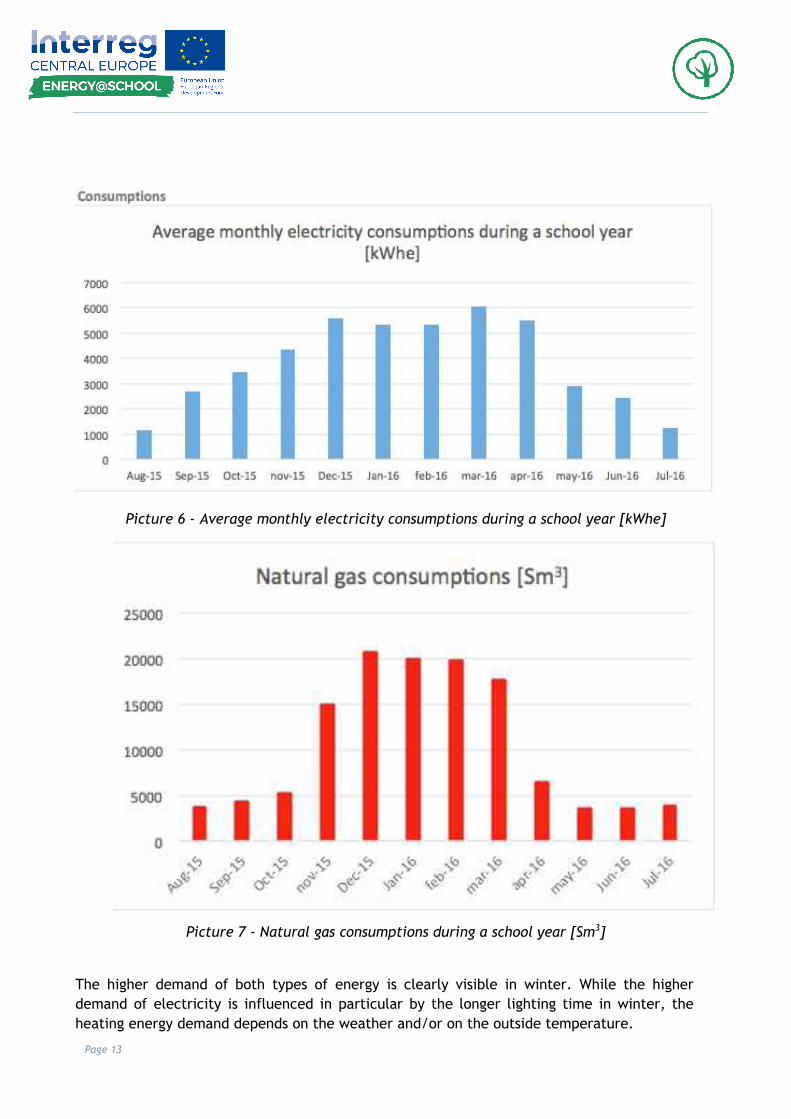
Picture 6 - Average monthly electricity consumptions during a school year [kWhe]
Picture 7 - Natural gas consumptions during a school year [Sm3]
The higher demand of both types of energy is clearly visible in winter. While the higher
demand of electricity is influenced in particular by the longer lighting time in winter, the
heating energy demand depends on the weather and/or on the outside temperature.

Page 14
The following figure (Picture 8) shows the relationship between the average outside
temperature and the monthly gas requirement.
Picture 8 - Energy signature representation: Natural gas consumptions [Sm3] vs External Temperature [°C]
The share of renewable energies (see Picture 9) is 0 % in the electricity sector. In the heating
system the RES contribute is 0 %.
Picture 9 - Pie Graph of Electrical and Thermal energy consumptions, related to the different energy carriers/fuels or systems [%] in use into the school.
Page 15
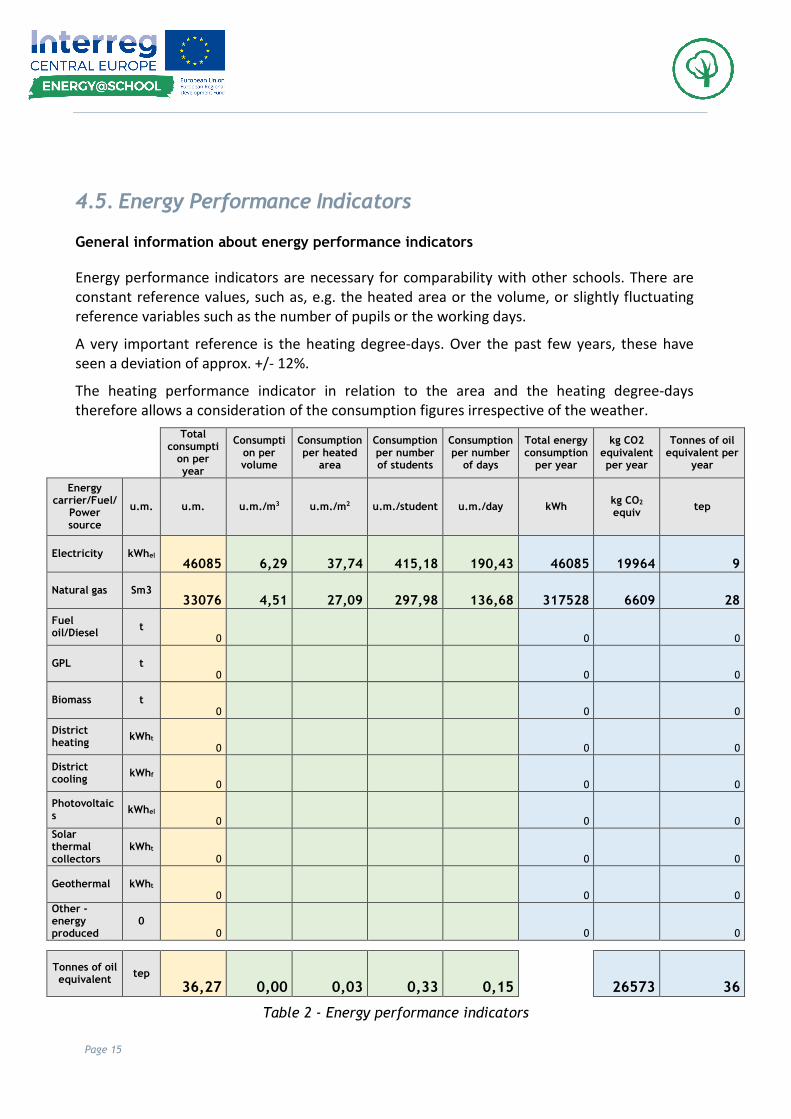
4.5. Energy Performance Indicators
General information about energy performance indicators
Energy performance indicators are necessary for comparability with other schools. There are constant reference values, such as, e.g. the heated area or the volume, or slightly fluctuating reference variables such as the number of pupils or the working days.
A very important reference is the heating degree-days. Over the past few years, these have seen a deviation of approx. +/- 12%.
The heating performance indicator in relation to the area and the heating degree-days therefore allows a consideration of the consumption figures irrespective of the weather.
Total consumpti
on per year
Consumption per volume
Consumption per heated
area
Consumption per number of students
Consumption per number
of days
Total energy consumption
per year
kg CO2 equivalent per year
Tonnes of oil equivalent per
year
Energy carrier/Fuel/
Power source
u.m. u.m. u.m./m3 u.m./m2 u.m./student u.m./day kWh kg CO2 equiv
tep
Electricity kWhel 46085 6,29 37,74 415,18 190,43 46085 19964 9
Natural gas Sm3 33076 4,51 27,09 297,98 136,68 317528 6609 28
Fuel oil/Diesel
t 0 0 0
GPL t 0 0 0
Biomass t 0 0 0
District heating
kWht 0 0 0
District cooling
kWhf 0 0 0
Photovoltaics
kWhel 0 0 0
Solar thermal collectors
kWht 0 0 0
Geothermal kWht 0 0 0
Other - energy produced
0 0 0 0
Tonnes of oil equivalent
tep
36,27 0,00 0,03 0,33 0,15
26573 36
Table 2 - Energy performance indicators

Page 16
4.6. Energy consumers
The analysis of the energy consumers is intended to show the most important consumption points with the highest potential.
In the case of heat supply, the heat requirement for the domestic hot water supply and the heat demand play a role.
The heat demand for space heating is the sum of the heat loss caused by the transmission of heat through the walls and windows and the heat loss due to the ventilation of the windows minus the solar gains over the window surfaces.
Simplified, the heat required for the shower water is very low (we are in a primary school). In the school building, the fresh air demand is only realized with window ventilation.
The underlying value is therefore based on a fresh air requirement of 30 m³ / h per person. The share of end users for electricity and heat demand is shown in Picture 10.
Picture 10 - Natural gas and electricity consumptions subdivision [%] for each final intended use
The lighting mainly influences the electricity consumption. The electricity requirement of the electric water heaters on the hand-washing basins is based on the fact that each user needs an average of about one liter of hot water.
Currently there is no known electrical consumption due to the kitchen appliances and kitchen utensils. To simplify, total electrical consumption has been attributed to lighting, but the development of the project will allow you to measure (by smart meter) the consumption of the canteen and kitchen separately.

Page 17
Picture 11 shows that a share of 99% is used for lighting.
Picture 11 - Electrical consumptions subdivision [%] for each final intended use
5. Ways to improve energy efficient
The following section is concerned to ways to improve energy efficiency.
5.1. Building envelope
General information about the improvement at the buildingside
The exterior walls of the existing buildings correspond to the constructional "non" insulation standard of the builted year. Subsequent insulation of the walls, together with roof insulation, reduces heat losses by 66%.
Windows replacement have not been considered because of the total amount of the costs, referred to the energy saving.
Measure 1: Retrofit the external walls and roof with insulation
The building envelope also offers opportunities for the user to actively contribute to energy saving. For example, sun protection can be used specifically to influence the solar gains: in winter they can reduce heating requirements and counteract heat build-up in the summer time. Furthermore, the energy consumption can also be reduced to the necessary extent by means of a demand-oriented window ventilation.

Page 18
Measure
Investment costs
Energy savings Cost savings Return of invest CO2-savings
€ kWh/a €/a years kg (CO2)/a
Retrofit external walls with insulation and retrofit roof
411.806 (66%)
241.842 17.452 23,6 48.320
Note: the evaluation of the investment doesn't take care of incentives. In affirmative case,
the incentves is 40% of the total costs of the investment.
The graph shows the energy losses through the different components of the building
The graph shows the current energy needs and what would result from the implementation of
the energy efficiency intervention on the envelope.

Page 19
5.2. Install thermostatic valves
Thermostatic valves on radiators allow you to adjust the temperature on each radiator but especially in each classroom separately.
By this way, you can have the ideal temperature, avoiding waste and taking advantage of free energy supplies such as solar radiation, the presence of many people, and so on. It has been estimated 2% of energy savings on heat demand (natural gas consumption) but in addition to the energy savings the thermostatic valves allow to improve the climate inside the classrooms.
Thermal regulation should be a task of the JEGs (Junior Energy Guardians).
Measure 2
Investment
costs
€
Energy
savings
kWh/year
Cost
savings
€/year
Return of
invest
year
CO2-savings
to (CO2)/year
Install
thermostatic
valves 932
(2%)
7.320 534 1,7 1.462
Measure 2: Installation of thermostatic valves
5.3. Replace light with LED
Replacing current lamps with new LED lamps gives an estimated 57% energy saving as regards electricity consumption. In the case of school, lighting is the almost exclusive cause of electricity consumption.
Even though LEDs reduce power consumption, Junior Energy Guardians can always check that energy is not wasted by illuminating the classrooms when they are not busy (recreation or lunch time, ecc.).
Measure 3
Investment
costs
€
Energy
savings
kWh/year
Cost
savings
€/year
Return of
invest
year
CO2-savings
to (CO2)/year
Replace lights with
LED 4.050 4.204 (-57%) 1.009 4 1821
Measure 3: replacement of the light with LED

Page 20
5.4. Install Energy Saving Switch and Presence Sensors
The luminous flux regulators affect the amount of light to be delivered. The adjustment process, called "dimming", adjusts the amount of artificial light according to the amount of light set. A brightness sensor allows you to estimate the amount of light present in the compartment and to reduce the amount of artificial light depending on the presence of natural light, ensuring both an energy-efficient system, but above all a properly illuminated indoor environment depending on the activities that It takes place (studyng, working, ecc.).
The presence sensors, on the other hand, eliminate artificial light delivery if nobody is in the room, bathroom, ecc. This device is really useful for rooms that are used in a non-continuous manner such as bathrooms and storage rooms.
In the school it could also be useful for the classrooms to prevent the lights from turning on when students and teachers go away. This last activity, before the installation of presence sensors, may be carried out by the Junior Energy Guardian.
Measure 4
investment
costs
€
energy
savings
kWh/a
cost
savings
€/a
return of
invest
a
CO2-savings
to (CO2)/a
Install Energy
Saving Switch
and Presence
Sensors 8.500
(-10%)
740 180 45 320
Measure 4: Install Energy Saving Switch and Presence Sensors
5.5. Electrical energy reduction with PV system
The electricity used by the school is totally taken from the national electricity grid. A photovoltaic installation calculated on the possible 100% self-consumption will reduce the energy demand by self-production (when the school is open) and to avoid CO2 emissions because it should be Renewable Energy Source. The cost saving has been calculated with a 0,24 € per kWh of the actual costs, referred to the invoices.
Measure 5
Investment
costs
€
Energy
savings
kWh/year
Cost savings
€/year
Return of
invest
year
CO2-savings
to
(CO2)/year
Install a
photovoltaic
system 32.000,00
(-48%)
22.000 5.280 6 9.530
Measure 5: Photovoltaic system for electricity production

Page 21
5.6. Install a solar thermal system
Solar collectors are devices installed outside the building (usually on the roof). These are elongated tanks that contain water that, thanks to solar radiation, warms up. Heated water is accumulated in a tank and can be used as sanitary hot water without any needing of "energy" to heat it.
In summer time, the use of hot water from the exhaled collector allows the boiler not to activate (avoiding gas consumption) or not to use the electric boilers in the bathrooms (avoiding electricity consumption).
Some built-in systems allow you to use the collector's hot water in synergy with the heating system because, especially in the autumn, during sunny days the collector allows to heat the water thus "working" less the boiler.
As the collector water is heated (for free) from the sun, the produced energy is considered to be produced from a completely renewable source. In addition, sunbathing is completely free.
Measure 6
Investment
costs
€
Energy
savings
kWh/year
Cost
savings
€/year
Return of
invest
year
CO2-savings
to (CO2)/year
Install a solar
thermal system 2.400 1.600 120 20 33
Measure 6: solar thermal system for thermal production (hot water)
5.7. Install building automation system
Building Automation systems allow you to monitor and manage integrated building systems. The main elements handled by automation systems refer to:
• Lighting;
• Heating and cooling;
• Intrusion and safety;
• Sensor presence;
• Fire.
Some of these system, such as lighting and heating, have a direct impact on building energy consumption, and their optimal management allows you to streamline your energy consumption, as well as having a good indoor comfort for studying and working, checking temperature, humidity, air exchange and lighting.

Page 22
The system consists of sensors that control the settled parameters, an electronic control unit that receives sensor data and, based on the fixed settings, sends signals to the respective systems that handle the various functions. The control unit therefore receives data on temperature, illumination level, etc. ... and then asks the boiler or electrical system to attenuate or increase the "energy flow".
These are systems that have both a hardware component (sensors) and a software component (the control unit) and which need to be "customized" to the desired parameters case-by-case.
Measure 7
Investment
costs
€
Energy
savings
kWh/year
Cost
savings
€/year
Return of
invest
years
kg CO2-
savings
to
(CO2)/year
Install building
automation system
(automatic centralized
control of a building's
heating, ventilation
and air conditioning,
lighting…) 30525
(10%)
36361 3421 8,8 8340
Measure 7: building automation system (automatic centralized control of a building's
heating, ventilation and air conditioning, lighting…)
5.8. Change end-user behaviour
Some of our behaviors and habits directly affect the energy consumption of the building, especially at home but also at school.
Acquiring awareness of how our behaviors affect or not affect on energy consumption and indirectly on the environment and climate is one of the main goals of any energy initiative, directive or research initiative.
To get a conscious behavior especially in school age helps to grow people who will mater this behavior and become a spokesman for a culture of sustainability. Specifically, it is to learn how to eliminate waste or to choose one thing rather than another one in function of the impact it generates.
What does it mean to choose to go to school by bike or on foot rather than by car? Is it true that the lights should be turned on because if I turn it off and turn it on, I use more energy? Is it true that computers consume electricity even when they are off?
Awareness helps to understand how much our daily actions affect the environment and how we can reduce our impact (ecological and environmental footprint) to preserve the environment for future generations.

Page 23
Measure 8
Investme
nt costs
€
Energy
savings
kWh/year
Cost
savings
€/year
Return of
invest
years
CO2-savings
to (CO2)/year
Change end-user
behaviour: control
devices stand-by
(monitors, PCs,
laboratory equipment,
lights, etc.) 0
(5%)
18.180 1710 0 8340
Measure 8: Change end-user behaviour: control devices stand-by (monitors, PCs, laboratory
equipment, lights, etc.)

Page 24
6. Timeline for implementation
The implementation of the measures must be adapted to the project duration of energy@school (from July 2016 to June 2018). In Table 3, the implementation of the measures is listed separately in times for planning or data collection and implementation or initiation.
Measure - planning / implementation
school year 16/17 vac school year 17/18 vac school year 18/19 vac school year 19/20
1 2 3 4 5 6 7 8 9 10 11 12 1 2 3 4 5 6 7 8 9 10 11 12 1 2 3 4 5 6 7 8 9 10 11 12 1 2 3 4
Retrofit external walls with insulation
P
I
Thermostatic valves
Replace lights with LED P
I
Install Energy Saving Switch and Presence Sensors
P
I
Install a photovoltaic system P
I
Install a solar thermal system P
I
Install building automation system
P
I
Change end-user behaviour: control devices stand-by (monitors, PCs, laboratory equipment, lights, etc.)
P
I
Table 3 - timeline for implementation

Page 25