Embed Size (px)
Citation preview
ELEKTROTEHNIŠKI VESTNIK 81(1-2): 9-14, 2014
ORIGINAL SCIENTIFIC PAPER
Energy and Economic Yield of Photovoltaic Systems: Reactive-
Power Impact
Kristijan Brecl, Marko Topič
University of Ljubljana, Faculty of Electrical Engineering, Tržaška 25, 1000 Ljubljana, Slovenija
E-pošta: [email protected]
Abstract. The reactive-power service will be or is already obligatory for new grid-connected photovoltaic
systems. The paper investigates the impact of the reactive-power service on the energy yield of a photovoltaic
system and its effect on the inverter sizing and economic yield. Based on simulations and analysis of an operating
photovoltaic system we show that energy losses due to the reactive-power service are low but become notable at
high irradiance levels. Also, the optimal inverter sizing is affected by the reactive-power service more at low
irradiance levels than at the high ones. Nonetheless, economically there is no reason to oversize the inverter due
to reactive power needs. A photovoltaic system with a balanced or slightly larger inverter can provide the
reactive-power service and achieve a little lower but still optimal internal rate of return.
Keywords: reactive power, PV system, energy yield, economic analysis
Energijski in ekonomski donos fotonapetostnega
sistema: vpliv jalove energije
Zagotavljanje pretoka jalove energije bo oziroma je že obveza
obveznost v vseh novih fotonapetostnih sistemih. Članek
obravnava vpliv pretoka jalove energije na energijski donos
fotonapetostnega sistema, na dimenzioniranje razsmernika in
ekonomsko upravičenost. Simulacije in analiza obstoječega
fotonapetostnega sistema je so pokazalapokazale , da ima
jalova energija majhen vpliv na energijski donos sončne
elektrarne, ki pa postane bolj izrazit pri visokih vrednostih
sončnega obsevanja. Optimizacija razsmernika ima večji vpliv
pri nižjih obsevanjih kot pri visokih. Iz ekonomskega vidika ni
potrebe po predimenzioniranju razsmernika zaradi
zagotavljanja pretoka jalove energije. Fotonapetostni sistem z
uravnoteženim ali le nekoliko predimenzioniranim
razsmernikom lahko omogoča pretok jalove energije z
minimalno manjšo interno stopnjo donosa.
1 INTRODUCTION
In an alternating current (AC) system of a linear source
and purely resistive load both the current and voltage
are sinusoidal and in phase. In reality, the loads have
resistive, inductive and/or capacitive load profiles which
lead to a shift of the phase between the current and
voltage. When the voltage and current are not in phase,
two power components (real and imaginary) are present:
active power (measured in Watts) and reactive power
(measured in VArs). The reactive power does not
transfer the energy but is required to maintain the
voltage to deliver the active power over the transmission
lines. The grid-connected photovoltaic (PV) systems
behave more or less as a linear source and do not
produce the reactive power. With the increasing share of
the PV energy in the electric power grid, the demand of
producing the reactive power becomes more and more
justified. Nowadays, most PV inverters cannot produce
the reactive power, but following the new regulations
adopted in the EU countries they will need to be able to
supply the reactive power in the very near future.
In Slovenia since May 2011 [1] and in Germany
since August 2011 [2], all the newly installed PV
systems must be able to supply the grid with the reactive
power. In Slovenia, each newly installed PV system
must be capable to provide the reactive power with a
power factor of 0.8 or dynamically change the reactive
power service. Due to this new regulation, many
installers as well as distributors oversize the inverters to
ensure that all the produced active power is delivered to
the grid. While the industrial consumers in Slovenia
have to pay for the reactive power, the producers are not
eligible to ask for reimbursement for the reactive power
service. The question is whether the PV systems are
able to supply the reactive power without affecting the
system energy yield? If they are, does this have an
impact on the profitability of the investment?
In the paper we are present results of investigating
the reactive-power impact on the energy and economic
yield of the PV systems. We analyse the actual energy
production of a PV system in Slovenia and simulate the
impact of the phase shift with regard to the Slovenian
regulations on the system energy yield. We make to
support investors in their decision making while
complying with the enforced regulations.
Received 9 December 2013
Accepted 12 February 2014

10 BRECL, TOPIČ
2 THEORY OF THE REACTIVE POWER
When the voltage and current are not in phase, we get
two power components: active (P) and reactive power
(Q). The total power is referred to as an apparent power
(S). The relation between the power components shown
in Fig. 1 can be described as:
(1)
Usually, the share of the active power is given by the
cosine of the phase shift between the current and
voltage and is referred to as the power factor (PF):
( )
√ (2)
Figure 1. Active (P), reactive (Q) and apparent (S) power.
The reactive power is required to maintain the voltage
to deliver the active power over the grid. When there is
not enough reactive power, the voltage drops and the
active power cannot be transferred over the grid.
Despite impacting on the voltage grid it, does no useful
work but is mandatory for motors needing the reactive
power to produce the magnetic field for their operation
[3].
In the PV systems, the situation is different. The PV
generator (PV modules) produces the DC power which
is transformed in the inverter to a pure active power.
Presently, most grid-connected inverters do not have the
ability to supply the grid also with the reactive power. If
the inverters can control the reactive power (like SMA,
Kaco…) [4, 5], they usually can supply the power at a
constant power factor by themselves. The variable
power factor according to the output power or the grid
voltage can be controlled only over an external
controller [6, 7]. With the increasing share of the PV
energy fed to the grid, the demand of controlling the
reactive power also in the PV systems [8] will become a
reality and the inverters need to be able to dynamically
control the reactive power [9-11]. In several countries
like Germany and Slovenia, new PV systems must be
able to provide the reactive-power service. The question
of how much this will affect the energy yield of the
system or the profitability of the investment calls to be
thoroughly analysed.
The active-power output of the inverter is the real
part of the product of the current and voltage. If the
current and voltage are out of phase the active power is
lower by the power factor (PF). The same active-power
output, as the one when the current and voltage are in
phase, can be achieved only if the apparent power S is
increased by the inverse value of PF (1/PF). Example:
A 10 kVA inverter feeds the grid with 10 kW of the
active power at a power factor of 1. If a power factor of
0.8 is required and 10 kW of the active power are to be
produced, the inverter should be replaced with a 12.5
kVA nominal power inverter (see Eq. 1 and Fig. 1).
Following the theory, most grid operators as well as
some inverter manufacturers [12] recommend installing
a stronger inverter (with its apparent power (PAC) larger
than the rated DC power (PDC) of the PV generator) to
prevent decreasing the active power due to the reactive-
power service. But since the inverters in a fixed-
positioned (non-tracked) PV system in the Central
Europe operate below their power limit most of the time
(due to the climatic conditions), using a larger inverter
seems to be unnecessary. Braun [13] shows that a PV
system is not able to guarantee a 100% availability of
the reactive power in Germany without oversizing the
inverter or reducing the active power. However, at a
rated PV generator power (PDC) vs. the nominal inverter
power (PAC) ratio of 1 and at a power factor of 0.8, it is
able to guarantee more than 99.9 % of the required
reactive power without reducing the active power. To
estimate the impact of the reactive-power service on the
PV system and to find an optimal PV system (optimal
PDC/PAC) in view of the energy or economic yield,
comprehensive energy and economic yield analyses
have to be carried out with the respect to the local
climatic conditions, feed-in tariff and investment costs.
3 ENERGY LOSSES DUE TO REACTIVE
POWER SERVICE
3.1 Simulation
To investigate the impact of the reactive-power supply
on the PV system energy yield (Ypv), one can either
simulate the solar irradiance in a given plane of array or
take the measured solar irradiance data. The simulated
solar irradiance data are based on averaged 10-year
observations and normally given on an hourly basis,
which leads to underestimations of the reactive-power
service impact [14]. We therefore decided to use the 5-
minute measured solar-irradiance data. The irradiance
was measured from January 1st, 2011 to December 31th,
2012 in Ljubljana, Slovenia. To extend the simulation
results also to the areas outside the Central Europe we
simply multiplied the irradiation intensity by a
corresponding factor and presented the results with the
yield factor of a PV system.
To calculate the PV power, we used a typical model
of a wafer-based multicrystalline silicon PV module.
For the simulation model to be as accurate as possible,
we used the measured module temperature for the same
period of time. The PV system output power at different
irradiation levels was calculated as:
ENERGY AND ECONOMIC YIELD OF PHOTOVOLTAIC SYSTEMS: REACTIVE-POWER IMPACT 11
( ( )) (3)
where N is the number of modules, Hpoa is irradiance in
the plane of array, γ is the PV module power
temperature coefficient and ηDC, ηinv, ηDC are the
efficiency on the DC side (mismatch losses, DC cabling
losses, etc.), inverter efficiency and efficiency on the
AC side (AC cabling losses), respectively. The impact
of the inverter was modelled with the SMA STP-
17000TL inverter efficiency curve. The maximum
output power (Pmax) was limited by the inverter nominal
output power (Snom).
The simulated system was based on an actual PV
system sited on the roof of the Faculty of Electrical
Engineering of the University of Ljubljana (46.07° N,
14.52° E). The PV system consists of 75 modules with a
rated power of 233 W each, resulting to the total rated
DC power of 17475 W. The system uses a single three-
phase inverter SMA STP-17000TL with the nominal
DC input power of 17600 W and the nominal AC
apparent power of 17000 VA.
In our simulations we didn’t use the actual power of
the module but artificially changed the DC to the AC
power ratio (PDC/PAC) of the PV system in discrete steps
from 0.7 to 1.6. Following the SunnyDesign
calculations, the technical PDC/PAC limit of the STP-
17000TL inverter with 233 W PV modules is 1.58.
To calculate the energy losses due to the reactive-
power service and due to the output capped inverter PAC
power, we first calculated the PV system reference
yield, where the reactive power service (PF = 1) and the
inverter apparent power limit were neglected. The yield
losses were then calculated with regard to this reference
yield.
The yield losses of the power-balanced system
(PDC/PAC = 1) due to the reactive power service and
apparent power limit of the inverter at PF of 1.0, 0.9
and 0.8 are presented in Figure 2.
Figure 2. Yield losses of a balanced PV system vs. a PV
system yield (PDC/PAC = 1.0).
The inverter apparent-power limit losses are shown with
the blue curve in Fig. 2 (PF = 1.0) and are evident only
at higher yields. The total yield losses (reactive-power
losses and apparent-power limit losses) of a PV system
with a PDC/PAC = 1 in the Central and Northern Europe
(Ypv < 1300 kWh/kW) are below 0.1 % and 1 % at PF of
0.9 and 0.8, respectively. In the Southern Europe as well
as for tracked PV systems in the Central Europe when
the PV system yields can reach the values above 1300
kWh/kW the losses of over 1 % or 5 % can be expected
at PF of 0.8 or 0.9, respectively.
If the inverter is undersized (PDC/PAC > 1) the energy
losses due to reactive power service as well as due to
the power capping to Snom, become very prominent. The
losses at PDC/PAC = 1.5, close to the inverter limit, are
shown in Fig. 3.
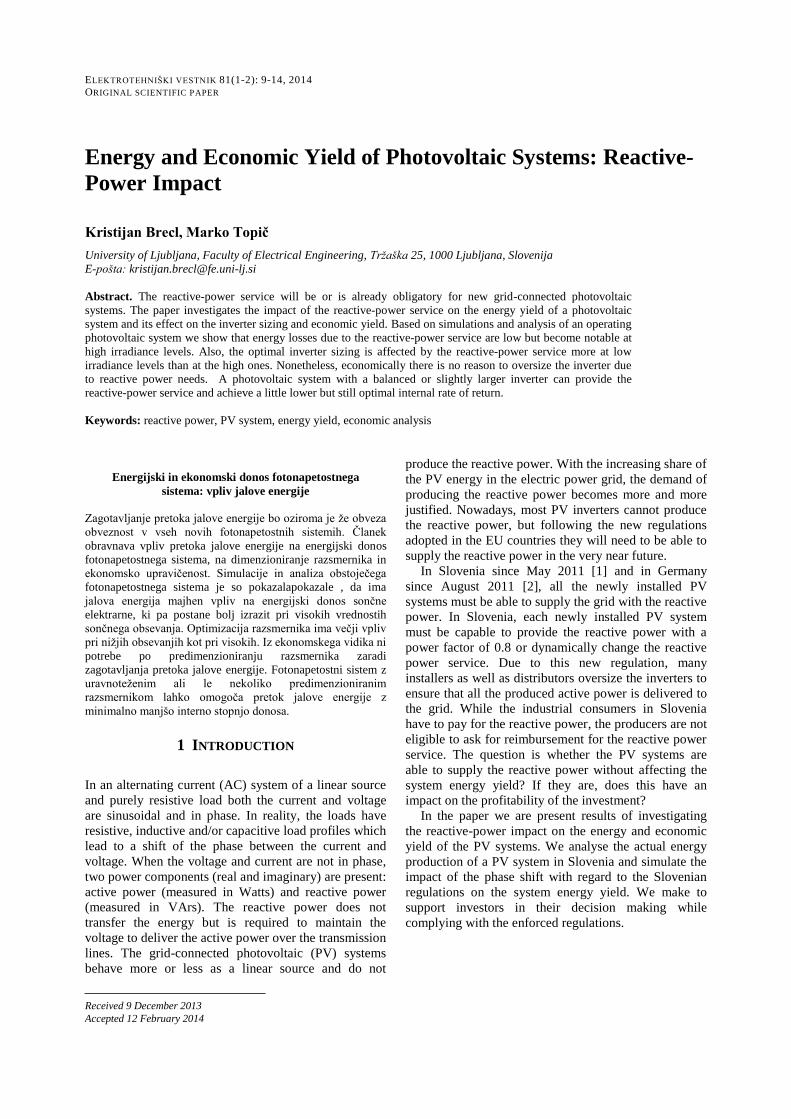
Figure 3. Yield losses of a balanced PV system vs. a PV
system yield (PDC/PAC = 1.5).
At a yield of 1100 kWh/kW and PDC/PAC of 1.5, the
energy losses due to the inverter apparent-power limit
are around 1 %. When the reactive-power service at PF
of 0.9 is required, an additional 2.5% energy loss must
be taken into account. At PF of 0.8, the total energy loss
is over 8 %.
3.2 Energy losses of a real PV system
The PV system capability of handling the reactive
power was also analysed on a real 17.5 kW PV system
operating in Ljubljana, Slovenia. The PV system
installed on the roof of the Faculty of Electrical
Engineering is oriented 25° east (from south) with an
inclination angle of 30°. The rated power on the DC
side is by 2.8 % greater than the nominal apparent
output power of the inverter (PDC/PAC = 1.028). The
output power of the inverter is monitored at 5 minute
intervals. The system produces a pure active power (PF
= 1) and is connected to the internal grid of the Faculty.
The PV system has been in operation since December
2010. The energy yield of the system in 2011 was
1277 kWh/kW.
Compliably with the new reactive-power regulations
in Slovenia [1], any new electricity generating system
must be capable of delivering a reactive power of a
power factor of 0.8. To simulate the impact of the
reactive-power demand on the PV system performance,
we used the 5-minute output-power data from the
inverter and capped them with the limited maximum
active-power output of 13.6 kW, which is the maximum
active-power output of the 17 kVA inverter of a power
factor of 0.8. Comparing the actual energy production of
our system to the capped data, the annual energy loss in
2011 is 0.98 %. This figure is in a good agreement with
the simulation results at the same yield and PDC/PAC
ratio.
0.00%
1.00%
2.00%
3.00%
4.00%
5.00%
6.00%
800 900 1000 1100 1200 1300 1400 1500 1600
Yie
ld lo
ss
Yield (kWh/kW)
PF=1.0
PF=0.9
PF=0.8
0.00%
5.00%
10.00%
15.00%
20.00%
25.00%
700 800 900 1000 1100 1200 1300 1400 1500 1600
Yie
ld lo
ss
Yield (kWh/kW)
PF=1.0
PF=0.9
PF=0.8
12 BRECL, TOPIČ
Besides the fixed power factor, we simulated also the
impact of the reactive-power service when the inverter
is capable to dynamically change the power factor
compliably with the grid voltage [1]. At a dynamic
power factor specified in Ref. [1], the losses of the fixed
PV system due to the reactive-power service are only
0.004 %.
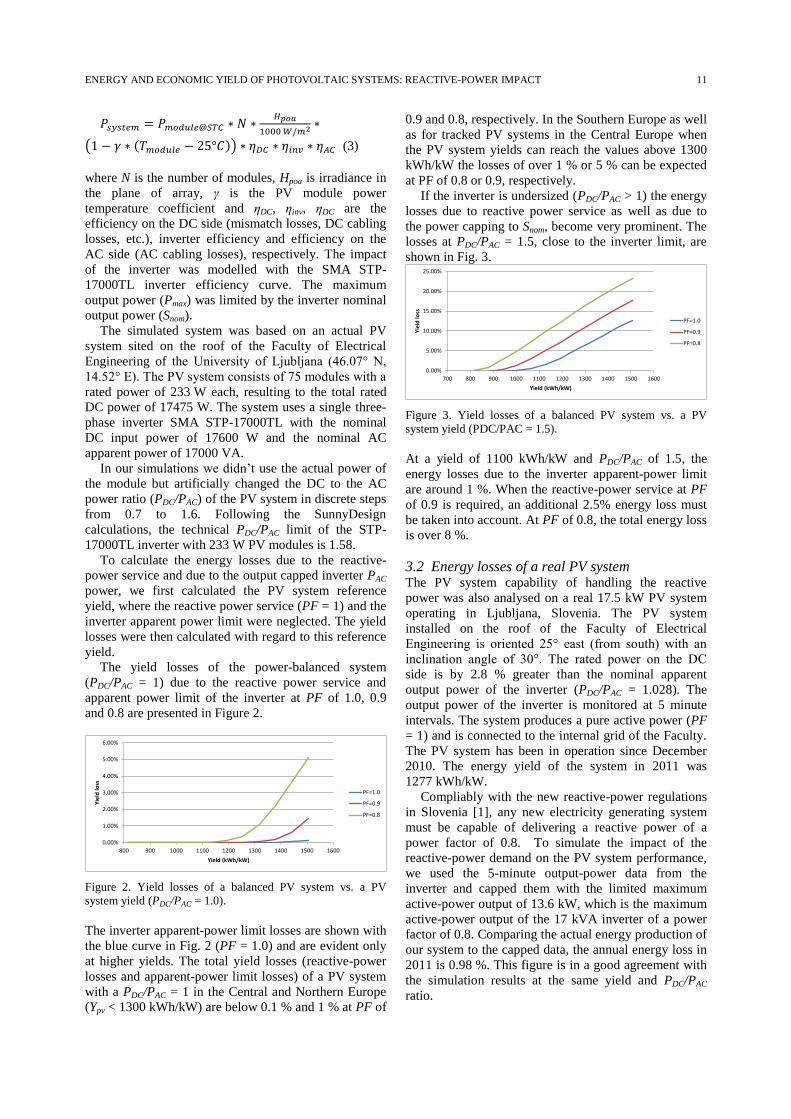
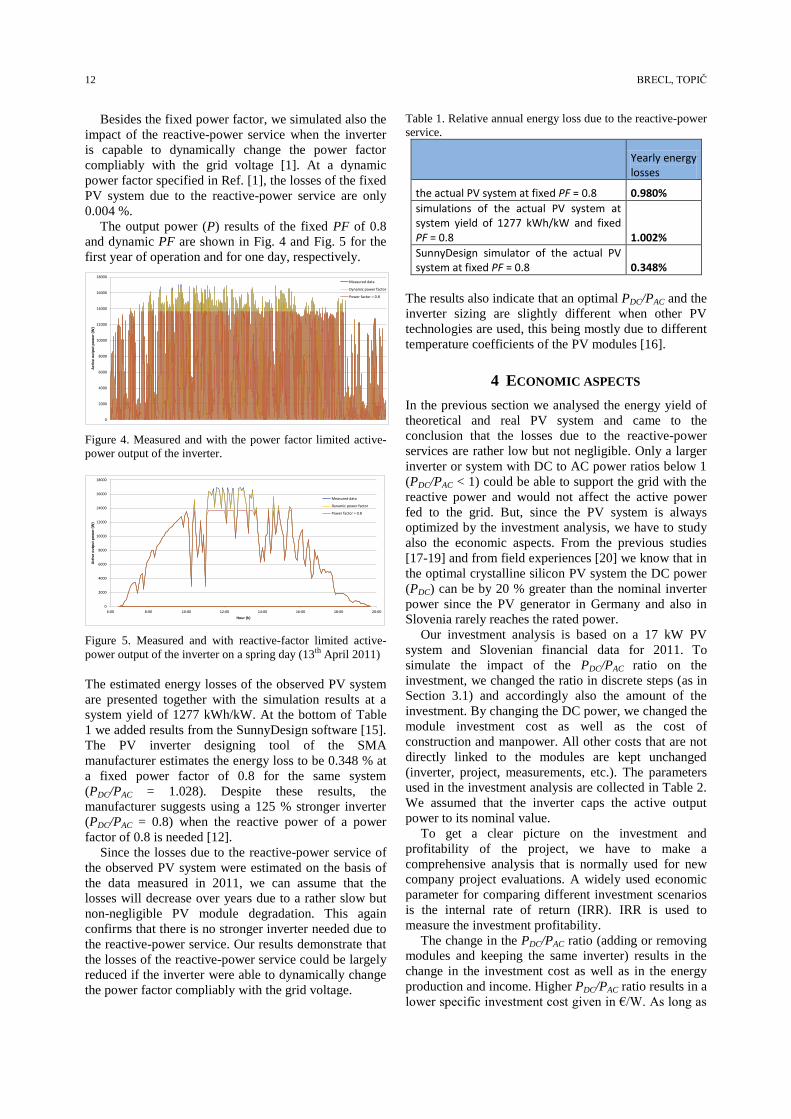
The output power (P) results of the fixed PF of 0.8
and dynamic PF are shown in Fig. 4 and Fig. 5 for the
first year of operation and for one day, respectively.
Figure 4. Measured and with the power factor limited active-
power output of the inverter.
Figure 5. Measured and with reactive-factor limited active-
power output of the inverter on a spring day (13th April 2011)
The estimated energy losses of the observed PV system
are presented together with the simulation results at a
system yield of 1277 kWh/kW. At the bottom of Table
1 we added results from the SunnyDesign software [15].
The PV inverter designing tool of the SMA
manufacturer estimates the energy loss to be 0.348 % at
a fixed power factor of 0.8 for the same system
(PDC/PAC = 1.028). Despite these results, the
manufacturer suggests using a 125 % stronger inverter
(PDC/PAC = 0.8) when the reactive power of a power
factor of 0.8 is needed [12].
Since the losses due to the reactive-power service of
the observed PV system were estimated on the basis of
the data measured in 2011, we can assume that the
losses will decrease over years due to a rather slow but
non-negligible PV module degradation. This again
confirms that there is no stronger inverter needed due to
the reactive-power service. Our results demonstrate that
the losses of the reactive-power service could be largely
reduced if the inverter were able to dynamically change
the power factor compliably with the grid voltage.
Table 1. Relative annual energy loss due to the reactive-power
service.
Yearly energy losses
the actual PV system at fixed PF = 0.8 0.980%
simulations of the actual PV system at system yield of 1277 kWh/kW and fixed PF = 0.8 1.002%
SunnyDesign simulator of the actual PV system at fixed PF = 0.8 0.348%
The results also indicate that an optimal PDC/PAC and the
inverter sizing are slightly different when other PV
technologies are used, this being mostly due to different
temperature coefficients of the PV modules [16].
4 ECONOMIC ASPECTS
In the previous section we analysed the energy yield of
theoretical and real PV system and came to the
conclusion that the losses due to the reactive-power
services are rather low but not negligible. Only a larger
inverter or system with DC to AC power ratios below 1
(PDC/PAC < 1) could be able to support the grid with the
reactive power and would not affect the active power
fed to the grid. But, since the PV system is always
optimized by the investment analysis, we have to study
also the economic aspects. From the previous studies
[17-19] and from field experiences [20] we know that in
the optimal crystalline silicon PV system the DC power
(PDC) can be by 20 % greater than the nominal inverter
power since the PV generator in Germany and also in
Slovenia rarely reaches the rated power.
Our investment analysis is based on a 17 kW PV
system and Slovenian financial data for 2011. To
simulate the impact of the PDC/PAC ratio on the
investment, we changed the ratio in discrete steps (as in
Section 3.1) and accordingly also the amount of the
investment. By changing the DC power, we changed the
module investment cost as well as the cost of
construction and manpower. All other costs that are not
directly linked to the modules are kept unchanged
(inverter, project, measurements, etc.). The parameters
used in the investment analysis are collected in Table 2.
We assumed that the inverter caps the active output
power to its nominal value.
To get a clear picture on the investment and
profitability of the project, we have to make a
comprehensive analysis that is normally used for new
company project evaluations. A widely used economic
parameter for comparing different investment scenarios
is the internal rate of return (IRR). IRR is used to
measure the investment profitability.
The change in the PDC/PAC ratio (adding or removing
modules and keeping the same inverter) results in the
change in the investment cost as well as in the energy
production and income. Higher PDC/PAC ratio results in a
lower specific investment cost given in €/W. As long as
0
2000
4000
6000
8000
10000
12000
14000
16000
18000
Act
ive
ou
tpu
t p
ow
er
(W)
Measured data
Dynamic power factor
Power factor = 0.8
0
2000
4000
6000
8000
10000
12000
14000
16000
18000
6:00 8:00 10:00 12:00 14:00 16:00 18:00 20:00
Act
ive
ou
tpu
t p
ow
er
(W)
Hour (h)
Measured data
Dynamic power factor
Power factor = 0.8

ENERGY AND ECONOMIC YIELD OF PHOTOVOLTAIC SYSTEMS: REACTIVE-POWER IMPACT 13
the inverter output-power limit does not affect the
energy output significantly, we can expect also higher
IRRs.
Table 2: Cost calculation parameters
Module power degradation 0.80 %/year
Feed-in tariff 0.29082 €/kWh
Feed-in tariff period 15 years
Operational cost 25.00 €/kW/year
Cost increase 2.0 %/year
Investment 2.83 €/W
Depreciation 5 years
Profit tax 20 %
Discount rate 6.0 %
IRRs of the PV systems as a function of the PDC/PAC
ratio and energy yield for the case without the reactive-
power service and with it (PF = 0.8 and 0.9) are
presented in Fig. 6. The analysis is based on the adopted
Slovenian feed-in tariff [21] and weather conditions in
Ljubljana, and incorporates a comprehensive cost
calculation with all expenses, module degradation,
reactive-power losses, taxes, etc. (Table 2). The
calculations are made on a 10-year IRR which is an
average expected lifetime of an inverter. A long term
calculation just changes the IRR values while the
observed trends remain the same.
The results show that IRR strongly depends on the
irradiance level and on the PDC/PAC ratio. The optimal
PDC/PAC ratio, in case of a 10-year IRR, depends on the
irradiation level and is higher at lower yields. When no
reactive-power service is required, the highest IRR can
be achieved at PDC/PAC of 1.1 at the PV system yield of
1500 kWh/kW. At lower irradiations, the optimal ratio
moves to higher values until it is limited (at some 1050
kWh/kW) by the inverter technical limits.
The reactive-power service lowers the optimal
PDC/PAC. The impact is more evident at lower irradiation
levels (see the left-hand side of the graphs in Fig. 6).
From the economic analysis we can conclude that in
most cases a better IRR can be achieved at PDC/PAC > 1
even if the reactive-power service is provided by the PV
system. But, since the results strongly depend on the
irradiation level, each PV system has to be analysed
separately with regard to the required power factor and
expected yield value. In the Central and Northern
Europe, where PV system yield is up to some 1200
kWh/kW, the inverters have not been oversized
(PDC/PAC < 1) to provide the reactive-power service
without lowering the profit (Fig. 7 – top). Only in the
southern parts of Europe, where the PV system yields
are above 1400 kWh/kW, a slightly oversized inverter is
suggested to be used when the reactive-power service at
a constant power factor of 0.8 is requested (Fig. 7 –
bottom).
Figure 6. IRR vs. the PV system yield and the PDC/PAC ratio.
Figure 7. Internal rate of return vs. PDC/PAC ratio at 1200
kWh/kW (top) and 1500 kWh/kW (bottom).
PD
C/P
AC
0.8
1.0
1.2
1.4
1.6
PD
C/P
AC
0.8
1.0
1.2
1.4
1.6
Yield (kWh/kW)
900 1000 1100 1200 1300 1400 1500
PD
C/P
AC
0.8
1.0
1.2
1.4
1.6
-4
-2
0
2
4
6
8
10
PF = 1.0
PF = 0.9
PF = 0.8
2.0%
3.0%
4.0%
5.0%
6.0%
7.0%
0.7 0.85 1 1.15 1.3 1.45 1.6
IRR
PDC / PAC
PF=1.0
PF=0.9
PF=0.8
2.0%
3.0%
4.0%
5.0%
6.0%
7.0%
8.0%
9.0%
10.0%
11.0%
12.0%
0.7 0.85 1 1.15 1.3 1.45 1.6
IRR
PDC / PAC
PF=1.0
PF=0.9
PF=0.8

14 BRECL, TOPIČ
5 CONCLUSION
We presente the impact of the reactive-power service
through energy-loss simulations and investment analysis
of the PV systems using the feed-in tariff in Slovenia.
Our simulations based on the actual irradiance data
show that the annual energy loss due to the reactive-
power service is rather low if the PDC/PAC is around 1 or
lower. When the reactive-power service at PF of 0.8 is
required, the energy loss of a PV system with PDC/PAC =
1 is close to 1 % but rises by over 5 % if the DC side is
largely oversized (PDC/PAC = 1.5). The actual energy
loss strongly depends on the actual irradiance levels and
local climatic conditions over the year.
A detailed economic analysis of the PV system with
different PDC/PAC ratios shows that the optimal inverter
size in Slovenia (Central Europe) is around PDC/PAC =
1.3 at a PF of 1 if all economic aspects are taken into
account. When the reactive-power service at PF of 0.8 is
requested, the optimal ratio drops to 1.1 by loosing 0.5
% of the IRR, absolutely. There is also no need to
oversize the inverter for the inverse value of the power
factor to be able to support the grid with the reactive
power. A PV system with PDC balanced to the PAC
power or with a slightly larger inverter is able to provide
the reactive-power service and achieve a little lower but
still optimal internal rate of return.
ACKNOWLEDGEMENT
The authors acknowledge the financial support from the
Slovenian Research Agency (Research Programme P2-
0197)
REFERENCES
[1] Electricity distribution system operator - SODO, “Sistemska
obratovalna navodila za distribucijsko omrežje električne
energije” http://www.sodo.si/druzba_sodo/zakonodaja/sondo (accessed on 5. Apr 2013)
[2] German Association for Electrical, Electronic and Information
Technologies – VDE, Technical standard for the connection and
parallel operation of generators at low voltage levels, VDE-AR-N 4104, Frankfurt, August 2011
[3] Importance of Reactive Power for System
http://electricalnotes.wordpress.com/2011/03 /21/importance-of-
reactive-power-for-system/ (accessed on 5. Apr 2013)
[4] SMA GmbH, Solar Inverters, http://www.sma.de/en/products/solar-inverters.html (accessed on
5. Apr 2013)
[5] Kaco new energy, Solar Inverters, http://www.kaco-
newenergy.com/products/solar-inverters (accessed on 5. Apr 2013)
[6] SMA GmbH, Power reducer box,
http://www.sma.de/en/products/monitoring-systems/power-
reducer-box.html (accessed on 5. Apr 2013)
[7] A. Cagnano, F. Torelli, F. Alfonzetti, E. De Tuglie , Can PV
plants provide a reactive power ancillary service? A treat offered
by an on-line controller, Renew. Energy 36 (2011), pp. 1047-1052.
[8] H. Yu, J. Pan, A. Xiang, A multi-function grid-connected PV system with reactive power compensation for the grid, Solar
Energy 79 (2005), pp. 101-106.
[9] G. Tsengenes, G. Adamidis, Investigation of the behavior of a
three phase grid-connected photovoltaic system to control active and reactive power, Electr. Power Syst. Res. 81 (2011), pp. 177-
184
[10] F.L. Albuquerque, A.J. Moraes, G.C. Guimarães, S.M.R.
Sanhueza, A.R. Vaz, Photovoltaic solar system connected to the electric power grid operating as active power generator and
reactive power compensator, Sol. Energy 84 (2010), pp. 1310-
1317.
[11] L. Hassainea, E. Oliasa, J. Quinteroa, M. Haddadib, Digital power factor control and reactive power regulation for grid-
connected photovoltaic inverter, Renew. Energy 34 (2009), pp.
315–321.
[12] Reactive Power and Grid Integration with SUNNY MINI CENTRAL and SUNNY TRIPOWER
http://files.sma.de/dl/7418/ReactivePower-UEN101310.pdf
(accessed on 5. Apr 2013)
[13] M. Braun, Reactive Power Supplied by PV Inverters - Cost-Benefit-Analysis, 22nd EuPVSEC (2007).
[14] K. Brecl, M. Topič, The influence of the reactive power service
on the PV system energy and economic yield: Case study of
feed-in tariff and investment, 27th PVSEC (2012), pp. 4047-4049.
[15] SMA GmbH, Sunny Design,
http://www.sma.de/en/products/software/sunny-design.html
(accessed on 5. Apr 2013)
[16] A.A. Bayod-Rújula, A. Ortego-Bielsa, A. Martínez-Gracia, Photovoltaics on flat roofs: Energy considerations, Energy 36
(2011), pp. 1996-2010.
[17] B. Burger, R. Rüther, Inverter sizing of grid-connected
photovoltaic systems in the light of local solar resource distribution characteristics and temperature, Sol. Energy 80
(2006), pp. 32-45.
[18] L. Keller, P. Affolter, Optimizing the panel area of a
photovoltaic system in relation to the static inverter – practical results, Sol. Energy 55 (1995), pp. 1-7.
[19] J. Uhu, R. Bründlinger, T. Mühlberger, T. R. Betts, R.
Gottschalg, Optimised inverter sizing for photovoltaic systems in high-latitude maritime climates, IET Renew. Power Generation 5
(2010), pp. 58-66.
[20] T. Stetz, J. von Appen, M. Braun, G. Wirth, Cost-Optimal
Inverter Sizing for Ancillary Services -Field Experience In Germany And Future Considerations, 26th EuPVSEC (2011),
pp. 3069-3074.
[21] Official Gazette of the Republic of Slovenia http://www.uradni-
list.si/1?year=2010& edition=201094 (accessed on 5. Apr 2013)
Kristijan Brecl received his Ph.D. from the Faculty of
Electrical Engineering of the University of Ljubljana in 2001.
Currently he is a senior scientist at the same faculty. His
research interests include solar cells, photovoltaic modules
and systems and irradiation models.
Marko Topič received his Ph.D. from the Faculty of
Electrical Engineering of the University of Ljubljana in 1996.
Currently he is a Full Professor at the University of Ljubljana
and an Affiliate Professor at the Colorado State University.
His research interests include photovoltaic, thin-film
semiconductor materials, electron devices, optoelectronics,
electronic circuits, and reliability engineering. He is the
President of the MIDEM Society and a member of the
Steering Committee of the European Photovoltaic Technology
Platform.