Embed Size (px)
Citation preview
End-of-Life Cycle Product Management
By
Gokhan Usanmaz
M.S. Operations Research & Industrial EngineeringUniversity of Texas at Austin, 1994
B.S. Industrial EngineeringIstanbul Technical University, 1990
Submitted to the Engineering Systems Divisionin partial fulfillment of the requirements for the degree of
Master of Engineering in Logistics
at the
Massachusetts Institute of Technology
June 2000
© 2000 Gokhan UsanmazAll Rights Reserved
The author hereby grants to MIT permission to reproduce and to distribute publicly paperand electronic copies of this thesis document in whole or in part.
Signature of the Author...................Engineering Systems Division
May 5, 2000
Certified by.........................#......James Masters
Executive Director, Master of Engineerin4 in logistics Programhesis Supervisor
Accepted by.........................
MISSAQHUSETTS INSTITUTEOF TECHNOLOGY
JUN 0 1 2000
LIBRARIES
Yossi SheffiDirector, Master of Engin&ring trY Logistics Program
End-of-Life Cycle Product Management
By
Gokhan Usanmaz
Submitted to the Engineering Systems Division on May 5, 2000 in partial fulfillment of
the requirements for the degree of Master of Engineering in Logistics
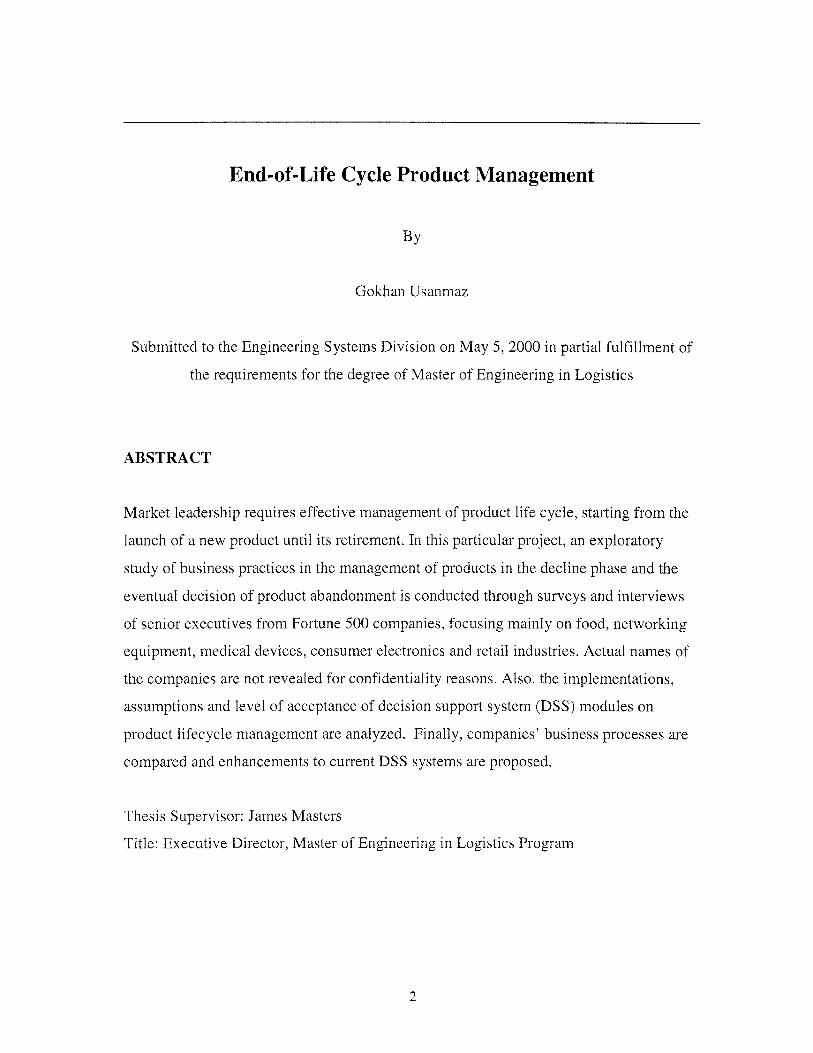
ABSTRACT
Market leadership requires effective management of product life cycle, starting from the
launch of a new product until its retirement. In this particular project, an exploratory
study of business practices in the management of products in the decline phase and the
eventual decision of product abandonment is conducted through surveys and interviews
of senior executives from Fortune 500 companies, focusing mainly on food, networking
equipment, medical devices, consumer electronics and retail industries. Actual names of
the companies are not revealed for confidentiality reasons. Also, the implementations,
assumptions and level of acceptance of decision support system (DSS) modules on
product lifecycle management are analyzed. Finally, companies' business processes are
compared and enhancements to current DSS systems are proposed.
Thesis Supervisor: James Masters
Title: Executive Director, Master of Engineering in Logistics Program
2

Dedication
I would like to dedicate this work to my wife Ebru for her sacrifice, support and love
throughout his studies in MIT. This work would not be materialized without her
patience. She is my greatest inspiration...
I would like to thank our families for all their support and understanding. Particularly, I
wish to acknowledge the influence of my parents on me while they were bringing me up
with the pursuit of perfection, integrity and ultimately being a virtuous person.
I would also like to acknowledge the most helpful guidance of James Masters and
Jonathan Byrnes during this study. It is a privilege to be associated with superb
instructors like them.
3
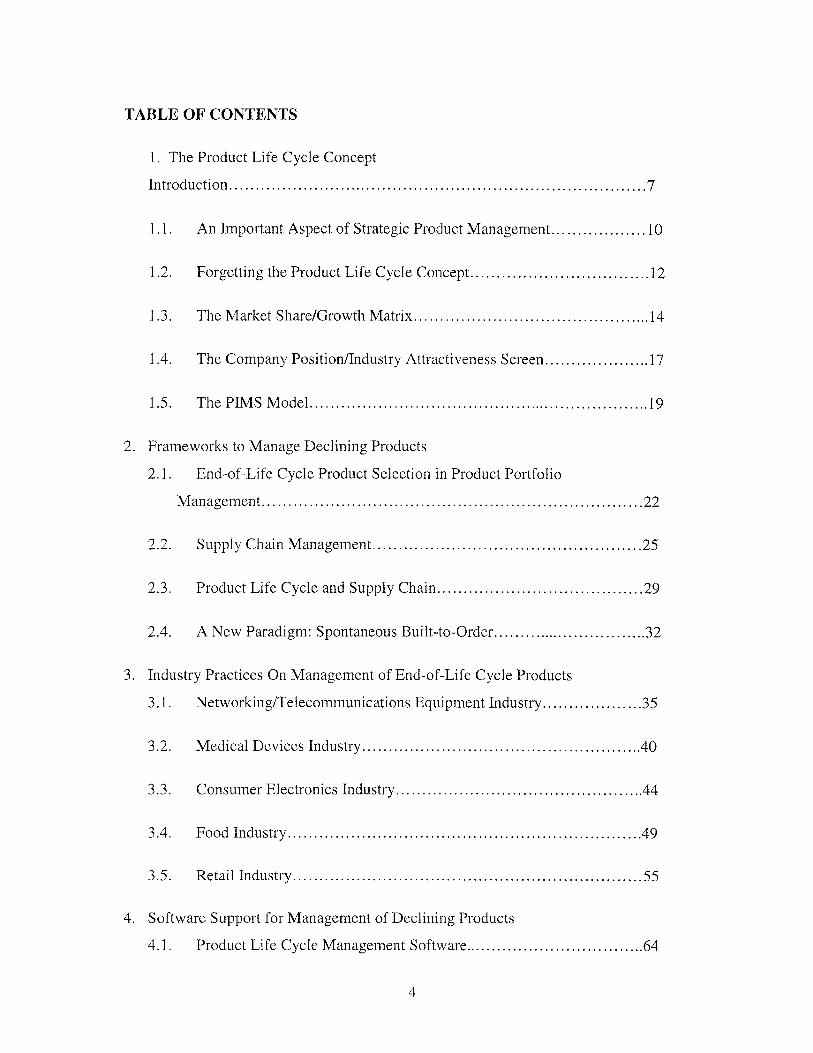
TABLE OF CONTENTS
1. The Product Life Cycle Concept
Introduction ............................................................................... 7
1.1. An Important Aspect of Strategic Product Management...............10
1.2. Forgetting the Product Life Cycle Concept...............................12
1.3. The Market Share/Growth Matrix.........................................14
1.4. The Company Position/Industry Attractiveness Screen................17
1.5. The PTM S M odel.................................................................19
2. Frameworks to Manage Declining Products
2.1. End-of-Life Cycle Product Selection in Product Portfolio
M anagem ent........................................................................22
2.2. Supply Chain Management................................................25
2.3. Product Life Cycle and Supply Chain....................................29
2.4. A New Paradigm: Spontaneous Built-to-Order...........................32
3. Industry Practices On Management of End-of-Life Cycle Products
3.1. Networking/Telecommunications Equipment Industry................35
3.2. Medical Devices Industry.....................................................40
3.3. Consumer Electronics Industry...........................................44
3.4. Food Industry................................................................ 49
3.5. R etail Industry..................................................................55
4. Software Support for Management of Declining Products
4.1. Product Life Cycle Management Software..................................64
4
4.2. Future trends.................................................................. 68
4.3. Proposed Enhancements........................................................70
5. C onclusion ............................................................................. . 72
R eferences.................................................................................. .75
Appendix: End-of-Lifecycle Management Survey Form................................78
5
LIST OF FIGURES AND TABLES
Figure 1. Product Life Cycle Stages of Various Products in Consumer Electronics....10
Table 1. Product Life Cycle Characteristics during Introduction, Growth and Maturity
S tag e s ........................................................................................... . ..11
Table 2. Product Life Cycle Characteristics during Decline and Termination Stages.. 12
Figure 2. Boston Consulting Group's Market Share/Growth Matrix......................15
Figure 3. GE/McKinsey Company Position/Industry Attractiveness Matrix.............18
Figure 4. Misalignment of Demand and Supply During PC Product Life Cycle.........28
Figure 5. Extending Product Life Cycle....... ............................... 33
Figure 6. Web Enabled Distribution Channels of Company A................37
Figure 7. W eb-enabling Company A........................................................ 39
Figure 8. New Product Launch Initiatives Dealing with Chronic Excess Inventory....42
Figure 9. ECR Improvement Concepts.....................................................54
Figure 10. Reaching to customers in Company F........................................56
Figure 11. Supply Chain Management at Company F...................................57
Figure 12. Evaluation for Decision Support Tools........................................68
Figure 13. Declining Product Management Business Process............................73
6

1. THE PRODUCT LIFE CYCLE CONCEPT
INTRODUCTION
The final phase of a product's life, which is as important as its introduction to market,
must be managed to avoid loss of profits and damaged relationships. For well-
orchestrated product discontinuance, marketing, customer service & support, sales,
supply chain management, manufacturing, and engineering must each play a part in
developing and executing an integrated plan. The potential for excess and obsolescence
must be assessed and mitigated. Having said that, in a business environment where
technological evolution is gaining speed and product proliferation is necessary to satisfy
ever-increasing customer demands, it becomes increasingly difficult to diagnose those
products that are declining. In fact, the lack of management of these types of products,
especially in high-tech, retail and apparel industries, can severely limit the profitability of
companies resulting in obsolete inventories and subsequent write-offs.
A framework of declining product management in a firm could be established as follows:
First, it is important that a set of criteria be established to identify weak products and the
frequency of evaluation. Business strategy, corporate objectives and business
environment should be carefully assessed, and responsible parties should make sure that
the diagnostic measures are aligned with them.
Secondly, all of the firm's SKUs, products and product lines should be evaluated to
determine which ones are in the decline phase of their life cycle using previously
determined metrics and forecasts. At this stage, possible alternate strategies such as
product repositioning should be considered.
Finally, necessary changes should be made in marketing, finance, R&D and ultimately in
supply chain management, with potential removal of the product/product groups. As an
example, a firm may choose to use a different type of materials management or logistics
71
system for the slow-moving items: they can be stocked centrally or transported
differently. Similarly, one may use a simple forecasting policy such as average demand
or try to come up with a probability distribution function for the next forecast. An
abandonment strategy should be chosen amongst a number of scenarios: immediately
dropping, "harvesting" the products without any further investing on them, and soon.
The implementation of Enterprise Resource Planning (ERP) systems in recent years
greatly facilitated the collection of business statistics in companies while allowing them
to run fast and frequent diagnostics on thousands of SKUs. More importantly, the
upcoming DSS modules, that use data provided by those ERP infrastructures, promise an
integrated, cross-functional management of product lifecycle. It is safe to say that
today's powerful servers have enough horsepower to support the ever-demanding DSS
software.
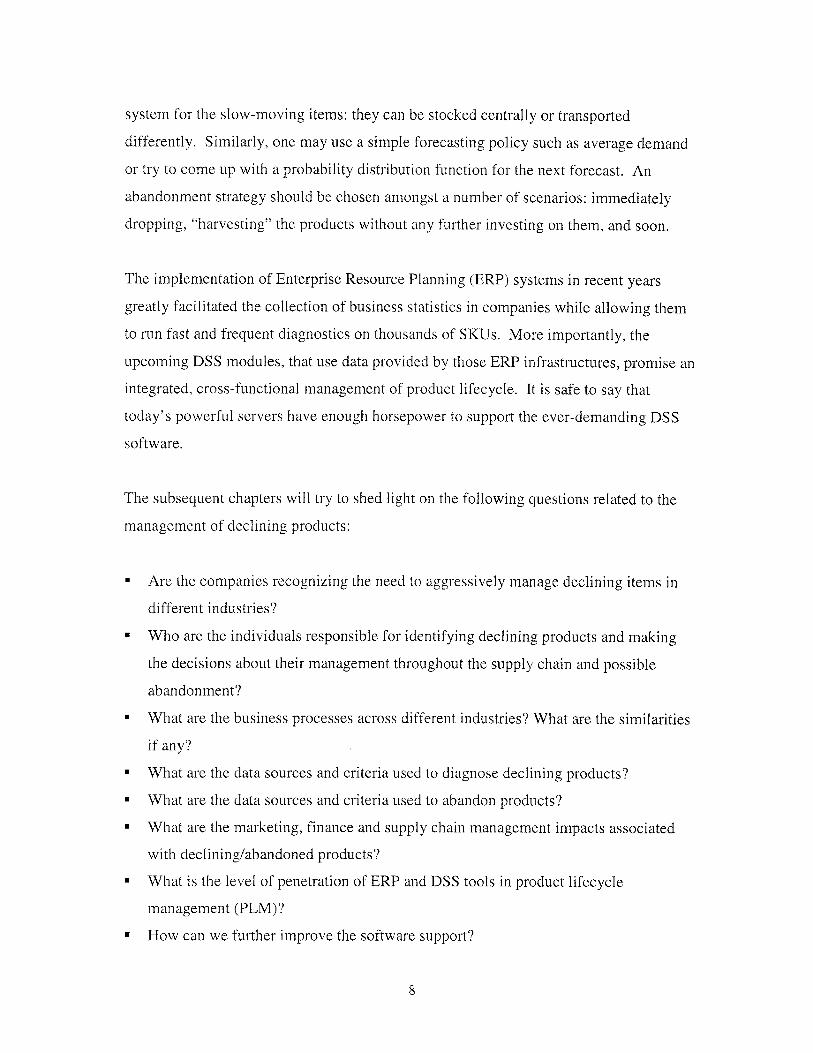
The subsequent chapters will try to shed light on the following questions related to the
management of declining products:
" Are the companies recognizing the need to aggressively manage declining items in
different industries?
" Who are the individuals responsible for identifying declining products and making
the decisions about their management throughout the supply chain and possible
abandonment?
" What are the business processes across different industries? What are the similarities
if any?
" What are the data sources and criteria used to diagnose declining products?
" What are the data sources and criteria used to abandon products?
" What are the marketing, finance and supply chain management impacts associated
with declining/abandoned products?
" What is the level of penetration of ERP and DSS tools in product lifecycle
management (PLM)?
" How can we further improve the software support?
8
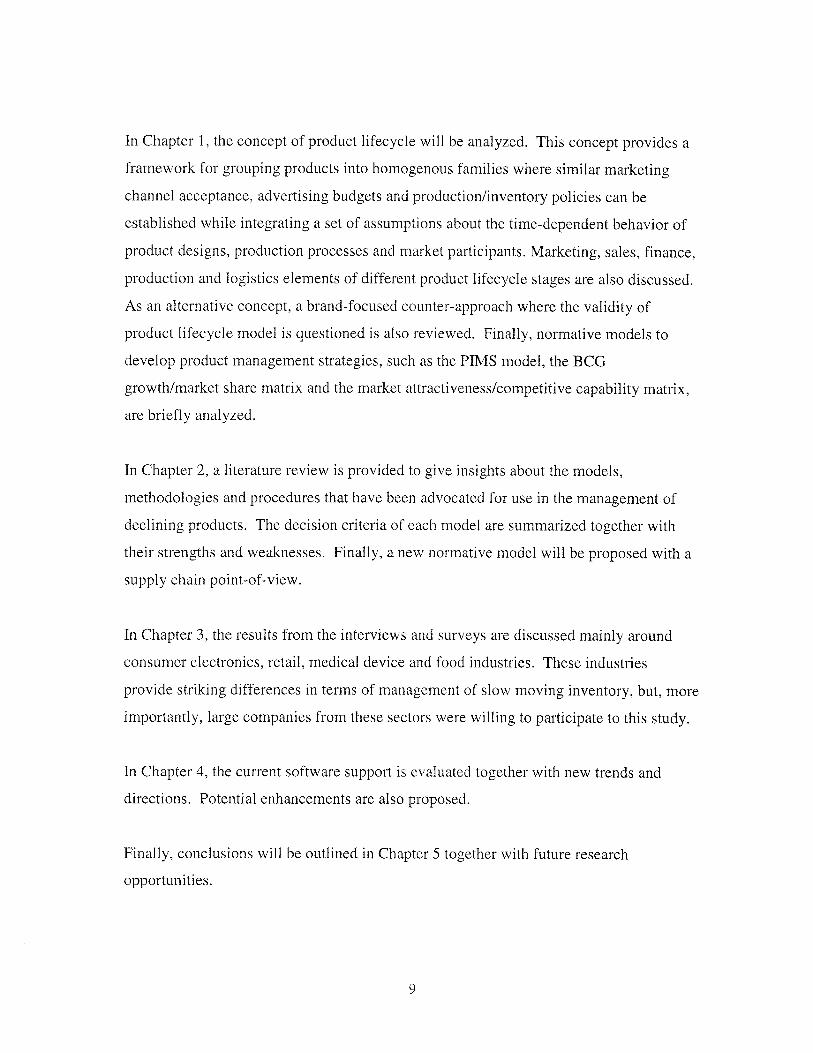
In Chapter 1, the concept of product lifecycle will be analyzed. This concept provides a
framework for grouping products into homogenous families where similar marketing
channel acceptance, advertising budgets and production/inventory policies can be
established while integrating a set of assumptions about the time-dependent behavior of
product designs, production processes and market participants. Marketing, sales, finance,
production and logistics elements of different product lifecycle stages are also discussed.
As an alternative concept, a brand-focused counter-approach where the validity of
product lifecycle model is questioned is also reviewed. Finally, normative models to
develop product management strategies, such as the PIMS model, the BCG
growth/market share matrix and the market attractiveness/competitive capability matrix,
are briefly analyzed.
In Chapter 2, a literature review is provided to give insights about the models,
methodologies and procedures that have been advocated for use in the management of
declining products. The decision criteria of each model are summarized together with
their strengths and weaknesses. Finally, a new normative model will be proposed with a
supply chain point-of-view.
In Chapter 3, the results from the interviews and surveys are discussed mainly around
consumer electronics, retail, medical device and food industries. These industries
provide striking differences in terms of management of slow moving inventory, but, more
importantly, large companies from these sectors were willing to participate to this study.
In Chapter 4, the current software support is evaluated together with new trends and
directions. Potential enhancements are also proposed.
Finally, conclusions will be outlined in Chapter 5 together with future research
opportunities.
9
1.1 An Important Aspect of Strategic Product Management
The product life cycle can be the key to successful and profitable product management,
from the introduction of new products to profitable disposal of obsolescent products,
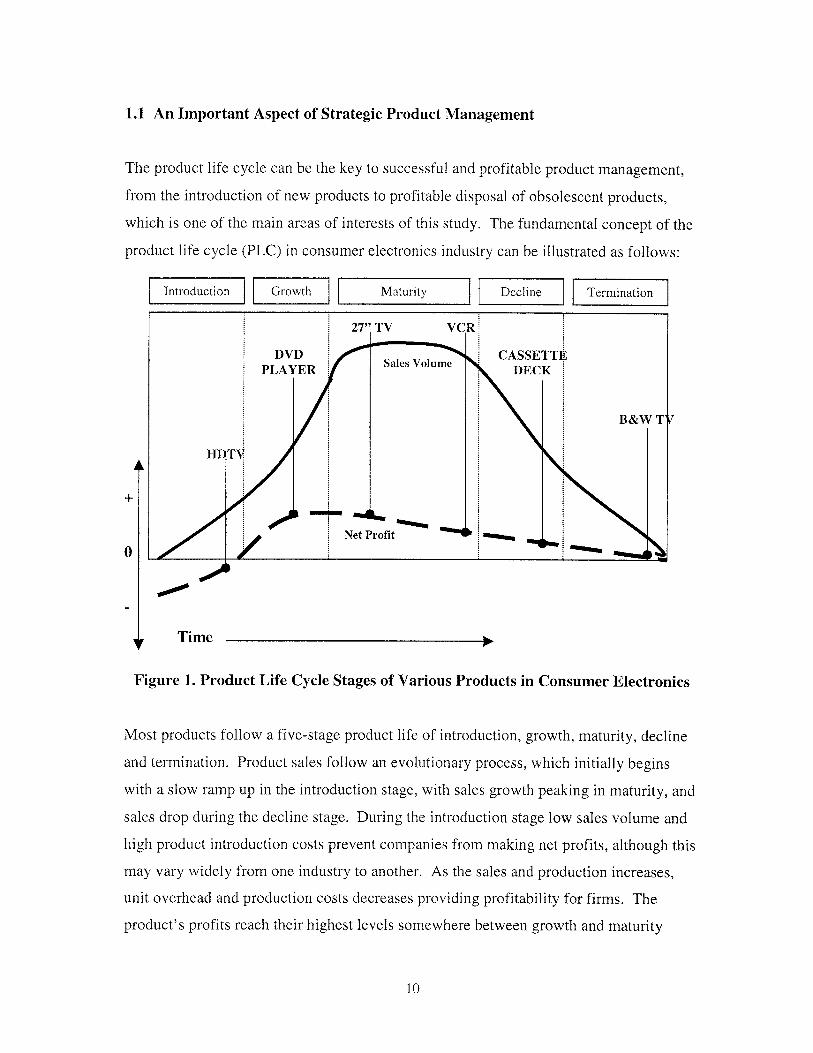
which is one of the main areas of interests of this study. The fundamental concept of the
product life cycle (PLC) in consumer electronics industry can be illustrated as follows:
Introduction Growth Maturity Decline Termination
0
Time _ _ __ _
Figure 1. Product Life Cycle Stages of Various Products in Consumer Electronics
Most products follow a five-stage product life of introduction, growth, maturity, decline
and termination. Product sales follow an evolutionary process, which initially begins
with a slow ramp up in the introduction stage, with sales growth peaking in maturity, and
sales drop during the decline stage. During the introduction stage low sales volume and
high product introduction costs prevent companies from making net profits, although this
may vary widely from one industry to another. As the sales and production increases,
unit overhead and production costs decreases providing profitability for firms. The
product's profits reach their highest levels somewhere between growth and maturity
10
DVDPLAYER
B&WTV
HDTV
27" TV VCR.
CASSETTISales Volume DC
Net Profit ..
A0i.;= Mow
JL-J.AL W
I/A
depending on many factors such as competitors' action, production function
characteristics, quality improvements and customer preferences. In the maturity stage,
the marketing and production costs may increase due to efforts in maintaining the market
share while providing more diversified products. In turn, this may affect the profits in a
negative way and declining profits may cause weak firms to withdraw from the market.
Unless most firms/competitors leave the marketplace, product profitability and sales will
most likely suffer during the decline stage.
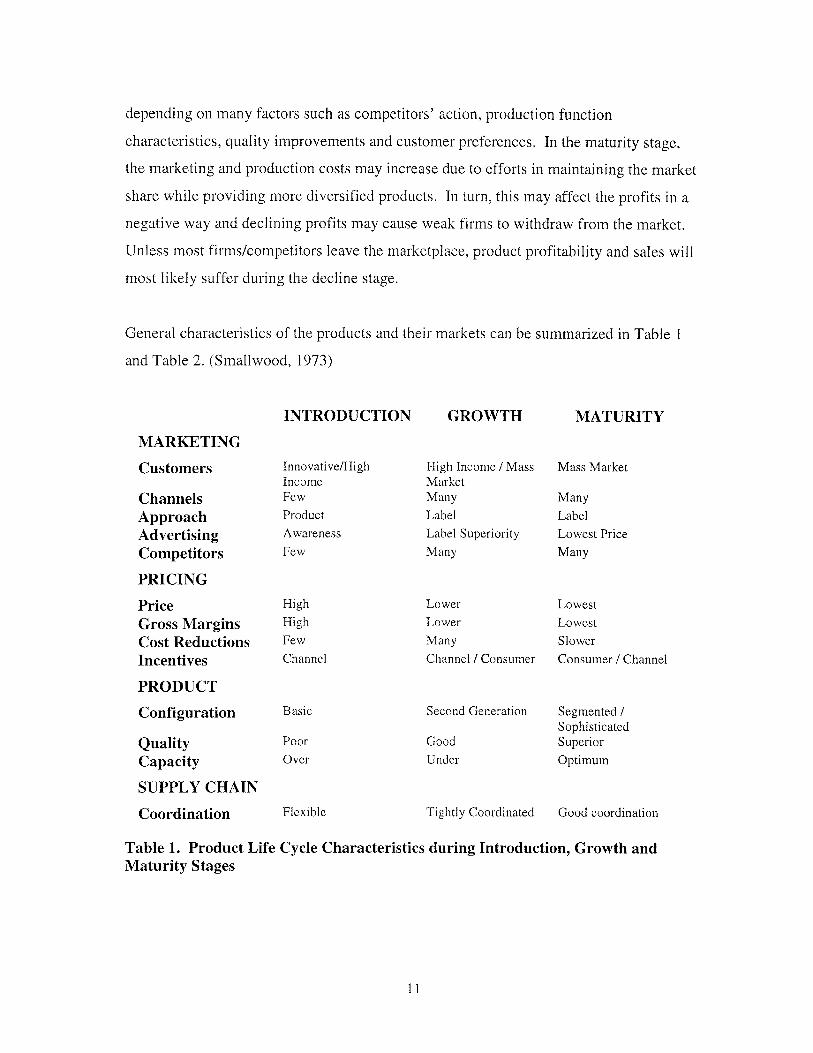
General characteristics of the products and their markets can be summarized in Table 1
and Table 2. (Smallwood, 1973)
INTRODUCTION
MARKETING
Customers
ChannelsApproachAdvertisingCompetitors
PRICING
PriceGross MarginsCost ReductionsIncentives
PRODUCT
Configuration
QualityCapacity
SUPPLY CHAIN
Coordination
Innovative/HighIncomeFewProductAwarenessFew
HighHighFewChannel
Basic
PoorOver
Flexible
GROWTH
High Income / MassMarketManyLabelLabel SuperiorityMany
LowerLowerManyChannel / Consumer
Second Generation
GoodUnder
Tightly Coordinated
MATURITY
Mass Market
ManyLabelLowest PriceMany
LowestLowestSlowerConsumer / Channel
Segmented /SophisticatedSuperiorOptimum
Good coordination
Table 1. Product Life Cycle Characteristics during Introduction, Growth andMaturity Stages
11
TERMINATION
MARKETING
CustomersChannelsApproachAdvertisingCompetitors
PRICING
PriceGross MarginsCost ReductionsIncentives
PRODUCT
ConfigurationQualityCapacity
SUPPLY CHAIN
Coordination
Laggards / SpecialFewSpecializedPsychographicFew
Low / RisingLowNoneChannel
BasicSpottyOver
Low
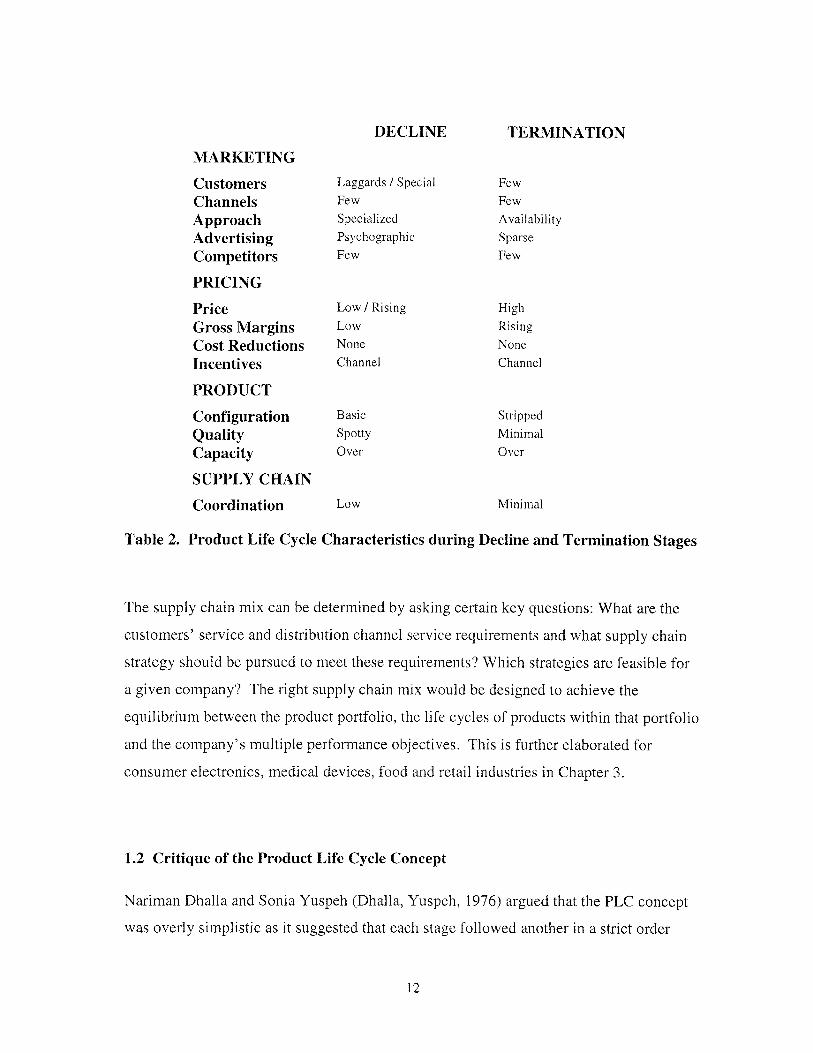
Table 2. Product Life Cycle Characteristics during Decline and Termination Stages
The supply chain mix can be determined by asking certain key questions: What are the
customers' service and distribution channel service requirements and what supply chain
strategy should be pursued to meet these requirements? Which strategies are feasible for
a given company? The right supply chain mix would be designed to achieve the
equilibrium between the product portfolio, the life cycles of products within that portfolio
and the company's multiple performance objectives. This is further elaborated for
consumer electronics, medical devices, food and retail industries in Chapter 3.
1.2 Critique of the Product Life Cycle Concept
Nariman Dhalla and Sonia Yuspeh (Dhalla, Yuspeh, 1976) argued that the PLC concept
was overly simplistic as it suggested that each stage followed another in a strict order
12
FewFewAvailability
SparseFew
HighRisingNoneChannel
StrippedMinimal
Over
Minimal
DECLINE
with predictable lengths. According to them, these conditions were not always satisfied
as some items moved almost directly from introduction to maturity, bypassing the growth
stage while others surged to quick peaks of fashion followed by a quick disappearance
from the marketplace. More importantly, it is not unusual to see that some products are
revitalized after a decline stage through successful promotion, product reengineering and
repositioning.
Many product classes have enjoyed and will probably continue to enjoy a long and
prosperous maturity stage. Ivory soap, Jack Daniels whiskey, Davidoff cigars are
examples for products that have been selling for decades without PLC concerns. In fact,
in the absence of technological breakthroughs especially in consumer packaged goods
and food industries, many product classes appear to be indifferent to PLC pressures as
long as they satisfy consumer needs. One of the most thorough studies to validate the
PLC concept for product classes was carried out in 1967 (Polli, Cook, 1967) and found
that observations on sales of over one hundred product categories in the food, health and
personal-care fields did not follow the expected PLC in most cases. The results strongly
suggested that the PLC concept, when used without careful formulation and testing as an
explicit model, is more likely to be misleading than useful.
Dhalla and Yuspeh suggests that marketing-communications models which measure
quantitatively the influence of different elements on sales, can provide advance warning
signals for declining products; The management that uses them will not be misled by
minor sales aberrations into believing mistakenly that a brand has entered declining stage.
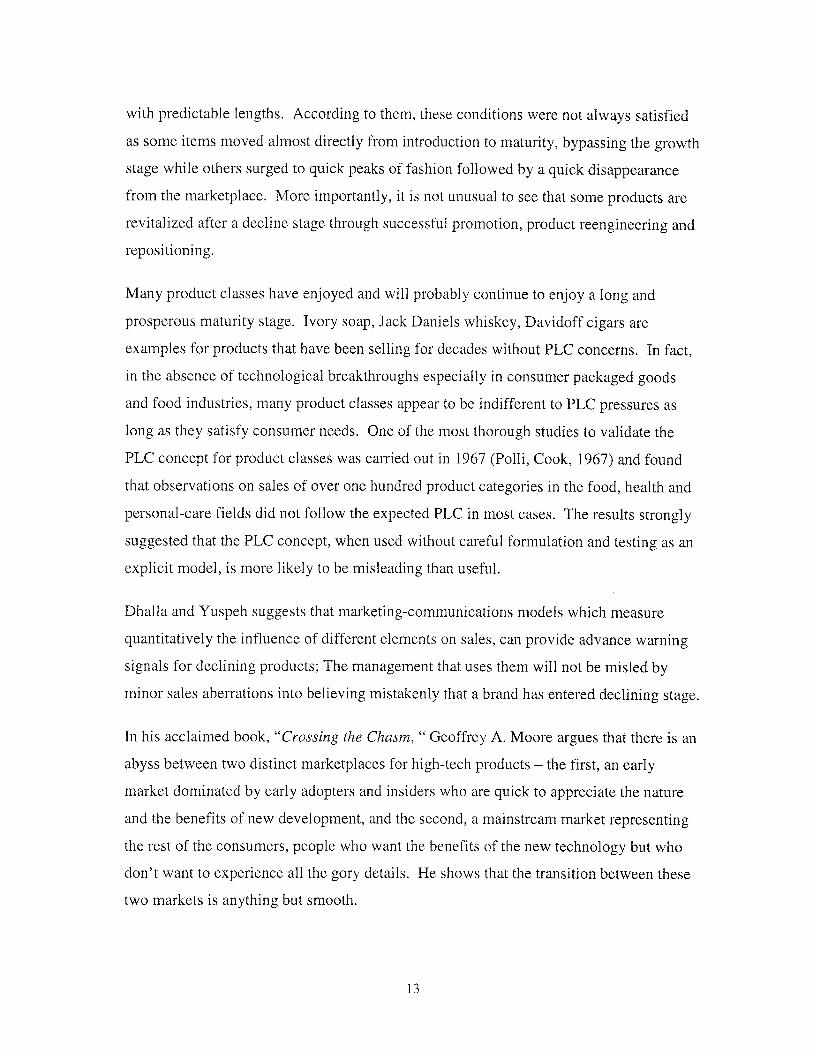
In his acclaimed book, "Crossing the Chasm, " Geoffrey A. Moore argues that there is an
abyss between two distinct marketplaces for high-tech products - the first, an early
market dominated by early adopters and insiders who are quick to appreciate the nature
and the benefits of new development, and the second, a mainstream market representing
the rest of the consumers, people who want the benefits of the new technology but who
don't want to experience all the gory details. He shows that the transition between these
two markets is anything but smooth.
13
Indeed, Moore has brought into focus the reality that at the time when one has achieved
great initial success in launching a new technology product, creating early success in
sales, one must undertake an immense effort and radical transformation to make the
transition to serve the mainstream market. For both buyers and suppliers, continually
changing products and services challenge their ability to absorb and make use of the new
things, and, fundamentally, companies must refocus away from selling products and
toward creating relationships which buffer the shock of change. There is simply too
much change in this domain for anyone to tolerate over the long haul.
Much of what Moore brings up in his book are especially true due to dramatic changes in
business since 1990s. Rapid advances in technology, increasing deregulation and
globalization have changed the environment. To cope with these changes and achieve
superior performance, business leaders are adapting new paradigms that allow their
companies to work more closely with their traditional and new business partners as well
as their competitors. This improved integration is the very essence of the supply chain
management. Supply chain leaders are constantly reevaluating their linkages throughout
their chain and looking at achieving the business process excellence, while breaking
down their functional silos and reorganizing around core logistics-related processes.
One of the main challenges for every management is allocation of resources throughout
their firm, assigning priorities to such functions as product development, acquisition and
product abandonment while giving full consideration to their company's overall
corporate strategy and objectives. One of the ways to deal with this issue is product
portfolio analysis and Boston Consulting Group's (BCG) "Market Share/Growth Matrix"
is the first such method to be discussed.
1.3 The Market Share/Growth Matrix
BCG's market share/growth matrix suggests that individual businesses can have very
different financial characteristics and strategic options depending on how they are placed
in terms of growth and relative competitive position. The main assumption here is that
14
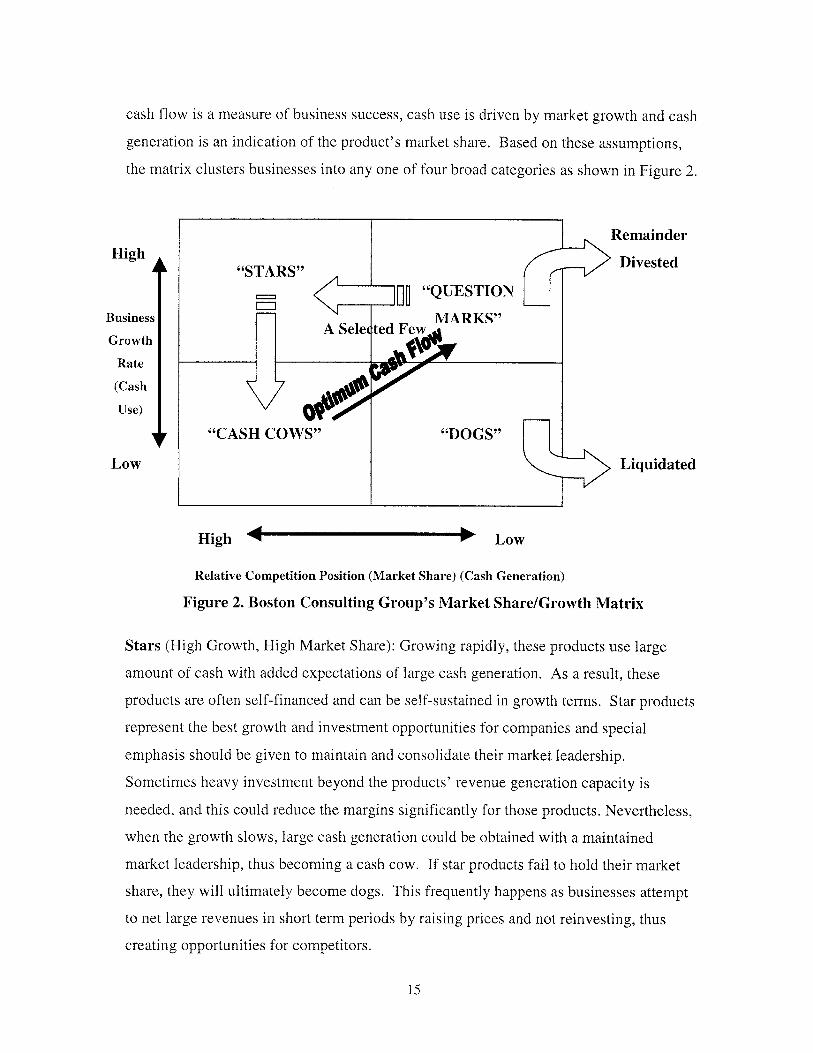
cash flow is a measure of business success, cash use is driven by market growth and cash
generation is an indication of the product's market share. Based on these assumptions,
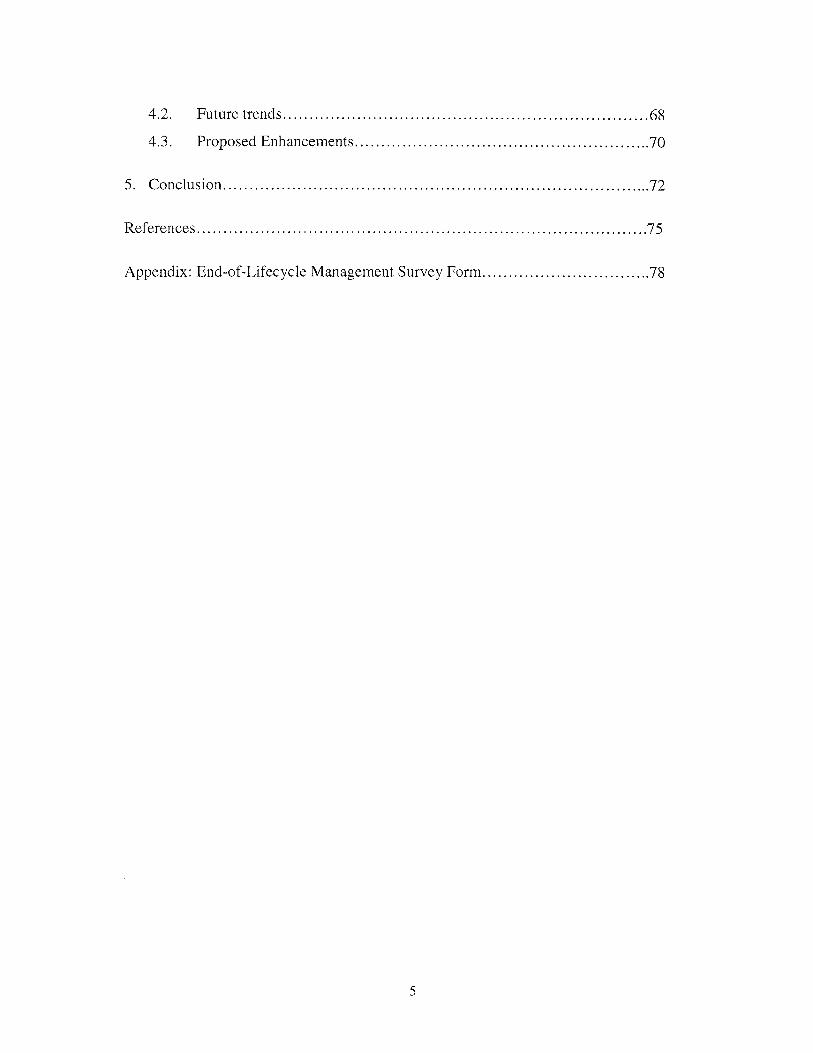
the matrix clusters businesses into any one of four broad categories as shown in Figure 2.
Remainderigh Dvse
"STARS"QDivested
~"QUESTION
sinesC~ A Sele ted Fewowth S t
"CASH COWS"
High W
"DOGS"
Liquidated
"r Low
Relative Competition Position (Market Share) (Cash Generation)
Figure 2. Boston Consulting Group's Market Share/Growth Matrix
Stars (High Growth, High Market Share): Growing rapidly, these products use large
amount of cash with added expectations of large cash generation. As a result, these
products are often self-financed and can be self-sustained in growth terms. Star products
represent the best growth and investment opportunities for companies and special
emphasis should be given to maintain and consolidate their market leadership.
Sometimes heavy investment beyond the products' revenue generation capacity is
needed, and this could reduce the margins significantly for those products. Nevertheless,
when the growth slows, large cash generation could be obtained with a maintained
market leadership, thus becoming a cash cow. If star products fail to hold their market
share, they will ultimately become dogs. This frequently happens as businesses attempt
to net large revenues in short term periods by raising prices and not reinvesting, thus
creating opportunities for competitors.
15
H
Bu
Gr
Rate
(Cash
Use)
Low
-m N O
I ___j
-
Cash Cows (Low Growth, High Market Share): These products have solid market share
and low costs: they are the main revenue generating items for companies. Cash cows pay
the dividends and interest, provide the debt capacity, pay for the company overhead and
provide the cash for investment elsewhere in the company's portfolio of businesses.
They are the building blocks of the company.
Dogs (Low Growth, Low Market Share): It is assumed that their poor competitive
position result in poor profits. Because the growth is slow, there is less incentive to
invest in solutions that will lower product costs and make them more competitive. As the
cash requirements exceeds the potential revenue improvements most of the times, these
products frequently turn out to be "cash traps", likely to absorb cash unless a major
investment is committed. Companies should minimize their exposure to dogs through
product abandonment.
Question Marks (High Growth, Low Market Share): These products are the most
difficult ones to decide upon. Their cash needs are presumably high because of the
market growth, but their cash generation capacity is somewhat limited due to their small
market share. For this type of products, there are usually two alternatives: making the
necessary investments to gain market share or divesting the product/product group. The
first alternative is about funding the business till it achieves market dominance so that it
can become a star and ultimately a cash cow when the business matures. Although large
amount of cash investment is necessary in short term, over the long run, it is the most
viable alternative. On the other hand, if financial backing is unavailable, selling that
portion of the business is the one of the alternatives. It is also possible to milk the
product till it eventually dies, without making substantial investments.
Most companies have their portfolio of businesses scattered all around the matrix.
However, the main goal of the portfolio strategy should be to maintain the position in the
cash cows, and refraining from substantial investments as the market matures. The cash
or profit generated by cash cows should be used primarily to maintain the market
leadership of stars, which are not self-financing most of the time. As the market growth
slows down, the goal is to turn them to cash cows as well. Any remaining funding should
16
be channeled to a selective group of question mark businesses. The remaining question
marks should be liquidated or divested like most of the dogs.
In reality, since usually there is only a limited number of market leaders and because
most markets do mature, most of the products fall into the category of dogs. As
mentioned earlier, such products are usually at a cost disadvantage and have few
opportunities for growth at a reasonable cost. A list of possible actions is as follows
(Day, 1977):
" Focusing on a specialized segment of the market that can be dominated, and protected
from competitive inroads. This segment is usually characterized with government
regulations and other barriers of entry.
- Harvesting, which is conscious cutback of all support costs to some minimum level
which will maximize the cash flow over a foreseeable lifetime-which is usually short.
" Divestment, usually involving a sale as a going concern.
" Abandonment or deletion from the product line.
Strategic attempts to use the market share/growth matrix for resource allocation decisions
emphasize company's preference for a high growth business and the need to maintain
cash balance within the firm. The theoretical or empirical justification for such an
inclination or preference is hard to find according to Wensley. (Wensley, 1981)
1.4 The Company Position/Industry Attractiveness Screen
The GE/McKinsey Company Position/Industry Attractiveness Screen is a method for
determining a product/product group/business' position in terms of the attractiveness of
the industry and its competitive position. Unlike BCG matrix, it is also designed to
ensure short-term financial strength while guiding the firm's resources to growth
opportunities. The basic technique for this analysis involves identifying the main criteria
by which the prospects for a business sector may be judged to be favorable or
17

unfavorable and those by which a company's position in a sector may be judged to be
strong or weak. These criteria are then used to construct separate ratings of "sector
prospects" and of "company's competitive capabilities" and the ratings are plotted on a
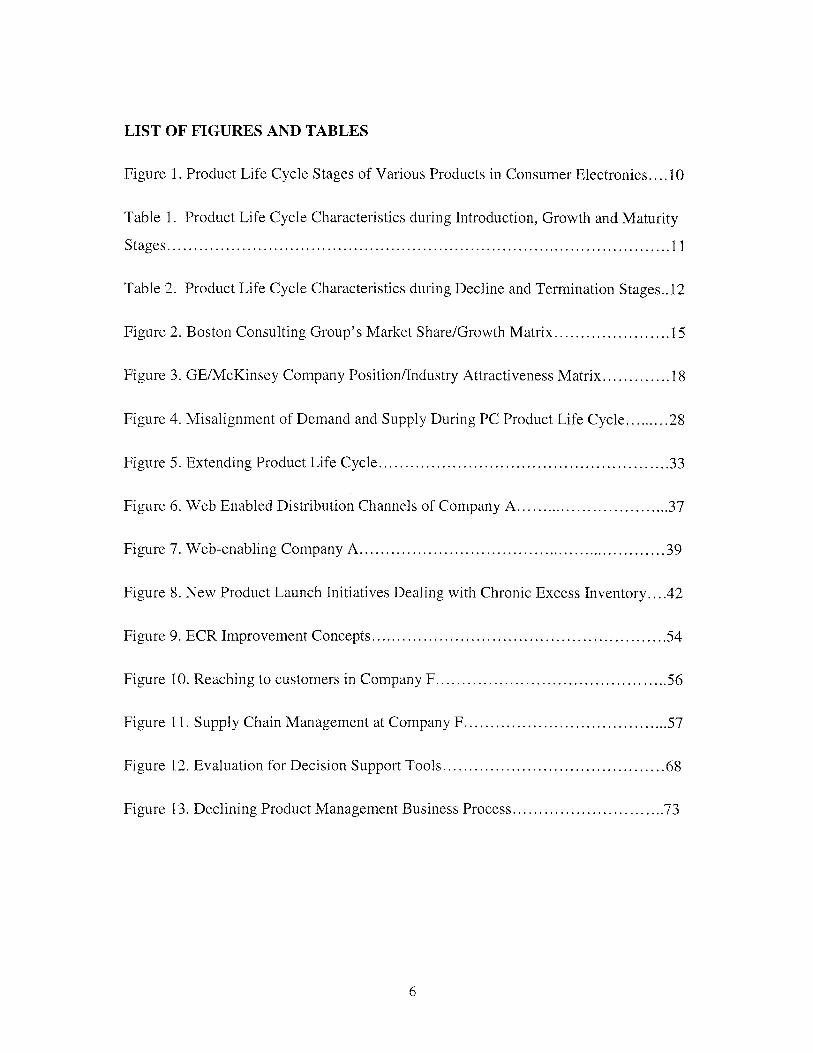
matrix. (Figure 3)
IIndustry AttractivenessI
B fU
SS
tr
n vN
h
'IfAttractive Average Unattractive
Figure 3. GE/McKinsey Company Position/Industry Attractiveness Matrix
Industry Attractiveness determined by:- Size* Market Growth, Pricing- Market Diversity* Competitive Structure* Industry Profitability* Technical Role- Social* Environment* Legal- Human
18
Leader Growth Leader Cash Generator
Investment / Investment /SelectivityGrowth Growth
Trying Harder Custodial Phased
Investment / Growth and Withdrawal
Growth Selectivity / Harvesting
Double or Quit Phased
Selectivity Withdrawal Disinvesting
/ Harvesting Liquidating
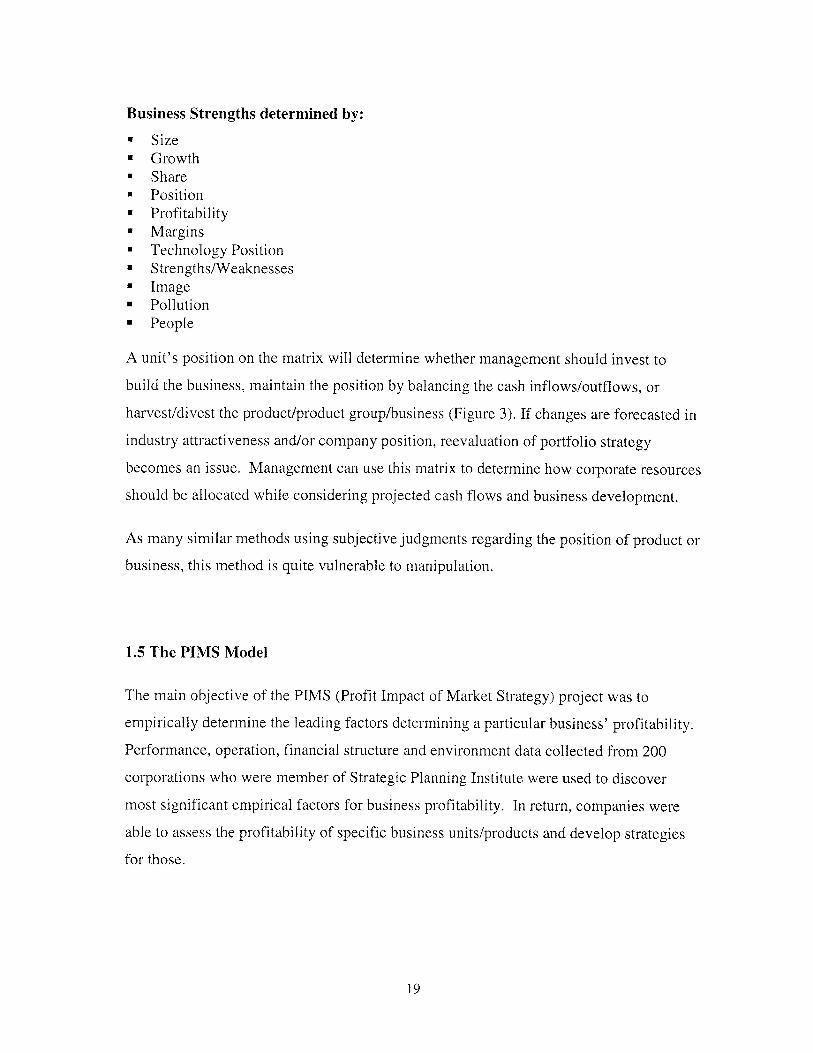
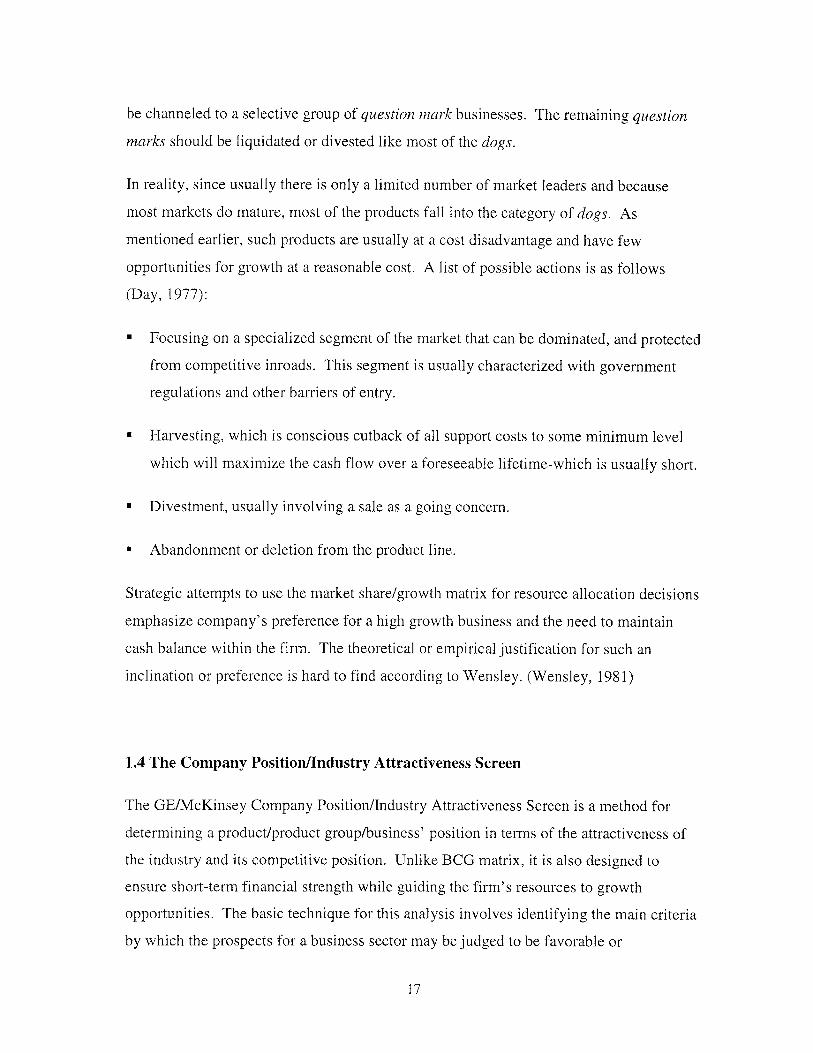
Business Strengths determined by:
" Size" Growth" Share" Position" Profitability" Margins- Technology Position" Strengths/Weaknesses" Image* Pollution" People
A unit's position on the matrix will determine whether management should invest to
build the business, maintain the position by balancing the cash inflows/outflows, or
harvest/divest the product/product group/business (Figure 3). If changes are forecasted in
industry attractiveness and/or company position, reevaluation of portfolio strategy
becomes an issue. Management can use this matrix to determine how corporate resources
should be allocated while considering projected cash flows and business development.
As many similar methods using subjective judgments regarding the position of product or
business, this method is quite vulnerable to manipulation.
1.5 The PIMS Model
The main objective of the PIMS (Profit Impact of Market Strategy) project was to
empirically determine the leading factors determining a particular business' profitability.
Performance, operation, financial structure and environment data collected from 200
corporations who were member of Strategic Planning Institute were used to discover
most significant empirical factors for business profitability. In return, companies were
able to assess the profitability of specific business units/products and develop strategies
for those.
19
Analysis of data concluded that profitability and cash flow of business/product mostly
depended on nine strategic factors. These nine factors were able to explain 80% of the
variability in profits and they are listed according to their importance:
1. Investment Intensity: Technology and the ways of conducting business determine
the amount of fixed and working capital required. Generally speaking, investment
intensity produces a negative impact on profitability or net cash flow.
2. Productivity: Businesses producing more value added per employee are more
profitable than those that produce lower value added per employee.
3. Market Position: Companies with high market share are more profitable.
4. Growth of the Served Market: The served market is the specific segment of the
total potential market in which the business actually competes. Growth was seen to
be favorable to dollar measure of profit, indifferent to percent measures of profit and
negative to all measures of net cash flow.
5. Quality: Quality defined by customers' perception and their evaluation relative to
competitors' products, has an overall positive effect on all financial performance
measures.
6. Innovation and Differentiation: If a business has a strong market position, new
product introductions and extensive R&D efforts seem to enhance the profitability.
7. Vertical Integration: Vertically integrated businesses that operate in mature and
stable markets are observed to be more profitable. The opposite is true when those
companies operate in growing, declining or otherwise changing markets.
8. Cost Push: The rates of increase of wages, salaries, and raw material prices, as well
as the presence of labor unions complicates the nature of the profitability in
companies.
20
9. Current Strategic Effort: Companies who execute their strategy well are good
operators. A good operator can improve the profitability of a strong strategic
position.
During the PI14S effort, Strategic Planning Institute has developed a Par ROI and a Par
cash flow model to help decision-makers with the evaluation of their business
performance and strategic alternatives. These models were essentially linear equations
obtained by multivariate regression analysis and they were used to determine the
expected level of ROI and cash flow given a company's or business unit's strategic
factors under normal circumstances.
Criticism of the PIMS model was mainly targeted towards the specification of Par models
and the interpretation of the results. The fact that one large model was used to describe
the performance of a wide diversity of businesses seems like an oversimplification. But
the most serious problem according to Anderson and Paine (Anderson, Paine 1978) is the
implication that relationships in the model are causal. Nevertheless, PIMS project was
one of the very few strategy research efforts based on empirical research.
Next, models proposed for management of declining products will be reviewed and a new
normative model will be proposed.
21
2. FRAMEWORKS TO MANAGE DECLINING PRODUCTS
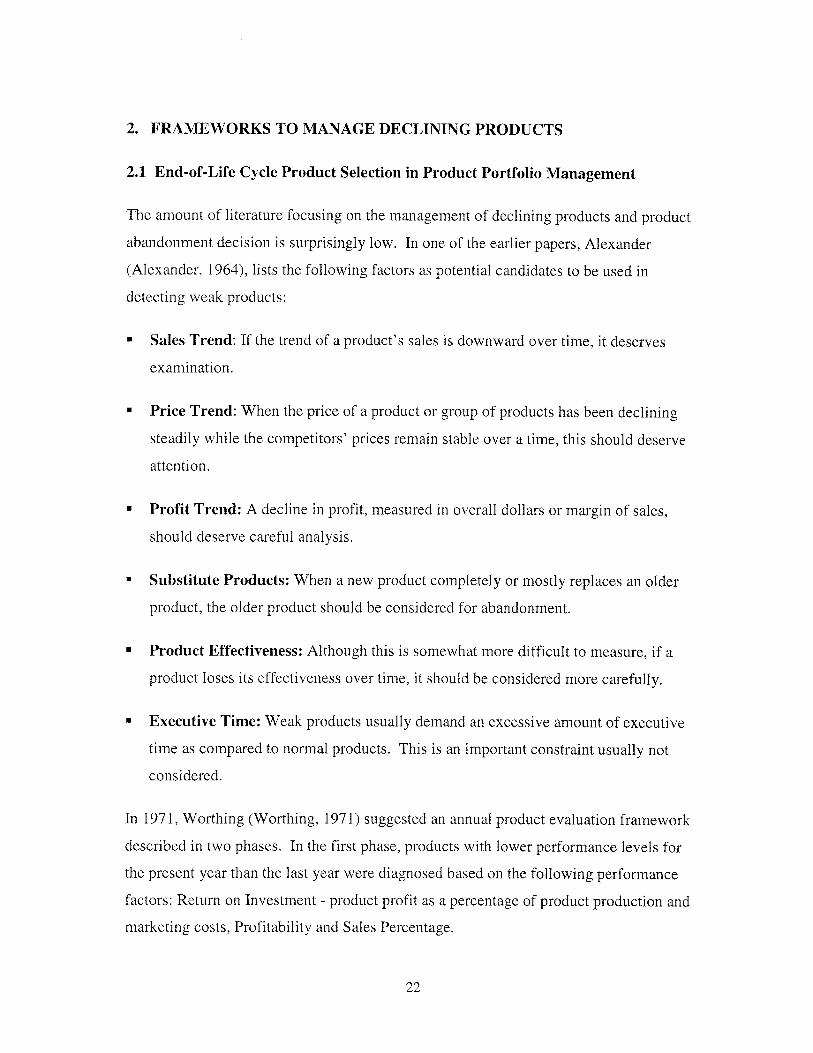
2.1 End-of-Life Cycle Product Selection in Product Portfolio Management
The amount of literature focusing on the management of declining products and product
abandonment decision is surprisingly low. In one of the earlier papers, Alexander
(Alexander, 1964), lists the following factors as potential candidates to be used in
detecting weak products:
" Sales Trend: If the trend of a product's sales is downward over time, it deserves
examination.
" Price Trend: When the price of a product or group of products has been declining
steadily while the competitors' prices remain stable over a time, this should deserve
attention.
" Profit Trend: A decline in profit, measured in overall dollars or margin of sales,
should deserve careful analysis.
" Substitute Products: When a new product completely or mostly replaces an older
product, the older product should be considered for abandonment.
- Product Effectiveness: Although this is somewhat more difficult to measure, if a
product loses its effectiveness over time, it should be considered more carefully.
- Executive Time: Weak products usually demand an excessive amount of executive
time as compared to normal products. This is an important constraint usually not
considered.
In 1971, Worthing (Worthing, 1971) suggested an annual product evaluation framework
described in two phases. In the first phase, products with lower performance levels for
the present year than the last year were diagnosed based on the following performance
factors: Return on Investment - product profit as a percentage of product production and
marketing costs, Profitability and Sales Percentage.
22
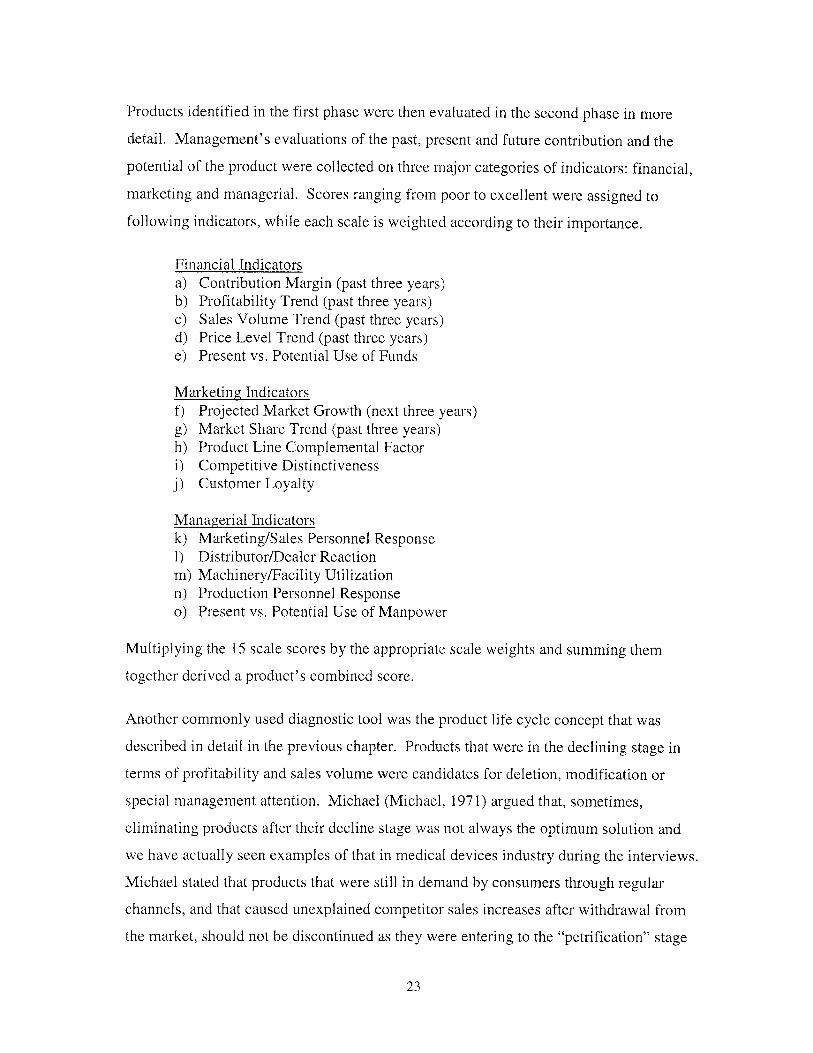
Products identified in the first phase were then evaluated in the second phase in more
detail. Management's evaluations of the past, present and future contribution and the
potential of the product were collected on three major categories of indicators: financial,
marketing and managerial. Scores ranging from poor to excellent were assigned to
following indicators, while each scale is weighted according to their importance.
Financial Indicatorsa) Contribution Margin (past three years)b) Profitability Trend (past three years)c) Sales Volume Trend (past three years)d) Price Level Trend (past three years)e) Present vs. Potential Use of Funds
Marketing Indicators
f) Projected Market Growth (next three years)g) Market Share Trend (past three years)h) Product Line Complemental Factori) Competitive Distinctivenessj) Customer Loyalty
Managerial Indicatorsk) Marketing/Sales Personnel Response1) Distributor/Dealer Reactionm) Machinery/Facility Utilizationn) Production Personnel Responseo) Present vs. Potential Use of Manpower
Multiplying the 15 scale scores by the appropriate scale weights and summing them
together derived a product's combined score.
Another commonly used diagnostic tool was the product life cycle concept that was
described in detail in the previous chapter. Products that were in the declining stage in
terms of profitability and sales volume were candidates for deletion, modification or
special management attention. Michael (Michael, 1971) argued that, sometimes,
eliminating products after their decline stage was not always the optimum solution and
we have actually seen examples of that in medical devices industry during the interviews.
Michael stated that products that were still in demand by consumers through regular
channels, and that caused unexplained competitor sales increases after withdrawal from
the market, should not be discontinued as they were entering to the "petrification" stage
23
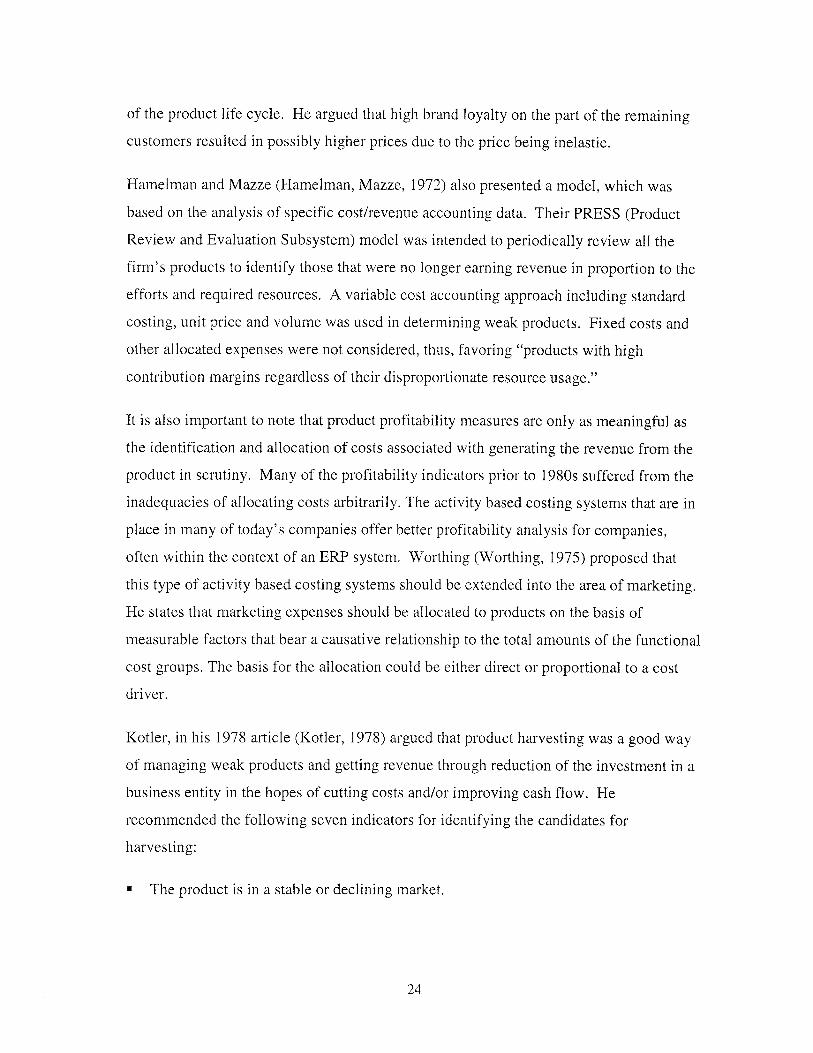
of the product life cycle. He argued that high brand loyalty on the part of the remaining
customers resulted in possibly higher prices due to the price being inelastic.
Hamelman and Mazze (Hamelman, Mazze, 1972) also presented a model, which was
based on the analysis of specific cost/revenue accounting data. Their PRESS (Product
Review and Evaluation Subsystem) model was intended to periodically review all the
firm's products to identify those that were no longer earning revenue in proportion to the
efforts and required resources. A variable cost accounting approach including standard
costing, unit price and volume was used in determining weak products. Fixed costs and
other allocated expenses were not considered, thus, favoring "products with high
contribution margins regardless of their disproportionate resource usage."
It is also important to note that product profitability measures are only as meaningful as
the identification and allocation of costs associated with generating the revenue from the
product in scrutiny. Many of the profitability indicators prior to 1980s suffered from the
inadequacies of allocating costs arbitrarily. The activity based costing systems that are in
place in many of today's companies offer better profitability analysis for companies,
often within the context of an ERP system. Worthing (Worthing, 1975) proposed that
this type of activity based costing systems should be extended into the area of marketing.
He states that marketing expenses should be allocated to products on the basis of
measurable factors that bear a causative relationship to the total amounts of the functional
cost groups. The basis for the allocation could be either direct or proportional to a cost
driver.
Kotler, in his 1978 article (Kotler, 1978) argued that product harvesting was a good way
of managing weak products and getting revenue through reduction of the investment in a
business entity in the hopes of cutting costs and/or improving cash flow. He
recommended the following seven indicators for identifying the candidates for
harvesting:
0 The product is in a stable or declining market.
24
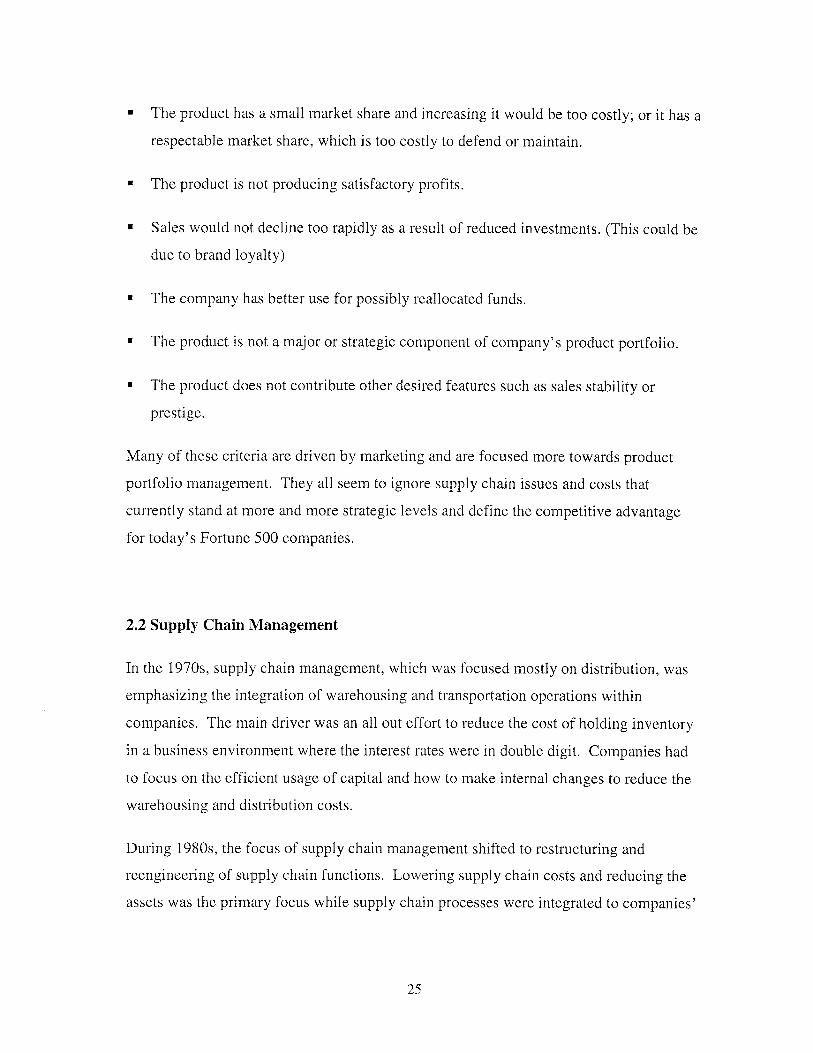
" The product has a small market share and increasing it would be too costly; or it has a
respectable market share, which is too costly to defend or maintain.
" The product is not producing satisfactory profits.
" Sales would not decline too rapidly as a result of reduced investments. (This could be
due to brand loyalty)
" The company has better use for possibly reallocated funds.
" The product is not a major or strategic component of company's product portfolio.
" The product does not contribute other desired features such as sales stability or
prestige.
Many of these criteria are driven by marketing and are focused more towards product
portfolio management. They all seem to ignore supply chain issues and costs that
currently stand at more and more strategic levels and define the competitive advantage
for today's Fortune 500 companies.
2.2 Supply Chain Management
In the 1970s, supply chain management, which was focused mostly on distribution, was
emphasizing the integration of warehousing and transportation operations within
companies. The main driver was an all out effort to reduce the cost of holding inventory
in a business environment where the interest rates were in double digit. Companies had
to focus on the efficient usage of capital and how to make internal changes to reduce the
warehousing and distribution costs.
During 1980s, the focus of supply chain management shifted to restructuring and
reengineering of supply chain functions. Lowering supply chain costs and reducing the
assets was the primary focus while supply chain processes were integrated to companies'
25
operations. Major reductions in transportation, order entry, customer service,
administration and inventory costs were achieved throughout the decade.
Growth which was long considered the responsibility of product development, sales and
marketing in many firms, emerged as an objective of supply chain organization as well
during the 90s. The focus of supply chain management shifted from reducing cost to
improving customer service. Companies with higher supply chain performance started
realizing revenue growth and higher profitability through greater market share and higher
premiums compared to their competitors. Due to the increasing focus on customer
service and growth, companies are revisiting their channel structure while more
innovative players are entering to new arrangements with channel participants in order to
reduce costs and broaden the customer reach. The common view today is that the supply
chain management can both enable and drive the business strategy, product management
of many firms, thus it is difficult to look at the slow moving products in an isolated
matter.
Today, one of the most compelling cases for creation of value through supply chain
integration is happening in the PC industry. Supply chain inefficiencies in that industry
have delayed new products, created demand distortions, scarcity and allocation problems,
inventory obsolescence risks and very low service levels. A study conducted by
Andersen Consulting in partnership with Stanford University and Northwestern
University (Austin, 1998) found that consumers were increasingly demanding products
with unique configurations, resulting in proliferating product offerings and increasing
number of SKUs. As competitors were becoming increasingly adaptive despite this
costly differentiation, there has been a rapid decline in average selling prices and profit
margins due to stiff competition.
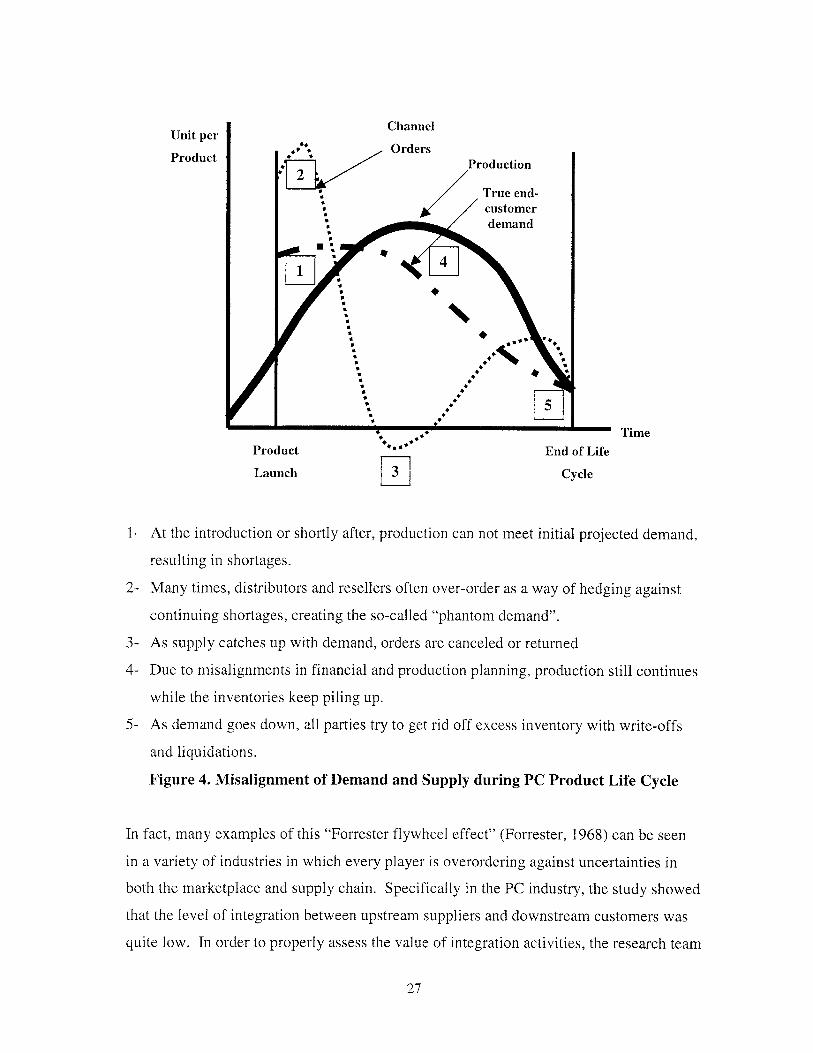
The success of PC manufacturers was revolving around achieving the alignment of
supply and demand, leaving little room for error in getting products to market. If
products were not available at the introduction phase, there would be a negative impact
on market share almost immediately. The figure 4 represents the misalignment of
demand and supply throughout PC's product life cycle.
26
ChannelUnit per
*t . OrdersProduct Production
[L . True end-
customer
demand
4
+, ,,+Time
Product 4** End of Life
Launch W7Cycle
1- At the introduction or shortly after, production can not meet initial projected demand,
resulting in shortages.
2- Many times, distributors and resellers often over-order as a way of hedging against
continuing shortages, creating the so-called "phantom demand".
3- As supply catches up with demand, orders are canceled or returned
4- Due to misalignments in financial and production planning, production still continues
while the inventories keep piling up.
5- As demand goes down, all parties try to get rid off excess inventory with write-offs
and liquidations.
Figure 4. Misalignment of Demand and Supply during PC Product Life Cycle
In fact, many examples of this "Forrester flywheel effect" (Forrester, 1968) can be seen
in a variety of industries in which every player is overordering against uncertainties in
both the marketplace and supply chain. Specifically in the PC industry, the study showed
that the level of integration between upstream suppliers and downstream customers was
quite low. In order to properly assess the value of integration activities, the research team
27
developed an economic model using performance indicators such as inventory turns and
gross margins. The value-creation model and industry benchmarks recommended three
strategies to achieve the integration:
" Pursue compression strategy: Complex chain structures usually create higher
amount of finished goods inventory being tied up in various places in the chain.
Subsequently, customers orders can not be filled and product become obsolete.
Direct model and inter/intra postponement operations are the main enablers for
achieving channel compression, thus reducing finished goods inventory levels.
" Implement collaborative planning with supply chain partners: One of the key
enablers to achieve lean inventories whether they are slow or fast moving and
increased market agility is the collaboration in planning and executing amongst
supply chain partners. Rapid technological changes resulted in ever-shorter product
life cycles, thus complicating supply and demand alignment. The key activities
include collaborative demand planning, synchronized order fulfillment and joint
capacity planning.
" Design products for maximum market responsiveness: Seeking to achieve the best
balance between product innovation/performance, optimal supply chain
efficiency/agility is the key to design for responsiveness. It is important to assess just
how the supply chain will perform for the new product and whether off-the-shelf and
inter-generational parts (which are not obsolete through product life cycles) can be
used in between new product introduction.
2.3 Product Life Cycle and Supply Chain
Inadequately considered supply chains can have a profound impact on customer
satisfaction and the financial strength of corporations. As discussed earlier, a history of
inadequate inventory of finished goods and inability to meet customer demand can
28
destroy a company's reputation and create customer retention and loyalty problems. It
has been estimated that getting new customers is a ten-fold more costly operation than
retaining the existing customer base. On the other hand, excessive inventory is a burden
on financial resources and in today's fast-paced technological changes, there is a good
chance that too much "old-product" often ends up being written off or liquidated for cents
on the dollar. When logistics strategy is integrated properly with overall business
strategy, then the right inventory level, its positioning, channel partners and service
strategies could be determined.
Another important challenge in a consumer environment is how to manage the product
life cycle. Especially, the rapid deployment of advanced communications, information
and computing technologies resulted in shortening of product life cycles and increased
likelihood of owning obsolete inventory in larger amounts. Charles Fine (Fine, 1998)
described industry clockspeed as the rate of change of the industry's evolution,
particularly, rate of change of the industry's products, processes and organizations. He
cited the microprocessor industry as an example of fast clockspeed and aircraft
manufacturing as a slow one: microprocessor industry constantly evolves and products
become obsolete in two years or less.
The longer a product spends in the distribution channel, the greater the risk of inventory
obsolescence. In an industry with fast clockspeed, this risk of obsolescence is greater. In
the PC industry, still, many manufacturers sell their products through distributors and
retailers. When the new chip arrives, retailers either sell the old PCs at a discounted price
or send them back to manufacturers. As we are all familiar, Dell's solution was to sell
direct to customers to avoid excess or obsolete inventory. It could be possible to
generalize this type of direct selling method to other products with faster clockspeed such
as clothes, toys, software, etc. and particularly the e-commerce channel is well suited for
it. Movies and music downloadable through Internet are the latest examples for products
where clockspeed is even shorter.
It is important to note the difference between clockspeed and product life cycle. While
clockspeed depends mostly on the innovations of the product, as discussed earlier,
29
product life cycle is more dependent on the market where consistent product innovation
can increase product life cycle. Shorter life cycles require a different approach to
demand planning relative to long life cycle products. Moreover, product life cycle itself
must be planned and managed with well-defined launch, migration and exit strategies.
Obsolete inventories could become disastrous from a financial point of view, especially
for industries with fast clockspeed and high product cost, such as telecommunications
and networking equipment manufacturers. When a supply chain strategy is especially
linked and tailored to the stages of new product introduction, growth, maturity and
decline, the best supply chain mix will be achieved to deliver different business
objectives at each stage of the cycle.
The supply chain mix can be determined by finding answers to some key questions:
" What are the customers' service and distribution channel service requirements?
" What supply chain strategy should be pursued to meet these requirements?
" Which strategies are feasible for a given company?
Multi-layered and multi-sourced demand based planning is one of the key enablers to
solve this puzzle. Point of sale data should be used to do better forecasting and reduce
inventory risk. Also, the cost-service trade-off would change depending on the stage of
the product's life cycle. The right supply chain mix would be designed to achieve the
right balance between the product's life cycle and company's multiple performance
objectives.
As products reach their end-of-life cycle, up-front customer and decision support
becomes less important, margins begin to shrink, and the Internet offers an appealing
sales channel. The Internet offers a great opportunity for manufacturers to sell products
that are nearing their end of life cycle and becoming obsolete. Lands' End Inc., a major
clothing company, closed three of its 19 outlet stores in March 1999 according to
ComputerWorld magazine (Machlis, Vijayan, 1999) - partly because the Internet is a
better way to sell off surplus inventory, the company announced as part of an overall
restructuring effort. The move points to the growing importance of the Internet as a
30
channel for disposing of overstock and end-of-season inventory, analysts said.
According to the article, Lands' End finds both catalogs and the Internet to be more cost-
effective in liquidating overstocks without further elaboration.
Recently, The National Association of Wholesaler-Distributors (NAW) has entered into a
strategic alliance with TradeOut.com to provide wholesaler-distributors with an effective
way to dispose of excess inventory and idle business assets using the Internet.
TradeOut.com is a leading online marketplace for business-to-business excess and
obsolete inventory across a variety of product categories, including computers, consumer
automotive, hardware, capital equipment, and others. NAW has exclusively endorsed
TradeOut.com as its preferred Internet exchange for excess inventory and idle assets in
the wholesale distribution industry.
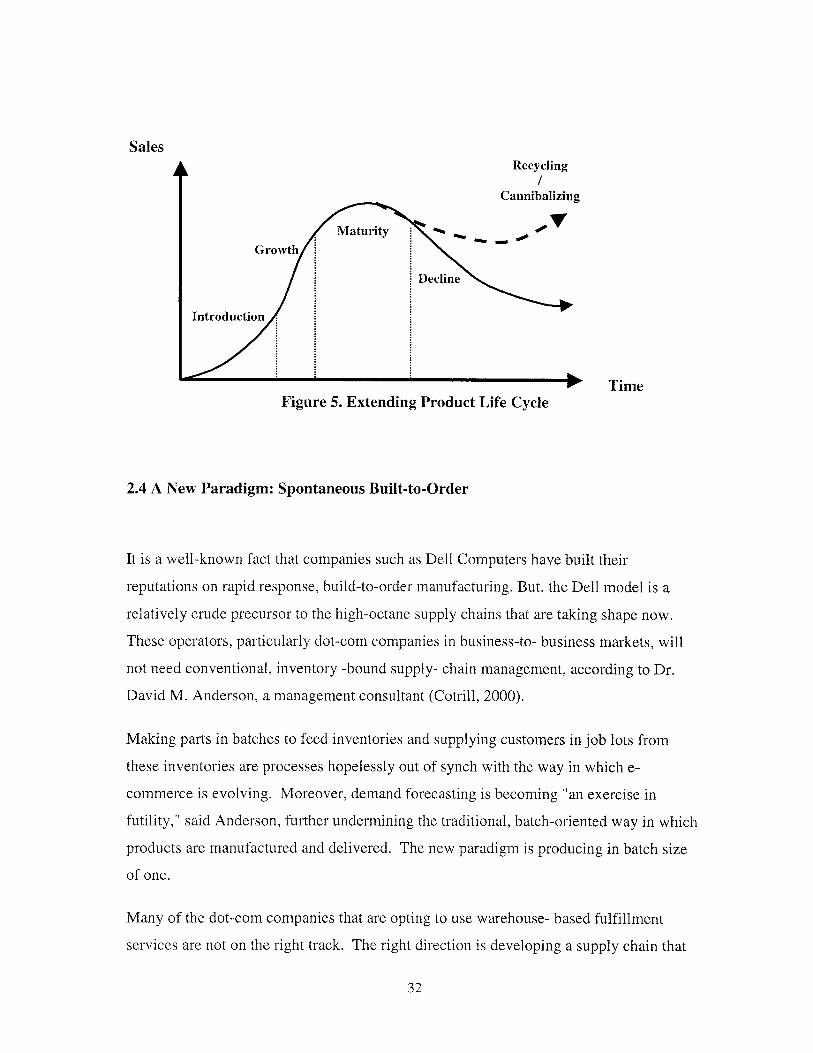
In some industries, agreements amongst wide-ranging manufacturers and suppliers on
product design standards are starting to become common news. These types of
agreements have profound effects on extending product life cycle through recycling or
cannibalizing a product (Figure 5). In October 1999, the industry's top notebook PC and
flat panel display (FPD) manufacturers announced a mechanical and electrical standard
for current and future notebook PC displays (VESA, 1999). It is predicted that this new
standard should help improve notebook PC display availability and allow each
manufacturer to reduce their time to market, allowing them to spend more time on
reliability, service, support and price. The standard should reduce the overabundance of
custom display module designs that has forced notebook OEMs to modify their
packaging, interface design and tooling nearly every time a new panel supplier or display
module is adopted. It will lessen the development cycles and logistics problems created
by product obsolescence. For the flat panel display industry, the standard offers the
potential to decrease the number of designs and part numbers, improve the utilization of
engineering resources, and reduce inventory control and other obstacles to design wins.
31
SalesRecycling
Cannibalizing
Maturity
Growth
Decline
Introduction
TimeFigure 5. Extending Product Life Cycle
2.4 A New Paradigm: Spontaneous Built-to-Order
It is a well-known fact that companies such as Dell Computers have built their
reputations on rapid response, build-to-order manufacturing. But, the Dell model is a
relatively crude precursor to the high-octane supply chains that are taking shape now.
These operators, particularly dot-corn companies in business-to- business markets, will
not need conventional, inventory -bound supply- chain management, according to Dr.
David M. Anderson, a management consultant (Cotrill, 2000).
Making parts in batches to feed inventories and supplying customers in job lots from
these inventories are processes hopelessly out of synch with the way in which e-
commerce is evolving. Moreover, demand forecasting is becoming "an exercise in
futility," said Anderson, further undermining the traditional, batch-oriented way in which
products are manufactured and delivered. The new paradigm is producing in batch size
of one.
Many of the dot-coin companies that are opting to use warehouse- based fulfillment
services are not on the right track. The right direction is developing a supply chain that
32
can meet the next-day expectations of e-commerce customers. A general
recommendation to blossoming dot-com enterprises is to look for manufacturers who can
make products on demand rather than getting into warehouses and paying for inventory.
There are relatively few manufacturers that fit this profile at present, but Anderson
believes the number will grow rapidly as the e-commerce market matures. Companies
such as Dell have helped to lead this effort but in reality, Dell is not really doing
spontaneous build-to-order, but assembling to order: the high volume of orders Dell
processes enables it to support warehousing operations close to assembly lines, creating
the illusion that it is building product as orders come in. (Trommer, 1998)
The reality of spontaneous build-to-order is a supply chain where the inflow of raw
materials and parts matches the outflow of finished products. Ordering, manufacturing
and delivery are part of the same continuum so that a customer's order is turned into a
delivery in a single, uninterrupted cycle. This is achieved without demand forecasts,
goods inventories or procurement processes based on purchase orders.
The companies that will be first are those already vertically integrated enough to do it.
For example, Whirlpool, the maker of household appliances, is a good candidate since
parts such as motors and electronic components are usually highly standardized and can
be manufactured on demand and supplied in synchrony with the inflow of orders for
finished machines (www.whirlpoolcorp.com).
In order to achieve this continuous flow, supply chains must be simplified by following
initiatives:
Materials and Parts Standardization: Materials and parts need to be standardized
as far as possible to reduce the number of variations that the supply chain has to
accommodate. The more you standardize on parts, the easier it is to speed up the
supply chain. For example, Intel's Systems Group reduced the number of its active
part numbers from 20,000 to 500 by introducing more standardization into product
design. Standardization on raw materials also helps the control of supply chain.
33
* Automatic Resupply: Also smoothing out the supply chain is automatic resupply,
where parts and materials are replenished automatically without the need for purchase
orders. Using this Kanban method can automatically activate a physical signal, such
as a tag, when fresh supplies are needed. Minimum stock reorder points and physical
bins, which are appropriate for small, low-cost items, can be refilled as soon the
reorder point is reached or bins are empty.
Supplying customers requires what Anderson refers to as a "spontaneous supply chain."
Instead of drawing parts from inventory to fill an order from a customer, the
manufacturer reacts instantly to "pull" signals from the customer and makes the parts to
order. Again there are a number of ways to do this. The automatic resupply methods
described above can be applied to order fulfillment, for example. As supply chains
become more spontaneous, it is anticipated that a boom in express distribution will
happen to meet the highly demanding schedules of quick-response, build-to-order
operations. Many of the trucking operations will also be moving to spot market rather
than long term contracts.
In spontaneous build to order system, the velocity in the supply chain and the
unnecessary forecasting accuracy will reduce the risk of finished goods obsolescence and
work-in-process inventories will be at minimum levels. This is particularly important in
terms of being able to respond to real customer demand without lost sales when a product
is launched. In high-tech industries where product life cycle is as low as six months, this
is a crucial alignment that must be achieved without building up risky inventories.
Nevertheless, certain industries will still have big economies of scale built-in throughout
their supply chain like in chemicals and it is very unlikely they will be embracing this
concept.
In the next chapter, findings through the interviews and surveys of companies from
networking equipment, medical devices, retail, food and consumer electronics industries
will be discussed in detail together with their supply chain efforts.
34
3. INDUSTRY PRACTICES ON MANAGEMENT OF END-OF-LIFE CYCLE
PRODUCTS
During this study in-depth interviews and surveys have been used to find the
management processes applied to declining products across a wide range of industries.
Findings from eight multi-billion dollar corporations are summarized in this chapter
grouped by the industry they operate in.
3.1 Networking/Telecommunications Equipment Industry
Company A:
With over 300 million customer connections worldwide, Company A connects people
and organizations to information and each other in innovative, simple and reliable ways,
more than any other networking company. They deliver e-Networking solutions through
information access products and network systems to enterprises, small businesses, and
consumers, carriers and network service providers. This company leads the industry in
Ethernet, Fast Ethernet, and Gigabit Ethernet connectivity, specifically NICs, switches,
and hubs. They also occupy a strong position in stackable systems, enterprise switching,
voice-over-IP (Internet Protocol), and virtual private networks. Additionally, Company A
offers leading-edge solutions for implementing wireless access, ERP systems, distributed
training/distributed learning, call centers, and digital asset management.
0 Business/Product portfolio analysis:
Last year, the company began a systematic analysis of its business portfolio along two
dimensions: growth and return on invested capital or ROIC. They found that their
portfolio was quite heterogeneous as it ranged from hypergrowth businesses to good
growth, mature businesses. However, despite several efforts, analog modems only
improved marginally, and its large enterprise LAN and WAN core businesses simply did
not improve. This analysis helped them reach a first set of decisions: to transition and
stop all non-strategic activities on these identified businesses. In all cases, the company
approached these transitions on three principles:
35
" Minimizing the disruptions imposed on customers, partners and employees.
" Preserving all the technological assets the company might need in future product
developments.
* Making sure they could execute these transitions rapidly. For them, rapidly means
90 days or less.
* Distribution channels and declining products:
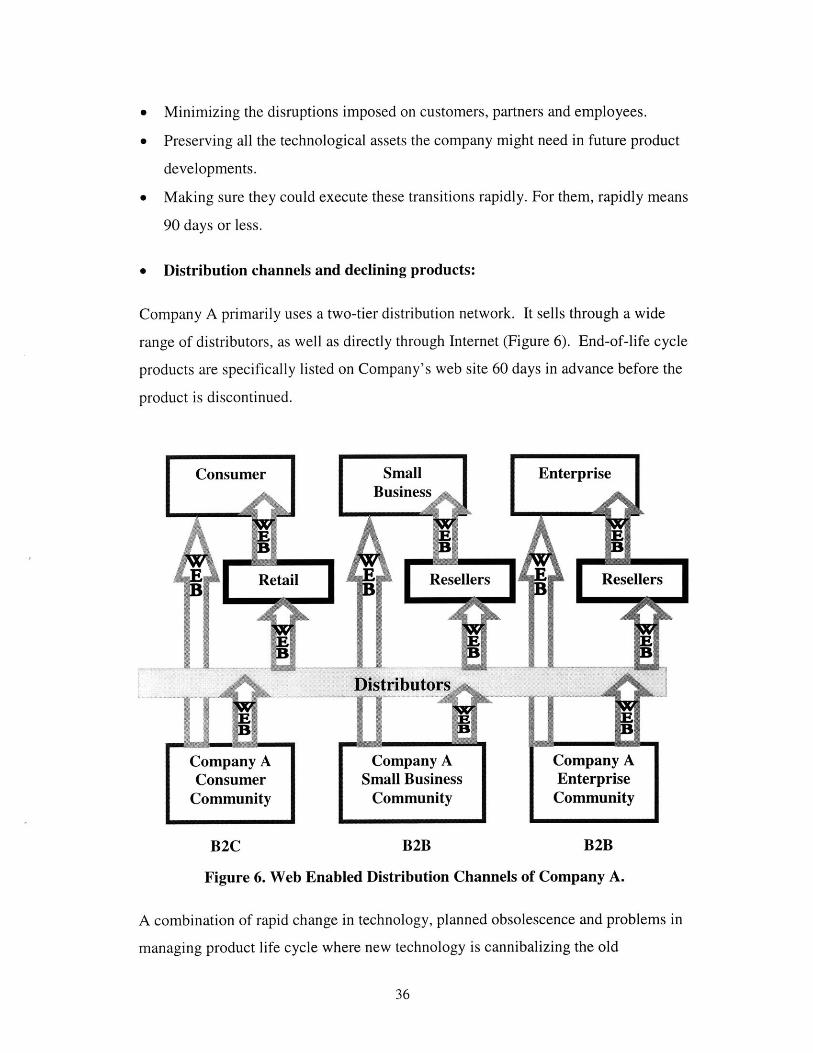
Company A primarily uses a two-tier distribution network. It sells through a wide
range of distributors, as well as directly through Internet (Figure 6). End-of-life cycle
products are specifically listed on Company's web site 60 days in advance before the
product is discontinued.
SmallRBusiness
Resellers
Enterprise
Resellers
Company A Company A Company A
Consumer Small Business EnterpriseCommunity Community Community
B2C B2B B2B
Figure 6. Web Enabled Distribution Channels of Company A.
A combination of rapid change in technology, planned obsolescence and problems in
managing product life cycle where new technology is cannibalizing the old
36
Consumer
Retail
technology are the main reasons for slow moving inventory in Company A. As the
company relies on two-tier channel distribution model, product buffers are built up
across entire supply chain and product reaching end-of-life cycle can get caught up in
those buffers in the form of safety stock. Inability to monitor sales out and inventory
levels on some products creates obsolescence. Company A confirms that all of their
products fit to the product life cycle scheme.
0 Organization and decision makers:
The supply chain organization in Company A owns inventory completely from
procurement all the way to disposal. They do not have separate ownership of
inventory by a business unit, the ownership is centralized. The supply chain
organization is made up of procurement, manufacturing and distribution and directly
reports to president. As a result of this advanced supply chain view, operational
efficiency is achieved; inventory turn went from 4.4 to 9.8 -a figure above the
industry average- over 1.5 years, net inventory was reduced by more than half and
inventory levels maintained on hand in the channel are reduced from 6-8 weeks to 4-5
weeks.
According to a senior executive, this success was achieved by better business
planning: aligning the business unit revenue plan with marketing forecast and
manufacturing bill plan, as well as better communication across the supply chain.
Yet, the most significant change in their business model was moving to build-to-order
and intra/inter company postponement.
Product abandonment decisions are made when next generation product is being
substituted, cannibalized or replaced. Supply chain executives and product managers
are the main decision-makers.
Obsolete and declining products are liquidated through brokers, discounts and
firesales. In addition to company's own direct sales through the Internet, distributors
also sell through the web through auctions and firesales. End-of-life cycle product is
not brought back to the Company until the very end. Finally, the unsold products are
37
consolidated at a centralized location where the "long tail" of a particular product is
managed for spare parts and service requirements.
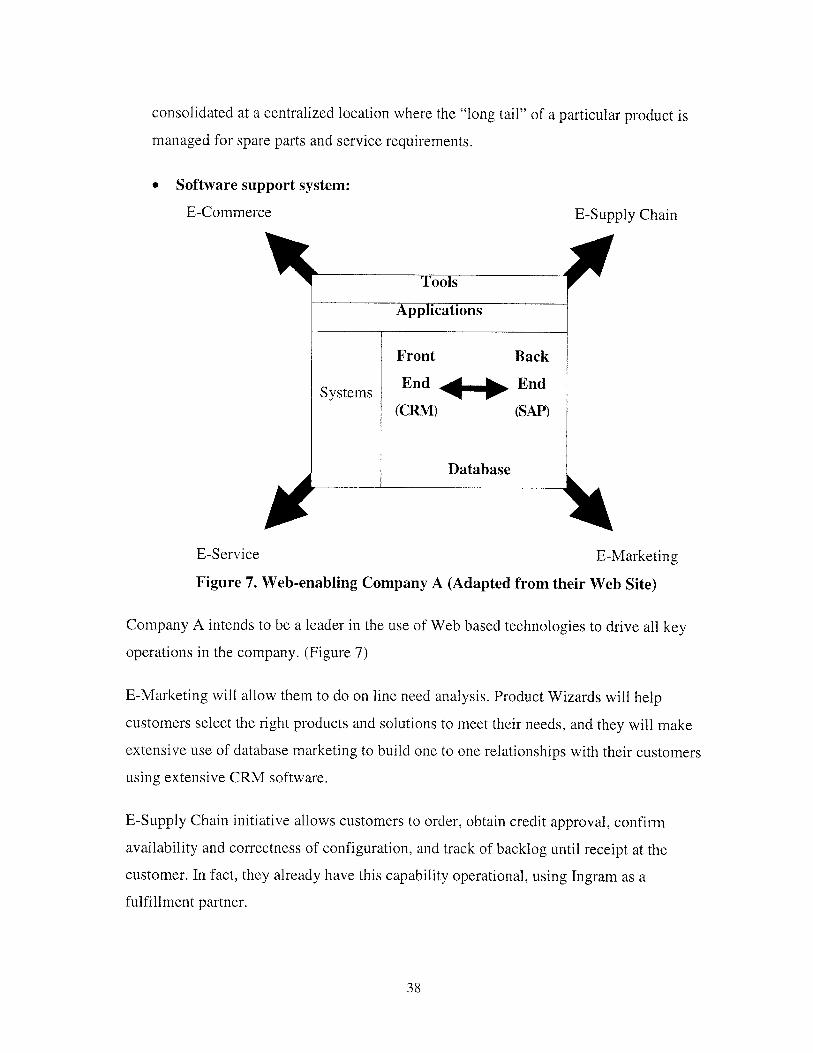
* Software support system:
E-Commerce
E-Service E-Marketing
Figure 7. Web-enabling Company A (Adapted from their Web Site)
Company A intends to be a leader in the use of Web based technologies to drive all key
operations in the company. (Figure 7)
E-Marketing will allow them to do on line need analysis. Product Wizards will help
customers select the right products and solutions to meet their needs, and they will make
extensive use of database marketing to build one to one relationships with their customers
using extensive CRM software.
E-Supply Chain initiative allows customers to order, obtain credit approval, confirm
availability and correctness of configuration, and track of backlog until receipt at the
customer. In fact, they already have this capability operational, using Ingram as a
fulfillment partner.
38
Tools
Applications
Front Back
Systems End 44-frEnd(CRM) (SAP)
Database
E-Supply Chain
E-services initiatives already allows customers to diagnose and self repair simple
operational problems and is a way to quickly determine when specialized assistance or
dispatching of a technician is required.
To support their E-business plans, Company A has built a world class infrastructure,
which includes well-integrated tools and applications into a highly available and secure
environment. All of their front-end systems are completely linked to SAP and are
supported by a common data warehouse environment.
Company A has an ERP system (SAP) in place completely managing every activity in the
supply chain. Its inventory management system is able to delineate between the products
that are active and discontinued. They are able to age the inventory and segregate it to
know exactly how long it has been in the channel and at what stage of product life cycle
it is. There is a dedicated system in place identifying the end-of-life inventory based on
sales activity and inventory position data provided by distributors, value-added resellers,
ISPs and integrators. On the other hand, company is currently struggling with the
implementation of an Available-to-Promise (ATP) module. Definition of rigid business
rules and maintenance of many supporting tables are the main issues. At this point, it is
not clear whether they will be implementing other decision support systems such as
SAP's Product Life Cycle Management modules.
* Suppliers:
One of Company A's main suppliers is Lucent. Their microelectronics group invested
more than $100 million in an Oracle enterprise resource planning system, which gives
employees a global view of its supply chain within three minutes of any transaction.
Every time a product moves from one workstation to the next, it is logged into the
system. Such up-to-the-minute details help Lucent identify when products will be able to
be shipped.
Company A want Lucent to deliver chips it needs within 48 hours of an order. When an
electronic data interchange purchase order enters Lucent's Oracle system gateway, the
system verifies customer data and checks to see if the product is available. If it is, the
39
system triggers a module in the ERP system that instructs the factories in Bangkok,
Singapore, or Pennsylvania to pick and pack the chips and hand them over to DHL.
Simultaneously, the system sends an EDI confirmation to Company A. The connection is
expected to migrate to the Internet by next year.
0 Performance metrics:
Company A uses 6 performance metrics within the supply chain organization effecting
the management of declining products:
1. Order Cycle Time (Availability): time it takes for the order till it is delivered.
2. Percent On-Time: predictability of on-time performance against promised orders.
3. Supply Chain Cost: as a percentage of revenue.
4. Inventory Turns
5. Cash to Cash Cycle
6. Accounts Receivable
A Supply Chain Equilibrium model is in place to make cost vs. service tradeoff decisions.
0 Further improvements:
Supply Chain Operations in Company A are clearly on track for shrinking the supply
chain down, reducing inventories and write-offs. Now that the company has built a world
class ERP system, they are working on linking up with their suppliers directly and have
automated replenishment based on actual customer orders and inventory levels, moving
towards the "spontaneous built-to-order" system that was mentioned in the previous
chapter. While breaking down the walls that separate their business from their customers,
suppliers and partners, they intend to take a lot of cost and complexity out of the system,
reducing amount of obsolete inventory on finished goods, parts and materials.
3.2 Medical Devices Industry
Company B:
40
Company B is a big international medical device company dedicated to minimally
invasive therapy, and employs approximately 13,500 people worldwide. The Company's
products include more than 10,000 catalog items in over 50 categories, and are defined as
vascular or non-vascular depending on the system and procedure in which a product is
intended to be used.
0 Product characteristics:
From an expiration perspective, all products have a 2-3 years shelf life, primarily due to
their sterility conditions. Once produced, they are put on the inventory system on a FIFO
basis, while tracking the date it was produced and the standard expiration date. From the
product life cycle standpoint it is harder to determine where an item actually stands.
Typically it is the market that decides the replacement of the product.
Typically, it is very difficult to liquidate end-of-life cycle product. It used to be that US
medical companies were able to move slow moving products to emerging markets;
however, as Company B's products do not require as much capital expenditure in the
operating room, customers require that the latest technology be available to them. It is
also a politically incorrect way of running the business for those markets. Occasionally,
products close to expiration are donated.
0 Supply chain:
In late 1998, Company B initiated a supply chain optimization program targeting
reduction in inventory levels and related write-offs, seeking improvement in service
levels, fill rates and product cycle times.
The company is currently pursuing the implementation of a hybrid replenishment model,
which couples the production to actual sales. The inventory levels at global Tier 1
distribution centers are set using analytical models such as EOQ and replenishment
signals based on actual inventory levels vs. target levels trigger shipment and production
at various plants. Global safety stocks are pooled in these locations. Orders based on
recent consumption at Tier 2 DCs are sent to global distribution centers for quick
replenishment.
41
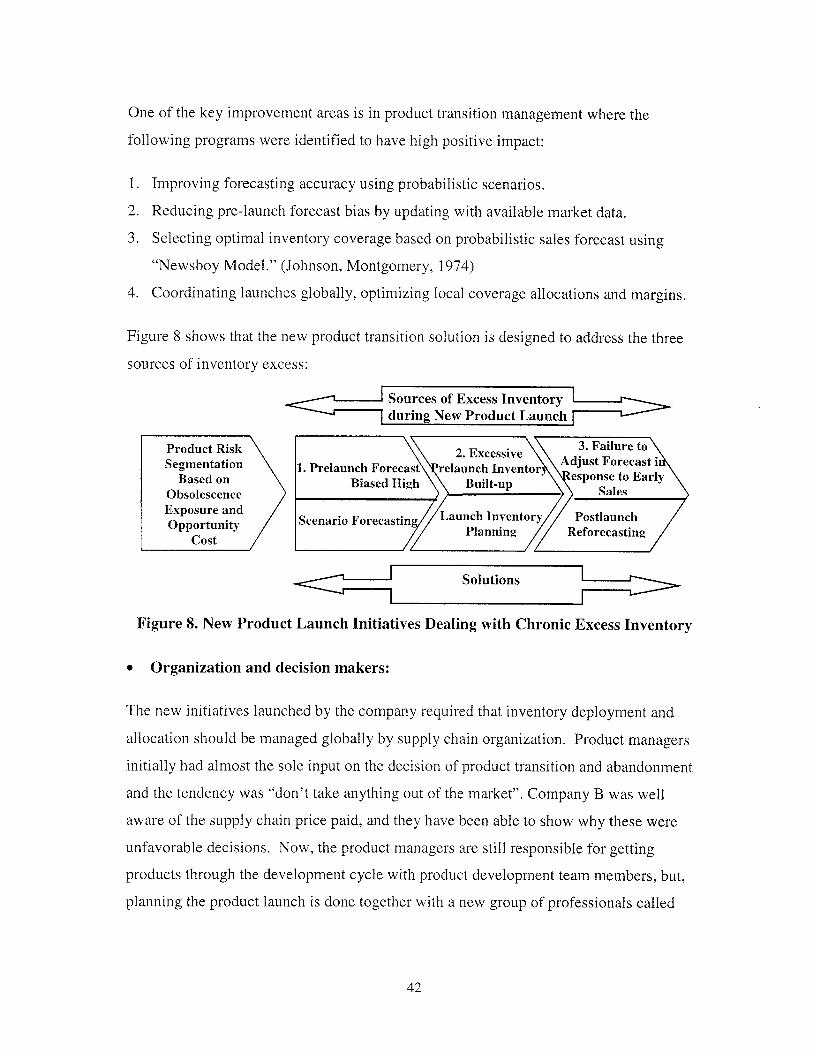
One of the key improvement areas is in product transition management where the
following programs were identified to have high positive impact:
1. Improving forecasting accuracy using probabilistic scenarios.
2. Reducing pre-launch forecast bias by updating with available market data.
3. Selecting optimal inventory coverage based on probabilistic sales forecast using
"Newsboy Model." (Johnson, Montgomery, 1974)
4. Coordinating launches globally, optimizing local coverage allocations and margins.
Figure 8 shows that the new product transition solution is designed to address the three
sources of inventory excess:
So ure-eS o-f Exc e ss Inve nto ryduring New Product Launch
Product Risk 2. Excessive 3. Failure toSegmentation 1. Prelaunch Forecast relaunch Inventor Adjust Forecast i
Based on Biased High Built-up esponse to EarlyObsolescence Sales
p n Scenario Forecastin Launch Inventory Postlaunch
Cost Planning Reforecasting
--42Z21 Solutions
Figure 8. New Product Launch Initiatives Dealing with Chronic Excess Inventory
Organization and decision makers:
The new initiatives launched by the company required that inventory deployment and
allocation should be managed globally by supply chain organization. Product managers
initially had almost the sole input on the decision of product transition and abandonment
and the tendency was "don't take anything out of the market". Company B was well
aware of the supply chain price paid, and they have been able to show why these were
unfavorable decisions. Now, the product managers are still responsible for getting
products through the development cycle with product development team members, but,
planning the product launch is done together with a new group of professionals called
42
I
"Global Supply Chain Managers". These individuals have the ownership of
discontinuation, reduction and production decisions rather than product managers.
Usually product managers identify those products that are cannibalized and communicate
them to global supply chain managers. Customer conversion rates and utilization rate of
new versus old products drive down the probabilistic forecasting process. Unless the
substitute product is superior, the replaced product is allowed to reach an equilibrium
level. When the demand for the cannibalized product becomes too low, the product
abandonment decision is made and communicated to customers that have recently used
the product. These types of end-of-life cycle product are brought back to top echelons
and the replenishment targets in lower echelons are adjusted to avoid excess and obsolete
inventory for the declining products.
0 Software support system:
Company B replaced twenty-one different systems with a global ERP implementation.
Now that they are on a common platform, they will be looking at more advanced
planning systems. One of these systems is SAP's advanced planner and optimizer and
their product life cycle management suite.
Redeployment of end-of-life cycle products from lower echelons to global distribution
centers is still a manual process. Every month a deployment model is run to find out
whether any product will be moved and these decisions are made for worldwide
operations. Every quarter a set of reports is generated to analyze the level of excess,
expired and obsolete (EE&O) inventory using mostly queries run against ERP databases.
* Performance metrics:
In Company B, supply chain and manufacturing organizations have their own balanced
scorecards which reflects efficiency and performance on supply chain management,
market planning, supply chain execution, distribution and manufacturing. Specifically,
supply chain outcomes are judged by finished goods inventory turns, the amount of
EE&O, customer service levels and backorders. Marketing product managers are
measured on their forecasting accuracy for new, mature and declining products.
43
There are two other categories of inventory that marketing has an impact on: one of them
is consignment and the other one is "trunk-stock", inventory held by sales people to help
small customers/hospitals. Marketing drives inventory decisions in these categories and
there is a set of performance metrics around them.
0 Further Improvements:
Company B recognizes that they need to gain the ability to make quick and tough
decisions on end-of-life cycle products. They are having difficulties in moving
customers from older generation products to newer ones; sometimes marketing will
overstate the customer preference and take the easy path. Although it is improving,
supply chain perspective and costs need to be further included in marketing decision
making.
3.3 Consumer Electronics Industry
Company C:
Company C is the United States subsidiary of a large consumer electronics company
headquartered in Japan. The Company is a leading manufacturer of audio, video,
communications and information technology products for the consumer and professional
markets. Its music, motion pictures, television production, computer entertainment
operations and online businesses makes the company one of the most comprehensive
entertainment companies in the world.
Over 28,000 employees are employed in 14 plants across North America producing
multi-billion dollar revenue with the support of 5 major R&D and engineering facilities.
Company operates four regional distribution centers across the United States.
* Product characteristics:
Company C has one of the most recognized brands in consumer electronics industry. The
general focus is on brand management and product innovation and proliferation. On the
44
other hand, new technologies in consumer electronics reduce the product life cycle to less
than two years in some of their product groups. It is mainly product sales that determine
slow-moving inventory. End-of-life cycle products are usually liquidated through the
company's own outlet stores and family stores serving the employees. Occasionally
liquidators are used to sell the excess and obsolete inventory.
By law, company C must support its products for five years, and often times a part of the
slow moving inventory is kept for parts and replacements. It is not known how this
inventory level is determined.
0 Supply chain:
Company C sells most of its products through retail stores. A group of its products are
also available through online direct sales, most of them being specialty items. However,
the Internet is mainly used for product information purposes. A logistics division is
responsible for the distribution activities. A new initiative is currently in place to move
end-of-life cycle products to third party warehousing mostly due to capacity constraints.
A supply chain organization is not foreseen any time soon at this point.
0 Organization and decision makers:
A marketing group in Company C owns the product and determines their fate unlike the
previous examples analyzed. The logistics division prepares a report on slow moving
products for marketing every quarter, as they are not aware that the company holds this
type of inventory; their main focus is fast-moving products, what they are selling today.
More cooperation has been seen between marketing and distribution as one of their main
initiatives is focused on dealing with obsolete inventory and improving inventory turns.
0 Software system support:
Company C relies on mainframe reports to track how frequently products are moving in
the warehouses. Generally, the inventory of slow moving products is reviewed quarterly
and at the year-end. The existing warehouse management system is not used for any type
45
Company D reduced the number of models in two of their main lines by a combined fifty
percent and established mandatory profit margin requirements. They closed down an
unproductive factory and brought discipline and profitability to North American
operations. This year, they came to market with an attractive catalogue of products and
with marketing and pricing strategies that should prove profitable. That is very important
to Company D, because the strength of their brands and the consumer's enthusiasm for
them drives their success in the automotive and computer OEM fields.
Company D has a strong brand reputation. The life cycle of Company D's products varies
from one to two years. They are mostly subject to planned obsolescence, which is a
function of speed of new product development. Products are categorized by brand,
market and price premium. Lead times in manufacturing and product design make
product obsolescence a guessing game and eventually leads to write-down costs.
Unexpected obsolescence is another problem, which increases obsolete inventories due to
rapid changes in technology.
* Supply chain:
A number of their competitors are placing dedicated stores in upscale malls to sell their
products in exclusive settings. They feel that established distribution and conventional
product displays do not serve them adequately. Company D has seen the value in direct
selling through the outlet stores they own and operate in California and Arizona. Direct
selling through advertising in magazines, direct mail and the Internet have also proved
rewarding for a number of firms in the consumer field. For those without a meaningful
position in traditional markets, the Internet represents pure upside opportunity. For those
with established brands and distribution, a headlong rush to retailing on the Internet can
be dangerous and disruptive. Company D is using the Internet to extend their brand
reaches while paying careful attention to their existing distribution relationships.
More than three hundred other websites offer the company's products. Of that total,
Company D authorizes and recommends nine, which satisfy their stringent requirements.
Amazon.com's new electronics store now markets Company D products as their primary
component electronics and loudspeaker brands.
47

In July 1999, Company D launched a suite of Internet commerce solutions including the
industry's first dealer Extranet. This innovation will allow dealers, large and small, to
conduct business with them electronically. Many dealers will pay for the products with
credit cards. The benefits in operating efficiency, customer service and overhead
reduction will be substantial.
Company D also uses alternative channels such as auction sites to liquidate their
declining products, as well as their website.
9 Organization and decision makers:
Company D distinguishes itself with superior customer service, in-stock availability and
correct order processing. The company's logistic organization is still at divisional level
and is not centralized, very much like Company C.
Product responsibility is on the shoulders of brand senior executives, and they directly
report to the president of the company. Every month, the company conducts a review of
declining products, which is more frequent than in the previous companies analyzed.
Company D believes that one of their strengths is this planned process of review and
clearance of obsolete products on a regimented schedule. Once those products are
identified, price reduction, increased promotion and inventory adjustments are made.
Company D also considers alternative channels for end-of-life products.
Product shortage costs are reevaluated and new inventory levels are established for
declining products. During the product abandonment process, the company considers
alternative usage of released assets and potential liquidation/salvage revenue. Once the
products to be abandoned are identified, they inform their suppliers and channel partners
three months in advance. For those type of products a combination of harvesting and
slow retirement strategies are employed. Occasionally though, the product is dropped
immediately. Company D uses third party logistics for their warehousing operations and
does not move the declining products to a central warehouse.
Company D keeps track of percent orders back-ordered and average back-order time for
declining products as well, consistent with their high customer service strategy.
48
of product velocity report generations and there is no data link between legacy systems
and warehouse management systems. Company C does not have an ERP system in place.
0 Further improvements:
Company C is a unique example where their extremely strong brand, high quality product
does not put much pressure on achieving supply chain efficiencies and dealing with end-
of life cycle products. Unlike the previous examples, these types of products are easily
liquidated through several channels where customers are readily available. As the
strategic focus is on product innovation, there is much room for improvement in the new
product design and launch process.
Company D:
The Company D Consumer Systems Group is a leading designer, manufacturer and
marketer of a wide range of high-fidelity loudspeakers, audio and video components and
multimedia systems for use in homes and automobiles, and with computers. Company D
has long been recognized as one of the most socially progressive companies in US.
Although it had originated and developed in the United States, Japanese companies
dominated the industry in the 1960's, and that dominance continued until the Japanese
economic bubble burst in 1997. During the forty years of Japanese ascendancy, the
industry was driven by strategic emphasis on market share. It was a strategy designed to
force competitors out of the market, to sacrifice profit for dominance, and to recoup those
lost profits from a hungry and controlled domestic market. The strategy drove
competitors to respond in kind, and thus created an industry in which it was inordinately
difficult to make a profit. Company D was no exception as margin pressures still continue
today (information provided by Company D at their web site).
9 Product characteristics:
46
0 Software support systems:
Company D has an integrated SAP ERP system in place. Besides that there is a CPFR
initiative under development with some of their key customers such as Best Buy and
Circuit City. Advanced product life cycle management tools are not yet considered, as
manufacturing and designing of products are mostly vertically integrated operations.
Every month, during the product review process, product profitability reports are
generated for each SKU, product line, customers and distribution channels in a very
detailed way. Technology is one of the key enablers for them to improve processes,
forecast and overall control.
* Further improvements:
Company D expressed their need for a quantified system to balance inventory costs,
obsolescence costs and lost sale opportunity costs and tie them to demand forecasting to
make better supply chain decisions in order to reduce the write-offs.
There is also a need to reduce the lead times to be more responsive to product
obsolescence.
3.3 Food Industry
Company E:
Company E, with hundreds of factories worldwide, is one of the largest food companies.
Since its establishment, the company has gained vast experience through its scientific
research into the nutritional needs and food preferences of consumers of all ages. In that
sense, they are proud to be recognized as a major investor in fundamental and applied
research and their commitment to product development is reflected in the company's
mission statement.
49

The company's presence in United States was established in 1991. This subsidiary
contributes the largest portion of worldwide revenue with sales over $8 Billion USD in
1998. Throughout its short history, rapid growth was achieved by acquisition of other
financially healthy companies while constantly diversifying the core business from
petcare to cosmetics.
0 Product Characteristics:
Company E has more than 4,000 SKUs any day both in the frozen and dry food section.
The top hundred-fifty items do more than 50% of their business. An average customer
will carry on the dry side 300-400 SKUs and on the frozen side 80-100 SKUs from the
company's portfolio. Product life cycle is not an apparent issue. The main reasons for the
slow moving inventory are:
1. Special packaging and product display modules.
2. Promotional items/SKUs, "dash packs".
3. Seasonal products such as Easter candy.
The products have as short as seven months of shelf life. Usually, half of that is allowed
for retailers, and if the product spends more than four months in the warehouse, the
company would not ship it to retailers. Old product is put on hold or moved to a closeout
sale to get rid of the excess product. As a remedy, the company is trying to have shorter
manufacturing runs and continuously improve their forecasts.
9 Supply chain:
Maintaining a leadership position under rapidly changing circumstances requires a degree
of agility not normally associated with a company the size of Company E; nevertheless,
market dynamics were shifting power to large companies in the grocery and retail
industry as mergers, acquisitions and strategic alliances became the name of the game.
Economies of scale and scope were targeted with the ever-growing size of these mega-
mergers and cutting costs throughout the supply chain was one of the primary motives.
Needless to say, raising equity in stock markets, where the high-tech industry is the
sweetheart, was becoming increasingly difficult for the grocery and retail industry.
50
Company E's customers are demanding change. The company was losing its leadership
in meeting some of the key requirements from its customers:
- increasing demand and expectations for very high service levels
- increasing cost awareness under tough competition for retailers
- technological competency to better execute distribution and inventory management
- desiring solutions to provide a complete easy-to-shop assortment of products that the
consumer values
- communicating the product benefits and value through advertising and price
incentives
Furthermore, there was extensive buyer power limiting the company's negotiation
capabilities, as the top 20 customers were accounting for 51 % of total US retail sales.
Some of the challenges that company was facing in terms of slow moving product
management was reflected in these statistics:
* Forecast accuracy only 40%-60%.
* $70 MM in returns.
* Spoils rate of 1.5% of sales vs. the industry average of 0.96% (1996)
0 $16 MM of outdated/hold product
0 $50 MM in aged inventory
A new company initiative is intended to make Company E more competitive by
simplifying business processes and reducing inefficiencies throughout the organization.
The company consolidated most of their products and many of their plants in the past five
years. They currently have multiple products made in multiple lines in a given factory,
giving them more flexibility.
Company E operates six full-line distribution centers. Products that are shipped from
factories to distribution centers are placed on hold and released as the clearance from
product incubation is obtained. They hold some candies containing cocoa beans for
salmonella testing. It usually takes seven to ten days for that process. Most of their
factories are in the Mid-West, close to sources of raw material. Their warehouse in
51
Chicago holds all promotional and slow moving products. Many of their slow movers are
repositioned there.
On the frozen side, the company uses third party facilities throughout the US, closely
located to the manufacturing facilities.
Currently, company is trying to sell to the rate of consumption rather than push the
product out of the door and try to make quarterly sales numbers. Efficient customer
response initiatives can result in cost reductions and top-line sales growth if implemented
correctly in the grocery/food industry.
0 Organization and decision makers:
Company E learned very early to respect the social, political and cultural traditions of all
countries in which the products are produced and sold. Consequently, this is a highly
decentralized "people and products" oriented company rather than a systems centered
organization.
A category sales development team, which works closely with marketing, is responsible
for making decisions about slow moving inventories. There is also input from
manufacturing and divisional accounting. In terms of everyday slow moving products,
the company is not very active in eliminating those types of products. The main concern
is about future lost sales, and that has been preventing SKU reduction. Usually, account
sales managers work closely with respective customers and decide whether the
merchandise will be liquidated or marked down depending on the level of the excess
inventory.
0 Software support systems:
Company E is in the process of implementing an SAP ERP system like the previous
companies that were analyzed. They believe that in one year they will be able to
transition to Activity Based Costing, which will allow them to make better profitability
analysis of their products. The company is currently getting rid of "special packs", but
they also recognize the need to get rid off "dogs" and streamline manufacturing
52
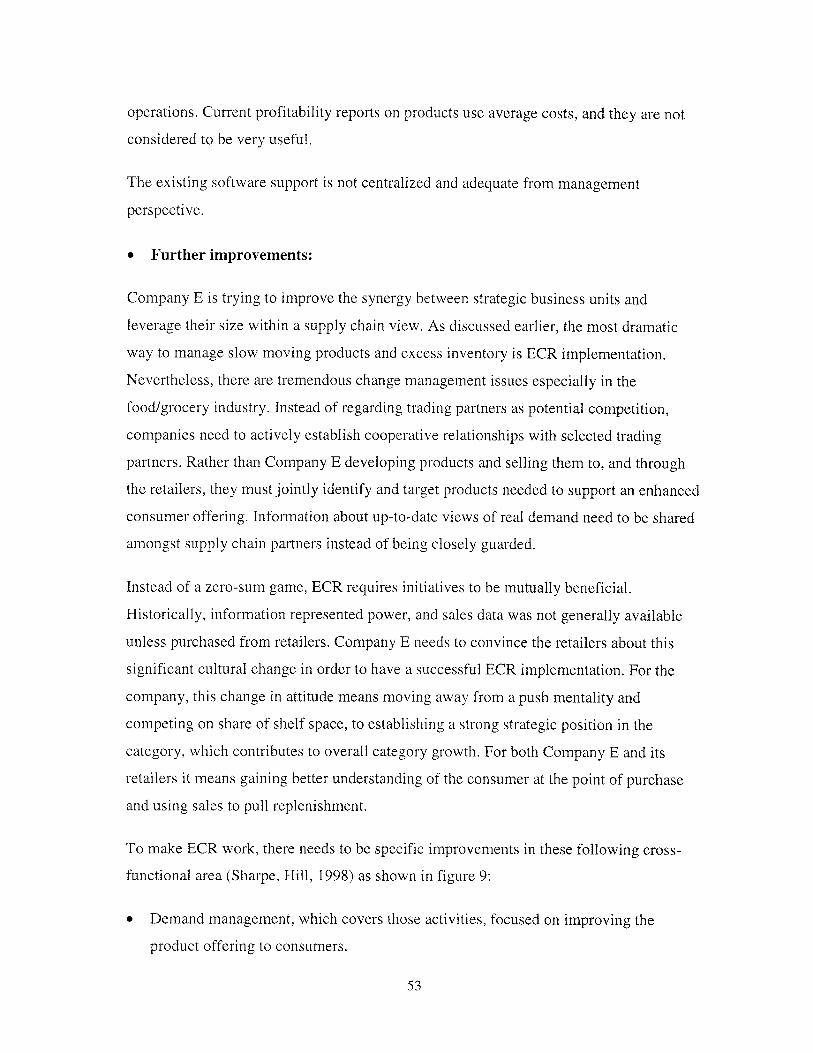
operations. Current profitability reports on products use average costs, and they are not
considered to be very useful.
The existing software support is not centralized and adequate from management
perspective.
* Further improvements:
Company E is trying to improve the synergy between strategic business units and
leverage their size within a supply chain view. As discussed earlier, the most dramatic
way to manage slow moving products and excess inventory is ECR implementation.
Nevertheless, there are tremendous change management issues especially in the
food/grocery industry. Instead of regarding trading partners as potential competition,
companies need to actively establish cooperative relationships with selected trading
partners. Rather than Company E developing products and selling them to, and through
the retailers, they must jointly identify and target products needed to support an enhanced
consumer offering. Information about up-to-date views of real demand need to be shared
amongst supply chain partners instead of being closely guarded.
Instead of a zero-sum game, ECR requires initiatives to be mutually beneficial.
Historically, information represented power, and sales data was not generally available
unless purchased from retailers. Company E needs to convince the retailers about this
significant cultural change in order to have a successful ECR implementation. For the
company, this change in attitude means moving away from a push mentality and
competing on share of shelf space, to establishing a strong strategic position in the
category, which contributes to overall category growth. For both Company E and its
retailers it means gaining better understanding of the consumer at the point of purchase
and using sales to pull replenishment.
To make ECR work, there needs to be specific improvements in these following cross-
functional area (Sharpe, Hill, 1998) as shown in figure 9:
* Demand management, which covers those activities, focused on improving the
product offering to consumers.
53
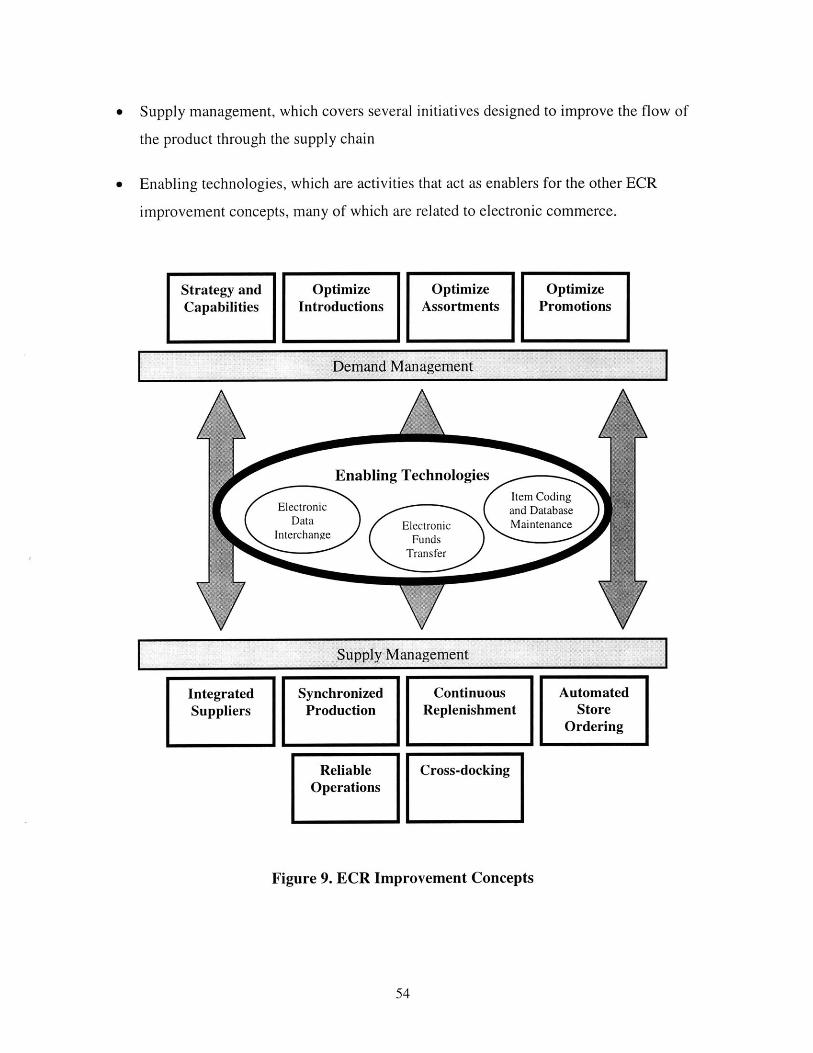
" Supply management, which covers several initiatives designed to improve the flow of
the product through the supply chain
* Enabling technologies, which are activities that act as enablers for the other ECR
improvement concepts, many of which are related to electronic commerce.
Strategy and Optimize Optimize OptimizeCapabilities Introductions Assortments Promotions
Demand Management
Enabling TechnologiesItem Coding
Electronic and DatabaseData Electronic Maintenance
-Interchange FundsTransfer
Supply Management
FIntegrated Synchronized Continuous AutomatedSuppliers Production Replenishment Store
Ordering
Reliable Cross-dockingOperations
Figure 9. ECR Improvement Concepts
54

3.5 Retail Industry
Company F:
Company F is one of the leading office-supply chains in the country, with over $8.5
billion in annual sales. Now, it is moving aggressively to create a major online presence
and the strength in its regular and direct retail operations gives them an advantage over
other B2B players. The company already has a large base of business customers, sales
momentum in the online space, great brand recognition and a sophisticated hub-and-
spoke distribution network to support the growth, which is already in place. It should be
noted that the company is operating in an environment that is highly competitive on
service, flexibility and cost.
In order to further leverage their investments, it is remarkable to see that Company F is
setting itself up to potentially become an application service provider (ASP) for the
small-business customer. In this scenario, their online operations would become the
virtual destination site that would host a small business's software and data and would
also provide the capability to facilitate their payroll, taxes, human resources, legal and
related administrative tasks over the online ASP platform. These services could be
offered a ]a carte or as a package, depending on the customer's requirements. The services
would not necessarily be a company's own product, but they would be hosted on their
Web site. ASPs will be covered in Chapter 4 in more detail.
M Product characteristics:
Product groups group the main products provided by Company F, namely: furniture,
business and communications machines, technology products and office supplies. All
together about 8500 SKUs are being actively managed in the company.
Although the number varies from product to product, on technology items, product life
cycle changes from two years to six months. The relative high value of these products
makes item selection and presentation a crucial issue. As an example, when the company
decides to have 2-3 demo items for copiers in each store, the total inventory can go up as
much as three million dollars on a singe SKU.
55
For these reasons, there is a close focus on merchandising practices. Review of declining
products is happening daily, resulting in 30% year over year product-offering change.
Some of the main reasons for product elimination are older technology, technical defects
with the product, better substitutes that are offered by competitors and most importantly,
profit margins being below target level.
* Supply chain:
"Supply chain management is the company" as mentioned by one of the key executives.
Figure 10 shows how the company is reaching to different customer segments. Company
F is currently view e-commerce as an another channel where they can further improve
their asset utilization by having a common order processing and distribution system.
RetailStores
Online B2BSales >
nel Multi-channel
ing Mail Order Distribution
CommercialDelivery
"Channels"
/
Consumers
Small Office IHome Office
Small &MediumBusiness
Large
Business
"Customer Segments"
Figure 10. Reaching to customers (Courtesy of Company F)
The company also strides in integrating e-commerce into its retail stores, adding Intranet
special order kiosks in its entire US stores. It is interesting to see that for some of the
products with short life cycle and high-value, company F chose not to carry any
inventories other than for demo purposes. As an example, they enhanced their PC
56
Manufacturers
Suppliers &
Service
Providers
Multi-chan
Warehous
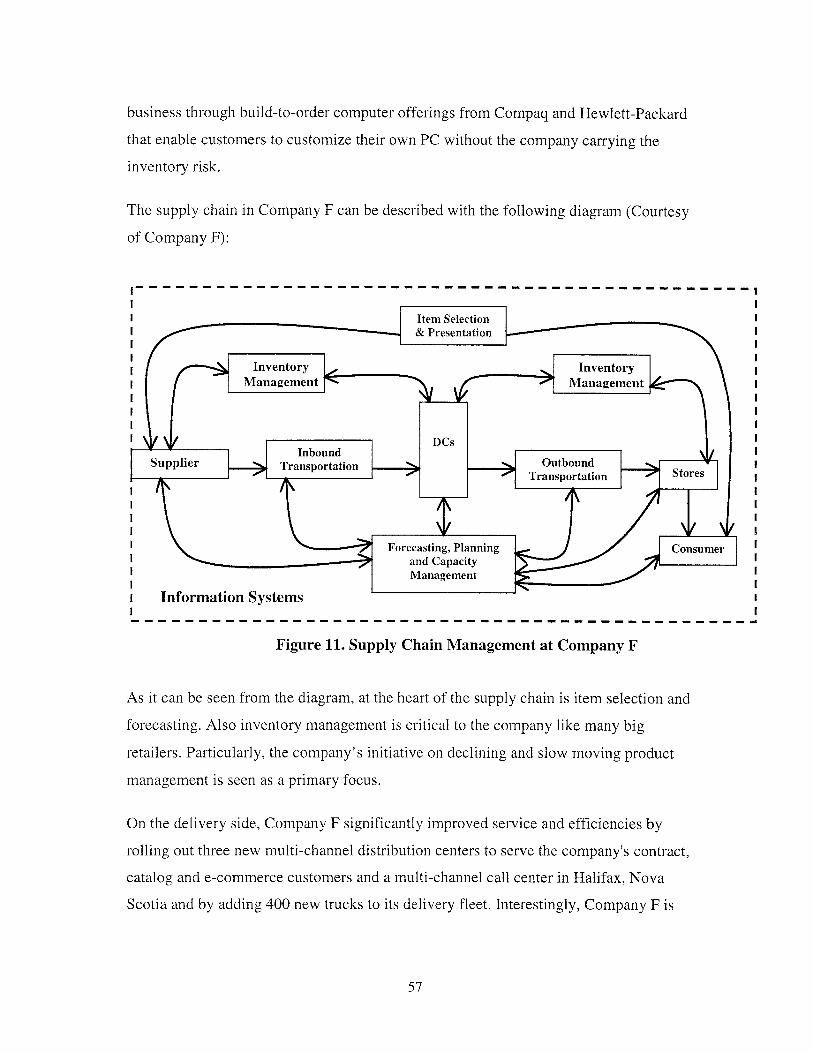
business through build-to-order computer offerings from Compaq and Hewlett-Packard
that enable customers to customize their own PC without the company carrying the
inventory risk.
The supply chain in Company F can be described with the following diagram (Courtesy
of Company F):
---------------------------------------------------------------------
Item Selection
& Presentation
Inventor InventoryManagement Management
DCsInbound
Supplier Transportation T>pOutbound StoresTransportation Soe
N IIForecasting, Planning Consumer
and Capacity
Management
Information Systems
Figure 11. Supply Chain Management at Company F
As it can be seen from the diagram, at the heart of the supply chain is item selection and
forecasting. Also inventory management is critical to the company like many big
retailers. Particularly, the company's initiative on declining and slow moving product
management is seen as a primary focus.
On the delivery side, Company F significantly improved service and efficiencies by
rolling out three new multi-channel distribution centers to serve the company's contract,
catalog and e-commerce customers and a multi-channel call center in Halifax, Nova
Scotia and by adding 400 new trucks to its delivery fleet. Interestingly, Company F is
57
having a lot of back-haul opportunities during their delivery routes, mostly for their
suppliers.
0 Organization and decision makers:
Merchandising makes product portfolio and retirement decisions under the retail division,
reporting to Chief Operating Officer & President of the company. It is no surprise that the
executive vice president of the supply chain management, which is both centralized and
divisional, also reports to the same person.
Once declining products are identified, Company F takes a course of actions including
searching for productivity increases, decreasing the price of the merchandise and making
adjustments in inventory and warehousing. Before actually abandoning the product, the
company considers market share, supplier issues, alternative usage of released assets,
potentially missed sales revenue, logistics cost impact and liquidation value in an
analytical model.
An inventory management group within the supply chain management organization
manages actual deployment of inventory for end-of-life and other products. The
company operates two-tier distribution networks, and slow moving products are moved
back to main distribution centers. At that point, inventory levels and service
commitments and in-stock availability for those items are reevaluated. In parallel, they
also change the item selection and presentation of declining products for all customers
and communicate these decisions one-month in advance to channel partners and
consumers. Company F keeps track of actual fill rate for declining products, consistent
with their high service standards.
- Software support system:
Unlike the previous cases, Company F does not have an ERP system in place; however,
there is a very strong IT support that wraps around all of the decision making processes.
The IT organization matrixes to all divisions except the online sales unit which manages
their own website. Company F's own sophisticated forecasting and replenishment system
uses point of sales data, on hand inventory of each store, and the effects of seasonality.
58
In order to help with SKU rationalization, monthly profitability reports are generated for
each product and product line.
* Performance metrics:
Company F uses EPS, RONA, sales growth and stock price as the main metrics to
evaluate their performance. Company F tries to balance their high service commitment
and supply chain costs. Last year, they were able to increase store fill rates while
improving inventory turns.
0 Further improvement:
Despite all these initiatives, company executives believe that there is not enough focus
given to slow moving and obsolete items by the merchandising team. Supply chain
executives believe that if inventory turns and sales improvements have equal weight in
the eyes of the top management, their job would be easier.
A CPFR initiative would also be useful to coordinate promotions, lower post-promotion
inventory levels and minimize "special buys", all causing excessive inventory which gets
obsolete in a short period.
More sophisticated assortment planning can be implemented by finding out the
correlation between store area demographics and special events, such as school openings
and merchandise offered.
Company G:
Company G is the leading retailer in the country. Their devotion to building customer
loyalty through everyday low pricing and high availability of goods was the main
contributor to their rapid growth over the last decade. The company's success is primarily
based on achieving efficient inventory replenishment through cooperation with channel
partners.
One of the many innovations that Company G was involved in was a new information-
sharing system over the Internet, called CFAR (Collaborative Forecasting and
59
Replenishment). The system improves reliability of longer-term forecasts, which in-turn
eliminate excess inventory, rework, excess labor and waste. There is extensive
information sharing amongst channel partners, where real time store sales are monitored
across the supply chain.
There are many articles written on the supply chain practices of the company that are
beyond the scope of this study; however, it is important to elaborate their forecasting
processes within the context of slow moving inventory management.
M Product characteristics:
From the retail perspective, Company G manages about 125,000 SKUs. Since many
retailers like Company G base their offering on having a broad assortment to provide
"one-stop shopping," SKU (Stock Keeping Unit) counts are relatively high.
There are primarily two types of product categories: seasonal products and basic
replenishment products. Typically, seasonal products like lawn mowers are reviewed
annually or whatever their season is. Based on sales, trends and all other forecast
indicators, these products are reviewed each year starting with a clean sheet. The basic
goods are reviewed on every replenishment cycle, that could be daily, weekly or
occasionally every other week.
Based on buying and delivery frequency, each product's Economic Order Quantity
(EOQ) is calculated. The main driver for EOQ calculations is the predictability of
demand for each SKU and high volume, highly variable products with low predictability
are the ones that retailers like Company G needs to place special attention. Newly
introduced models with unknown demand, end-of-life cycle products and products that
sell year round in low quantities are particularly difficult to forecast and manage.
M Supply chain and forecasting:
Company G manages a complex logistics system. In a nutshell, typically merchandise
moves to the consumer in one defined "stop", usually to consolidate the goods from
multiple vendors into the company's distribution centers. Store demands are pooled to
60
create efficient and fast replenishment orders from each vendor that are then combined
with other in the company's outbound shipping network. Inventory is mostly managed by
vendors with the goal to reduce deployed inventory at the store level.
One of the cornerstones in improving customer service levels, inventory turn rates and
gross sales is establishing a forecasting process that is integral to Sales and Operations
Planning. In Company G, forecasting starts with an unconstrained baseline numbers
generated using demand history, marketing and customer inputs. On the other hand,
operational constraints such as supplier capacity lead times and logistics capabilities are
collected. Finally, demand, order and inventory forecasts are decided through a consensus
meeting.
Forecasting model in Company G incorporates four distinct elements:
+ Time Series: A product's sales history is used to predict the future.
+ Product Life Cycle: Using the demand history of "like" prior products or product
lines over their life or year of life.
+ Causal Analysis: Using cause-effect relationships among sales versus
promotional activities, price and competition.
+ Expert Opinion: Using expert advice from consumer surveys, sales staff, senior
executives and industry experts.
It is important to note that forecast of all SKUs are being done in a closed loop process
where performance is constantly checked and forecast is renewed. Declining products are
easily spotted as the system identifies items that are performing outside planned tolerance
levels. Company G has a special process (Phased-in/Phased-out) that recognizes the
profiles of these types of products during merchandise ordering.
Store level forecasting used to set stock assortments by SKU requires a very different
approach. The vast majority of items have a low rate of sale at SKU level so the volatility
of the sales is the important factor, not the average level.
- Organization and decision makers:
61
In Company G, general merchandise managers reporting to VP of Merchandising are
involved in the decision making process. They do monthly reviews of products in order
to find declining ones. As in previous cases, market share, customer loyalty, supplier
relations and potentially missed revenue are considered before abandoning a product and
the company have a standard process to evaluate those. Once a declining product is
spotted, the company considers new promotions together with adjustments in inventory
and warehousing simultaneously.
Also, product profitability reports for each SKU, product and product line are prepared
every month and used to help with the product abandonment decision. Once the declining
products are spotted, in-stock availability targets are also adjusted depending on the
discretion of store managers.
- Software support system:
Company G has very strong IT support which enables them to process terabytes of sales
data collected through point-of-sale. Furthermore, real-time data visibility is provided to
most of their suppliers to keep track of their product movement throughout the supply
chain. Given the complexity of their operations and magnitude of their sales, best of
breed products are being used in their forecasting and inventory management decision
support software, some of it being custom developed by IBM.
Company G's drive for forecast accuracy is reflected in their implementation of product
life cycle management to their decision support tools. They are at the leading edge of
technology and a benchmark in supply chain management.
E Further improvements:
Company G uses sophisticated algorithms requiring technical systems knowledge in their
existing store and warehouse replenishment systems. System parameters such as lead
times should be maintained by a group of people with appropriate core competencies in
merchandising.
62
In the next chapter, an analysis of software tools enabling the management of declining
products is provided.
63
4. SOFTWARE SUPPORT FOR MANAGEMENT OF DECLINING PRODUCTS
A great number of supply chain tools have been available for the last 3-4 years to provide
intelligent decision support and execution management. Although companies like i2
Technologies come close to providing complete decision support, no single tool provides
the complete range of desired capabilities to manage today's complex supply chain
systems. In the absence of a total packaged solution, many companies are looking to link
their Enterprise Resource Planning (ERP) systems with "best-of-breed" supply chain
planning and real-time-decision support tools connecting not only enterprise-wide
systems but also with those of their suppliers, distributors and end-customers.
Traditionally, ERP tools were not considered under the category of supply chain
management tools. However, many manufacturers now view ERP systems as the core of
their information technology strategies on which to build their supply chain management
solutions. Companies with global operations especially felt the pressure in terms of
scalability of their separate systems, and have moved to implement an ERP solution to
have common data visibility and business processes throughout the enterprise. These
enterprise-wide transactional tools captured all kinds of data and reduced manual
activities and tasks associated with processing financial, inventory and customer-order
information. ERP systems provide an infrastructure for better product life cycle
management tools required by demanding market conditions including:
" Shorter product life cycles
" Product proliferation and customization
" Increased pressure on profit margins
Two of those products are i2 Technologies' RHYTHM Product Lifecycle Management
and SAP's Product Lifecycle Management.
4.1 Product Life Cycle Management Software
In this area two companies have specific products for the management of product life
cycle: SAP and i2 Technologies. Both products acknowledge the emerging view that a
64
total Product Life Cycle Management Process is required with a much broader business
process than the individual product engineering process. Critical activities and decisions
are supported by these modules through the management of product portfolio,
technologies and resources from design to phase out, in order to achieve maximum
growth and lifecycle profitability. This is a cross-functional process that is closely linked
to business processes and systems such as forecasting, demand planning, supply chain
management and strategic capacity planning according to both companies.
Both companies have a strong emphasis on integrated and collaborative product
development process. 12's software focuses on improvement actions grouped in five main
categories:
1. Product Strategy and Portfolio Planning: This is geared towards managing product
development investments by optimally allocating investments in new versus existing
products.
2. Product Requirements Planning: It is mainly identifying and incorporating
customer needs while trying to achieve shorter time-to-market.
3. Development Scheduling and Resource Planning: It is mainly project management
for new product development.
4. Design Sourcing and Reuse: This is an improvement action with the intent of
leveraging common parts and suppliers in order to extend product lifecycle and lower
costs throughout the supply chain.
5. Product Transition Planning: Integration of activities from development, marketing
and supply chain to manage product transitions.
12's RHYTHM Product Lifecycle Management (PLM) has two core modules:
* PLM Planning Solutions which include RHYTHM Portfolio Planner, RHYTHM
Requirements Planner, RHYTHM Development Scheduler, RHYTHM Design
Optimizer and RHYTHM Transition Planner. The modules span all the major phases
in the typical product development and product lifecycle process, from early concept
65
definition, through development and test, launch, to product phase-out. The tools
provide support for strategic long-term issues and operational short-term execution. It
can be implemented as an integrated solution, or phased in gradually, i.e., linked to
introducing new work processes.
* PLM Design Collaboration Solutions which include Requirements Collaboration,
Project Collaboration, RFQ Collaboration and Design Change Collaboration. These
are Internet-based business capabilities to build a highly collaborative community for
product development professionals.
12 Technologies believe that their PLM product is unique in terms of providing a
complete solution by offering these key-values:
" Increased profitability and revenue by optimizing bottleneck resources through more
profitable products.
" Improved revenue stream by reducing time-to-market with respect to design and
supply chain constraints.
" Increased development productivity through web collaboration, reusable product
modules and better design visibility.
Unlike i2, SAP Product Lifecycle Management provides users Web-based access to all
product and process data for the entire life cycle of the product as an integrated part of
their mySAP.com portal. This portal enables the collaboration of business partners by
means of a custom configured web interface. All of the functions are also available
directly from SAP System. In a nutshell, SAP Product Lifecycle Management covers
these functions:
Basic Data Management: It provides a clever way to create a knowledge base for theconfiguration of a wide variety of complex products.
Document Management: It links the administration and distribution of technical designswith the company-wide information flow. Document security management, such asauthorization is an important feature of the product suite.
Change and Life Cycle Management: Product change processes initiated in design areintegrated with costing, planing or production and controlled.
66
Engineering Process: With the mySAP.com portal, developers, design engineers andengineers have a central point of entry for work for further collaboration.
Integration: CAD/CAM systems are connected to the ERP system.
Product Management: Cost controls, budgeting, project schedules and resources are
managed in an integrated way with the ERP system.
The SAP philosophy in its PLM module is based on managing product and design data in
centralized way before the manufacturing, as 80% of a product's eventual cost is
determined during that period. It is much more focused on product development than
product management and, therefore, it is not appropriate to actually name this a complete
PLM module like i2 Technologies' solution set. Although the name of the software
implies complete product life cycle management, in reality, it falls short of expectations.
SAP's Enterprise Management suite, which includes strategic enterprise management,
business intelligence and data warehousing and managerial/financial accounting, is more
appropriate for product and portfolio management analysis.
Under these circumstances, i2 Technologies' solution comes close to providing a
complete solution. Nevertheless, the value that it creates needs to be evaluated on a case-
by-case basis with i2 consultants.
It should also be noted that demand planning or forecasting modules offered by
companies like Manugistics and Logility specifically address the product life cycle
scheme in their processes with easy to use interfaces. In particular, Logility's Voyager
Solutions offer web-based collaboration throughout the supply chain between channel
partners for a large number of SKUs and it is suitable for the retail industry. Other
important players in this area are Syncra and Retek, both best-of-breed products designed
for a particular industry in mind.
In the retail industry where today's customers are growing in sophistication, demanding
excellent service and quality product combined with broader product ranges, data
warehousing is a great tool helping the companies to understand the customers' behavior.
A study conducted by Kurt Salmon Associates in 1997 found that all four software
67
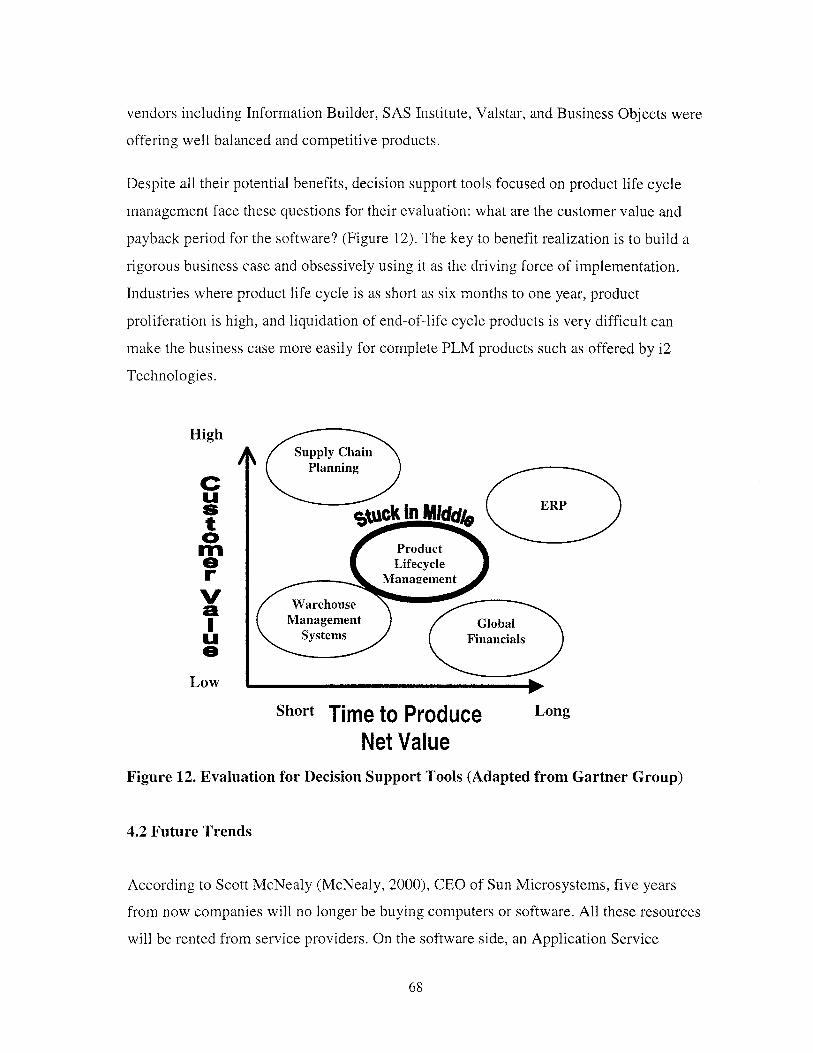
vendors including Information Builder, SAS Institute, Valstar, and Business Objects were
offering well balanced and competitive products.
Despite all their potential benefits, decision support tools focused on product life cycle
management face these questions for their evaluation: what are the customer value and
payback period for the software? (Figure 12). The key to benefit realization is to build a
rigorous business case and obsessively using it as the driving force of implementation.
Industries where product life cycle is as short as six months to one year, product
proliferation is high, and liquidation of end-of-life cycle products is very difficult can
make the business case more easily for complete PLM products such as offered by i2
Technologies.
HighSupply Chain
Planning
CS TERP
S tCk In Middg
M Product
O Lifecycler Management
V Warehouse
i Management Globalys sFinancials
0
Low
Short Time to Produce Long
Net ValueFigure 12. Evaluation for Decision Support Tools (Adapted from Gartner Group)
4.2 Future Trends
According to Scott McNealy (McNealy, 2000), CEO of Sun Microsystems, five years
from now companies will no longer be buying computers or software. All these resources
will be rented from service providers. On the software side, an Application Service
68

Provider or ASP is a company that hosts and manages business applications on behalf of
a client. These applications can range from basic e-mail to groupware and data mart
applications to extremely complex and demanding applications such as Enterprise
Resource Planning (ERP) and Customer Relationship Management (CRM).
The value proposition of the ASP is very compelling: take advantage of the ASP's
expertise and economies of scale in managing applications, and avoid the pain and
expense of hiring your own specialists and constantly installing, maintaining, and
upgrading packaged software.
With ASPs, you can have top-tier business systems right away for a predictable monthly
fee, and this argument is very powerful for the future Product Lifecycle Management
software that may have periodic usage unlike other decision support tools.
In general, it makes sense to consider outsourcing a business application if it:
" Requires special skills to design, deploy, and maintain.
" Does not require value-add from IT to be used successfully. If the application is
broadly available and provides full functionality in its packaged form, it may
make sense to outsource it.
* Cannot be delivered more effectively or cost-efficiently by IT. In the .com age, it
is often good advice to reserve internal management of applications for the most
specialized projects and to consider outsourcing all other applications.
According to Sun Microsystems, the leading ASPs are (EcNet) Advanced Manufacturing
Online, Asera, Bid.Com, BigStep.com, BT, CSC, Corio, Dorado, EDS, eOnline, Infocast,
Interpath, KPN, MT&T, Navisite, NetASPx, Portera, SaskTel and USi. Software vendors
such as PeopleSoft, Oracle, i2 Technologies and Manugistics are reviewing their business
models to become partners of ASPs as this is written.
69
4.3 Proposed Enhancements
One of the key starting points in the management of a product portfolio is coming up with
accurate costing and product profitability figures before any decision. ERP systems have
been capturing transactional data and utilize it in activity based costing. On the other
hand, new methodologies focusing on cost allocations of manufacturing performance
thereby linking profitability to operating metrics could be embedded to those systems.
These types of measures will reflect the relative manufacturing efficiency of products
within a product line assuming that non-material costs are incurred to support the
availability of manufacturing time on machines (assumed to be bottleneck resources).
Capital intensive industries, where we assume that a common machine or sets of
machines manufacture all the products, are the main targets for this type of profitability
revision.
Sometimes, although a product has been declining, it is not always wise to remove it
from production due to strategic competitive issues and other product interdependencies.
Many times the knowledge about these type of product characteristics is kept within a
department, typically marketing, and is not shared across the enterprise. Software vendors
must be able to capture this type of information within revised data models and make it
available to other departments.
Finally, there is further need for optimization modules capable of incorporating
uncertainties in the forecasts when there is a likelihood of possible product obsolescence.
Market obsolescence for a product may occur due to changes in consumer perception or
technological changes, and may not be related to physical newness at all. Decision
support models need to be developed and embedded in software combining the newsboy
problem and integer linear programming approach. Particularly decision support software
specializing in the retail industry needs to be able to recommend the optimal assortment
given the retailer's inventory costs.
Finally, Gross Margin Return on Investment (GMROI) can be a very useful tool in
portfolio analysis. It is a measure of inventory productivity that expresses the relationship
between the total sales, the gross profit margin you earn on those sales and the number of
70
dollars invested in inventory. The formula for finding GMROI as a percentage is
GMROI(%)= gross margin (%) x [sales divided by average inventory at cost]. Using
GMROI as a measuring tool, companies can compare the relative value of every piece of
merchandise they carry and draw conclusions about where they should be concentrating
their efforts to achieve maximum profitability. Software vendors should be including this
metric in analysis provided by inventory management and product lifecycle management
modules.
71
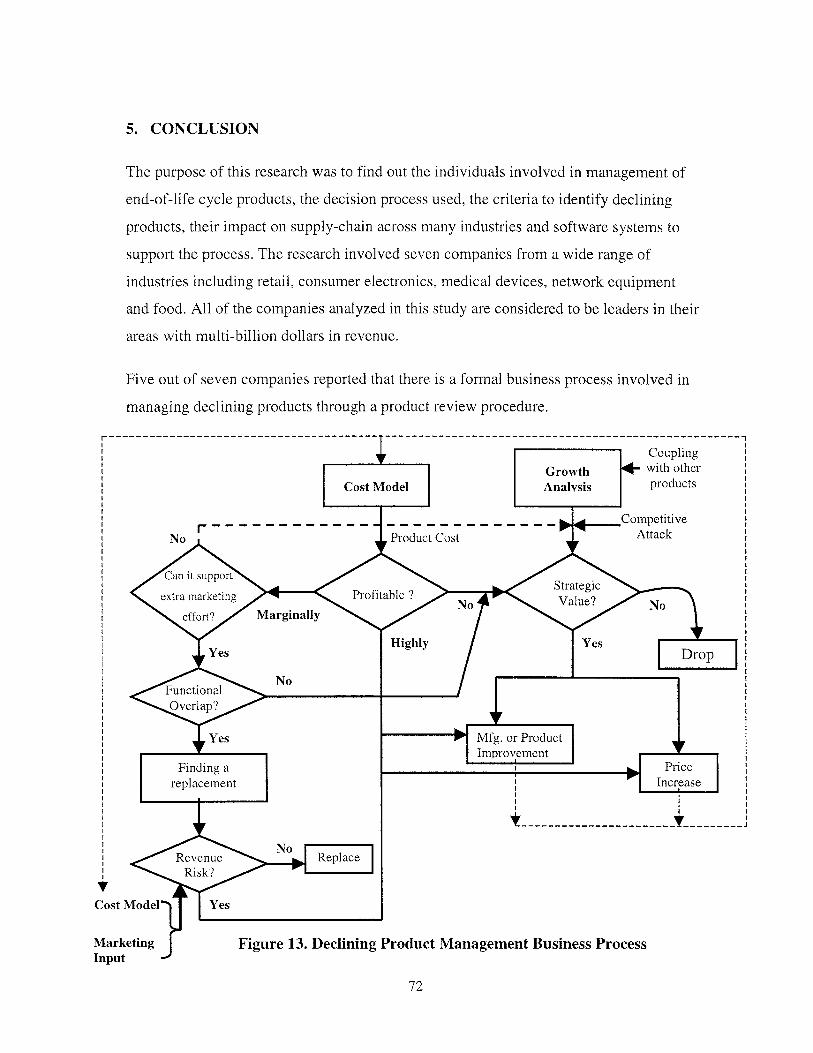
5. CONCLUSION
The purpose of this research was to find out the individuals involved in management of
end-of-life cycle products, the decision process used, the criteria to identify declining
products, their impact on supply-chain across many industries and software systems to
support the process. The research involved seven companies from a wide range of
industries including retail, consumer electronics, medical devices, network equipment
and food. All of the companies analyzed in this study are considered to be leaders in their
areas with multi-billion dollars in revenue.
Five out of seven companies reported that there is a formal business process involved in
managing declining products through a product review procedure.
CouplingGrowth 4with other
Cost Model Analysis products
Competitive
No Product Cost Attack
Can it support
extra marketing Profitable? StrateicNo Value? No
effort? Marginally
Highly YesYes Dro
NoFunctional
Overlap?
Ye Mfg. or Product
ImprovementV
Finding a Pricereplacement Increase
- - ------------------------ T---I------
NoRevenue Replace
Risk?
Cost Model Yes
Marketing Figure 13. Declining Product Management Business ProcessInput
72
This process is more rigorously and frequently followed in retail and high-tech
companies where the average product life cycle ranges from six months to one year. The
frequency of the product revisions changes from monthly reviews in the retail industry to
yearly ones in the food sector.
A typical business process has product costing and marketing input at the heart of it. If a
declining product is found to be unprofitable, then its strategic value with respect to
competitive actions, segment growth and its coupling with other products is evaluated.
Figure 12 represents a common business process derived from this research. Immediate
drop and harvesting are the most common set of actions for declining products. Also,
increase/decrease in price, reducing manufacturing costs and replacement with new
product are common strategic alternatives to product abandonment.
Decision-makers throughout this process are mostly from the marketing department. In
companies with high brand awareness, marketing people have the absolute power, and
this was particularly the case in the consumer electronics industry. When supply chain
becomes the core of the strategy, then a centralized supply chain organization is involved
in the decision-making process. In the retail industry, the merchandising department
manages the product portfolio; however, operational decisions, such as management of
inventory levels for declining product and their repositioning, are made by supply chain
people. When the declining product can not be liquidated and excess inventories are
usually written-off, as it is the case with medical devices industry, supply chain managers
have the complete authority in decision-making process.
In the high-tech industry, many companies are adopting a built-to-order model resulting
in less finished goods inventory and risk of obsolescence. Due to the highly competitive
nature of the market, they adopt planned obsolescence in their product management.
Although products are renewed as frequently as every six months, special attention is
being given to the new product development efforts where modular designs and common
parts are used in order to extend product life cycle.
Six out of seven companies analyzed had an ERP system in place and are actively using it
for product profitability analysis. Only two of them were aware of the existence of
73
product life cycle management software, mainly due to its new presence in marketplace.
Most of the companies want to use decision support tools offered by their ERP vendor;
however, large retailers, who believe that IT is their core competency, prefer to develop
custom software with their technology partners and go with the "best-of-breed" solution.
High-tech companies and retailers were using the web to enable their decision making for
declining products. It is the author's belief that more and more retailers will switch to
Internet devices as a new channel to provide declining, slow-moving and expensive/short
life cycle products such as PCs rather than carrying them in stores.
The Internet also offers a new channel for liquidating declining products without
extensive losses in the consumer electronics and networking industry. These sales are
usually done through a company's or distributor's website. In some cases, company
owned discount stores are used to sell excess inventory and end-of-life cycle products.
Despite all their efforts, the common belief among management ranks is that not enough
attention is given to the management of declining products. Luckily, a new set of web-
enabled decision support tools is emerging to help with this process, from new product
development to product portfolio management. It is expected that they will also be
available by ASPs as this industry's revenues are projected to grow to $2 billion by 2003
according to the technology research firm IDC.
74
REFERENCES:
"The ASP Boom," How to.com: Case Studies, Sun Microsystems Web Site
(www.sun.com)
Alexander, R. S., "The Death and Burial of 'Sick' Products," Journal of Marketing,
Volume 28, April 1964.
Anderson, Carl R. and Frank T. Paine, "PIMS: a Reexamination," Academy of
Management Review, July 1978, pp. 602-612.
Austin, Terry, "The Personal Computer Supply Chain: Unlocking Hidden Value,"
Strategic Supply Chain Alignment, Gower Publishing, UK, 1998, pp. 188-195.
Cottrill, Ken, "Speedier Supply Chains," Journal of Commerce, February 7th 2000, pp.16.
Day, George S., "Diagnosing the Product Portfolio," Journal of Marketing, April 1977,
pp. 29-38.
Dhalla, Nariman and Sonia Yuspeh, "Forget the Product Life Cycle Concept!," Harvard
Business Review, January-February 1976, pp. 102-112.
Fine, Charles, "Clockspeed-Winning Industry Control in the Age of Temporary
Advantage," Sloan School of Management, Perseus Books, Reading, MA, 1998.
Fitzroy, Peter T., "Analytical Methods for Marketing Management," McGraw-Hill,
England, 1976.
Forrester, Jay W., "Market Growth as Influenced by Capital Investment," Industrial
Management Review, Volume 9-2, 1968, pp. 83-105.
75
Gattorna, John (edited by), "Strategic Supply Chain Alignment," Gower Publishing Ltd.,
England, 1998.
Hamelman, Paul W. and Edward M. Mazze, "Improving Product Abandonment
Decisions," Journal of Marketing, April 1972, pp. 20-26.
Johnson, L. and D. Montgomery, "Operations Research in Production, Scheduling and
Inventory Control," Wiley, New York, 1974
Kotler, Philip, "Harvesting Strategies for Weak Products," Business Horizons, August
1978, pp. 15-22.
Lambert, Douglas M., "The Product Abandonment Decision," National Association of
Accountants and The Society of Management Accountants of Canada, 1985.
Machlis, Sharon and Jaikumar Vijayan, "Retailer Chooses Web to Sell Surplus,"
ComputerWorld (www.computerworld.com), January 1 8 th1999.
McNeally, Scott, "Stop Buying Software," How to.com: Executive Perspectives, Sun
Microsystems Web Site (www.sun.com), April 4h2000.
Michael, George C., "Product Petrification: A New Stage in the Life Cycle Theory,"
California Management Review, 1971, pp. 28-31.
Moore, Geoffrey A., "Crossing the Chasm: Marketing and Selling the Technology
Products to Mainstream Customers," HarperColins Publishers, New York, 1991.
Pessemier, Edgar A., "Product Management," John Wiley & Sons, New York, 1975.
76
Polli, Rolando and Victor J. Cook, "A Test of the Product Life Cycle as a Model of Sales
Behavior," Market Science Institute Working Paper, November 1967, p. 43.
Robeson, James F. and William C. Capocino, "The Logistics Handbook," The Free Press,
New York, 1994.
Smallwood, John E., "The Product Life Cycle: A Key to Strategic Marketing Planning,"
MSU Business Topics, winter 1973, pp. 29-35.
Trommer, Diane, "Dell Expands Net Strategy to Supply Chain," Electronic Buyers News
Online (www.ebnonline.com), June 5" 1998.
VESA - Video Electronics Standards Association, "VESA Adopts Digital Flat Panel
Standard," VESA web page (www.vesa.org/pressroom.html), March 2 9 th 1999.
Weitz, Barton A. and Robin Wensley, "Strategic Marketing: Planning, Implementation
and Control," Kent Publishing Company, Boston, MA, 1984.
Wensley, Robin, "Strategic Marketing: Betas, Boxes or Basics," Journal of Marketing,
summer 1981, pp. 173-183.
Worthing, Parker M., "Improving Product Deletion Decision Making, " MSU Business
Topics, summer 1975, pp. 29-38.
Worthing, Parker M., "The Assessment of Product Deletion Decision Indicators,"
FORTRAN Applications in Business Administration, Ann Arbor, MI: Graduate School of
Business, 1971
77
APPENDIX: End-of-Lifecycle Management Survey Form
Instructions: The purpose of this survey is to collect data about companies' practices ontheir business processes managing declining products or product groups. The questionsare grouped under four sections: general information, marketing, finance and supplychain considerations. Please respond to all questions and provide your feedback onissues you find appropriate. Thank you for your interest, participation and invaluabletime.
General Information:
What is your company's name:
Which industry group best classifies your
company's activities?
Consumer Electronics
Telecommunications/Networking
_Apparel
Electric/Electronic Equipment Distribution
__Retail
How would you describe the competitive
environment in your industry?
Does your firm have a formal business
process for management of declining products
and product abandonment?
Who is responsible and involved in decision
making process? Please list the titles and their
place in organization hierarchy.
Yes (Can I obtain a copy?)
No
Division: Title:
78
Report to:
How frequently do you review declining
products?
Annually
Every six months
_QuarterlyMonthly
How many products or product groups do you
have?
How many products or product groups did
your firm eliminate in the last two reviews?
Do you anticipate that the number of
eliminated products will go up in future?
If yes, please mark the top three reasons.
What is the average life-time of your
products?
Do you have product or product groups with
different product-life cycle characteristics?
Is there a framework to categorize products?
If yes, please indicate.
Last review: . . . . . . . . . . . . . . .
Previous review: . . . . . . . . . . . .
Yes
No
Future sales forecast is pessimistic
Current sales volume is substantially lower than the forecast
__Sales volume is following a clearly declining trend
Poor profitability
Old technology/Technical defects
Better substitutes were introduced by competitors
Government Regulations
Overall Market share is declining
ROI is below the target
Other (please specify)
Years / Months
Yes
No
No
Yes, Profitability
Market Share
__Growth Potential
Other (please specify)
79

Once a declining product is identified, what
courses of actions are taken?
Searching for productivity increases
___Modification of product
Decreasing the price
Decreasing the promotion
Increasing the promotion
Adjustments in inventory and warehousing
Adjustments in transportation
Repositioning the product
Others (please specify)
Were the following costs and issues
considered when abandoning a product?
Market share
Customer loyalty
Intangible assets (patents,
trademarks)
Employees
Suppliers
Alternative usage of released
assets
Potentially missed sales
revenue
_Logistics cost impact
_Liquidation/salvage revenue
Other issues
Have you gone through an ERP
implementation?
If yes, please identify the ERP solution.
Do you have a decision support system (DSS)
implemented for product life cycle
management?
If yes, please identify the DSS solution.
Yes
No
SAP
Baan
Oracle
PeopleSoftJD Edwards
Other(.......................)
Yes
No
12 Technologies
Manugistics
SAP APO
Other( ..........................)
80
Do you have a CPFR initiative in place?
Supply Chain Considerations:
Can you distinguish your company through
superior logistics capabilities in one of five
areas of differentiation?
How can you categorize your firm's logistic
organization?
Low cost, superior efficiency
_Superior customer service, in-stock availability, correct order
Value-added services: quick responses, continuous
replenishment, drop shipments etc.
Flexibility: customized service and cost of individual accounts
_Innovation in service: capability to regenerate new values and
competitive advantage.
___Centralized
___Divisional
__Combination of centralized and divisional
_Separate Division
"Once declining products were identified,"
Did your firm revisit the channel structure?
Did your firm inform channel partners/consumers ahead of time of the
deletion decision?
Yes
___No
Yes
No
If yes, please indicate the number of months
Did your firm involve channel partners in decision making process of
product deletion?
Did your firm redefine which customers were served from each facility?
Did your firm reevaluate the new inventory levels for those products?
Yes
No
___Yes
No
Yes
__No
81
Yes
___No
Did your firm reposition those products to higher echelon warehouses?
Did your firm redefine new in-stock availability targets for those
products?
Did your firm changed reverse logistics operations for those products?
Did your firm utilize third-party logistics for those products?
Is there a special order management process for those products?
Is there a special forecasting process for those products?
If Yes, please elaborate:
Please indicate if any of these inventory cost
elements were reevaluated for those
products.
Inventory holding cost
Shortage cost
Backorder cost
Order processing cost
Did your firm change the method of shipment for those products?
What is the method used to account for inventory?
Does your firm perform cycle counting?
Do you use different inventory accuracy level for declining products, C
items?
FIFO (first-in, first-out)
LIFO (last-in, first-out)Average Cost (i.e., moving average)
Yes
No
Yes
___No
82
Yes
No
Yes
No
Yes
No
Yes
No
Yes
No
Yes
No
Yes
No
Do you keep track of any of these performance statistics for your core
customers?
Do you keep track of those statistics for declining products?
Do you have an inventory aging schedule and valuation table?
Do you have business procedures about servicing/spare parts for
abandoned products?
Actual Fill RateMinimum acceptable fill rate
Percent orders back-ordered
Average back-order time
Maximum acceptable back-order time
Yes
No
Yes
No
Yes
___No
Marketing Considerations:
For declining products, which of the following strategies
are employed?
Reduction in manufacturing costs
Modification of product
Increase in price
Decrease in price
Increase promotion
Decrease promotion
Increase sales force effort
Decrease sales force effort
Increase market research
Change supply-chain strategy
Reposition product
Compete in market niches
Trim product line
Replacement with a new product
For products being abandoned, which of the following
strategies is employed?
Dropping immediately
___Harvest - reduce investments while attempting to
harvest earnings
Slowly retiring
___Combination of policies
83
Does your firm attempt to liquidate/sell the abandoned ___Yes
product? ___No
Financial Considerations:
If a product/product group is abandoned, are overhead
and/or joint costs reassigned to remaining products?
Are product profitability reports prepared by:
How frequently are they prepared:
Are product profitability reports prepared by:
Immediately
___In next year's plan
Other
SKU
Product
Product line
Customer
Distribution channel
Weekly
Monthly
Quarterly
Semi-annually
Annually
Other (please specify)
SKUProduct
Product lineCustomer
Distribution channel
Please provide your opinions for the following questions:
What is wrong with the way you do business, currently?
84
" What are the strengths of your organization? What is
working well currently?
" What would you like to see as improvement in your
organization?
N How do you measure success in your organization?
85
- What are the enablers to improve the performance of your
organization?
- How can I improve this survey?
86