Embed Size (px)
Citation preview

ENBRIDGE INCOME PARTNERS LP
MANAGEMENT’S DISCUSSION AND ANALYSIS
September 30, 2015

1
MANAGEMENT’S DISCUSSION AND ANALYSIS FOR THE THREE AND NINE MONTHS ENDED SEPTEMBER 30, 2015 This Management’s Discussion and Analysis (MD&A) dated November 3, 2015 should be read in conjunction with the unaudited interim consolidated financial statements and notes thereto of Enbridge Income Partners LP (EIPLP) for the three and nine months ended September 30, 2015, prepared in accordance with accounting principles generally accepted in the United States of America (U.S. GAAP). All financial measures presented in this MD&A are expressed in Canadian dollars, unless otherwise indicated. Additional information related to EIPLP is available under Enbridge Income Fund’s profile on SEDAR at www.sedar.com.
OVERVIEW EIPLP is involved in the generation, transportation and storage of energy through its interests in its liquids pipelines business, its 50% interest in the Canadian and United States portions of the Alliance Pipeline, which transports natural gas, and its renewable and alternative power generation assets. EIPLP was formed in 2002. THE 2015 TRANSACTION On September 1, 2015, EIPLP acquired 100% interests in the following entities (collectively, the Purchased Entities) from Enbridge and certain subsidiaries for an aggregate consideration of $30.4 billion plus incentive distribution and performance rights, less working capital adjustments (the 2015 Transaction):
Enbridge Pipelines Inc. (EPI)
Enbridge Pipelines (Athabasca) Inc. (EPAI)
Enbridge Hardisty Storage Inc.
Enbridge Southern Lights GP Inc.
Enbridge Lac Alfred Wind Project GP Inc.
Enbridge Massif du Sud Wind Project GP Inc.
Enbridge Blackspring Ridge I Wind Project GP Inc.
Enbridge Saint Robert Bellarmin Wind Project GP Inc. Prior to September 1, 2015, EIPLP, the entity that directly holds the underlying operating assets and liabilities, was 100% owned and controlled by Enbridge Income Partners GP Inc. (EIPGP) and Enbridge Commercial Trust (ECT) through their holdings in Class A units of EIPLP. Both entities at the time were wholly-owned consolidated subsidiaries of Enbridge Income Fund (the Fund). EIPGP also acted as the general partner with the right to manage, control and operate the businesses of EIPLP. The unitholders of the Fund are Enbridge Income Fund Holdings Inc. (ENF), a public company listed on the Toronto Stock Exchange (TSX), and Enbridge Inc. (Enbridge), a North American transporter, distributor and generator of energy listed on the TSX and New York Stock Exchange. Upon closing of the 2015 Transaction, Enbridge acquired a controlling interest in EIPLP of approximately 57% reducing ECT’s ownership to approximately 43%. Additionally, Enbridge now holds a 51% direct interest in EIPGP. Consequently, ECT ceased to consolidate EIPLP. Enbridge also received a contractual right to control the majority of the Board of Trustees of ECT. As a result, the Fund ceased to consolidate ECT as it is no longer the primary beneficiary of ECT nor does it control ECT. The Fund continues to participate in the ownership and management of the indirectly owned entities held by EIPLP through its governance structure, which includes Trustee oversight and decision making related to the underlying assets. As a result of the 2015 Transaction, EIPLP allocates earnings based on the Hypothetical Liquidation at Book Value (HLBV) method. The HLBV method is applied to equity method investments where cash distributions, including both preference and residual distributions, are not based on the investor’s ownership percentages. Under the HLBV method, a calculation is prepared at each balance sheet date to

2
determine the amount that partners would receive if EIPLP were to liquidate all of its assets, as valued in accordance with U.S. GAAP, and distribute that cash to the investors. The difference between the calculated liquidation distribution amounts at the beginning and the end of the reporting period, after adjusting for capital contributions and distributions, are the partners’ share of the earnings or losses from the equity investment for the period. The 2015 Transaction was accounted for as a transaction among entities under common control, similar to a pooling of interests, whereby the assets and liabilities acquired were recorded at Enbridge’s historic carrying values. Financial information for periods prior to September 1, 2015 have been retrospectively adjusted to present the result of operations for EIPLP and its interests in the Purchased Entities on a combined basis. THE 2014 TRANSACTION On November 7, 2014, EIPLP completed a transaction whereby it acquired from Enbridge a 50% equity interest in the United States segment of the Alliance Pipeline (Alliance US) and subscribed for and purchased Class A Units of Enbridge subsidiaries which provide a defined cash flow stream from the Southern Lights Pipeline (Southern Lights Class A Units) for $1.8 billion (the 2014 Transaction). The Alliance US component of the 2014 Transaction was accounted for as a transaction among entities under common control, similar to the 2015 Transaction. Financial information for periods prior to November 7, 2014 have been retrospectively adjusted to present the result of operations for EIPLP and its interests in Alliance US on a combined basis. The Southern Lights Class A Unit component of the 2014 Transaction was accounted for as a loan investment and did not require retrospective restatement. As part of the 2015 Transaction, EIPLP indirectly acquired the Class B Units of the Canadian portion of Southern Lights (Southern Lights Canada). Together, with the Class A Units EIPLP acquired in the 2014 Transaction, EIPLP holds all the ownership, economic interests and voting rights, direct and indirect, in Southern Lights Canada. For further details refer to Liquids Pipelines – Southern Lights Pipeline. OPERATING SEGMENTS Subsequent to the 2015 and 2014 Transactions, EIPLP continues to conduct its business through three business segments: Liquids Pipelines; Gas Pipelines; and Green Power. These operating segments are strategic business units established by senior management to facilitate the achievement of EIPLP’s long-term objectives and the objectives of EIPLP’s unitholders, as well as to aid in resource allocation decisions and to assess operational performance. Financing costs, management and administrative costs, current and deferred income taxes and other costs not attributable to specific business segments are presented on a consolidated basis. Liquids Pipelines Liquids Pipelines consists of common carrier and contract crude oil, natural gas liquids (NGL) and refined products pipelines, feeder pipelines, gathering systems and terminals in Canada, including Canadian Mainline, Regional Oil Sands System, Southern Lights Pipeline, which includes Southern Lights Canada and Class A units of the United States portion of Southern Lights (Southern Lights US) and Feeder Pipelines and Other. Gas Pipelines Gas Pipelines includes EIPLP’s 50% interest in both the Canadian and United States portions of the Alliance Pipeline system, which transports liquids-rich natural gas from northeast British Columbia, northwest Alberta and the Bakken area of North Dakota to Channahon, Illinois. Green Power Green Power includes approximately 1,437 megawatts (MW) (1,052 MW net) of renewable and alternative energy generating capacity. Green Power includes wind farms located in Alberta, Ontario, Quebec and Saskatchewan and solar facilities located in Ontario.

3
CONSOLIDATED EARNINGS1 Three months ended Nine months ended
September 30, September 30,
2015 2014 2015 2014
(millions of Canadian dollars) Liquids Pipelines (357) (43) (287) 579 Gas Pipelines 31 31 108 104 Green Power 27 24 109 89 Eliminations and Other 63 17 131 85
Earnings before interest and income taxes (236) 29 61 857 Interest expense (90) (66) (232) (241) Income taxes recovery/(expense) 66 51 79 (30) Special interest rights distributions - TPDR
2 (14) - (14) -
Earnings/(loss) attributable to general and limited partners (274) 14 (106) 586 1 Earnings for all periods have been retrospectively adjusted to furnish comparative information related to the 2015 Transaction
and the 2014 Transaction as prescribed by U.S. GAAP for common control transactions. 2 Temporary Performance Distribution Right (TPDR) refers to the paid-in-kind distribution component of the Special Interest
Right (SIR) distribution. See Recent Developments.
Loss attributable to the general and limited partners of EIPLP for the third quarter of 2015 was $274 million compared with earnings of $14 million in the third quarter of 2014. Loss attributable to the general and limited partners of EIPLP was $106 million for the nine months ended September 30, 2015, compared with earnings of $586 million in the comparative 2014 period. Despite the net benefits of the 2015 Transaction and the 2014 Transaction, the comparability of EIPLP’s results was impacted by a number of unusual, non-recurring or non-operating factors, the most significant of which were changes in unrealized derivative fair value gains and losses. EIPLP has a comprehensive long-term economic hedging program to mitigate exposures to interest rate, foreign exchange and commodity prices. The changes in unrealized mark-to-market accounting impacts from this program create volatility in short-term earnings, but EIPLP believes over the long-term it supports reliable cash flows. The majority of EIPLP’s unrealized derivative fair value gains and losses are within its Liquids Pipelines segment, specifically within the Canadian Mainline, which was acquired in the 2015 Transaction. The changes in unrealized fair value losses on derivative financial instruments in the Canadian Mainline are used to risk manage exposures inherent within the Competitive Toll Settlement (CTS), namely foreign exchange, power cost variability and allowance oil commodity prices. For the three months ended September 30, 2015 and 2014, Canadian Mainline recognized net unrealized derivative losses of $699 million and $312 million, respectively. For the nine months ended September 30, 2015 and 2014, Canadian Mainline recognized net unrealized derivative losses of $1,273 million and $259 million, respectively. Excluding the impact of the changes in unrealized losses on derivative instruments, EIPLP earnings increased period-over-period primarily as a result of stronger operating performance from Canadian Mainline. Earnings from Canadian Mainline reflected positive effects of higher throughput, partly attributed to the expansion of EIPLP’s mainline system completed in July 2015, higher terminalling revenues and a favourable United States/Canada foreign exchange rate. Partially offsetting these positive factors was a lower average Canadian Mainline International Joint Tariff (IJT) Residual Benchmark Toll, although this impact lessened commencing the second quarter of 2015 as effective April 1, 2015, this toll increased by US$0.10 per barrel to US$1.63 per barrel. Other factors negatively impacting earnings were higher power costs associated with higher throughput and higher depreciation expense due to an increased asset base. Partially mitigating the impact of a lower Canadian Mainline IJT Residual Benchmark Toll were new surcharges related to system expansions, including a surcharge for the Edmonton to Hardisty Expansion pipeline completed in April 2015.

4
Within Gas Pipelines, earnings from Alliance US for the nine months ended September 30, 3015 were higher compared with the corresponding 2014 period primarily due to the effects of favourable foreign exchange rates with respect to the unhedged portion of Alliance US United States dollar cash flow, partially offset by a shutdown of the Canadian portion of Alliance Pipeline (Alliance Canada) in August 2015. Higher earnings from Green Power for the three and nine month periods in 2015 compared with the corresponding 2014 periods reflected incremental earnings from the purchase of additional interest in the Lac Alfred and Massif de Sud wind farms in the fourth quarter of 2014. Finally, the change in earnings/(loss) attributable to general and limited partners period-over-period was also impacted by higher income tax recovery due to taxable losses, higher interest expense in the third quarter of 2015 to support increased business activities and TPDR distributions. FORWARD-LOOKING INFORMATION Forward-looking information, or forward-looking statements, have been included in this MD&A to provide information about EIPLP and EIPLP’s subsidiaries and affiliates, including management’s assessment of EIPLP’s future plans and operations. This information may not be appropriate for other purposes. Forward-looking statements are typically identified by words such as “anticipate”, “expect”, “project”, “estimate”, “forecast”, “plan”, “intend”, “target”, “believe”, “likely” and similar words suggesting future outcomes or statements regarding an outlook. Forward-looking information or statements included or incorporated by reference in this document include, but are not limited to, statements with respect to the following: expected earnings/(loss) before interest and income taxes or adjusted earnings/(loss) before interest and income taxes; expected earnings/(loss)or adjusted earnings/(loss); expected future available cash flow from operations (ACFFO); expected future cash flows; expected costs related to projects under construction; expected in-service dates for projects under construction; expectations regarding the impact of the 2015 Transaction and the 2014 Transaction; and expected capital expenditures. Although EIPLP believes these forward-looking statements are reasonable based on the information available on the date such statements are made and processes used to prepare the information, such statements are not guarantees of future performance and readers are cautioned against placing undue reliance on forward-looking statements. By their nature, these statements involve a variety of assumptions, known and unknown risks and uncertainties and other factors, which may cause actual results, levels of activity and achievements to differ materially from those expressed or implied by such statements. Material assumptions include assumptions about the following: the expected supply of and demand for crude oil, natural gas, NGL and renewable energy; prices of crude oil, natural gas, NGL and renewable energy; expected exchange rates; inflation; interest rates; availability and price of labour and pipeline construction materials; operational reliability; customer and regulatory approvals; maintenance of support and regulatory approvals for EIPLP’s projects; anticipated in-service dates; weather; expected future ACFFO; and capital project funding. Assumptions regarding the expected supply of and demand for crude oil, natural gas, NGL and renewable energy, and the prices of these commodities, are material to and underlie all forward-looking statements. These factors are relevant to all forward-looking statements as they may impact current and future levels of demand for EIPLP’s services. Similarly, exchange rates, inflation and interest rates impact the economies and business environments in which EIPLP operates and may impact levels of demand for EIPLP’s services and cost of inputs, and are therefore inherent in all forward-looking statements. Due to the interdependencies and correlation of these macroeconomic factors, the impact of any one assumption on a forward-looking statement cannot be determined with certainty, particularly with respect to expected earnings before interest and taxes (EBIT), adjusted EBIT, expected earnings/(loss), adjusted earnings/(loss) and ACFFO. The most relevant assumptions associated with forward-looking statements on projects under construction, including estimated completion dates and expected capital expenditures, include the following: the availability and price of labour and pipeline construction materials; the effects of inflation and foreign exchange rates on labour and material costs; the effects of interest rates on borrowing costs; the impact of weather; and customer and regulatory approvals on construction and in-service schedules. EIPLP’s forward-looking statements are subject to risks and uncertainties pertaining to operating performance, regulatory parameters, project approval and support, weather, economic and competitive conditions, changes in tax law and tax rate increases, exchange rates, interest rates, commodity prices and supply of and demand for commodities, including but not limited to those risks and uncertainties discussed in this MD&A and in EIPLP’s other filings with Canadian securities regulators. The impact of any one risk, uncertainty or factor on a particular forward-looking statement is not determinable with certainty as these are interdependent and EIPLP’s future course of action depends on management’s assessment of all information available at the relevant time. Except to the extent required by applicable law, EIPLP assumes no obligation to publicly update or revise any forward-looking statements made in this MD&A or otherwise, whether as a result of new information, future events or otherwise. All subsequent forward-looking statements, whether written or oral, attributable to EIPLP or persons acting on EIPLP’s behalf, are expressly qualified in their entirety by these cautionary statements.

5
NON-GAAP MEASURES This MD&A contains references to adjusted EBIT, adjusted earnings and ACFFO. Adjusted EBIT represents EBIT adjusted for unusual, non-recurring or non-operating factors on both a consolidated and segmented basis. Adjusted earnings represents earnings adjusted for unusual, non-recurring or non-operating factors included in adjusted EBIT, as well as adjustments for unusual, non-recurring or non-operating factors in respect of interest expense and income taxes on a consolidated basis. These factors, referred to as adjusting items, are reconciled and discussed in the financial results sections for the affected business segments. Adjusting items referred to as changes in unrealized derivative fair value gains and losses are presented net of amounts realized on the settlement of derivative contracts during the applicable period. ACFFO represents EIPLP’s cash available to fund distributions on partnership units as well as for debt repayments and reserves. ACFFO consists of operating cash flow from EIPLP’s underlying businesses less deductions for maintenance capital expenditures, EIPLP’s administrative and operating expense, interest expense, applicable taxes and other reserves pertaining to items of an unusual or transient nature which are not indicative of the underlying or sustainable cash flows of the business. Such reserves are determined by management of Enbridge Management Services Inc. (EMSI or the Manager). ACFFO is important to unitholders as EIPLP’s objective is to provide a predictable flow of distributions to unitholders. The Manager believes the presentation of adjusted EBIT, adjusted earnings and ACFFO provide useful information to investors and unitholders and provide increased transparency and insight into the performance of EIPLP. The Manager uses adjusted EBIT and adjusted earnings to set targets and to assess the performance of EIPLP. The Manager also uses ACFFO to assess the performance of EIPLP. Adjusted EBIT, adjusted earnings and ACFFO are not measures that have standardized meanings prescribed by U.S. GAAP and are not considered U.S. GAAP measures. Therefore, these measures may not be comparable with similar measures presented by other issuers. Please refer to the earnings reconciliation within the financial results for each business segment and the reconciliation between the GAAP and non-GAAP measures. NON-GAAP RECONCILIATIONS Three months ended Nine months ended
September 30, September 30,
2015 2014 2015 2014
(millions of Canadian dollars) Earnings before interest and income taxes (236) 29 61 857 Retrospective adjustments
1:
2015 Transaction - Liquids Pipelines 325 76 324 (502) 2015 Transaction - Green Power (5) (8) (36) (19) 2015 Transaction - Eliminations and Other - (17) (9) (85) 2014 Transaction - Gas Pipelines - (17) - (56) Adjusting items: Changes in unrealized derivative value loss 214 (14) 255 (14) Translation of foreign intercompany loan, unrealized (55) - (110) - Gain on sale of certain Virden System assets - - (22) - Derecognition of regulatory balances - - (8) - Other 2 2 - 5
Adjusted earnings before interest and income tax 245 51 455 186 1 The impact of the retrospective adjustments related to the 2015 Transaction and 2014 Transaction have been removed from
adjusted EBIT to reflect earnings generated under EIPLP’s ownership effective September 1, 2015 and November 7, 2014, respectively.

6
ADJUSTED EARNINGS
Three months ended Nine months ended
September 30, September 30,
2015 2014 2015 2014
(millions of Canadian dollars) Liquids Pipelines 178 20 256 65 Gas Pipelines 37 14 114 48 Green Power 22 17 73 73 Eliminations and Other 8 - 12 -
Adjusted earnings before interest and income taxes 245 51 455 186 Interest expense (30) - (37) - Income taxes 29 (10) (39) (29) Adjusting items related to income taxes:
Tax on adjusting items (50) 5 (49) 5 Derecognition of regulatory balances - - 16 - Impact of tax rate changes - - 18 -
Special interest rights distributions - TPDR (14) - (14) -
Adjusted earnings attributable to general and limited partners 180 46 350 162
Adjusted EBIT were $245 million and $455 million for the three and nine months ended September 30, 2015, respectively, compared with $51 million and $186 million for the comparative 2014 periods. The increase in adjusted EBIT is directly attributable to the significant increase of EIPLP’s asset base following the 2015 Transaction and the 2014 Transaction. Adjusted earnings attributable to general and limited partners, referred to as adjusted earnings, were $180 million and $350 million for the three and nine months ended September 30, 2015, respectively, compared with $46 million and $162 million for the comparative 2014 periods. The period-over-period increases reflected in the adjusted EBIT discussion above were partially offset by higher interest expense and income taxes due to increased business activity, as well as TPDR distributions on the Special Interest Rights. AVAILABLE CASH FLOW FROM OPERATIONS
1
Three months ended Nine months ended
September 30, September 30,
2015 2014 2015 2014
(millions of Canadian dollars) Adjusted EBIT 245 51 455 186 Depreciation and amortization expense
75 34 144 101
Distributions from Southern Lights Class A units
6 - 16 -
Distributions from Alliance Pipeline in excess of/(less
than) earnings
1 5 (15) 10 Maintenance capital expenditures
2 (27) (3) (34) (7)
Interest expense
(27) (3) (33) (9) Adjusted current income tax expense
3 (36) 1 (56) (6)
Available cash flow from operations (ACFFO) 237 85 477 275 1 ACFFO is a non-GAAP measure that does not have any standardized meaning prescribed by U.S. GAAP. See definition within
Non-GAAP Measures section. 2 Maintenance capital expenditures are expenditures that are required for the ongoing support and maintenance of the existing
pipeline system or that are necessary to maintain the service capability of the existing assets (including the replacement of components that are worn, obsolete, or completing their useful lives). For the purpose of ACFFO, maintenance capital excludes expenditures that extend asset useful lives, increase capacities from existing levels or reduce costs to enhance revenues or provide enhancements to the service capability of the existing assets.
3 Includes current income tax expense adjusted for tax on items of an unusual or transient nature which are not indicative of the underlying business or sustainable cash flows of the business.

7
ACFFO consists of adjusted EBIT from EIPLP’s underlying businesses adjusted for non-cash items included in EBIT, such as depreciation and amortization, distributions from EIPLP’s investments in excess of or less than, as applicable, earnings, less deductions for maintenance capital expenditures, interest expense and applicable taxes. ACFFO represents cash available to fund distributions on Class A Units and Class C Units, as well as for debt repayments and reserves. Such reserves are determined by the Manager. For the three months ended September 30, 2015, EIPLP’s ACFFO was $237 million, an increase of $152 million compared with the same period of 2014. For the nine months ended September 30, 2015, EIPLP’s ACFFO was $477 million, an increase of $202 million compared with the same period of 2014. Similar to adjusted EBIT, ACFFO increased for the three and nine month periods ended September 30, 2015 compared with the same periods of 2014, due to the significant increase of EIPLP’s asset base following the 2015 Transaction and the 2014 Transaction. The period-over-period increase was partially offset by higher maintenance capital expenditures and higher interest expense in 2015 due to increased business activity resulting from an increased asset base.
RECENT DEVELOPMENTS CANADIAN LIQUIDS PIPELINES AND RENEWABLE ENERGY ASSETS TRANSACTION On September 1, 2015, EIPLP completed the 2015 Transaction for $30.4 billion plus incentive distribution and performance rights, less working capital adjustments. The Liquids Pipelines Assets primarily consist of the Canadian Mainline, held through EPI, and the Regional Oil Sands System, held through EPAI. The Canadian Mainline includes a number of large diameter crude oil, NGL and refined products pipelines receiving hydrocarbon liquids at, and making deliveries to, various locations in western Canada and connecting to the Lakehead System, which is owned by Enbridge Energy Partners, L.P. (EEP), an affiliate of EIPLP, at the Canada/United States border near Gretna, Manitoba and Neche, North Dakota. The Canadian Mainline also includes a number of pipelines in eastern Canada. The Regional Oil Sands System includes a number of trunk line and lateral pipelines which collect synthetic crude oil and diluted bitumen from eight different producing oil sands projects for delivery to pipeline hub terminal locations at Edmonton and Hardisty, Alberta. The Renewable Energy Assets include interests in three operational wind farms in Quebec and one operational wind farm in Alberta. Consideration EIPLP acquired all of the issued and outstanding shares of each of the Purchased Entities from Enbridge and certain Enbridge subsidiaries. The aggregate purchase price payable by EIPLP to Enbridge consisted of approximately $2.7 billion in cash and $15.7 billion of units of EIPLP. EIPLP also assumed debt from the Purchased Entities with a book value of approximately $11.7 billion. To partially fund the 2015 Transaction, EIPLP issued 443 million Class C Units at a price of $35.44 per unit. The EIPLP Class C Units have direct voting rights and are entitled to non-cumulative distributions equivalent to distributions declared on a unit of the Fund. The holders of this class of units have an exchange right which allows for an exchange of the EIPLP Class C Units for Fund Units, ECT Preferred Units or common shares of ENF on a one-for-one basis at any time. In addition, a portion of the consideration included Special Interest Rights (SIR) issued to Enbridge. The holders of the SIR are entitled to receive Incentive Distribution Rights (IDR) and TPDR distributions (collectively, SIR distributions) in priority to any distributions which are to be paid to holders of any other units, except the EIPLP Class E Unit, which are discussed below. The IDR includes a base annual incentive fee amount of $7.9 million and is also entitled to 25% of the pre-incentive distributable cash flow above a base distribution threshold of $1.295 per unit, reduced by a tax factor (unchanged from the existing incentive sharing formula) and is paid out of ECT. Distributions over $1.890 per unit will be distributed from EIPLP.

8
The holders of the TPDR will receive a distribution equivalent to 33% of pre-incentive distributable cash flow above the base distribution of $1.295 per unit. The TPDR will be paid in the form of Class D units of EIPLP and will be issued each month until the later of the end of 2020 or 12 months after the Canadian Line 3 Replacement Program enters service. The Class D unitholders will receive a distribution each month equal to the per unit amount paid on Class C units, but to be paid in kind in additional Class D units. Each Class D unit is convertible into a cash paying Class C unit of EIPLP in the fourth year after its issuance. The SIR have no direct voting rights, except in limited circumstances. The SIR are designed to provide consideration for the secured growth embedded within the transferred businesses; however, the cash outflows related to this incentive mechanism will be deferred (until such time as the units are convertible into a class of cash paying units in the fourth year after issuance). EIPLP also issued one Class E Unit at a value of approximately $475 million to Enbridge. The EIPLP Class E Unit is entitled to a redemption amount approximately equal to the Enbridge Employee Services Canada Inc. (EESCI) Series A Preferred Shares after-tax redemption amount. For further details on the EESCI Series A Preferred Shares refer to Related Party Transactions. The redemption amount will be paid in priority to all other distributions payable. This class of share has no voting rights, except in limited circumstances. As a part of the 2015 Transaction, EIPGP entered an agreement with EMSI to delegate the execution of certain of its powers to the Manager under an Intercorporate Services Agreement. The Manager will be responsible for the operations and day-to-day management of the Purchased Entities as well as assets previously held by EIPLP. The Manager will also provide EIPLP administrative and general support services.
OBJECTIVES AND STRATEGY EIPLP’s objective is to provide a predictable flow of distributable cash and to increase, where prudent, cash distributions to its unitholders, being ECT and Enbridge. EIPLP’s objectives and strategies are also aligned to support the corporate vision and strategies of its sponsor, Enbridge. In order to achieve these objectives, the Manager pursues the following principal strategies which entail:
Commitment to Safety and Operational Reliability;
Strengthen Core Businesses;
Focus on Project Management; and
Preserve Financing Strength and Flexibility.
COMMITMENT TO SAFETY AND OPERATIONAL RELIABILITY The commitment to safety and operational reliability means achieving industry leadership in safety (process, public and personal) and ensuring the reliability and integrity of the systems Enbridge and its subsidiaries operate in order to generate, transport and deliver the energy society counts on and to protect the environment. Under the umbrella of Enbridge’s Operational Risk Management (ORM) Plan introduced in 2010, Enbridge and EIPLP have undertaken extensive maintenance, integrity and inspection programs across its pipeline systems. The ORM Plan has resulted in strong improvements in the area of safety and operational risk management, bolstering incident response capabilities, employee and public safety protocols and improved communications with landowners and first responders. In addition, an enterprise-wide safety and risk management framework has been implemented to ensure Enbridge identifies, prioritizes and effectively prevents and mitigates risks across the enterprise. Supporting these initiatives is a safety culture that strives towards a target of 100% safe operations, with a belief that all incidents can be prevented. To achieve the goal of industry leadership, Enbridge measures its performance as compared to standard industry performance, transparently reports its results and continues to use external assessments to measure its performance.

9
STRENGTHEN CORE BUSINESSES The 2015 Transaction is expected to be a transformational transaction for EIPLP. It provided a greater asset scale and is therefore, expected to enhance distributions to EIPLP’s unitholders. Within EIPLP’s Liquids Pipelines segment, business strategies continue to be focused on providing access to new markets for growing production from northwestern Canada, optimizing and expanding mainline operations and expanding regional oil sands infrastructure. EIPLP’s assets are strategically located and well-positioned to capitalize on these opportunities. Throughout 2013, the Canadian Mainline has continued to optimize and expand its mainline system and record throughput levels were reached, driven by strong supply and refinery demand in combination with efforts to maximize capacity and throughput and to enhance scheduling efficiency with shippers. The Liquids Pipelines business that EIPLP acquired is expected to have future organic growth opportunities beyond the current inventory of secured projects, which are further discussed in Growth Projects. EIPLP will have a first right to execute any such projects that fall within the footprint of the Canadian Liquids Pipelines Business. In Gas Pipelines, EIPLP seeks to optimize the competitive advantage of its existing asset footprint, as the Alliance Pipeline is well-positioned to provide liquids-rich gas transportation to developing regions in northeast British Columbia, northwestern Alberta and the Bakken. In 2013, Alliance Pipeline also announced a New Services Framework for shipments on the Alliance Pipeline and, following regulatory approval, is prepared to implement this New Services Framework commencing December 1, 2015. Long-term contracts to a level of total targeted capacity have been secured through staged and non-staged receipt or full path services with an average contract length of approximately five years. For further details refer to Gas Pipelines – Alliance Pipeline System – Alliance Pipeline Recontracting. In Green Power, strategies are driven by the objective to manage and maintain its facilities in such a way to maximize power generation and related revenues when the relevant wind, solar or waste heat energy resource is available. The Manager will continue to assess ways to generate value for EIPLP’s partners, including reviewing opportunities that may lead to acquisitions or other strategic transactions, some of which may be material and involve EIPLP’s sponsor. Opportunities are screened, analyzed and assessed using strict operating, strategic and financial criteria with the objective of ensuring the effective deployment of capital and the enduring financial strength and stability of EIPLP. FOCUS ON PROJECT MANAGEMENT The Manager’s objective is to safely deliver projects on time and on budget and at the lowest practical cost while maintaining the highest standards for safety, quality, customer satisfaction and environmental and regulatory compliance. With the large slate of commercially secured growth projects being undertaken by EIPLP, successful project execution is critical to achieving EIPLP’s overall strategy. Growth projects across the Enbridge entities, including EIPLP, are managed centrally by Enbridge’s Major Projects Group (Major Projects). Major Projects continues to build upon and enhance the key elements of its rigorous project management processes including: employee and contractor safety; long-term supply chain agreements; quality design, materials and construction; extensive regulatory and public consultation; robust cost, schedule and risk controls; and efficient project transition to operating units. PRESERVE FINANCING STRENGTH AND FLEXIBILITY The maintenance of adequate financing strength and flexibility is crucial to the growth strategy of both Enbridge and EIPLP. Ongoing access to cost effective sources of debt and equity capital is critical to the successful execution of EIPLP’s strategy to expand existing assets and acquire or develop new energy infrastructure.

10
Enbridge’s financial strategies are designed for all its sponsored vehicles and subsidiaries to ensure they have sufficient financial flexibility to meet their capital requirements. To support this objective, Enbridge develops financing plans and strategies to maintain strong credit ratings, diversify its funding sources and maintain substantial standby bank credit capacity and access to capital markets in both Canada and the United States. As part of Enbridge’s enterprise-wide risk management policy, EIPLP engages in a comprehensive long-term economic hedging program to mitigate the impact of fluctuations in interest rates, foreign exchange and commodity price on EIPLP’s earnings.
INDUSTRY FUNDAMENTALS SUPPLY AND DEMAND FOR LIQUIDS Beginning in the third quarter of 2014, the price of crude oil has been experiencing a dramatic decline. A similar price trend has also been seen for natural gas and NGL and other commodities whose prices are highly correlated to crude oil. Benchmark prices for crude, which had been trading over US$105 per barrel in June 2014, fell to as low as US$45 per barrel by end of the third quarter in 2015 as a result of significant increases in production both inside and outside of North America in the face of relatively tepid growth in world-wide demand. Entering the fourth quarter of 2015, prices continue to be weak and are expected to remain volatile in the near-term as the market seeks to re-balance supply and demand. Over the long term, global energy consumption is expected to continue to grow, with the growth in crude oil demand primarily driven by emerging economies in regions outside the Organization for Economic Cooperation and Development (OECD), such as China, India and the Middle East. In OECD countries, including Canada, the United States and western European nations, efficiency gains, conservation, limited population growth and a shift to alternative energy will reduce crude oil demand over the long term. Accordingly, there is a strategic opportunity for North American producers to grow production to displace foreign imports and participate in the growing global demand outside North America. In terms of supply, long-term global crude oil production is expected to continue to grow through 2040, with North America being a significant contributor to overall global supply. Growth in North America is largely driven by production from the oil sands, the Gulf of Mexico and the emergence and continued development of tight oil plays including the Bakken, Eagle Ford and Permian formations. Political uncertainty in certain oil producing countries, including Libya, Iran, Syria and Iraq, increases risk in those regions’ supply growth forecasts and makes North America one of the more secure supply sources of crude oil. As witnessed in the latter half of 2014, North American supply growth can be influenced by macro-economic factors that drive down the global crude prices. Over the longer term, North American production from tight oil plays, including the Bakken, is expected to grow as technology continues to improve well productivity and reduces costs. In Canada, the Western Canadian Sedimentary Basin (WCSB) is viewed as one of the world’s largest and most secure supply sources of crude oil. Investment in the WCSB is expected to remain strong over the longer term due to technological advances and continued foreign investment. However, the pace of growth in North America could be tempered by a sustained period of low crude oil prices and corresponding production decisions by The Organization of the Petroleum Exporting Countries, as well as increasing environmental regulation, a prolonged approval process for new pipelines and the continuation of export restrictions in future years. The combination of relatively flat domestic demand, growing supply, limited exports and long-lead time to build pipeline infrastructure has led to a fundamental change in the North American crude oil landscape. In recent years, an inability to move increasing inland supply to tide-water refining markets has resulted in a divergence between West Texas Intermediate (WTI) and world pricing, resulting in lower netbacks for North American producers than could otherwise be achieved if selling into global markets. The impact of price differentials has been even more pronounced for western Canadian producers as insufficient pipeline infrastructure has resulted in a further discounting of Alberta crude against WTI. With a number of market access initiatives recently completed by the industry, the crude oil price differentials continue to narrow, resulting in higher netbacks for producers. However, as the supply in North America continues to grow, the growth and flexibility of pipeline infrastructure will need to keep pace with the sensitive demand and supply balance. Shippers also continue to seek alternative means of transportation, such as rail, to access higher netback markets as a result of a shortage of pipeline capacity; however, over the longer-
11
term, EIPLP believes pipelines will continue to be the most cost-effective means of transportation in markets where the differential between North American and global oil prices remain narrow. Utilization of rail to transport crude is expected to be substantially limited to those markets not readily accessible by pipelines. As oil sands production in western Canada continues to grow, prices continue to be sensitive to capacity limitations to markets, heightening the need to expand access to growing Asian markets. SUPPLY AND DEMAND FOR NATURAL GAS AND NGL Global energy demand is expected to increase as the global economy grows with most of this growth expected from non-OECD countries. Natural gas will play an important role to meet this energy demand and is anticipated to be one of the world’s fastest growing energy sources. Most natural gas demand will stem from the need for greater power generation capacity; natural gas is a cleaner alternative to coal which has the largest market share for power generation. Within North America, United States natural gas demand is projected to be modest until the next wave of gas-intensive petrochemical facilities, liquefied natural gas export facilities and gas-fired generation enters service, which is expected later this decade. Over the longer-term, higher United States natural gas demand is expected to be driven by the industrial sector and from power generation. Within Canada, natural gas demand growth is expected to be largely tied to oil sands development. Similar to crude oil, robust North American supply from tight formations has created a demand and supply imbalance. North American supply continues to be dominated by natural gas development in the northeastern United States, primarily the dominant Marcellus shale, as well as the emerging Utica shale. The abundance of supply from these shale plays has fundamentally altered natural gas flow patterns in North America and largely displaced United States Gulf Coast and WCSB gas production. As a result, regional natural gas production, apart from the abundant production in the northeastern United States, has largely been flat or has declined over the past several years in response to robust growth in the Appalachian region and resulted in prolonged weak North American natural gas prices. While low natural gas prices are expected to be a key driver in future infrastructure growth and natural gas demand, it is also expected that gas supply will remain ample and could respond quickly to rising demand thereby limiting price advances. With the weak natural gas price environment over the last several years, producers have shifted from dry gas drilling to developing rich gas reservoirs to take advantage of the relatively higher value of NGL inherent in the gas stream. NGL that can be extracted from liquids-rich gas streams include ethane, propane, butane and natural gasoline, which are used in a variety of industrial, commercial and other applications. Over the longer-term, the growth in NGL demand will be largely driven by ethane demand as it is the key feedstock to the United States Gulf Coast petrochemical industry which is currently undergoing significant expansion and once completed is expected to be the world’s second lowest-cost ethylene producer. However, until this infrastructure is established, ethane prices and resulting extraction margins are expected to remain low due to the current oversupply and have resulted in ethane being retained in the gas stream rather than processed. Rapidly growing supplies of propane have also been placing downward pressure on prices and have prompted the expansion of export facilities. In Canada, the WCSB basin is well-situated to capitalize on the evolving NGL fundamentals as the Montney formation in northern British Columbia and the Duvernay shale in Alberta have significant liquids-rich resources at competitive costs. While longer-term NGL fundamentals suggest a positive outlook for growth, a sustained period of low crude oil prices and the related negative impact on NGL prices could temper future growth. The recent decline in crude prices has had a direct impact on producers’ oil focused drilling plans in 2015. Lower prices for NGL, which generally trade at a percentage of crude prices, will also cause a reduction in liquids-rich gas drilling and limit production growth. However, robust gas production from highly economic core areas within certain shale plays, particularly the Marcellus, is expected to offset any price related production declines over the next year. To the extent oil prices recover, the crude-to-gas price ratio is expected to rise from current levels. The immense and readily available gas supply within North America will continue to limit price increases. In this scenario, the crude-to-gas price ratio is expected to remain well above energy conversion value levels and continue to be supportive of NGL extraction.
12
SUPPLY AND DEMAND FOR RENEWABLE ENERGY The power generation and distribution network in North America is expected to undergo significant growth over the next 15 years. On the demand side, North American economic growth over the longer-term is expected to drive growing electricity demand, although continued efficiency gains are expected to make the economy less energy-intensive and temper demand growth. On the supply side, impending legislation in both Canada and the United States is expected to accelerate the retirement of aging coal-fired generation plants, resulting in a requirement for significant new generation capacity. While coal and nuclear facilities will continue to be a core component of power generation in North America, gas-fired and renewable energy facilities, including biomass, hydro, solar and wind, are expected to be the preferred sources to replace coal-fired generation due to their lower carbon intensities. North American wind and solar resources fundamentals remain strong; in the United States there is nearly 66 gigawatts (GW) of installed wind power capacity and in Canada over nine GW of capacity. Solar resources in southwestern states such as Arizona, California and Nevada are considered to be some of the best in the world for large-scale solar plants and the United States currently has over 16 GW of installed solar photovoltaic capacity. However, expanding renewable energy infrastructure in North America is not without challenges. Growing renewable generation capacity is expected to necessitate substantial capital investment to upgrade existing transmission systems or, in many cases, build new transmission lines, as these high quality wind and solar resources are often found in regions that are not in close proximity to markets. Furthermore, the profitability of renewable energy projects, to date, has in part been supported by certain tax and government incentives. In the near-term, uncertainty over the continuing availability of tax or other government incentives and the ability to secure long-term power purchase agreements (PPA) through government or investor-owned power authorities may hinder the pace of future new renewable capacity development. However, continued improvement in technology and manufacturing capacity in the past few years has reduced capital costs associated with renewable energy infrastructure and has also improved yield factors of power generation assets. These positive developments are expected to render renewable energy more competitive and support ongoing investment over the long-term.
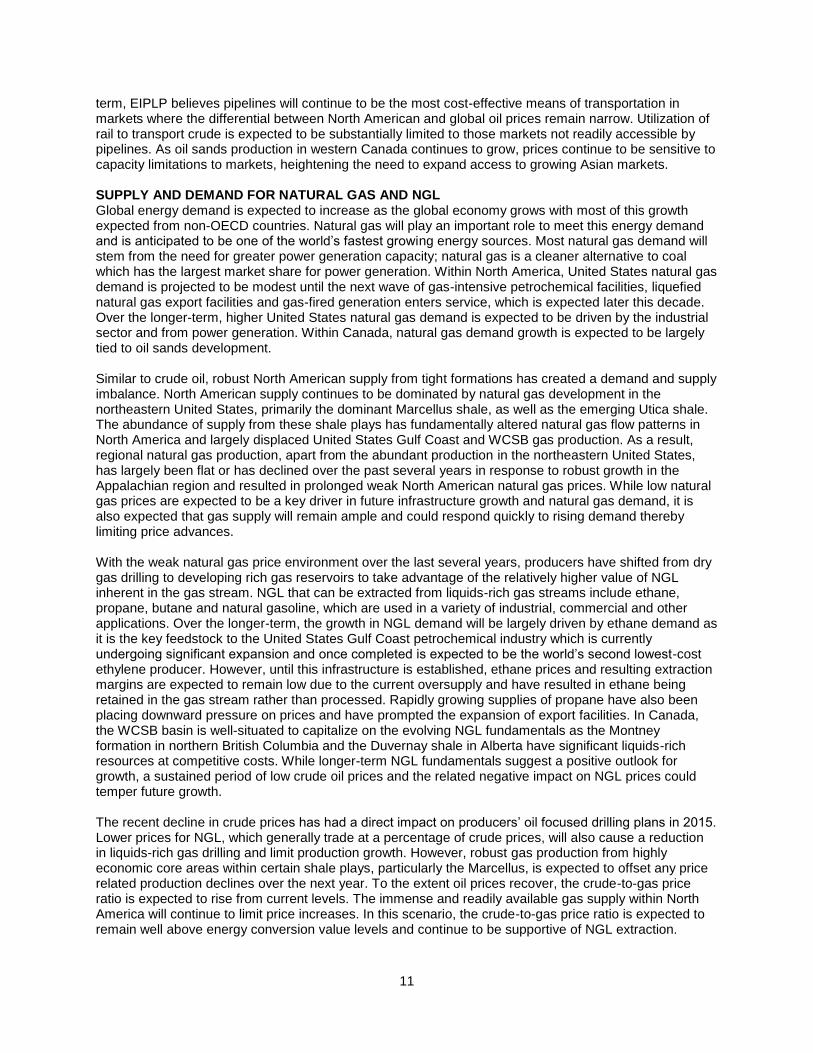
GROWTH PROJECTS As part of the 2015 Transaction, the commercially secured growth programs embedded within EPI and EPAI were transferred to EIPLP. Enbridge and the Manager continue to oversee the execution of these projects, as well as manage the operations and future development opportunities for EPI and EPAI. The following table summarizes the current status of the commercially secured projects. The estimated capital costs and the expenditures to date within the table are inclusive of costs incurred prior to the closing of the 2015 Transaction, with the majority of the expenditures to date incurred prior to the close of the 2015 Transaction.
Estimated
Capital Cost1 Expenditures
to Date2
Expected In-Service
Date Status
(Canadian dollars, unless stated otherwise)
LIQUIDS PIPELINES 1. Eastern Access Line 9 Reversal and
Expansion $0.8 billion $0.7 billion 2013-2015
(in phases) Substantially
complete
2. Canadian Mainline Expansion $0.7 billion $0.7 billion 2015 Complete
3. Surmont Phase 2 Expansion $0.3 billion $0.3 billion 2014-2015 (in phases)
Complete
4. Canadian Mainline System Terminal Flexibility and Connectivity
$0.7 billion $0.7 billion 2013-2015 (in phases)
Complete
5. Woodland Pipeline Extension $0.7 billion $0.7 billion 2015 Complete
6. Sunday Creek Terminal Expansion $0.2 billion $0.2 billion 2015 Complete

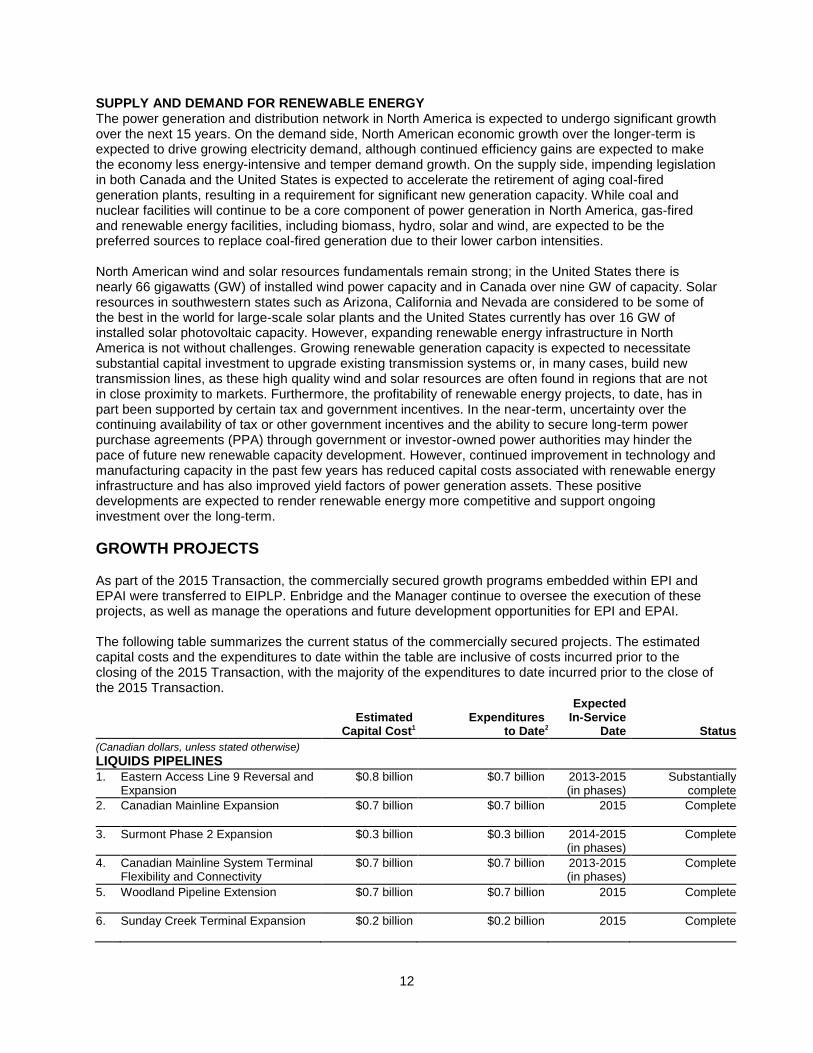
13
Estimated
Capital Cost1 Expenditures
to Date2
Expected In-Service
Date Status
7. Edmonton to Hardisty Expansion $1.8 billion $1.4 billion 2015 (in phases)
Under construction
8. AOC Hangingstone Lateral $0.2 billion $0.1 billion 2015 Under construction
9. JACOS Hangingstone Project $0.2 billion $0.1 billion 2016 Under- construction
10. Regional Oil Sands Optimization Project
$2.6 billion $1.5 billion 2017 Under construction
11. Norlite Pipeline System3 $1.3 billion $0.1 billion 2017 Under-
construction 12. Canadian Line 3 Replacement
Program $4.9 billion $0.7 billion 2017 Pre-
construction
1 These amounts are estimates and are subject to upward or downward adjustment based on various factors. Where appropriate, the amounts reflect EIPLP’s share of joint venture projects.
2 Expenditures to date reflect total cumulative expenditures incurred from inception of the project up to September 30, 2015. 3 EIPLP will construct and operate the Norlite Pipeline System. Keyera Corp. will fund 30% of the project.
LIQUIDS PIPELINES Eastern Access The Eastern Access initiative includes a series of crude oil pipeline projects being undertaken by Enbridge and EEP to provide increased access to refineries in the upper midwest United States and eastern Canada. Projects being undertaken by Enbridge include a reversal of Line 9A and expansion of the Toledo Pipeline, both completed in 2013, as well as the reversal of Line 9B and expansion of Line 9 (together, Line 9). Enbridge is undertaking a reversal of its 240,000 barrels per day (bpd) Line 9B from Westover, Ontario to Montreal, Quebec to serve refineries in that province. The Line 9B reversal was initially expected to be completed at an estimated cost of approximately $0.3 billion. Following an open season held on the Line 9B reversal project, further commitments were received that required additional delivery capacity into Ontario and Quebec, resulting in the Line 9 capacity expansion project. The Line 9 capacity expansion will increase the annual capacity of Line 9 from 240,000 bpd to 300,000 bpd at an estimated cost of approximately $0.1 billion. The Line 9B Reversal and Line 9 Capacity Expansion projects were approved by the National Energy Board (NEB) in March 2014 subject to 30 conditions. In October 2014, the NEB requested additional information regarding one of the conditions imposed on the Line 9B Reversal and Line 9 Capacity Expansion Project. On October 23, 2014, Enbridge responded to the NEB describing its rigorous approach to risk management and isolation valve placement. On February 6, 2015, the NEB approved Conditions 16 and 18, the two conditions in the NEB’s order requiring approval, and Enbridge filed for a Leave to Open (LTO), which is a prerequisite to allowing the operation of the project. In its February approval, the NEB also imposed additional obligations on Enbridge that directed it to take a “life-cycle” approach to water crossings and valves, requiring it to perform ongoing analysis to ensure optimal protection of the area’s water resources. On June 18, 2015, the NEB approved the LTO application and issued a separate order imposing further conditions requiring Enbridge to perform hydrostatic tests of selected segments of the pipeline. Enbridge filed its hydrostatic test plan with the NEB on July 23, 2015, which was approved on July 27, 2015. Hydrostatic testing was completed and Enbridge submitted the test results to the NEB in September, 2015. On September 30, 2015 the NEB confirmed that the hydrostatic tests successfully met their criteria. Line-fill commenced in late October 2015 and the pipeline is expected to be placed into service in December 2015. Cost estimates related to conditions imposed by the NEB, including valve placement and hydrostatic testing, are expected to increase the total project cost to $0.8 billion, inclusive of costs related to the previously mentioned Line 9A reversal. Pursuant to various agreements with shippers, EIPLP expects to
14
recover from shippers the full costs of compliance with NEB imposed hydrostatic testing. Total expenditures to date on the Line 9A and Line 9B projects are approximately $0.7 billion. On July 31, 2014, Enbridge filed an application for tolls on Line 9. After complaints from shippers on Line 9 were filed with the NEB with respect to the inclusion of mainline surcharges in the Line 9 toll, the NEB approved the tolls on an interim basis to allow for time to engage shippers in further discussions to attempt to resolve the outstanding issues. On January 30, 2015, the NEB convened a hearing to consider the matter. In response to a request from Enbridge that was supported by the shippers, the hearing was suspended to allow Enbridge and shippers to engage in further discussions to resolve the outstanding issues. In the third quarter of 2015, Enbridge and the shippers came to an agreement to recover mainline surcharges in the Line 9 toll. Canadian Mainline Expansion Enbridge undertook an expansion of the Alberta Clipper line between Hardisty, Alberta and the Canada/United States border near Gretna, Manitoba. The scope of the project consisted of two phases that involved the addition of pumping horsepower to raise the capacity of the Alberta Clipper line from 450,000 bpd to 800,000 bpd. The initial phase to increase capacity from 450,000 bpd to 570,000 bpd was completed in the third quarter of 2014 at an estimated capital cost of approximately $0.2 billion. The second phase to increase capacity from 570,000 bpd to 800,000 bpd was completed in July 2015 at an expected cost of approximately $0.5 billion. The total cost of the entire expansion was approximately $0.7 billion. Receipt of the final regulatory approval on EEP’s portion of the mainline system expansion has been delayed. EEP continues to work with regulatory authorities; however, the timing of the federal regulatory approval cannot be determined at this time. A number of temporary system optimization actions have been undertaken to substantially mitigate any impact on throughput associated with this delay. Surmont Phase 2 Expansion In 2013, Enbridge entered into a terminal services agreement with ConocoPhillips Canada Resources Corp. (ConocoPhillips) and Total E&P Canada Ltd. (together, the ConocoPhillips Partnership) to expand the Cheecham Terminal to accommodate incremental bitumen production from Surmont’s Phase 2 expansion. Enbridge constructed two new 450,000 barrel blend tanks and converted an existing tank from blend to diluent service. The expansion occurred in two phases with the blended product system placed into service in November 2014 and the diluent system placed into service in March 2015 at a total cost of approximately $0.3 billion. Canadian Mainline System Terminal Flexibility and Connectivity As part of the Light Oil Market Access Program initiative, Enbridge undertook the Canadian Mainline System Terminal Flexibility and Connectivity project in order to accommodate additional light oil volumes and enhance the operational flexibility of the Canadian mainline terminals. The modifications comprised of upgrading existing booster pumps, installing additional booster pumps and adding new tank line connections. These projects had varying completion dates from 2013 through the second quarter of 2015. The total cost of the project was approximately $0.7 billion. Woodland Pipeline Extension The joint venture Woodland Pipeline Extension Project extends the Woodland Pipeline south from EIPLP’s Cheecham Terminal to its Edmonton Terminal. The extension is a 388-kilometre (241-mile), 36-inch diameter pipeline with an initial capacity of 400,000 bpd, expandable to 800,000 bpd. The project was completed and placed into service in July 2015. EIPLP’s share of the project costs is approximately $0.7 billion. Sunday Creek Terminal Expansion In 2014, Enbridge announced the construction of additional facilities at its existing Sunday Creek Terminal, located in the Christina Lake area of northern Alberta, to support production growth from the Christina Lake oil sands project operated by Cenovus Energy Inc. and jointly owned with ConocoPhillips. The expansion included development of a new site adjacent to the existing terminal, construction of a new 350,000 barrel tank with associated piping, pumps and measurement equipment, as well as civil

15
construction work for a future tank. The project was placed into service in August 2015 at an approximate cost of $0.2 billion. Edmonton to Hardisty Expansion Enbridge is undertaking an expansion of the Canadian Mainline system between Edmonton, Alberta and Hardisty, Alberta. The expansion project includes 181 kilometres (112 miles) of new 36-inch diameter pipeline and will provide an initial capacity of approximately 570,000 bpd, expandable to 800,000 bpd. The new line generally follows the same route as EIPLP’s existing Line 4 pipeline. Also included in the project scope are connections into existing infrastructure at the Hardisty Terminal and new terminal facilities in Edmonton, Alberta which include five new 500,000 barrel tanks. The new pipeline was placed into service in April 2015, with additional tankage requirements expected to be completed by the fourth quarter of 2015. The total cost of the project is expected to be approximately $1.8 billion, with expenditures to date of approximately $1.4 billion. AOC Hangingstone Lateral In 2013, Enbridge entered into an agreement with Athabasca Oil Corporation (AOC) to provide pipeline and terminalling services to the proposed AOC Hangingstone Oil Sands Project (AOC Hangingstone) in Alberta. Phase I of the project will involve the construction of a new 49-kilometre (31-mile), 16-inch diameter pipeline from the AOC Hangingstone project site to EIPLP’s existing Cheecham Terminal and related facility modifications at Cheecham, Alberta. This phase of the project will provide an initial capacity of 16,000 bpd and is expected to be placed into service in the fourth quarter of 2015 at an estimated cost of approximately $0.2 billion. Expenditures to date on the project are approximately $0.1 billion. Phase 2 of the project, which is subject to commercial approval, would provide up to an additional 60,000 bpd for a total capacity of 76,000 bpd. JACOS Hangingstone Project EIPLP will undertake the construction of facilities and provide transportation services to the Japan Canada Oil Sands Limited (JACOS) Hangingstone Oil Sands Project (JACOS Hangingstone). JACOS and Nexen Energy ULC, a wholly-owned subsidiary of China National Offshore Oil Corporation Limited, are partners in the project which is operated by JACOS. EIPLP plans to construct a new 53-kilometre (33-mile), 12-inch lateral pipeline to connect the JACOS Hangingstone project site to EIPLP’s existing Cheecham Terminal. The project, which will provide capacity of 40,000 bpd, is expected to enter service in 2016. The estimated cost is approximately $0.2 billion, with expenditures to date of approximately $0.1 billion. Regional Oil Sands Optimization Project In March 2015, Enbridge announced a plan to optimize previously announced expansions of its Regional Oil Sands System currently in execution. Enbridge previously announced the Wood Buffalo Extension, which includes the construction of a 30-inch pipeline, from EIPLP’s Cheecham Terminal to its Battle River Terminal at Hardisty, Alberta and associated terminal upgrades, and the Athabasca Pipeline Twin, which consists of the twinning of the southern section of the Athabasca Pipeline with a 36-inch diameter pipeline from Kirby Lake, Alberta to its Hardisty crude oil hub. The optimization plan, which has been agreed to with the affected shippers, including Suncor Energy Inc., Total E&P Canada Ltd. and Teck Resources Limited (the Fort Hills Partners), will enable deferral of the southern segment of the Wood Buffalo Extension by connecting it to the Athabasca Pipeline Twin. The optimization involves the upsize of a 100-kilometre (60-mile) segment of the Wood Buffalo Extension between Cheecham, Alberta and Kirby Lake, Alberta from a 30-inch diameter pipeline to a 36-inch diameter pipeline, which will now connect to the origin of the Athabasca Pipeline Twin at Kirby Lake, Alberta. The capacity of the Athabasca Pipeline Twin will be expanded from 450,000 bpd to 800,000 bpd through additional horsepower. The definitive cost estimate of the Wood Buffalo Extension was finalized at approximately $1.8 billion before optimization. As a result of the optimization, the cost estimate to complete the integrated Wood Buffalo Extension and Athabasca Pipeline Twin projects is expected to decrease from approximately $3.0

16
billion to approximately $2.6 billion. Expenditures on the joint projects to date are approximately $1.5 billion. The integrated Wood Buffalo Extension and Athabasca Pipeline Twin will transport diluted bitumen from the proposed Fort Hills Partners’ oil sands project (Fort Hills Project) in northeastern Alberta, as well as from oil sands production from Suncor Energy Oil Sands Limited Partnership (Suncor Partnership) in the Athabasca region. The Wood Buffalo Extension and the Athabasca Pipeline Twin will ship blended bitumen from the Fort Hills Project and have an expected 2017 in-service date. The Athabasca Pipeline Twin will also ship blended bitumen from the Cenovus Christina Lake Steam Assisted Gravity Drainage project near the origin of the Athabasca Pipeline Twin. Norlite Pipeline System Enbridge is undertaking the development of Norlite, a new industry diluent pipeline originating from Edmonton, Alberta to meet the needs of multiple producers in the Athabasca oil sands region. The scope of the project was increased to a 24-inch diameter pipeline, which will provide an initial capacity of approximately 224,000 bpd of diluent, with the potential to be further expanded to approximately 400,000 bpd of capacity with the addition of pump stations. Norlite will be anchored by throughput commitments from the Fort Hills Partners for production from the proposed Fort Hills Project and from Suncor Partnership’s proprietary oil sands production. Norlite will involve the construction of a new 449-kilometre (278-mile) pipeline from EIPLP’s Stonefell Terminal to its Cheecham Terminal with an extension to Suncor Partnership’s East Tank Farm, which is adjacent to EIPLP’s existing Athabasca Terminal. Under an agreement with Keyera Corp. (Keyera), Norlite has the right to access certain existing capacity on Keyera’s pipelines between Edmonton, Alberta and Stonefell, Alberta and, in exchange, Keyera has elected to participate in the new pipeline infrastructure project as a 30% non-operating owner. Subject to regulatory and other approvals, Norlite is expected to be completed in 2017 at an estimated cost of approximately $1.3 billion, with expenditures to date of approximately $0.1 billion. Canadian Line 3 Replacement Program In 2014, Enbridge and EEP jointly announced that shipper support was received for investment in the Line 3 Replacement Program (L3R Program). The Canadian L3R Program will complement existing integrity programs by replacing approximately 1,084 kilometres (673 miles) of the remaining line segments of the existing Line 3 pipeline between Hardisty, Alberta and Gretna, Manitoba. While the L3R Program will not provide an increase in the overall capacity of the mainline system, it will support the safety and operational reliability of the overall system, enhance flexibility and allow EIPLP to optimize throughput on the mainline system’s overall western Canada export capacity. The L3R Program is expected to achieve capacity of approximately 760,000 bpd. Subject to regulatory and other approvals, the Canadian L3R Program is targeted to be completed in late 2017. The NEB deemed the Canadian Line 3R Program application complete and issued a hearing order in which it confirmed that it had until May 2016 to issue a decision. Enbridge has reached a settlement agreement with landowner associations representing Line 3 landowners in Canada and as a result these parties have withdrawn from the hearing process. The estimated capital cost of the Canadian L3R Program is approximately $4.9 billion, with expenditures to date of approximately $0.7 billion. Costs of the Canadian L3R Program will be recovered through a 15-year toll surcharge mechanism under the CTS.

17
LIQUIDS PIPELINES Three months ended Nine months ended September 30, September 30,
2015 2014 2015 2014
(millions of Canadian dollars) Canadian Mainline 85 - 85 - Regional Oil Sands System 48 - 48 - Southern Lights Pipeline 19 - 55 - Feeder Pipelines and Other 26 20 68 65
Adjusted earnings before interest and income taxes 178 20 256 65
Retrospective adjustment - 2015 Transaction1 (325) (76) (324) 502 Canadian Mainline - changes in unrealized derivative fair value gains/(loss) (162) - (162) - Southern Lights Pipeline - changes in unrealized derivative fair value gains/(loss) (46) 14 - (79) 14 Feeder Pipelines and Other - gain on sale - - 22 - Feeder Pipelines and Other - make-up rights adjustment (2) (1) - (2)
Earnings/(loss) before interest and income taxes (357) (43) (287) 579 1 In accordance with U.S. GAAP, EBIT for the three and nine months ended September 30, 2015 and 2014, respectively, have
been retrospectively adjusted to furnish comparative information related to the 2015 Transaction. The impact of the retrospective adjustments has been removed from adjusted EBIT to reflect earnings generated under EIPLP’s ownership effective September 1, 2015.
Additional details on items impacting Liquids Pipelines EBIT include:
Canadian Mainline EBIT for 2015 reflected changes in unrealized fair value losses on derivative financial instruments used to risk manage exposures inherent within the CTS, namely foreign exchange, power cost variability and allowance oil commodity prices.
Southern Lights Pipeline EBIT for each period reflected changes in unrealized fair value gains and losses on derivative financial instruments used to risk manage foreign exchange exposures on United States dollar cash flows from the Southern Lights Class A Units.
Feeder Pipelines and Other earnings for the nine months ended September 30, 2015 reflected a gain on the disposition of non-core assets in the second quarter of 2015.
Liquids Pipelines adjusted EBIT for the three and nine months ended September 30, 2015 increased compared with the corresponding 2014 periods, as a result of the incremental earnings from the assets acquired, most notably the Canadian Mainline and Regional Oil Sands System, as part of the 2015 Transaction, refer to Canadian Liquids Pipelines and Renewable Energy Assets Transaction. CANADIAN MAINLINE The Canadian Mainline is a common carrier pipeline system which transports various grades of oil and other liquid hydrocarbons within western Canada and from western Canada to the Canada/United States border near Gretna, Manitoba and Neche, North Dakota and from the United States/Canada border near Port Huron, Michigan and Sarnia, Ontario to eastern Canada and the northeastern United States. The Canadian Mainline includes six adjacent pipelines, with a combined design operating capacity of approximately 2.6 million bpd that connect with the Lakehead System at the Canada/United States border, as well as four crude oil pipelines and one refined products pipeline that deliver into eastern Canada and the northeastern United States. It also includes certain related pipelines and infrastructure, including decommissioned and deactivated pipelines. EPI, now a wholly-owned subsidiary of EIPLP, has operated, and frequently expanded, the Canadian Mainline since 1949. Competitive Toll Settlement The CTS is the current framework governing tolls paid for products shipped on the Canadian Mainline, with the exception of Lines 8 and 9 which are tolled on a separate basis. The 10-year settlement was negotiated by representatives of EPI, the Canadian Association of Petroleum Producers and shippers on the Canadian Mainline. It was approved by the NEB on June 24, 2011 and took effect on July 1, 2011. The CTS provides for a Canadian Local Toll (CLT) for deliveries within western Canada, which is based

18
on the 2011 Incentive Tolling Settlement toll, as well as an IJT for crude oil shipments originating in western Canada on the Canadian Mainline and delivered into the United States, via the Lakehead System, and into eastern Canada. These tolls are denominated in United States dollars. The IJT is designed to provide shippers on the Canadian Mainline with a stable and competitive long-term toll, thereby preserving and enhancing throughput on both the Canadian Mainline and the Lakehead System. The IJT and the CLT were both established at the time of implementation of the CTS and are adjusted annually, on July 1 of each year, at a rate equal to 75% of the Canada Gross Domestic Product at Market Price Index published by Statistics Canada. Certain events may trigger a renegotiation of the CTS by EPI or the shippers. These include (i) a regulatory change that results in cumulative capital expenditures for integrity work on the Canadian Mainline increasing by more than $100 million, or (ii) if the nine month average volume on the Canadian Mainline, ex-Gretna, Manitoba, falls below the minimum threshold volume (currently 1.35 million bpd). If a renegotiation of the CTS is triggered, EPI and the shippers will meet and use reasonable efforts to agree on how the CTS can be amended to accommodate the event. If EPI and the shippers are unable to agree on the manner in which the CTS is to be amended, then, absent an extension to the renegotiation period, the CTS will terminate and EPI will need to file a new toll application for the Canadian Mainline. Two years prior to the end of the term of the CTS, EPI and the shippers will establish a group for the purposes of negotiating a new settlement to replace the CTS once it expires. Although the CTS has a 10 year term, it does not require shippers to commit to certain volumes. Shippers nominate volumes on a monthly basis and EPI allocates capacity to maximize the efficiency of the Canadian Mainline. Local tolls for service on the Lakehead System are not affected by the CTS and continue to be established pursuant to the Lakehead System’s existing toll agreements. Under the terms of the IJT agreement between Enbridge and EEP, the Canadian Mainline’s share of the IJT toll relating to pipeline transportation of a batch from any western Canada receipt point to the United States border is equal to the IJT toll applicable to that batch’s United States delivery point less the Lakehead System’s local toll to that delivery point. This amount is referred to as the Canadian Mainline IJT Residual Benchmark Toll and is denominated in United States dollars. Results of Operations Canadian Mainline adjusted EBIT for the three and nine months ended September 30, 2015 reflected earnings from the acquisition of the Canadian Mainline on September 1, 2015 as part of the 2015 Transaction. Canadian Mainline EBIT is largely driven by throughput achieved on the mainline system. During 2015, throughput on the Canadian Mainline was strong largely due to strong oil sands production combined with the expansion of the mainline system, which was completed in July 2015. Efforts to optimize capacity utilization and to enhance scheduling efficiency with shippers has also driven high throughput in 2015. However, further throughput growth in 2015 was hindered by upstream plant maintenance in Alberta during the second and third quarters which impacted light volumes and an unplanned shutdown of a midwest refinery that impacted the takeaway of heavy volumes in the third quarter. Canadian Mainline earnings can also be impacted by the effect of the United States/Canada foreign exchange rate, as the Canadian Mainline IJT Residual Benchmark Toll is set in United States dollars. EIPLP actively manages foreign exchange risk on Canadian Mainline through its hedging program. REGIONAL OIL SANDS SYSTEM Regional Oil Sands System includes two long haul pipelines, the Athabasca Pipeline and the Waupisoo Pipeline, and two large terminals: the Athabasca Terminal located north of Fort McMurray, Alberta and the Cheecham Terminal, located 70 km (45 miles) south of Fort McMurray where the Waupisoo Pipeline initiates. Regional Oil Sands System also includes the Wood Buffalo Pipeline, Woodland Pipeline and Norealis Pipeline, all of which provide access for oil sands production from near Fort McMurray to the Cheecham Terminal, as well as a variety of other facilities such as the MacKay River, Christina Lake, Surmont and Long Lake laterals and related facilities. Regional Oil Sands System currently serves eight producing oil sands projects.
19
The Athabasca Pipeline is a 540-kilometre synthetic and heavy oil pipeline. Built in 1999, it links the Athabasca oil sands in the Fort McMurray region to the major Alberta pipeline hub at Hardisty, Alberta. The Athabasca Pipeline’s capacity is 570,000 bpd, depending on the viscosity of crude being shipped, after completion of a pipeline expansion in 2013. EIPLP has entered into long-term take-or pay and non take-or-pay agreements with multiple shippers on the Athabasca Pipeline. Revenues are recorded based on the contract terms negotiated with the major shippers, rather than the cash tolls collected. The Waupisoo Pipeline is a 380 km synthetic and heavy oil pipeline that entered service in 2008 and provides access to the Edmonton market for oil sands producers. The Waupisoo Pipeline originates at the Cheecham Terminal and terminates at the major Alberta pipeline hub at Edmonton. The pipeline has recently been expanded to an annual capacity of 550,000 bpd, depending on crude slate. EIPLP has entered into long-term take-or-pay commitment with multiple shippers on the Waupisoo Pipeline who have collectively contracted for approximately 80% to 90% of the capacity, subject to some short-term variability dependent on the timing of when certain shippers’ commitments expire and commence. Results of Operations Regional Oil Sands System adjusted EBIT for the three and nine months ended September 30, 2015 reflected earnings from the acquisition of Regional Oil Sands System on September 1, 2015 as part of the 2015 Transaction. SOUTHERN LIGHTS PIPELINE The Southern Lights Pipeline is a fully-contracted single stream pipeline that ships diluent from the Manhattan Terminal near Chicago, Illinois to three western Canadian delivery facilities, located at the Edmonton and Hardisty terminals in Alberta and the Kerrobert terminal in Saskatchewan. This 180,000 bpd 16/18/20-inch diameter pipeline was placed into service on July 1, 2010. Prior to the close of the 2015 Transaction, Southern Lights Canada was owned by SL Canada, an Alberta limited partnership. Southern Lights US is owned by Enbridge Pipelines (Southern Lights) L.L.C., a Delaware limited liability company. Both Southern Lights Canada and Southern Lights US receive tariff revenues under long-term contracts with committed shippers. Tariffs provide for recovery of all operating and debt financing costs plus a return on equity of 10%. The Southern Lights Pipeline has assigned 10% of the capacity (18,000 bpd) for shippers to ship uncommitted volumes. Enbridge retains 25% of the uncommitted tariff revenues and the remainder is credited to the committed shippers. On November 7, 2014, indirect wholly-owned subsidiaries of EIPLP subscribed for and purchased the Southern Lights Class A Units which provide a defined cash flow stream, that represents the equity cash flows derived from the core rate base of the Southern Lights Pipeline until June 30, 2040. Payments are received quarterly, each of which is comprised of return on and return of capital components. The return on capital is included in income for the period and the return of capital reduces the balance of the investment on the Consolidated Statements of Financial Position. Enbridge guaranteed payment of the distributions except in circumstances of force majeure, certain regulatory actions and shipper defaults that remain unrecovered under the shipper contracts. EIPLP has options to negotiate extensions for two additional 10-year terms beyond 2040 and to participate in equity returns from future expansions of the Southern Lights Pipeline. Following the completion of the 2015 Transaction, EIPLP indirectly owns all of the Class B Units of Southern Lights Canada, together with the Class A Units it already owned. As a result EIPLP holds all the ownership, economic interests and voting rights, direct and indirect, in Southern Lights Canada. The Enbridge guarantee provided in respect of distributions on the Class A Units of Southern Lights Canada was released upon closing of the 2015 Transaction. EIPLP did not acquire any additional direct or indirect interests in Southern Lights US pursuant to the 2015 Transaction. Following Closing, EIPLP continues to indirectly own all of the Class A Units of Southern Lights US and Enbridge continues to indirectly own all of the Class B Units of Southern Lights US.

20
Results of Operations Southern Lights adjusted EBIT for the three and nine months ended September 30, 2015 primarily reflected earnings in respect of the Southern Lights Class A Units following the close of the 2014 Transaction in November 2014. The majority of the economic benefit derived from the Southern Lights Pipeline resulted from the 2014 Transaction as the Class A units provide a defined cash flow stream to EIPLP. FEEDER PIPELINES AND OTHER Feeder Pipelines and Other includes the South Prairie Region which transports crude oil and NGL from producing fields and facilities in southeastern Saskatchewan, southwestern Manitoba and North Dakota to Cromer, Manitoba where products enter the mainline system to be transported to the United States or eastern Canada. Also included in Feeder Pipelines and Other are related terminals and tankage facilities in Saskatchewan and the Hardisty Contract Terminal and Hardisty Storage Caverns located near Hardisty, Alberta, a key crude pipeline hub in Western Canada. Results of Operations Feeder Pipelines and Other adjusted EBIT increased slightly for the three and nine months ended September 30, 2015 compared with the corresponding 2014 periods, reflecting higher throughput in 2015 from the South Prairie Region. This was driven by volumes returning to the system from alternative transportation sources, such as rail, as alternative sources were not as competitive as they were in the corresponding 2014 periods. In addition, adjusted EBIT for the three and nine months ended September 30, 2015 reflected incremental earnings from the Cromer Rail Interconnection project within the South Prairie Region, which was completed and placed into service in 2015. BUSINESS RISKS The risks identified below are specific to the Liquids Pipelines business. General risks that affect EIPLP as a whole are described under Risk Management and Financial Instruments – General Business Risks. Asset Utilization EIPLP is exposed to throughput risk under the CTS on the Canadian Mainline and under certain tolling agreements applicable to other Liquids Pipelines assets and the affiliated Lakehead Mainline System. A decrease in volumes transported can directly and adversely affect revenues and earnings. Factors such as changing market fundamentals, capacity bottlenecks, operational incidents, regulatory restrictions, system maintenance and increased competition can all impact the utilization of the Liquids Pipelines assets. Market fundamentals, such as commodity prices and price differentials, weather, gasoline price and consumption, alternative energy sources and global supply disruptions outside of EIPLP’s control can impact both the supply of and demand for crude oil and other liquid hydrocarbons transported on EIPLP’s pipelines. However, the long-term outlook for Canadian crude oil production indicates a growing source of potential supply of crude oil. Interdependence with the Lakehead System The Enbridge Mainline is an integrated system which transports liquids hydrocarbons between receipt and delivery points across Canada and the United States. The integration of the Canadian Mainline and the Lakehead System results in an interdependence of the two systems, such that operational factors on one system may impact the other system. Such factors may include, but are not limited to, volume throughput increases/decreases, capacity bottlenecks, operational incidents, regulatory restrictions or system maintenance. Any such factor, individually, in combination or over a prolonged period of time, could have a material adverse effect on cash flows or the financial condition of EIPLP and therefore could impact distributions. The CTS framework also results in the Lakehead System having an impact on revenues generated by the Canadian Mainline. Since the Lakehead System local tolls are determined under a tolling agreement which is separate from CTS, changes in the Canadian Mainline IJT Residual Benchmark Toll are inversely related to Lakehead System local tolls.

21
Operational and Economic Regulation Operational regulation risks relate to failing to comply with applicable operational rules and regulations from government organizations. Non-compliance may results in fines or operating restrictions or an overall increase in operating and compliance costs. Regulatory scrutiny over the integrity of Liquids Pipelines assets has the potential to increase operating costs or limit future projects. Potential regulatory changes could have an impact on EIPLP’s future earnings and the cost related to the construction of new projects. EIPLP and its Manager believe operational regulation risk is mitigated by active monitoring and consulting on potential regulatory requirement changes with the respective regulators or through industry associations. EIPLP also develops robust response plans to regulatory changes or enforcement actions. While the Manager believes the safe and reliable operation of its assets and adherence to existing regulations is the best approach to managing operational regulatory risk, the potential remains for regulators to make unilateral decisions that could have a financial impact on EIPLP. Liquids Pipelines also faces economic regulatory risk. Broadly defined, economic regulation risk is the risk regulators or other government entities change or reject proposed or existing commercial arrangements including permits and regulatory approvals for new projects. The Canadian Mainline and other liquids pipelines are subject to the actions of various regulators, including the NEB, with respect to the tariffs and tolls of those operations. The changing or rejecting of commercial arrangements, including decisions by regulators on the applicable tariff structure or changes in interpretations of existing regulations by courts or regulators, could have an adverse effect on EIPLP’s revenues and earnings. Delays in regulatory approvals could result in cost escalations and constructions delays, which also negatively impact the EIPLP’s operations. The Manager believes that economic regulatory risk is reduced through the negotiation of long-term agreements with shippers that govern the majority of the segment’s assets. The Manager also involves its legal and regulatory teams in the review of new projects to ensure compliance with applicable regulations as well as in the establishment of tariffs and tolls on new and existing pipelines. However, despite the best efforts to mitigate economic regulation risk, there remains a risk that a regulator could overturn long-term agreements between EIPLP and shippers or deny the approval and permits for new projects. Competition Competition may result in a reduction in demand for EIPLP’s services, fewer project opportunities or assumption of risk that results in weaker or more volatile financial performance than expected. Competition among existing pipelines is based primarily on the cost of transportation, access to supply, the quality and reliability of service, contract carrier alternatives and proximity to markets. Other competing carriers available to ship western Canadian liquid hydrocarbons to markets in Canada and the United States represent competition to Enbridge liquids pipelines network, including those held by EIPLP. Competition also arises from proposed pipelines that seek to access markets currently served by Enbridge’s liquids pipelines, such as proposed projects to eastern markets. Competition also exists from proposed projects enhancing infrastructure in the Alberta regional oil sands market. Additionally, volatile crude price differentials and insufficient pipeline capacity on EIPLP’s or other competitor pipelines can make transportation of crude oil by rail competitive, particularly to markets not currently serviced by pipelines. The Manager believes the liquids pipelines continue to provide attractive options to producers in the WCSB due to its competitive tolls and flexibility through its multiple delivery and storage points. Enbridge’s current complement of growth projects, including those in execution by EIPLP, to expand market access and to enhance capacity on EIPLP’s pipeline system combined with the Manager’s commitment to project execution is expected to further provide shippers reliable and long-term competitive solutions for oil transportation. EIPLP’s existing right-of-way for the Canadian Mainline also provides a competitive advantage as it can be difficult and costly to obtain rights of way for new pipelines traversing new areas. EIPLP also employs long-term agreements with shippers, which also mitigate competition risk by ensuring consistent supply to its liquids pipelines network.

22
Foreign Exchange and Interest Rate Risk The CTS agreement for the Canadian Mainline exposes EIPLP to risks related to movements in foreign exchange rates and interest rates. Foreign exchange risk arises as the IJT under the CTS is charged in United States dollars. These risks have been substantially managed through the Manager’s enterprise-wide hedging program by using financial contracts to fix the prices of United States dollars and interest rates. Certain of these financial contracts do not qualify for cash flow hedge accounting and therefore, EIPLP’s earnings are exposed to associated changes in the mark-to-market value of these contracts.
GAS PIPELINES Three months ended Nine months ended
September 30, September 30,
2015 2014 2015 2014
(millions of Canadian dollars) Gas Pipelines 37 14 114 48
Adjusted earnings before interest and income taxes 37 14 114 48
Retrospective adjustment - 2014 Transaction1
- 17 - 56 Gas Pipelines - changes in unrealized derivative fair
value loss (6) - (14) - Gas Pipelines - derecognition of regulatory balances
- - 8 -
Earnings before interest and income taxes 31 31 108 104 1 In accordance with U.S. GAAP, EBIT for the three and nine months ended September 30, 2014 have been retrospectively
adjusted to furnish comparative information related to the 2014 Transaction. The impact of the retrospective adjustments has been removed from adjusted EBIT to reflect earnings generated under EIPLP’s ownership effective November 7, 2014.
Additional details on items impacting Gas Pipelines EBIT include:
Earnings from Alliance US for the three and nine months ended September 30, 2015 reflected changes in unrealized gains and losses on derivative financial instruments used to manage foreign exchange exposures associated with United States dollar denominated distributions from Alliance US.
EIPLP’s equity pick-up of Alliance Canada and Alliance US was impacted by the derecognition of regulatory liabilities within those entities in the second quarter of 2015.
ALLIANCE PIPELINE SYSTEM Gas Pipelines consists of Alliance Pipeline, a 3,000-kilometre natural gas mainline pipeline, which includes the Canadian and United States segments of the pipeline and approximately 860-kilometre of lateral pipelines and related infrastructure. The Alliance Canada segment begins near Aiken Creek, British Columbia and connects to Alliance US at the Canada/United States border near Elmore, Saskatchewan. The Alliance US segment continues to the Aux Sable gas processing plant near Chicago, Illinois and the Alliance Chicago Exchange hub. Alliance Canada and Alliance US have firm transportation service shipping contract capacity of 1,325 million cubic feet per day and 1,466 million cubic feet per day, respectively. Additional transportation capacity is periodically available to firm transportation shippers through Authorized Overrun Service. In September 2013, Alliance US completed construction of the Tioga Lateral which facilitates delivery of natural gas from the Tioga field processing plant in the Bakken to downstream markets. Indirect wholly-owned subsidiaries of EIPLP acquired a 50% interest in Alliance US from indirect wholly-owned subsidiaries of Enbridge on November 7, 2014. Alliance Canada has transportation service agreements (TSA) with shippers for substantially all of its available firm transportation capacity. The TSA are designed to provide toll revenues sufficient to recover prudently incurred costs of service, including operating and maintenance, depreciation, an allowance for income tax, costs of indebtedness and an allowed return on equity (ROE) of 11.26% after-tax, based on a deemed 70/30 debt/equity ratio. The initial term of the TSA expires in December 2015, with the exception of a small proportion of shippers that have elected to extend their contracts beyond 2015. Alliance US has similar TSA which allow for the recovery of the cost of service, which includes operating and maintenance

23
costs, the cost of financing, an allowance for income tax, an annual allowance for depreciation and an allowed ROE of 10.88%. In addition, Alliance US negotiated non-renewal charges that are an exit fee for shippers that did not elect to extend their transportation contracts. Tolls and tariffs for Alliance Canada are regulated by the NEB. Toll adjustments, based on variances between the cost of service forecast used to calculate the toll and the actual cost of service, are made annually. Following consultation with shippers, amended tolls are filed annually with the NEB. Rates and tariffs for Alliance US are regulated by the Federal Energy Regulatory Commission (FERC). Alliance US charges shippers a monthly amount calculated to recover all costs on an annual basis. Alliance US consults with shippers and files amended rates annually with the FERC. Alliance Pipeline Recontracting During 2013, Alliance Pipeline announced a New Services Framework and the related tolls and tariff provisions required to implement the new services (collectively, New Services Framework) in which customers could express interest through a precedent agreement process. On June 30, 2015 and July 9, 2015, Alliance Pipeline received regulatory approval from the FERC and the NEB, for the United States and Canadian segments of the pipeline, respectively, for this New Services Framework. Shipments under the New Services Framework will begin in December 2015. As part of its acceptance of Alliance Pipeline US’ New Services, the FERC set all issues related to the proposed elimination of Authorized Overrun Service and Interruptible Transportation revenue crediting, and the maintenance of Alliance Pipeline US’ existing recourse rates, for hearing. The negotiated reservation rates contained in the Precedent Agreements will be converted into negotiated rate transportation contracts as part of the New Services Offering and will not be part of this hearing. Alliance Pipeline has successfully re-contracted its firm capacity through 2018, and approximately 90% of receipt capacity in 2019 and 2020, with an average contract length of approximately five years. Pursuant to the New Services Framework, Alliance Pipeline will retain exposure to potential variability in certain future costs and throughput volumes. As such, the majority of Alliance Pipeline’s operations no longer meet all of the criteria required for the continued application of rate-regulated accounting treatment and derecognition of regulatory balances as at June 30, 2015 was required. As a result, EIPLP’s equity pick-up of Alliance Pipeline, recorded in the Gas Pipelines segment, included a one-time, non-cash pre-tax gain of $8 million due to the derecognition of regulatory liabilities within Alliance Pipeline. Further, EIPLP recorded a one-time, non-cash loss of $16 million related to a regulatory asset EIPLP recorded in respect of Alliance Canada deferred tax within Eliminations and Other. Economic Regulation Alliance Pipeline is subject to regulation by the NEB in Canada and the FERC in the United States. If tolls, rates, or tariffs are protested, the timing and amount of recovery or refund of certain amounts recorded on the Consolidated Statements of Financial Position could be different from the amounts that are eventually recovered or refunded. In addition, future profitability of the entities could be negatively impacted. On a yearly basis, following consultation with shippers, Alliance Pipeline files its annual rates, tolls and tariffs with the NEB and FERC for approval. Under the New Services Framework effective December 1, 2015, Alliance has contracted with shippers for tolls related to new services as approved by the NEB in Canada and the FERC in the United States. Firm service tolls are fixed for the duration of the contracts.
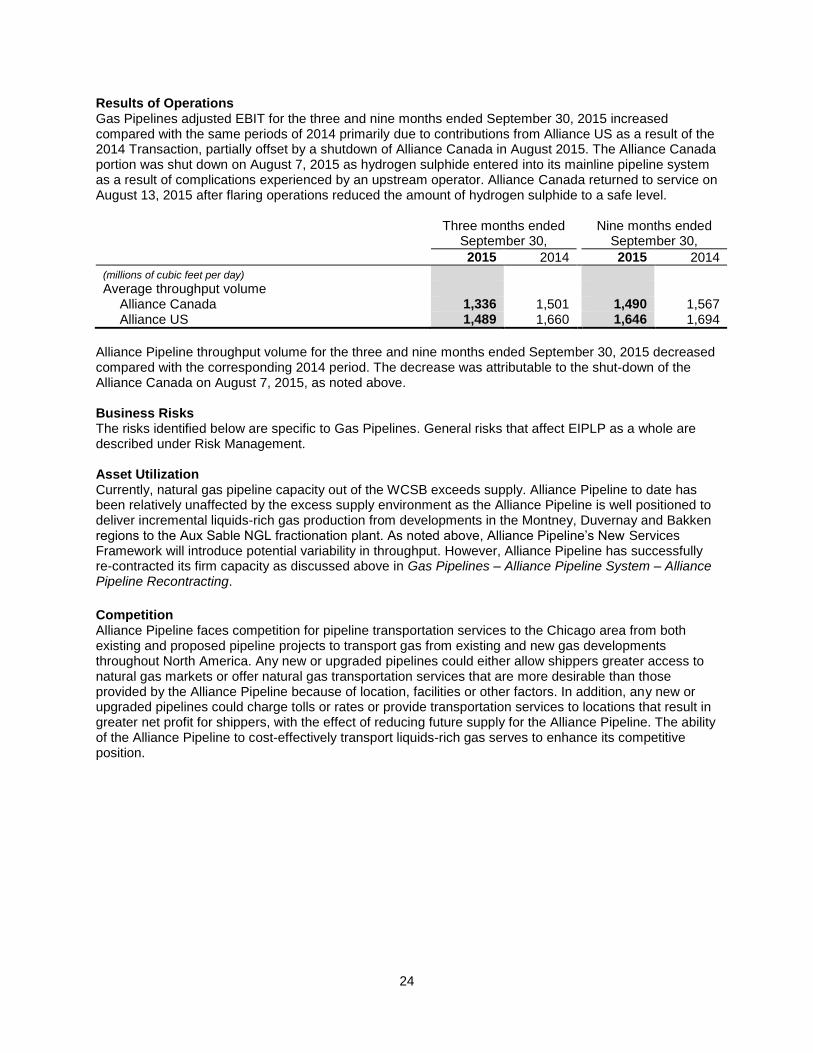
24
Results of Operations Gas Pipelines adjusted EBIT for the three and nine months ended September 30, 2015 increased compared with the same periods of 2014 primarily due to contributions from Alliance US as a result of the 2014 Transaction, partially offset by a shutdown of Alliance Canada in August 2015. The Alliance Canada portion was shut down on August 7, 2015 as hydrogen sulphide entered into its mainline pipeline system as a result of complications experienced by an upstream operator. Alliance Canada returned to service on August 13, 2015 after flaring operations reduced the amount of hydrogen sulphide to a safe level. Three months ended
September 30, Nine months ended
September 30,
2015 2014 2015 2014
(millions of cubic feet per day) Average throughput volume
Alliance Canada 1,336 1,501 1,490 1,567 Alliance US 1,489 1,660 1,646 1,694
Alliance Pipeline throughput volume for the three and nine months ended September 30, 2015 decreased compared with the corresponding 2014 period. The decrease was attributable to the shut-down of the Alliance Canada on August 7, 2015, as noted above. Business Risks The risks identified below are specific to Gas Pipelines. General risks that affect EIPLP as a whole are described under Risk Management. Asset Utilization Currently, natural gas pipeline capacity out of the WCSB exceeds supply. Alliance Pipeline to date has been relatively unaffected by the excess supply environment as the Alliance Pipeline is well positioned to deliver incremental liquids-rich gas production from developments in the Montney, Duvernay and Bakken regions to the Aux Sable NGL fractionation plant. As noted above, Alliance Pipeline’s New Services Framework will introduce potential variability in throughput. However, Alliance Pipeline has successfully re-contracted its firm capacity as discussed above in Gas Pipelines – Alliance Pipeline System – Alliance Pipeline Recontracting.
Competition Alliance Pipeline faces competition for pipeline transportation services to the Chicago area from both existing and proposed pipeline projects to transport gas from existing and new gas developments throughout North America. Any new or upgraded pipelines could either allow shippers greater access to natural gas markets or offer natural gas transportation services that are more desirable than those provided by the Alliance Pipeline because of location, facilities or other factors. In addition, any new or upgraded pipelines could charge tolls or rates or provide transportation services to locations that result in greater net profit for shippers, with the effect of reducing future supply for the Alliance Pipeline. The ability of the Alliance Pipeline to cost-effectively transport liquids-rich gas serves to enhance its competitive position.

25
GREEN POWER Three months ended Nine months ended
September 30, September 30,
2015 2014 2015 2014 (millions of Canadian dollars) Green Power 22 17 73 73
Adjusted earnings before interest and income taxes 22 17 73 73
Retrospective adjustment - 2015 Transaction1 5 8 36 19 Green Power - transformer outage - (1) - (3)
Earnings before interest and income taxes 27 24 109 89 1 In accordance with U.S. GAAP, EBIT for the three and nine months ended September 30, 2015 and 2014, respectively, have
been retrospectively adjusted to furnish comparative information related to the 2015 Transaction. The impact of the retrospective adjustments has been removed from adjusted EBIT to reflect earnings generated under EIPLP’s ownership effective September 1, 2015.
Green Power includes 1,052 MW of net renewable and alternative energy sources. Of this amount, approximately 930 MW of net power generating capacity comes from three wind farms located in each of Alberta, Ontario and Quebec. Most of the power produced from these wind farms are sold under long-term power purchase agreements. Also included in Green Power are three solar facilities located in Ontario with 100 MW of net power generating capacity. EIPLP also has a 50% interest in NRGreen. NRGreen operates five waste heat recovery facilities with an aggregate capacity of 34 MW (17 MW net), which are located at compressor stations along the Alliance Pipeline in Alberta and Saskatchewan. Power is generated by harnessing the waste heat produced by gas turbines at Alliance Canada’s compressor stations and converting the waste heat to electrical energy. RESULTS OF OPERATIONS Green Power adjusted EBIT for the nine months ended September 30, 2015 were comparable with the corresponding 2014 period. Following the close of the 2015 Transaction, Green Power results included earnings from Lac Alfred, Massif du Sud, Blackspring Ridge and Saint Robert Bellarmin wind farms for the month of September 2015. Period-over-period, this positive impact was partially offset by a slight decrease in adjusted EBIT from EIPLP’s previously owned Ontario and Talbot wind farms due to lower wind resource. Adjusted EBIT increased for the three months ended September 30, 2015 compared with the corresponding period, reflecting similar trends as the year-to-date results noted above.
BUSINESS RISKS The risks identified below are specific to Green Power. General risks that affect EIPLP as a whole are described under Risk Management and Financial Instruments – General Business Risks. Asset Utilization Earnings from EIPLP’s wind and solar assets are highly dependent on weather and atmospheric conditions as well as continued operational availability of these energy producing assets. While the expected energy yields for the Green Power assets are predicted using long-term historical data, wind and solar resources will be subject to natural variation from year to year and from season to season. Any prolonged reduction in wind or solar resources at any of EIPLP’s facilities could lead to decreased earnings for EIPLP. Additionally, inefficiencies or interruptions of EIPLP’s facilities due to operational disturbances or outages could also impact earnings. EIPLP mitigates the risk of operational availability by establishing Operations and Maintenance contracts with the original equipment manufacturers that include a negotiated operational performance asset guarantee. EIPLP also monitors the operational reliability of the assets on a 24-hour basis. Power produced from Green Power assets is also often sold to a single counterparty under PPAs or other long-term pricing arrangements. In this respect, the performance of the Green Power assets is dependent on each counterparty performing its contractual obligations under the PPA or pricing arrangement applicable to it.

26
Competition Green Power assets operate in the Canadian power market, which is subject to competition and the supply and demand balance for power in the provinces in which they operate. The renewable energy market sector includes large utilities and small independent power producers, which are expected to aggressively compete with the Manager for project development opportunities. Regulatory Specific to EIPLP’s wind farms located in the province of Ontario, renewable generators are classified as intermittent generators under the Independent Electricity System Operator (IESO) Market Rules. Amendments to the IESO Market Rules were passed on November 29, 2012, to allow for curtailment of intermittent generators in times of surplus base-load generation. EIPLP and other renewable power generators reached an agreement with the Ontario Power Authority in February 2013 to amend certain existing power purchase agreements to include both annual and contract term curtailment caps beyond which renewable power generators will be compensated for forgone production. Uncompensated curtailment impacts less than 1% of the operating hours of the Ontario wind farms and is expected to remain consistent over the life of the PPAs. Transmission Systems The ability of Green Power assets to deliver power is impacted by the availability of, and access to, interconnection facilities and transmission systems. The inability to access or unavailability of such systems, the operational failure of such systems or the lack of adequate capacity on them could have a material adverse impact on EIPLP’s ability to deliver power to counterparties or the requirement of counterparties to pay for energy delivery under various contracts, which in turn could have a material adverse effect on EIPLP’s cash flow or financial condition.
LIQUIDITY AND CAPITAL RESOURCES SOURCES AND USES OF CASH EIPLP’s primary uses of cash are distributions to its unitholders, administrative and operational expenses, maintenance and enhancement capital spending as well as interest and principal repayments on its long-term debt. EIPLP generates cash from operations, commercial paper issuances and credit facility draws, through the periodic issuance of public term debt and issuance of units to its unitholders and general partner. Additionally, to ensure ongoing liquidity and to mitigate the risk of capital market disruption, EIPLP maintains a level of committed bank credit facilities. In addition to ensuring adequate liquidity, EIPLP actively manages its bank funding sources to optimize pricing and other terms. Additional liquidity, if necessary, is expected to be available through intercompany transactions with Enbridge or other related entities. Long-term Debt Long-term debt consists of a committed credit facility through EPI and medium-term notes. As at September 30, 2015 EIPLP had $3,005 million of committed credit facilities of which $1,180 million were drawn or allocated to backstop commercial paper. EPI must adhere to covenants under its credit facility agreement and Trust Indenture. As at September 30, 2015, EPI was in compliance with all debt covenants. During the three months ended September 30, 2015, unsecured medium-term notes of $600 million with a 10-year maturity and $400 million with a 30-year maturity were issued through EPI. Equity During the three and nine months ended September 30, 2015, EIPLP issued Class A Units to ECT for gross proceeds of approximately $3,000 million. The aggregate proceeds from this issuance was used to satisfy the cash portion of the purchase price payable to certain Enbridge Subsidiaries related to the 2015 Transaction.
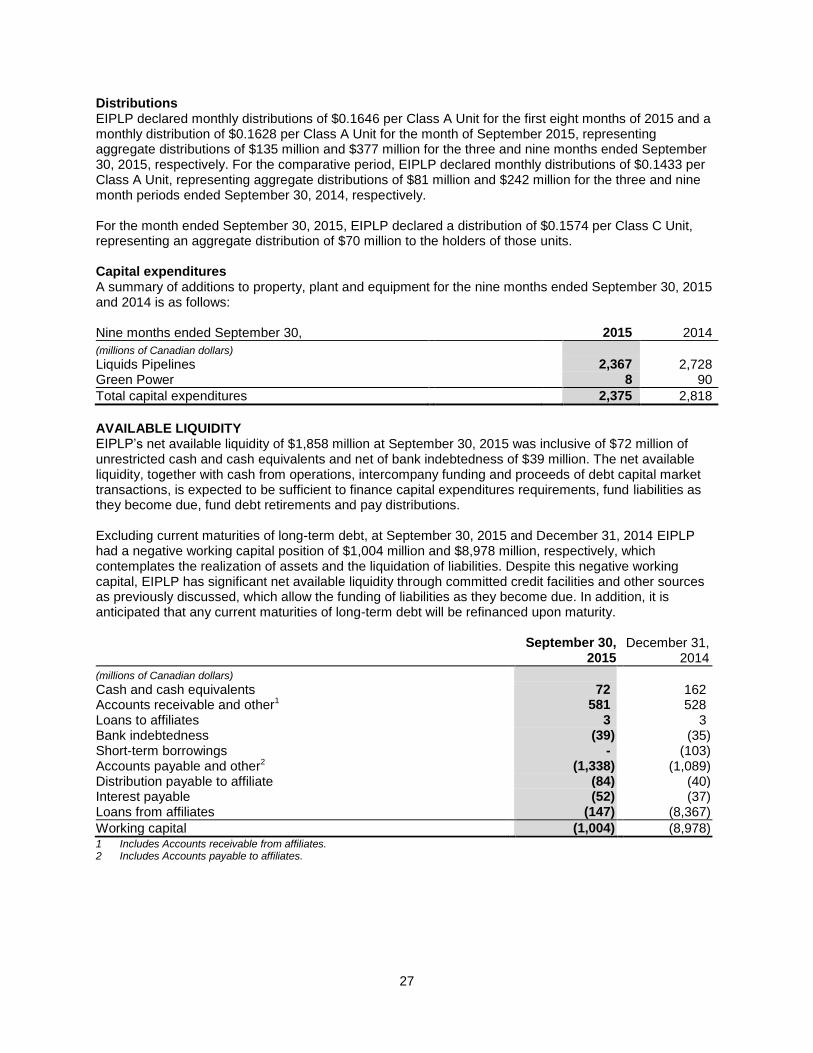
27
Distributions EIPLP declared monthly distributions of $0.1646 per Class A Unit for the first eight months of 2015 and a monthly distribution of $0.1628 per Class A Unit for the month of September 2015, representing aggregate distributions of $135 million and $377 million for the three and nine months ended September 30, 2015, respectively. For the comparative period, EIPLP declared monthly distributions of $0.1433 per Class A Unit, representing aggregate distributions of $81 million and $242 million for the three and nine month periods ended September 30, 2014, respectively. For the month ended September 30, 2015, EIPLP declared a distribution of $0.1574 per Class C Unit, representing an aggregate distribution of $70 million to the holders of those units. Capital expenditures A summary of additions to property, plant and equipment for the nine months ended September 30, 2015 and 2014 is as follows: Nine months ended September 30,
2015 2014
(millions of Canadian dollars)
Liquids Pipelines
2,367 2,728
Green Power
8 90
Total capital expenditures
2,375 2,818
AVAILABLE LIQUIDITY EIPLP’s net available liquidity of $1,858 million at September 30, 2015 was inclusive of $72 million of unrestricted cash and cash equivalents and net of bank indebtedness of $39 million. The net available liquidity, together with cash from operations, intercompany funding and proceeds of debt capital market transactions, is expected to be sufficient to finance capital expenditures requirements, fund liabilities as they become due, fund debt retirements and pay distributions. Excluding current maturities of long-term debt, at September 30, 2015 and December 31, 2014 EIPLP had a negative working capital position of $1,004 million and $8,978 million, respectively, which contemplates the realization of assets and the liquidation of liabilities. Despite this negative working capital, EIPLP has significant net available liquidity through committed credit facilities and other sources as previously discussed, which allow the funding of liabilities as they become due. In addition, it is anticipated that any current maturities of long-term debt will be refinanced upon maturity.
September 30,
2015 December 31,
2014
(millions of Canadian dollars)
Cash and cash equivalents
72 162 Accounts receivable and other1
581 528 Loans to affiliates
3 3
Bank indebtedness (39) (35) Short-term borrowings - (103) Accounts payable and other2
(1,338) (1,089)
Distribution payable to affiliate (84) (40) Interest payable (52) (37) Loans from affiliates (147) (8,367)
Working capital
(1,004) (8,978)
1 Includes Accounts receivable from affiliates. 2 Includes Accounts payable to affiliates.

28
CONTRACTUAL OBLIGATIONS Payments due under contractual obligations over the next five years and thereafter are as follows:
Total
Less than 1
year 1-3 years 3-5
years After 5 years
(millions of Canadian dollars) Long-term debt1
4,267 6 30 635 3,596
Loans from affiliates 6,448 147 - - 6,301 Capital and operating leases 511 37 77 77 320 Long term contracts 1,764 1,142 487 41 94
Total 12,990 1,332 594 753 10,311 1 Excludes interest. Changes to the planned funding requirements are dependent on the terms of any debt refinancing
agreements.
CAPITAL EXPENDITURE COMMITMENTS EIPLP has signed contracts primarily for the purchase of services, pipe and other materials totalling $1,548 million, which are expected to be paid over the next five years. OTHER LITIGATION EIPLP and its subsidiaries are subject to various other legal and regulatory actions and proceedings which arise in the normal course of business, including interventions in regulatory proceedings and challenges to regulatory approvals and permits by special interest groups. While the final outcome of such actions and proceedings cannot be predicted with certainty, Management believes that the resolution of such actions and proceedings will not have a material impact on EIPLP’s consolidated financial position or results of operations.
QUARTERLY FINANCIAL INFORMATION1
2015 2014 2013
Q3 Q2 Q1 Q4 Q3 Q2 Q1 Q4
(millions of Canadian dollars) Revenues 180 1,007 (60) 408 358 980 440 476 Earnings/(loss) attributable to general
and limited partners (274) 469 (301) 45 14 466 106 80 1 Revenues and Earnings/(loss) for all periods have been retrospectively adjusted to furnish comparative information related to
the 2015 Transaction and the 2014 Transaction as prescribed by U.S. GAAP for common control transactions.
Several factors impact comparability of EIPLP’s financial results on a quarterly basis, including, but not limited to, fluctuations in market prices such as foreign exchange rates and commodity prices, disposals of investments or assets and the timing of in-service dates of new projects. EIPLP actively manages its exposure to market risks including, but not limited to, commodity prices and foreign exchange rates. To the extent derivative instruments used to manage these risks are non-qualifying for the purposes of applying hedge accounting, changes in unrealized fair value gains and losses on these instruments will impact earnings. EIPLP’s Green Power segment is subject to seasonal variations. This is driven by stronger wind resources in the first and fourth quarters and stronger solar resources in the second and third quarters. Although these trends are offsetting, revenues and earnings are generally expected to be lowest in the third quarter, attributable to seasonally weaker wind resources. As part of the 2015 Transaction, the commercially secured growth programs embedded within EPI and EPAI were transferred to EIPLP. Prior to the close of the 2015 Transaction, both EPI and EPAI undertook a substantial capital growth over the past recent years. The timing of construction and completion of

29
growth projects may impact the comparability of EIPLP’s quarterly results. EIPLP’s capital expansion initiatives, including construction commencement and in-service dates, are described in Growth Projects.
RELATED PARTY TRANSACTIONS All related party transactions are entered into in the normal course of business and, unless otherwise noted, are measured at the exchange amount, which is the amount of consideration established and agreed to by the related parties. Affiliates refer to Enbridge and companies that are either directly or indirectly owned by Enbridge. The acquisition of the Purchased Entities and equity investment in Alliance US were accounted for as transactions among entities under common control. GENERAL PARTNER EIPGP is the general partner of EIPLP and has a 0.01% interest in the Class A Units of EIPLP. As at September 30, 2015, Enbridge holds a 51% direct interest in EIPGP. Per the Limited Partnership Agreement, EIPGP has the right to manage, control and operate the businesses of EIPLP. EIPGP delegates the execution of certain of its powers to Enbridge Management Services Inc., a wholly-owned subsidiary of Enbridge, who administers EIPLP. INTERCORPORATE SERVICES EIPLP does not have any employees and it receives services from affiliates for managing and operating the business. These services, which are charged at cost in accordance with service agreements or which reflect normal commercial trade terms, totalled $71 million and $129 million for the three and nine months ended September 30, 2015, respectively (2014 - $22 million and $67 million, respectively). EIPLP provides certain operational services to affiliates. These services, which are charged at cost in accordance with service agreements or which reflect normal commercial trade terms, totalled $46 million and $159 million for the three and nine months ended September 30, 2015, respectively (2014 - $54 million and $158 million, respectively). LIQUIDS PIPELINES EIPLP has contracts with shippers who are also affiliates of EIPLP through common ownership interests of Enbridge. Revenues from affiliates, which reflect normal commercial trade terms, totalled $24 million and $52 million for the three and nine months ended September 30, 2015, respectively (2014 - $6 million and $24 million, respectively).
GAS PIPELINES Alliance Pipeline has contracts with shippers that are also affiliates of EIPLP through common ownership interests of Enbridge. EIPLP’s share of Alliance Pipeline’s revenues from affiliates for the three and nine months ended September 30, 2015 was $14 million and $40 million, respectively (2014 - $13 million and $37 million, respectively). LONG-TERM RECEIVABLE FROM AFFILIATE Long-term receivable from affiliate includes the carrying value of Class A Units of Southern Lights Holdings, L.L.C., which is an indirect wholly-owned subsidiary of Enbridge. At September 30, 2015, $804 million (December 31, 2014 - $707 million) is included in Long-term receivable from affiliate and $17 million (December 31, 2014 - $12 million) is included in Accounts receivable from affiliates. Interest income of $16 million and $45 million for the three and nine months ended September 30, 2015, respectively (2014 - nil and nil, respectively), has been recorded within Other income - affiliates on the Consolidated Statements of Earnings. INVESTMENT IN AFFILIATED COMPANY As at September 30, 2015, EIPLP had an investment of $514 million in 500,000 non-voting, redeemable Series A Preferred Shares of EESCI. These Preferred Shares entitle EIPLP to receive annual dividends
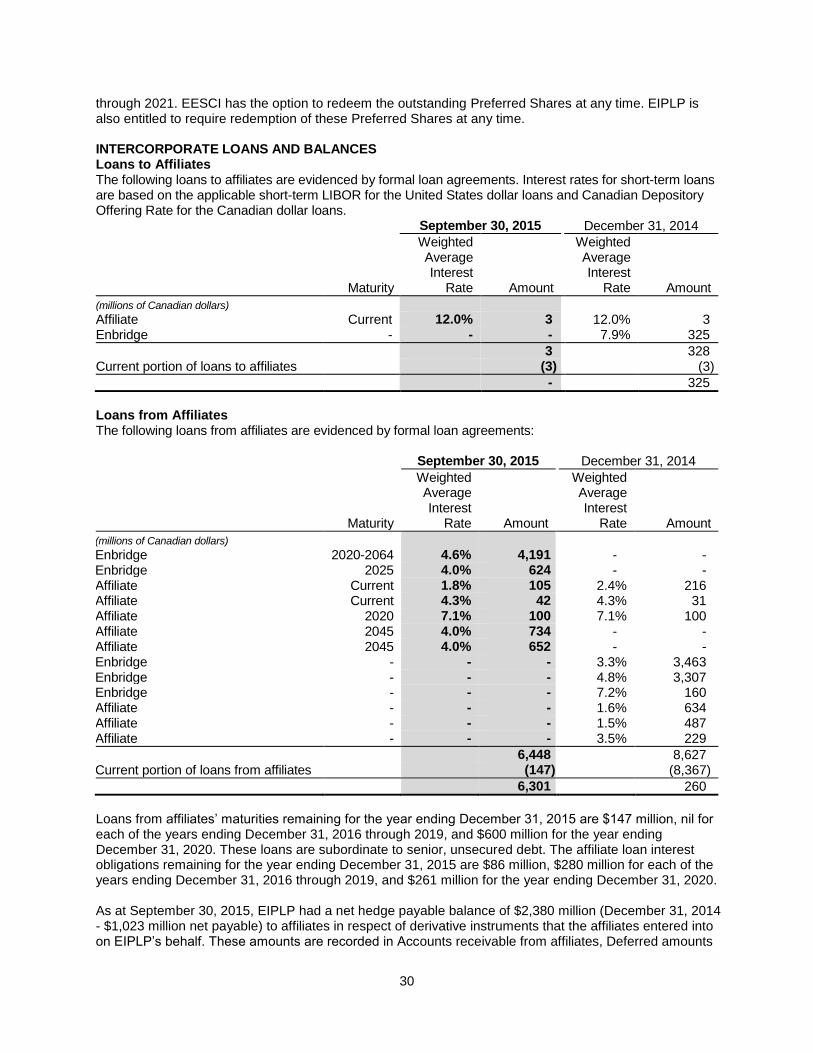
30
through 2021. EESCI has the option to redeem the outstanding Preferred Shares at any time. EIPLP is also entitled to require redemption of these Preferred Shares at any time. INTERCORPORATE LOANS AND BALANCES Loans to Affiliates The following loans to affiliates are evidenced by formal loan agreements. Interest rates for short-term loans are based on the applicable short-term LIBOR for the United States dollar loans and Canadian Depository Offering Rate for the Canadian dollar loans. September 30, 2015 December 31, 2014
Maturity
Weighted Average Interest
Rate
Amount
Weighted Average Interest
Rate
Amount
(millions of Canadian dollars) Affiliate Current 12.0% 3 12.0% 3 Enbridge - - - 7.9% 325
3 328 Current portion of loans to affiliates (3) (3)
- 325
Loans from Affiliates The following loans from affiliates are evidenced by formal loan agreements: September 30, 2015 December 31, 2014
Maturity
Weighted Average Interest
Rate
Amount
Weighted Average Interest
Rate
Amount
(millions of Canadian dollars) Enbridge 2020-2064 4.6% 4,191 - - Enbridge 2025 4.0% 624 - - Affiliate Current 1.8% 105 2.4% 216 Affiliate Current 4.3% 42 4.3% 31 Affiliate 2020 7.1% 100 7.1% 100 Affiliate 2045 4.0% 734 - - Affiliate 2045 4.0% 652 - - Enbridge - - - 3.3% 3,463 Enbridge - - - 4.8% 3,307 Enbridge - - - 7.2% 160 Affiliate - - - 1.6% 634 Affiliate - - - 1.5% 487 Affiliate - - - 3.5% 229
6,448 8,627 Current portion of loans from affiliates (147) (8,367)
6,301 260
Loans from affiliates’ maturities remaining for the year ending December 31, 2015 are $147 million, nil for each of the years ending December 31, 2016 through 2019, and $600 million for the year ending December 31, 2020. These loans are subordinate to senior, unsecured debt. The affiliate loan interest obligations remaining for the year ending December 31, 2015 are $86 million, $280 million for each of the years ending December 31, 2016 through 2019, and $261 million for the year ending December 31, 2020. As at September 30, 2015, EIPLP had a net hedge payable balance of $2,380 million (December 31, 2014 - $1,023 million net payable) to affiliates in respect of derivative instruments that the affiliates entered into on EIPLP’s behalf. These amounts are recorded in Accounts receivable from affiliates, Deferred amounts

31
and other assets, Accounts payable to affiliates and Other long-term liabilities on the Consolidated Statements of Financial Position.
RISK MANAGEMENT AND FINANCIAL INSTRUMENTS MARKET PRICE RISK EIPLP’s earnings, cash flows and other comprehensive income (OCI) are subject to movements in interest rates, foreign exchange rates and commodity prices (collectively, market price risk). Formal risk management policies, processes and systems have been designed to mitigate these risks.
The following summarizes the types of market price risks to which EIPLP is exposed and the risk management instruments used to mitigate them. EIPLP uses a combination of qualifying and non-qualifying derivative instruments to manage the risks noted below. Interest Rate Risk EIPLP’s earnings, cash flows and OCI are exposed to short term interest rate variability due to the regular repricing of its variable rate debt, primarily commercial paper. Pay fixed-receive floating interest rate swaps are used to hedge against the effect of future interest rate movements. EIPLP has implemented a program to significantly mitigate the volatility of short-term interest rates on interest expense through 2019 with the execution of floating to fixed rate interest rate swaps with an average swap rate of 1.4%. EIPLP’s earnings, cash flows and OCI are also exposed to variability in longer term interest rates ahead of anticipated fixed rate debt issuances. Forward starting interest rate swaps are used to hedge against the effect of future interest rate movements. EIPLP has implemented a program to significantly mitigate its exposure to long-term interest rate variability on select forecast term debt issuances through 2019 with the execution of floating to fixed rate interest rate swaps with an average swap rate of 3.1%. EIPLP’s portfolio mix of fixed and variable rate debt instruments is managed at the consolidated Enbridge level. EIPLP does not typically manage the fair value of its debt instruments. Foreign Exchange Risk EIPLP generates certain revenues, incurs expenses, and holds investments and subsidiaries that are denominated in currencies other than Canadian dollars. As a result, EIPLP’s earnings, cash flows and OCI are exposed to fluctuations resulting from foreign exchange rate variability. EIPLP has implemented a policy whereby, at a minimum, it hedges a level of foreign currency denominated cash flow exposures over a five year forecast horizon. A combination of qualifying and non-qualifying derivative instruments is used to hedge anticipated foreign currency denominated revenues and expenses, and to manage variability in cash flows. Commodity Price Risk EIPLP’s earnings, cash flows and OCI are exposed to changes in commodity prices as a result of its ownership interest in certain assets and investments. These commodities include natural gas, crude oil power and NGL. EIPLP employs financial derivative instruments to fix a portion of the variable price exposures that arise from physical transactions involving these commodities. EIPLP may use a combination of qualifying and non-qualifying derivative instruments to manage commodity price risk.

32
The Effect of Derivative Instruments on the Statements of Earnings and Comprehensive Income The following table presents the effect of cash flow hedges on EIPLP’s consolidated earnings and consolidated comprehensive income, before the effect of income taxes. Three months ended
September 30,
Nine months ended September 30,
2015 2014 2015 2014
(millions of Canadian dollars)
Amount of unrealized gains/(loss) recognized in OCI Cash flow hedges
Foreign exchange contracts 2 1 2 1 Interest rate contracts 10 (25) (36) (120) Commodity contracts 10 (2) 3 (5)
22 (26) (31) (124)
Amount of gains/(loss) reclassified from Accumulated other comprehensive income (AOCI) to earnings (effective portion)
Foreign exchange contracts2
- - - - (1) Interest rate contracts
1 1 1 3 2
Commodity contracts3
(1) - (4) -
- 1 (1) 1
Amount of gains/(loss) reclassified from AOCI to earnings (ineffective portion and amount excluded from effectiveness testing)
Foreign exchange contracts2
- - - - Interest rate contracts
1 1 (1) - (1)
Commodity contracts3
- 1 - 5
1 - - 4
Amount of gains/(loss) from non-qualifying derivatives included in earnings
Foreign exchange contracts2
(741) (301) (1,350) (243) Commodity contracts
3 (9) 4 (12) (3)
(750) (297) (1,362) (246) 1 Reported within Interest income/(expense) in the Consolidated Statements of Earnings. 2 Reported within Transportation and other services revenues and Other income/(expense) in the Consolidated Statements of
Earnings. 3 Reported within Electricity sales revenues, Commodity costs and Other income/(expense) in the Consolidated Statements of
Earnings. LIQUIDITY RISK Liquidity risk is the risk EIPLP will not be able to meet its financial obligations, including commitments and guarantees, as they become due. In order to manage this risk, EIPLP forecasts cash requirements over the near and long term to determine whether sufficient funds will be available when required. EIPLP generates cash from operations, commercial paper issuances and credit facility draws, through the periodic issuance of public term debt and issuance of units to its unitholders and general partner. Additionally, to ensure ongoing liquidity and to mitigate the risk of market disruption, EIPLP maintains a level of committed bank credit facilities. In addition, to ensure adequate liquidity, EIPLP actively manages its bank funding sources to optimize pricing and other terms. Additional liquidity, if necessary, is expected to be available through intercompany transactions with Enbridge or other related entities. CREDIT RISK Entering into derivative financial instruments may result in exposure to credit risk. Credit risk arises from the possibility that a counterparty will default on its contractual obligations. In order to mitigate this risk, EIPLP enters into risk management transactions primarily with institutions that possess investment grade credit ratings. Credit risk relating to derivative counterparties is mitigated by credit exposure limits and contractual requirements, frequent assessment of counterparty credit ratings and netting arrangements.
33
Credit risk also arises from trade and other long-term receivables, and is mitigated through credit exposure limits, contractual requirements, assessment of credit ratings and netting arrangements. Generally, EIPLP classifies and provides for receivables older than 30 days as past due. The maximum exposure to credit risk related to non-derivative financial assets is their carrying value. FAIR VALUE MEASUREMENTS EIPLP’s financial assets and liabilities measured at fair value on a recurring basis include derivative instruments. EIPLP also discloses the fair value of other financial instruments not measured at fair value. The fair value of financial instruments reflects EIPLP’s best estimates of market value based on generally accepted valuation techniques or models and are supported by observable market prices and rates. When such values are not available, EIPLP uses discounted cash flow analysis from applicable yield curves based on observable market inputs to estimate fair value. GENERAL BUSINESS RISKS Strategic and Commercial Risks Project Execution As EIPLP’s slate of growth projects increases, it continues to focus on completing projects safely, on-time and on-budget. However, EIPLP faces the challenge of scaling the business to manage an unprecedented number of commercially secured growth projects. The ability to successfully execute the development of its organic growth projects may be influenced by capital constraints, third-party opposition, changes in shipper support over time, delays in or changes to government and regulatory approvals, cost escalations, construction delays, inadequate resources, in-service delays and increasing complexity of projects (collectively, Execution Risk). Early stage project risks include right-of-way procurement, special interest group opposition, Crown consultation and environmental and regulatory permitting. Cost escalations or missed in-service dates on future projects may impact future earnings and cash flows and may hinder the Manager’s ability to secure future projects. Construction delays due to regulatory delays, third-party opposition, contractor or supplier non-performance and weather conditions may impact project development.
Enbridge, through its enterprise-wide Major Projects group strives to be an industry leader in project execution. Major Projects aims to mitigate project execution risk and is centralized and has a clearly defined governance structure and process for all major projects, with dedicated resources organized to lead and execute each major project. Capital constraints and cost escalation risks are mitigated through structuring of commercial agreements, typically where shippers retain complete or a share of capital cost excess. Detailed cost tracking and centralized purchasing is used on all major projects to facilitate optimum pricing and service terms. Strategic relationships have been developed with suppliers and contractors and those selected are chosen based on the Managers’ strict adherence to safety including robust safety standards embedded in contracts with suppliers. Major Projects has assessed work volumes for the next several years across its projects to optimize the expected costs, supply of services, material and labour to execute the projects. Underpinning this approach is Major Project’s Project Lifecycle Gating Control tool which helps to ensure schedule, cost, safety and quality objectives are on track and met for each stage of a project’s development and construction. Consultations with regulators are held in-advance of project construction to enhance understanding of project rationale and ensure applications are compliant and robust, while at all times maintaining a strong focus on integrity and public safety. Enbridge also actively involves its legal and regulatory teams to work closely with Major Projects to engage in open dialogue with government agencies, regulators, land owners, Aboriginal groups and special interest groups to identify and develop appropriate responses to their concerns regarding EIPLP’s projects.

34
Operational and Economic Regulation Many of EIPLP’s operations are regulated and are subject to both operational and economic regulatory risk. The nature and degree of regulation and legislation affecting energy companies in Canada and the United States has changed significantly in past years and there is no assurance that further substantial changes will not occur. Operational regulation risks relate to failing to comply with applicable operational rules and regulations from government organizations and could result in fines or operating restrictions or an overall increase in operating and compliance costs. Regulatory scrutiny over EIPLP’s assets has the potential to increase operating costs or limit future projects. Potential regulatory changes could have an impact on EIPLP’s future earnings and the cost related to the construction of new projects. The Manager believes operational regulation risk is mitigated by active monitoring and consulting on potential regulatory requirement changes with the respective regulators or through industry associations. EIPLP also develops robust response plans to regulatory changes or enforcement actions. While EIPLP believes the safe and reliable operation of its assets and adherence to existing regulations is the best approach to managing operational regulatory risk, the potential remains for regulators to make unilateral decisions that could have a financial impact on EIPLP. EIPLP also faces economic regulatory risk. Broadly defined, economic regulation risk is the risk regulators or other government entities change or reject proposed or existing commercial arrangements including permits and regulatory approvals for new projects. The changing or rejecting of commercial arrangements, including decisions by regulators on the applicable tariff structure or changes in interpretations of existing regulations by courts or regulators, could have an adverse effect on EIPLP’s revenues, earnings and distributable cash flow. Delays in regulatory approvals could result in cost escalations and constructions delays, which also negatively impact EIPLP’s operations. The Manager believes that economic regulatory risk is reduced through the negotiation of long-term agreements with shippers that govern the majority of its operations. The Manager also involves its legal and regulatory teams in the review of new projects to ensure compliance with applicable regulations as well as in the establishment of tariffs and tolls for these assets. The Manager retains dedicated professional staff and maintains strong relationships with customers, intervenors and regulators to help minimize economic regulation risk. However, despite the best efforts of the Manager to mitigate economic regulation risk, there remains a risk that a regulator could overturn long-term agreements between EIPLP and shippers or deny the approval and permits for new projects. Regulatory Regime The operation of EIPLP’s assets is subject to extensive regulation by various government departments and regulatory agencies, including environmental and safety standards and regulations. As legal requirements may change, any new law or regulation or changes to existing laws could require additional expenditures to achieve or maintain compliance. The profitability of EIPLP will in part be dependent upon the continuation of a stable regulatory framework. Any changes in the regulatory framework which adversely affects EIPLP, including increases in taxes, permit fees or regulatory requirements may adversely affect the revenues, earnings and ACFFO by EIPLP. The failure to operate EIPLP’s assets in strict compliance with applicable regulations and standards may expose the facilities to claims, penalties, remediation and cleanup costs, suspension or revocation of operating permits or termination of transportation service agreements, PPAs or other agreements. Operational and Economic Regulation EIPLP will be required to comply with numerous federal, provincial and local laws and regulations and to maintain and comply with numerous regulatory licenses, permits and governmental approvals required for the maintenance and operation of its assets. Many of the regulatory permits that have been issued in respect of EIPLP’s assets contain terms, conditions and restrictions, or may have limited terms. A failure to satisfy the terms and conditions or comply with the restrictions imposed under regulatory permits or the restrictions imposed by any statutory or regulatory requirements, may result in regulatory enforcement action, which could adversely affect continued operations, or result in fines, penalties or additional costs, including requirements to suspend or cease operations.
35
Operational Risks Environmental Incident EIPLP is subject to the risk of incurring substantial costs and liabilities under environmental, health and safety laws applicable to its assets. Environmental and health and safety legislation imposes restrictions, liabilities and obligations in connection with the generation, handling, storage, transportation, treatment and disposal of hazardous substances and waste and in connection with noise, spills, releases and emissions of substances into the environment. Environmental Laws also mandate that pipelines, tanks, turbines, installations, facilities and other properties associated with its assets be operated, maintained, abandoned and reclaimed in accordance with applicable regulations and guidelines. Failure to comply with environmental, health and safety laws may result in the imposition of administrative and criminal penalties, civil liability, liens and the imposition of remedial obligations such as cleanup and site restoration requirements, the revocation or suspension of operating permits and the issuance of orders to limit or cease operations. An environmental incident could have lasting reputational impacts to EIPLP and could impact its ability to work with various stakeholders. In addition to the cost of remediation activities (to the extent not covered by insurance) environmental incidents may lead to an increased cost of operating and insuring EIPLP’s assets, thereby negatively impacting earnings and distributable cash flow. EIPLP mitigates risk of environmental incident through its inclusion in Enbridge’s ORM Plan, which broadly aims to position Enbridge and its subsidiaries as the industry leader for system integrity, environmental and safety programs. Mitigation efforts continue to focus on efforts to reduce the likelihood of an environmental incident. Under the umbrella of Enbridge’s ORM Plan, EIPLP has continued its maintenance, excavation and repair program which are supported by operating and capital budgets for pipeline integrity. Although the Manager believes its integrated management system, plans and processes mitigate the risk of environmental incidents, there remains a chance that an environmental incident could occur. The ORM plan also seeks to mitigate the severity of a potential environmental incident through continued process improvements and enhancements in leak detection processes and alarm analysis procedures. The Manager has also invested significant resources to enhance its emergency response plans, operator training and landowner education programs to address any potential environmental incident. EIPLP is included in Enbridge’s comprehensive insurance policy, which covers Enbridge subsidiaries and affiliates and is renewed annually. The insurance program includes coverage for commercial liability that is considered customary for its industry and includes coverage for environmental incidents. The total insurance coverage will be allocated on an equitable basis in the unlikely event multiple insurable incidents exceeding Enbridge’s coverage limits are experienced by Enbridge and two Enbridge subsidiaries covered by the same policy within the same insurance period. Public, Worker and Contractor Safety Several of EIPLP’s pipeline systems run adjacent to populated areas and a major incident could result in injury to members of the public. A public safety incident could result in reputational damage to Enbridge and its subsidiaries, material repair costs or increased costs of operating and insuring its assets. In addition, given the natural hazards inherent with EIPLP’s operations, its workers and contractors are subject to personal safety risks. Safety and operational reliability are the most important priorities at Enbridge. Enbridge and its subsidiaries’ mitigation efforts to reduce the likelihood and severity of a public safety incident are executed primarily through Enbridge’s ORM Plan and emergency response preparedness, as described above in Environmental Incident. Enbridge also actively engages stakeholders through public safety awareness activities to ensure the public is aware of potential hazards and understands the appropriate actions to take in the event of an emergency. Enbridge also actively engages first responders through education programs that endeavour to equip first responders with the skills and tools to safely and effectively respond to a potential incident.

36
Information Technology Security or Systems Incident EIPLP’s infrastructure, applications and data are becoming more integrated, creating an increased risk that failure in one system could lead to a failure of another system. There is also increasing industrywide cyber-attacking activity targeting industrial control systems and intellectual property. A successful cyber-attack could lead to unavailability, disruption or loss of key functionalities within EIPLP’s industrial control systems which could impact pipeline operations. A successful cyber-attack could also lead to a large scale data breach resulting in unauthorized disclosure, corruption or loss of sensitive information. The Manager has implemented a comprehensive security strategy that includes a security policy and standards framework, defined governance and oversight, layered access controls, continuous monitoring, infrastructure and network security and threat detection and incident response through a security operations centre. EIPLP’s information technology security operations are consolidated under one leadership structure to increase consistency and compliance with security requirements across business segments. Business Environment Risks Aboriginal Relations Canadian judicial decisions have recognized that Aboriginal rights and treaty rights exist in proximity to EIPLP’s operations and future project developments. The courts have also confirmed that the Crown has a duty to consult with Aboriginal people when its decisions or actions may adversely affect Aboriginal rights and interests or treaty rights. Crown consultation has the potential to delay regulatory approval processes and construction, which may affect project economics. In some cases, respecting Aboriginal rights may mean regulatory approval is denied or the conditions in the approval make a project economically challenging.
Special Interest Groups including Non-Governmental Organizations The development and operation of EIPLP’s assets may at times be subject to public opposition which could expose EIPLP to the risk of higher costs, delays or even project cancellations due to increasing pressure on governments and regulators by special interest groups including aboriginal groups, landowners, environmental interest groups and other non-governmental organizations Enbridge and its subsidiaries work proactively with special interest groups and non-governmental organizations to identify and develop appropriate responses to their concerns regarding its projects.
CRITICAL ACCOUNTING ESTIMATES DEPRECIATION Depreciation of property, plant and equipment, EIPLP’s largest asset with a net book value at September 30, 2015 of $20,573 million (December 31, 2014 - $18,856 million), or 82% of total assets, is generally provided on a straight-line basis over the estimated service lives of the assets commencing when the asset is placed in service. When it is determined that the estimated service life of an asset no longer reflects the expected remaining period of benefit, prospective changes are made to the estimated service life. Estimates of useful lives are based on third party engineering studies, experience and/or industry practice. There are a number of assumptions inherent in estimating the service lives of EIPLP’s assets including the level of development, exploration, drilling, reserves and production of crude oil and natural gas in the supply areas served by EIPLP’s pipelines as well as the demand for crude oil and natural gas and the integrity of EIPLP’s systems. Changes in these assumptions could result in adjustments to the estimated service lives, which could result in material changes to depreciation expense in future periods in any of EIPLP’s business segments. For certain rate-regulated operations, depreciation rates are approved by the regulator and the regulator may require periodic studies or technical updates on useful lives which may change depreciation rates. ASSET IMPAIRMENT EIPLP evaluates the recoverability of its property, plant and equipment when events or circumstances such as economic obsolescence, business climate, legal or regulatory changes, or other factors indicate it may not recover the carrying amount of the assets. EIPLP continually monitors its businesses, the market and business environments to identify indicators that could suggest an asset may not be

37
recoverable. An impairment loss is recognized when the carrying amount of the asset exceeds its fair value as determined by quoted market prices in active markets or present value techniques. The determination of the fair value using present value techniques requires the use of projections and assumptions regarding future cash flows and weighted average cost of capital. Any changes to these projections and assumptions could result in revisions to the evaluation of the recoverability of the property, plant and equipment and the recognition of an impairment loss in the Consolidated Statements of Earnings. REGULATORY ASSETS AND LIABILITIES Certain of EIPLP’s businesses are subject to regulation by various authorities, including the NEB, FERC, Saskatchewan Ministry of Economy and Manitoba Mineral Resources. Regulatory bodies exercise statutory authority over matters such as construction, rates and ratemaking and agreements with customers. To recognize the economic effects of the actions of the regulator, the timing of recognition of certain revenues and expenses in these operations may differ from that otherwise expected under U.S. GAAP for non-rate-regulated entities. Regulatory assets represent amounts that are expected to be recovered from customers in future periods through rates. Regulatory liabilities represent amounts that are expected to be refunded to customers in future periods through rates. Long-term regulatory assets are recorded in deferred amounts and other assets and current regulatory assets are recorded in accounts receivable and other. Long-term regulatory liabilities are recorded in other long-term liabilities and current regulatory liabilities are recorded in accounts payable and other. Regulatory assets are assessed for impairment if EIPLP identifies an event indicative of possible impairment. The recognition of regulatory assets and liabilities is based on the actions or expected future actions of the regulator. To the extent that the regulator’s actions differ from EIPLP’s expectations, the timing and amount of recovery or settlement of regulatory balances could differ significantly from those recorded. In the absence of rate regulation, EIPLP would generally not recognize regulatory assets or liabilities and the earnings impact would be recorded in the period the expenses are incurred or revenues are earned. As at September 30, 2015, EIPLP’s net regulatory assets totalled $969 million (December 31, 2014 - $919 million) after derecognition of the majority of regulatory balances at Alliance Pipeline. Refer to Gas Pipelines – Alliance Pipeline System – Alliance Pipeline Recontracting. ASSET RETIREMENT OBLIGATIONS Asset retirement obligations (ARO) associated with the retirement of long-lived assets are measured at fair value and recognized as Accounts payable and other or Other long-term liabilities in the period in which they can be reasonably determined. The fair value approximates the cost a third party would charge to perform the tasks necessary to retire such assets and is recognized at the present value of expected future cash flows. ARO are added to the carrying value of the associated asset and depreciated over the asset’s useful life. The corresponding liability is accreted over time through charges to earnings and is reduced by actual costs of decommissioning and reclamation. EIPLP’s estimates of retirement costs could change as a result of changes in cost estimates and regulatory requirements. Currently, for certain of EIPLP’s assets, there is insufficient data or information to reasonably determine the timing of settlement for estimating the fair value of the ARO. In these cases, the ARO cost is considered indeterminate for accounting purposes as there is no data or information that can be derived from past practice, industry practice or the estimated economic life of the asset. In 2009, the NEB issued a decision related to the Land Matters Consultation Initiative (LMCI), which required holders of an authorization to operate a pipeline under the NEB Act to file a proposed process and mechanism to set aside funds to pay for future abandonment costs in respect of the sites in Canada used for the operation of a pipeline. The NEB’s decision stated that while pipeline companies are ultimately responsible for the full costs of abandoning pipelines, abandonment costs are a legitimate cost of providing service and are recoverable from the users of the pipeline upon approval by the NEB. Following the NEB’s final approval of the collection mechanism and the set-aside mechanism for LMCI, EIPLP began collecting and setting aside funds to cover future abandonment costs effective January 1, 2015. The funds collected are held in trust in accordance with the NEB decision. The funds collected from

38
shippers are reported within Transportation and other services revenues and Long-term investments. Concurrently, EIPLP reflects the future abandonment cost as an increase to Operating and maintenance expense and Other long-term liabilities.
CHANGES IN ACCOUNTING POLICIES ADOPTION OF NEW STANDARDS Reporting Discontinued Operations and Disclosures of Disposals of Components of an Entity Effective January 1, 2015, EIPLP prospectively adopted Accounting Standards Update (ASU) 2014-08 which changes the criteria and disclosures for reporting discontinued operations. The revised criteria will in general, result in fewer transactions being categorized as discontinued operations. There was no material impact to the consolidated financial statements as a result of adopting this update. Extraordinary and Unusual Items Effective January 1, 2015, EIPLP retrospectively adopted ASU 2015-01 which eliminates the concept of extraordinary items from U.S. GAAP. Entities will no longer be required to separately classify and present extraordinary items in the Consolidated Statements of Earnings. There was no material impact to EIPLP’s consolidated financial statements as a result of adopting this update. FUTURE ACCOUNTING POLICY CHANGES Simplifying the Presentation of Debt Issuance Costs ASU 2015-03 was issued in April 2015 with the intent to simplify the presentation of debt issuance costs. The new standard requires a debt issuance cost related to a recognized debt liability to be presented in the balance sheet as a direct deduction from the carrying amount of that debt liability, as consistent with the presentation of debt discounts or premiums. Further, ASU 2015-15 was issued in August 2015 to clarify the presentation and subsequent measurement of debt issuance costs associated with line-of-credit arrangements, whereby an entity may defer debt issuance costs as an asset and subsequently amortize them over the term of the line-of-credit. The accounting updates are effective for financial statements issued for fiscal years beginning after December 15, 2015 on a retrospective basis. The adoption of the pronouncement is not anticipated to have a material impact on EIPLP’s consolidated financial statements. Amendments to the Consolidation Analysis ASU 2015-02, issued in February 2015, revises the current consolidation guidance which results in a change in the determination of whether an entity consolidates certain types of legal entities. EIPLP is currently assessing the impact of the new standard on its consolidated financial statements. The new standard is effective for annual and interim reporting periods beginning after December 15, 2015 and may be applied on a full or modified retrospective basis. Revenue from Contracts with Customers ASU 2014-09 was issued in May 2014 with the intent of significantly enhancing comparability of revenue recognition practices across entities and industries. The new standard provides a single principles-based, five-step model to be applied to all contracts with customers and introduces new, increased disclosure requirements. EIPLP is currently assessing the impact of the new standard on its consolidated financial statements. In July 2015, the effective date of the new standard was delayed by one year and the new standard is now effective for annual and interim periods beginning on or after December 15, 2017 and may be applied on either a full or modified retrospective basis. Simplifying the Accounting for Measurement-Period Adjustments in Business Combinations ASU 2015-16 was issued in September 2015 with the intent to simplify the accounting for measurement-period adjustments in business combinations. The new standard requires that an acquirer must recognize adjustments to provisional amounts that are identified during the measurement period in the reporting period in which the adjustment amounts are determined. The accounting update is effective for fiscal years beginning after December 15, 2015, including interim periods within those fiscal years and is to be applied on a prospective basis. The adoption of the pronouncement is not anticipated to have a material impact on EIPLP’s consolidated financial statements.

39
EIPLP OWNERSHIP
The following presents the direct and indirect ownership of EIPLP as at November 3, 2015: Number
ENBRIDGE INCOME FUND HOLDINGS INC. (number of common shares outstanding) Held by public 56,349,000 Held by Enbridge Inc. 14,002,000
70,351,000
ENBRIDGE INCOME FUND (number of common shares outstanding) Held by Enbridge Inc.1
94,150,000
Held by Enbridge Income Fund Holdings Inc. 70,351,000
164,501,000
ENBRIDGE INCOME PARTNERS LP Class A units Held by Enbridge Income Partners GP Inc. 33,004 Held by Enbridge Commercial Trust 330,008,500
330,041,504
Class C units1 Held by Enbridge Inc. 442,923,363
Class E unit Held by Enbridge Inc. 1
Special Interest Rights Held by Enbridge Inc.
1,000
1 The EIPLP Class C Units and Fund Units may, at the option of the holder, be exchanged in whole or in part for ECT Preferred Units, Fund Units, or ENF common shares.

ENBRIDGE INCOME PARTNERS LP (unaudited)
CONSOLIDATED FINANCIAL STATEMENTS
September 30, 2015

1
CONSOLIDATED STATEMENTS OF EARNINGS
The accompanying notes are an integral part of these unaudited interim consolidated financial statements. 1 Includes limited partners’ interests as well as earnings of former owners of Purchased Entities resulting from the retrospective
adjustments of earnings in accordance with U.S. GAAP (Note 2).
Three months ended Nine months ended September 30, September 30,
2015 2014 2015 2014
(unaudited; millions of Canadian dollars) Revenues Transportation and other services 88 292 855 1,560 Electricity sales 68 60 220 194 Revenues - affiliates (Note 22) 24 6 52 24
180 358 1,127 1,778
Expenses Operating and administrative 267 288 840 820 Operating and administrative, net - affiliates (Note 22) 25 (32) (30) (91) Depreciation and amortization 163 139 458 403
455 395 1,268 1,132
(275) (37) (141) 646 Income from equity investments (Note 10) 39 32 125 106 Other income/(expense) (19) 14 21 22 Other income - affiliates (Note 22) 19 20 56 83 Interest income/(expense) (Note 14) (11) 11 4 (9) Interest expense - affiliates (Note 14) (79) (77) (236) (232)
(326) (37) (171) 616 Income taxes recovery/(expense) (Note 20) 66 51 79 (30)
Earnings/(loss) (260) 14 (92) 586 Special interest rights distributions (Note 17) Temporary performance distribution rights (14) - (14) -
Earnings/(loss) attributable to general and limited partners (274) 14 (106) 586
Earnings attributable to general partner interest (Note 17) - - - - Earnings attributable to limited partners’ interests1 (Note 17) (274) 14 (106) 586
(274) 14 (106) 586

2
CONSOLIDATED STATEMENTS OF COMPREHENSIVE INCOME Three months ended Nine months ended September 30, September 30,
2015 2014 2015 2014
(unaudited; millions of Canadian dollars) Earnings/(loss) (260) 14 (92) 586 Other comprehensive income/(loss), net of tax Change in unrealized loss on cash flow hedges (57) (23) (95) (97) Reclassification to earnings of realized cash flow hedges - 1 (1) -
Reclassification to earnings of unrealized cash flow hedges - -
- 3
Change in foreign currency translation adjustment 33 4 62 5
Other comprehensive loss (24) (18) (34) (89)
Comprehensive income/(loss) attributable to general and limited partners’ interests (284) (4)
(126) 497
The accompanying notes are an integral part of these unaudited interim consolidated financial statements.

3
CONSOLIDATED STATEMENTS OF PARTNERS’ CAPITAL Nine months ended September 30, 2015 2014
(unaudited; millions of Canadian dollars) General partner interest (Note 17)
Balance at beginning of year - - Excess purchase price over historical carrying value acquired allocation
(Note 6) (1) - Redemption value adjustment attributable to Class C units (1) -
(2) - Allocation from limited partners (8,539) -
Balance at end of period (8,541) -
Limited partners’ interests (Note 17) Balance at beginning of year1 7,154 5,689 Units issued 3,000 - Excess purchase price over historical carrying value acquired allocation
(Note 6) (7,160) - Equity of former owners of Purchased Entities allocation (1,489) (590) Redemption value adjustment attributable to Class C units (9,559) - Earnings allocation (108) 586 Distributions (377) (242)
(8,539) 5,443 Allocation to general partner 8,539 -
Balance at end of period - 5,443
Special interest rights Balance at beginning of year - - Units issued 2,565 -
Balance at end of period 2,565 -
Accumulated other comprehensive income/(loss) (Note 18) Balance at beginning of year (73) 42 Other comprehensive income/(loss), net of tax (34) (89)
Balance at end of period (107) (47)
Total partners’ capital (6,083) 5,396 The accompanying notes are an integral part of these unaudited interim consolidated financial statements. 1 Includes limited partners’ interests as well as equity of former owners of Purchased Entities resulting from the retrospective
adjustments of prior period balances in accordance with U.S. GAAP (Note 2).
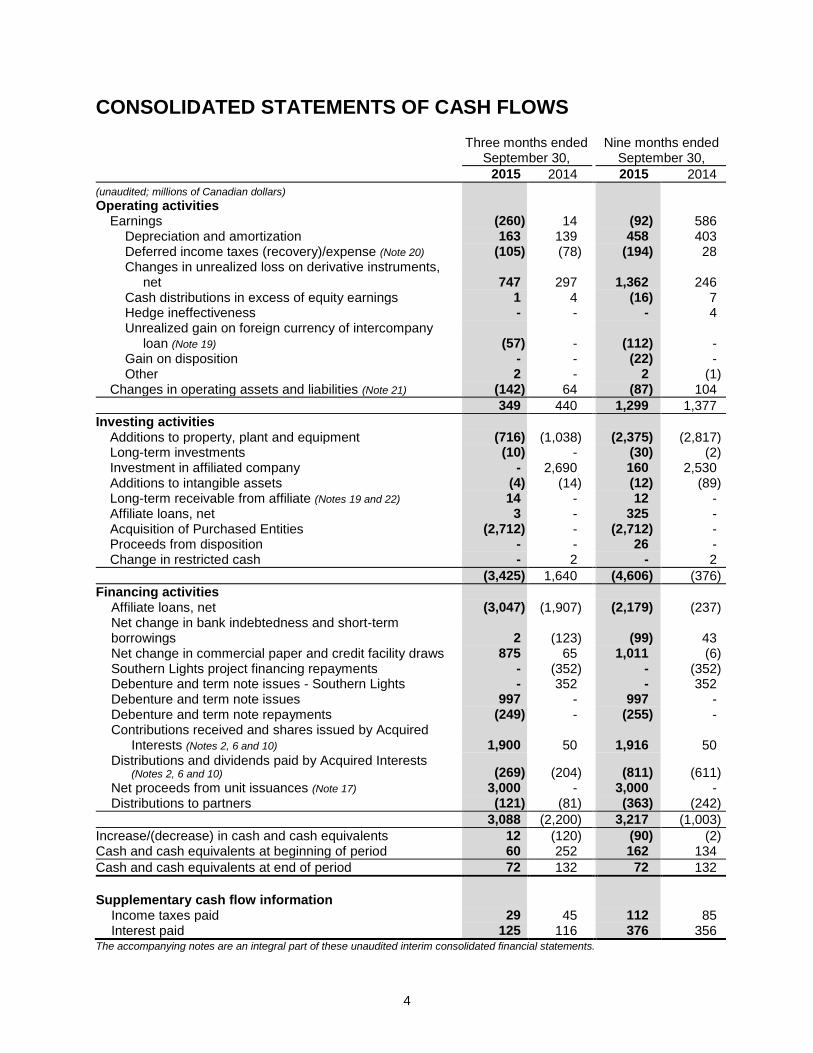
4
CONSOLIDATED STATEMENTS OF CASH FLOWS Three months ended
September 30,
Nine months ended September 30,
2015 2014 2015 2014
(unaudited; millions of Canadian dollars) Operating activities Earnings (260) 14 (92) 586 Depreciation and amortization 163 139 458 403 Deferred income taxes (recovery)/expense (Note 20) (105) (78) (194) 28
Changes in unrealized loss on derivative instruments,
net 747 297
1,362 246 Cash distributions in excess of equity earnings 1 4 (16) 7 Hedge ineffectiveness - - - 4
Unrealized gain on foreign currency of intercompany
loan (Note 19) (57) -
(112) - Gain on disposition - - (22) - Other 2 - 2 (1) Changes in operating assets and liabilities (Note 21) (142) 64 (87) 104
349 440 1,299 1,377
Investing activities Additions to property, plant and equipment (716) (1,038) (2,375) (2,817) Long-term investments (10) - (30) (2) Investment in affiliated company - 2,690 160 2,530 Additions to intangible assets (4) (14) (12) (89) Long-term receivable from affiliate (Notes 19 and 22) 14 - 12 - Affiliate loans, net 3 - 325 - Acquisition of Purchased Entities (2,712) - (2,712) - Proceeds from disposition - - 26 - Change in restricted cash - 2 - 2
(3,425) 1,640 (4,606) (376)
Financing activities Affiliate loans, net (3,047) (1,907) (2,179) (237)
Net change in bank indebtedness and short-term borrowings 2 (123)
(99) 43
Net change in commercial paper and credit facility draws 875 65 1,011 (6) Southern Lights project financing repayments - (352) - (352) Debenture and term note issues - Southern Lights - 352 - 352 Debenture and term note issues 997 - 997 - Debenture and term note repayments (249) - (255) -
Contributions received and shares issued by Acquired
Interests (Notes 2, 6 and 10) 1,900 50
1,916 50
Distributions and dividends paid by Acquired Interests
(Notes 2, 6 and 10) (269) (204)
(811) (611) Net proceeds from unit issuances (Note 17) 3,000 - 3,000 - Distributions to partners (121) (81) (363) (242)
3,088 (2,200) 3,217 (1,003)
Increase/(decrease) in cash and cash equivalents 12 (120) (90) (2) Cash and cash equivalents at beginning of period 60 252 162 134
Cash and cash equivalents at end of period 72 132 72 132
Supplementary cash flow information
Income taxes paid 29 45 112 85 Interest paid 125 116 376 356
The accompanying notes are an integral part of these unaudited interim consolidated financial statements.

5
CONSOLIDATED STATEMENTS OF FINANCIAL POSITION
September 30,
2015 December 31,
2014
(unaudited; millions of Canadian dollars) Assets Current assets
Cash and cash equivalents 72 162 Accounts receivable and other (Note 8) 528 487 Accounts receivable from affiliates 53 41
Loans to affiliates (Note 22) 3 3
656 693 Property, plant and equipment, net (Note 9) 20,573 18,856 Long-term receivable from affiliate (Notes 19 and 22) 804 707 Loans to affiliates (Note 22) - 325 Investment in affiliated company (Notes 19 and 22) 514 160 Long-term investments (Note 10) 516 434 Deferred amounts and other assets (Note 11) 1,472 1,372 Intangible assets, net (Note 12) 134 478 Goodwill 29 29 Deferred income taxes (Note 20) 249 242
24,947 23,296
Liabilities and partners’ capital Current liabilities Bank indebtedness 39 35 Short-term borrowings (Note 14) - 103 Accounts payable and other (Note 13) 981 996 Accounts payable to affiliates 303 93 Distributions payable to affiliates 138 40 Interest payable 52 37 Loans from affiliates (Note 22) 147 8,367 Current maturities of long-term debt (Note 14) 13 264
1,673 9,935 Long-term debt (Note 14) 5,433 3,429 Other long-term liabilities (Note 15) 2,308 1,107 Loans from affiliates (Note 22) 6,301 260 Deferred income taxes (Note 20) 1,260 1,484
16,975 16,215 Commitments and contingencies (Note 23) Class C units (Note 17) 13,580 - Class E unit (Note 17) 475 -
14,055 - Partners’ capital
General partner’s capital (Note 17) (8,541) - Limited partners’ capital (Note 17) - 7,154 Special interest rights (Note 17) 2,565 - Accumulated other comprehensive loss (Note 18) (107) (73)
(6,083) 7,081
24,947 23,296 The accompanying notes are an integral part of these unaudited interim consolidated financial statements.

6
NOTES TO THE INTERIM CONSOLIDATED FINANCIAL STATEMENTS (unaudited)
1. GENERAL BUSINESS DESCRIPTION Enbridge Income Partners LP (EIPLP) is involved in the generation, transportation and storage of energy through interests in its liquids pipelines business, its 50% interest in the Canadian and United States portions of the Alliance Pipeline, which transports natural gas, and its renewable and alternative power generation facilities. EIPLP was formed in 2002. EIPLP is a partnership among Enbridge Income Partners GP (EIPGP), Enbridge Commercial Trust (ECT) and Enbridge Inc. (Enbridge). Enbridge is a North American transporter, distributor and generator of energy. ECT is a wholly-owned investment of Enbridge Income Fund (the Fund). EIPGP is a subsidiary of Enbridge. The unitholders of the Fund are Enbridge Income Fund Holdings Inc. (ENF), a public company listed on the Toronto Stock Exchange (TSX), and Enbridge, a public company listed on the TSX and New York Stock Exchange. EIPGP acts as the general partner with the right to manage, control and operate the businesses of EIPLP. Enbridge also acts as a sponsor to ENF and all of ENF’s direct and indirect subsidiaries, as well as EIPLP. On September 1, 2015, upon closing of the acquisition of the Canadian Liquids Pipelines and certain Canadian renewable energy assets from Enbridge and certain Enbridge subsidiaries (the 2015 Transaction), Enbridge holds an approximate 57% interest in EIPLP with the remaining 43% held by ECT. Additionally, Enbridge now holds a 51% direct interest in EIPGP. EIPLP conducts its business through three business segments: Liquids Pipelines, Gas Pipelines and Green Power. These operating segments are strategic business units established by senior management to facilitate the achievement of EIPLP’s long-term objectives and the objectives of EIPLP’s unitholders, as well as to aid in resource allocation decisions and to assess operational performance. Financing costs, management and administrative costs, current and deferred income taxes and other costs not attributable to specific business segments are presented on a consolidated basis. LIQUIDS PIPELINES Liquids Pipelines consists of common carrier and contract crude oil, natural gas liquids (NGL) and refined products pipelines, feeder pipelines, gathering systems and terminals in Canada, including Canadian Mainline, Regional Oil Sands System, Southern Lights Pipeline, which includes the Canadian portion of Southern Lights (Southern Lights Canada) and Class A units of the United States portion of Southern Lights (Southern Lights US), and Feeder Pipelines and Other. GAS PIPELINES Gas Pipelines includes EIPLP’s 50% interest in both the Canadian and United States portions of the Alliance Pipeline system, which transports liquids-rich natural gas from northeast British Columbia, northwest Alberta and the Bakken area of North Dakota to Channahon, Illinois. GREEN POWER Green Power includes renewable and alternative energy generating facilities, consisting of wind facilities located in Alberta, Ontario, Quebec and Saskatchewan and solar facilities located in Ontario.
2. SUMMARY OF SIGNIFICANT ACCOUNTING POLICIES These consolidated financial statements have been prepared in accordance with accounting principles generally accepted in the United States of America (U.S. GAAP). Amounts are stated in Canadian dollars unless otherwise noted. EIPLP is permitted to use U.S. GAAP as its primary basis of accounting to enable the Fund, a limited partner, to meet its continuous disclosure obligations under an exemption granted by securities regulators in Canada.

7
BASIS OF PRESENTATION AND USE OF ESTIMATES On September 1, 2015, EIPLP acquired 100% interests in the following entities as part of the 2015 Transaction (collectively, the Purchased Entities):
Enbridge Pipelines Inc. (EPI)
Enbridge Pipelines (Athabasca) Inc. (EPAI)
Enbridge Hardisty Storage Inc.
Enbridge Southern Lights GP Inc.
Enbridge Lac Alfred Wind Project GP Inc.
Enbridge Massif du Sud Wind Project GP Inc.
Enbridge Blackspring Ridge I Wind Project GP Inc.
Enbridge Saint Robert Bellarmin Wind Project GP Inc. On November 7, 2014, EIPLP completed a transaction whereby indirect wholly-owned subsidiaries of EIPLP acquired from Enbridge a 50% equity interest in the United States portion of the Alliance Pipeline (Alliance US) and subscribed for and purchased Class A Units of Enbridge subsidiaries which provide a defined cash flow stream from Southern Lights US (the 2014 Transaction). The interests acquired in the 2015 Transaction and 2014 Transaction (collectively, the Acquired Interests) were accounted for as transactions among entities under common control, similar to a pooling of interests, whereby the assets and liabilities acquired were recorded at Enbridge’s historic carrying values. Earnings for the three and nine months ended September 30, 2015 and 2014 report the results of operations of the Acquired Interests as though the acquisitions occurred at the beginning of the earliest period presented in these financial statements. Similarly, comparative information for prior years has been retrospectively adjusted to present the results of operations for EIPLP and the Acquired Interests on a combined basis. See Notes 6 and 10 for additional disclosure regarding the acquisitions of the Purchased Entities and Alliance US, respectively. The preparation of financial statements in conformity with U.S. GAAP requires management to make estimates and assumptions that affect the reported amounts of assets, liabilities, revenues and expenses, as well as the disclosure of contingent assets and liabilities in the consolidated financial statements. Significant estimates and assumptions used in the preparation of the consolidated financial statements include, but are not limited to: carrying values of regulatory assets and liabilities (Note 5); unbilled revenues (Note 8); allowance for doubtful accounts; depreciation rates and carrying value of property, plant and equipment (Note 9); measurement of amortization rates of intangible assets (Note 12); measurement of goodwill; fair value of asset retirement obligations (ARO) (Note 16); fair value of financial instruments (Note
19); provisions for income taxes (Note 20); and commitments and contingencies (Note 23). Actual results
could differ from these estimates. PRINCIPLES OF CONSOLIDATION The consolidated financial statements include the accounts of EIPLP and its subsidiaries for which it is the primary beneficiary. Upon inception of a contractual agreement, EIPLP performs an assessment to determine whether the arrangement contains a variable interest in a legal entity and whether that legal entity is a variable interest entity (VIE). Where EIPLP concludes it is the primary beneficiary of a VIE, it will consolidate the accounts of that entity. The consolidated financial statements also include the accounts of any limited partnerships where EIPLP, based on all facts and circumstances, controls such limited partnerships unless the limited partner has substantive participating rights or substantive kick-out rights. For certain investments where EIPLP retains an undivided interest in assets and liabilities, EIPLP records its proportionate share of assets, liabilities, revenues and expenses. All significant intercompany accounts and transactions are eliminated upon consolidation. Investments and entities over which EIPLP exercises significant influence are accounted for using the equity method. REGULATION Certain of EIPLP’s businesses are subject to regulation by various authorities including, but not limited to, the National Energy Board (NEB), the Federal Energy Regulatory Commission (FERC), the Alberta Energy Regulator, Saskatchewan Ministry of Economy (SME) and Manitoba Mineral Resources. Regulatory bodies exercise statutory authority over matters such as construction, rates and ratemaking and agreements with

8
customers. To recognize the economic effects of the actions of the regulator, the timing of recognition of certain revenues and expenses in these operations may differ from that otherwise expected under U.S. GAAP for non rate-regulated entities. Regulatory assets represent amounts that are expected to be recovered from customers in future periods through rates. Regulatory liabilities represent amounts that are expected to be refunded to customers in future periods through rates. Long-term regulatory assets are recorded in Deferred amounts and other assets and current regulatory assets are recorded in Accounts receivable and other. Long-term regulatory liabilities are included in Other long-term liabilities and current regulatory liabilities are recorded in Accounts payable and other. Regulatory assets are assessed for impairment if EIPLP identifies an event indicative of possible impairment. The recognition of regulatory assets and liabilities is based on the actions, or expected future actions of the regulator. To the extent that the regulator’s actions differ from EIPLP’s expectations, the timing and amount of recovery or settlement of regulatory balances could differ significantly from those recorded. In the absence of rate regulation, EIPLP would generally not recognize regulatory assets or liabilities and the earnings impact would be recorded in the period the expenses are incurred or revenues are earned. A regulatory asset or liability is recognized in respect of deferred income taxes when it is expected the amounts will be recovered or settled through future regulator-approved rates. Allowance for funds used during construction (AFUDC) is included in the cost of property, plant and equipment and is depreciated over future periods as part of the total cost of the related asset. AFUDC includes both an interest component and, if approved by the regulator, a cost of equity component which are both capitalized based on rates set out in a regulatory agreement. In the absence of rate regulation, EIPLP would capitalize interest using a capitalization rate based on its cost of borrowing, whereas the capitalized equity component, the corresponding earnings during the construction phase and the subsequent depreciation would not be recognized. For certain regulated operations to which U.S. GAAP guidance for phase-in plans applies, negotiated depreciation rates recovered in transportation tolls may be less than the depreciation expense calculated in accordance with U.S. GAAP in early years of long-term contracts but recovered in future periods when tolls exceed depreciation. Depreciation expense on such assets is recorded in accordance with U.S. GAAP and no deferred regulatory asset is recorded (Note 5). REVENUE RECOGNITION For businesses that are not rate-regulated, revenues are recorded when products have been delivered or services have been performed, the amount of revenue can be reliably measured and collectability is reasonably assured. Customer credit worthiness is assessed prior to agreement signing as well as throughout the contract duration. Certain Liquids Pipelines revenues are recognized under the terms of committed delivery contracts rather than the cash tolls received. Long-term take-or-pay contracts, under which shippers are obligated to pay fixed amounts ratably over the contract period regardless of volumes shipped, may contain make-up rights. Make-up rights are earned by shippers when minimum volume commitments are not utilized during the period but under certain circumstances can be used to offset overages in future periods, subject to expiry periods. EIPLP recognizes revenues associated with make-up rights at the earlier of when the make-up volume is shipped, the make-up right expires or when it is determined that the likelihood that the shipper will utilize the make-up right is remote. For rate-regulated businesses, revenues are recognized in a manner that is consistent with the underlying agreements as approved by the regulators. From July 1, 2011 onward, Canadian Mainline (excluding Lines 8 and 9) earnings are governed by the Competitive Toll Settlement (CTS), under which revenues are recorded when services are performed. Effective on that date, EIPLP prospectively discontinued the application of rate-regulated accounting for those assets with the exception of flow-through income taxes covered by a specific rate order. DERIVATIVE INSTRUMENTS AND HEDGING Non-qualifying Derivatives Non-qualifying derivative instruments are used primarily to economically hedge foreign exchange, interest rate and commodity price earnings exposure. Non-qualifying derivatives are measured at fair value with

9
changes in fair value recognized in earnings in Transportation and other services revenues, Electricity sales revenue, Commodity costs, Operating and administrative expense, Other income/(expense) and Interest income/(expense). Derivatives in Qualifying Hedging Relationships EIPLP uses derivative financial instruments to manage its exposure to changes in commodity prices, foreign exchange rates and interest rates. Hedge accounting is optional and requires EIPLP to document the hedging relationship and test the hedging item’s effectiveness in offsetting changes in fair values or cash flows of the underlying hedged item on an ongoing basis. EIPLP presents the earnings effects of hedging items with the hedged transaction. Derivatives in qualifying hedging relationships are categorized as cash flow hedges or fair value hedges. Cash Flow Hedges EIPLP uses cash flow hedges to manage its exposure to changes in commodity prices, foreign exchange rates and interest rates. The effective portion of the change in the fair value of a cash flow hedging instrument is recorded in Other comprehensive income/(loss) (OCI) and is reclassified to earnings when the hedged item impacts earnings. Any hedge ineffectiveness is recorded in current period earnings. If a derivative instrument designated as a cash flow hedge ceases to be effective or is terminated, hedge accounting is discontinued and the gain or loss at that date is deferred in OCI and recognized concurrently with the related transaction. If a hedged anticipated transaction is no longer probable, the gain or loss is recognized immediately in earnings. Subsequent gains and losses from derivative instruments for which hedge accounting has been discontinued are recognized in earnings in the period in which they occur. Fair Value Hedges EIPLP may use fair value hedges to hedge the fair value of debt instruments or commodity positions. The change in the fair value of the hedging instrument is recorded in earnings with changes in the fair value of the hedged asset or liability that is designated as part of the hedging relationship. If a fair value hedge is discontinued or ceases to be effective, the hedged asset or liability, otherwise required to be carried at cost or amortized cost, ceases to be remeasured at fair value and the cumulative fair value adjustment to the carrying value of the hedged item is recognized in earnings over the remaining life of the hedged item. EIPLP did not have any fair value hedges at September 30, 2015 or December 31, 2014. Classification of Derivatives EIPLP recognizes the fair market value of derivative instruments on the Consolidated Statements of Financial Position as current and long-term assets or liabilities depending on the timing of the settlements and the resulting cash flows associated with the instruments. Fair value amounts related to cash flows occurring beyond one year are classified as non-current. Cash inflows and outflows related to derivative instruments are classified as Operating activities on the Consolidated Statements of Cash Flows. Balance Sheet Offset Assets and liabilities arising from derivative instruments may be offset in the Consolidated Statements of Financial Position when EIPLP has the legal right and intention to settle them on a net basis. Transaction Costs Transaction costs are incremental costs directly related to the acquisition of a financial asset or the issuance of a financial liability. EIPLP incurs transaction costs primarily through the issuance of debt and classifies these costs as Deferred amounts and other assets. These costs are amortized using the effective interest rate method over the life of the related debt instrument. Transaction costs directly related to business combinations are expensed in the period incurred. EQUITY INVESTMENTS Equity investments over which EIPLP exercises significant influence, but does not have controlling financial interests, are accounted for using the equity method. Equity investments are initially measured at cost and are adjusted for EIPLP’s proportionate share of undistributed equity earnings or loss. Equity

10
investments are increased for contributions made to and decreased for distributions received from the investees. To the extent an equity investee undertakes activities necessary to commence its planned principal operations, EIPLP capitalizes interest costs associated with its investment during such period. INCOME TAXES Pursuant to the Income Tax Act (Canada), EIPLP, as a partnership, is not subject to income taxes. However, subsidiary corporations are taxable and applicable income taxes have been reflected in these consolidated financial statements. The liability method of accounting for income taxes is followed for subsidiary corporations. Deferred income tax assets and liabilities are recorded based on temporary differences between the tax bases of assets and liabilities and their carrying values for accounting purposes. Deferred income tax assets and liabilities are measured using the tax rate that is expected to apply when the temporary differences reverse. For EIPLP’s regulated operations, a deferred income tax liability is recognized with a corresponding regulatory asset to the extent taxes can be recovered through rates. Any interest and/or penalty incurred related to tax is reflected in Income taxes. FOREIGN CURRENCY TRANSACTIONS AND TRANSLATION
Foreign currency transactions are those transactions whose terms are denominated in a currency other
than the currency of the primary economic environment in which EIPLP or a subsidiary operates, referred
to as the functional currency. Transactions denominated in foreign currencies are translated into the
functional currency using the exchange rate prevailing at the date of transaction. Monetary assets and
liabilities denominated in foreign currencies are translated to the functional currency using the rate of
exchange in effect at the balance sheet date. Exchange gains and losses resulting from translation of
monetary assets and liabilities are included in the Consolidated Statements of Earnings in the period in
which they arise. Gains and losses arising from translation of foreign operations’ functional currencies to EIPLP’s Canadian dollar presentation currency are included in the cumulative translation adjustment component of Accumulated other comprehensive income/(loss) (AOCI) and are recognized in earnings upon sale of the foreign operation. Asset and liability accounts are translated at the exchange rates in effect on the balance sheet date, while revenues and expenses are translated using monthly average exchange rates. CASH AND CASH EQUIVALENTS Cash and cash equivalents include short-term investments with a term to maturity of three months or less when purchased. RESTRICTED CASH Cash and cash equivalents that are restricted as to withdrawal or usage, in accordance with specific commercial arrangements, are presented as Restricted cash on the Consolidated Statements of Financial Position. LOANS AND RECEIVABLES Affiliate long-term notes receivable are measured at amortized cost using the effective interest rate method, net of any impairment losses recognized. Accounts receivable and other are measured at cost. Interest income is recognized in earnings as it is earned with the passage of time. ALLOWANCE FOR DOUBTFUL ACCOUNTS Allowance for doubtful accounts is determined based on collection history. When EIPLP has determined that further collection efforts are unlikely to be successful, amounts charged to the allowance for doubtful accounts are applied against the impaired accounts receivable. DEFERRED AMOUNTS AND OTHER ASSETS Deferred amounts and other assets primarily include: costs which regulatory authorities have permitted, or are expected to permit, to be recovered through future rates including deferred income taxes; contractual receivables under the term of long-term delivery contracts; derivative financial instruments;

11
and deferred financing costs. Deferred financing costs are amortized using the effective interest method over the term of the related debt and are recorded in Interest income/(expense). PROPERTY, PLANT AND EQUIPMENT Property, plant and equipment is recorded at historical cost. Expenditures for construction, expansion, major renewals and betterments are capitalized. Maintenance and repair costs are expensed as incurred. Expenditures for project development are capitalized if they are expected to have future benefit. EIPLP capitalizes interest incurred during construction for non rate-regulated assets. For rate-regulated assets, AFUDC is included in the cost of property, plant and equipment and is depreciated over future periods as part of the total cost of the related asset. AFUDC includes both an interest component and, if approved by the regulator, a cost of equity component. Two primary methods of depreciation are utilized. For distinct assets, depreciation is generally provided on a straight-line basis over the estimated useful lives of the assets commencing when the asset is placed in service. For largely homogenous groups of assets with comparable useful lives, the pool method of accounting for property, plant and equipment is followed whereby similar assets are grouped and depreciated as a pool. When those assets are retired or otherwise disposed of, gains and losses are not reflected in earnings but are booked as an adjustment to accumulated depreciation. INTANGIBLE ASSETS Intangible assets consist primarily of certain software costs and power purchase agreements. EIPLP capitalizes costs incurred during the application development stage of internal use software projects. Intangible assets are amortized on a straight-line basis over their expected lives, commencing when the asset is available for use. IMPAIRMENT EIPLP reviews the carrying values of its long-lived assets as events or changes in circumstances warrant. If it is determined that the carrying value of an asset exceeds the undiscounted cash flows expected from the asset, the asset is written down to fair value. With respect to investments in debt and equity securities, EIPLP assesses at each balance sheet date whether there is objective evidence that a financial asset is impaired by completing a quantitative or qualitative analysis of factors impacting the investment. If there is determined to be objective evidence of impairment, EIPLP internally values the expected discounted cash flows using observable market inputs and determines whether the decline below carrying value is other than temporary. If the decline is determined to be other than temporary, an impairment charge is recorded in earnings with an offsetting reduction to the carrying value of the asset. With respect to other financial assets, EIPLP assesses the assets for impairment when it no longer has reasonable assurance of timely collection. If evidence of impairment is noted, EIPLP reduces the value of the financial asset to its estimated realizable amount, determined using discounted expected future cash flows. ASSET RETIREMENT OBLIGATIONS ARO associated with the retirement of long-lived assets are measured at fair value and recognized as Accounts payable and other or Other long-term liabilities in the period in which they can be reasonably determined. The fair value approximates the cost a third party would charge to perform the tasks necessary to retire such assets and is recognized at the present value of expected future cash flows. ARO are added to the carrying value of the associated asset and depreciated over the asset’s useful life. The corresponding liability is accreted over time through charges to earnings and is reduced by actual costs of decommissioning and reclamation. EIPLP’s estimates of retirement costs could change as a result of changes in cost estimates and regulatory requirements. For the majority of EIPLP’s assets, it is not possible to make a reasonable estimate of ARO due to the indeterminate timing and scope of the asset retirements.

12
COMMITMENTS AND CONTINGENCIES Liabilities for commitments and contingencies are recognized when, after fully analyzing available information, EIPLP determines it is either probable that an asset has been impaired, or that a liability has been incurred, and the amount of impairment or loss can be reasonably estimated. When a range of probable loss can be estimated, EIPLP recognizes the most likely amount, or if no amount is more likely than another, the minimum of the range of probable loss is accrued. EIPLP expenses legal costs associated with loss contingencies as such costs are incurred.
3. CHANGES IN ACCOUNTING POLICIES ADOPTION OF NEW STANDARDS Reporting Discontinued Operations and Disclosures of Disposals of Components of an Entity Effective January 1, 2015, EIPLP prospectively adopted Accounting Standards Update (ASU) 2014-08 which changes the criteria and disclosures for reporting discontinued operations. The revised criteria will in general, result in fewer transactions being categorized as discontinued operations. There was no material impact to the consolidated financial statements as a result of adopting this update. Extraordinary and Unusual Items Effective January 1, 2015, EIPLP retrospectively adopted ASU 2015-01 which eliminates the concept of extraordinary items from U.S. GAAP. Entities will no longer be required to separately classify and present extraordinary items in the Consolidated Statements of Earnings. There was no material impact to EIPLP’s consolidated financial statements as a result of adopting this update. FUTURE ACCOUNTING POLICY CHANGES Simplifying the Presentation of Debt Issuance Costs ASU 2015-03 was issued in April 2015 with the intent to simplify the presentation of debt issuance costs. The new standard requires a debt issuance cost related to a recognized debt liability to be presented in the balance sheet as a direct deduction from the carrying amount of that debt liability, as consistent with the presentation of debt discounts or premiums. Further, ASU 2015-15 was issued in August 2015 to clarify the presentation and subsequent measurement of debt issuance costs associated with line-of-credit arrangements, whereby an entity may defer debt issuance costs as an asset and subsequently amortize them over the term of the line-of-credit. The accounting updates are effective for financial statements issued for fiscal years beginning after December 15, 2015 on a retrospective basis. The adoption of the pronouncement is not anticipated to have a material impact on EIPLP’s consolidated financial statements. Amendments to the Consolidation Analysis ASU 2015-02, issued in February 2015, revises the current consolidation guidance which results in a change in the determination of whether an entity consolidates certain types of legal entities. EIPLP is currently assessing the impact of the new standard on its consolidated financial statements. The new standard is effective for annual and interim reporting periods beginning after December 15, 2015 and may be applied on a full or modified retrospective basis. Revenue from Contracts with Customers ASU 2014-09 was issued in May 2014 with the intent of significantly enhancing comparability of revenue recognition practices across entities and industries. The new standard provides a single principles-based, five-step model to be applied to all contracts with customers and introduces new, increased disclosure requirements. EIPLP is currently assessing the impact of the new standard on its consolidated financial statements. In July 2015, the effective date of the new standard was delayed by one year and the new standard is now effective for annual and interim periods beginning on or after December 15, 2017 and may be applied on either a full or modified retrospective basis.

13
Simplifying the Accounting for Measurement-Period Adjustments in Business Combinations ASU 2015-16 was issued in September 2015 with the intent to simplify the accounting for measurement-period adjustments in business combinations. The new standard requires that an acquirer must recognize adjustments to provisional amounts that are identified during the measurement period in the reporting period in which the adjustment amounts are determined. The accounting update is effective for fiscal years beginning after December 15, 2015, including interim periods within those fiscal years and is to be applied on a prospective basis. The adoption of the pronouncement is not anticipated to have a material impact on EIPLP’s consolidated financial statements.
4. SEGMENTED INFORMATION
Three months ended September 30, 2015
Liquids Pipelines
Gas Pipelines
Green Power
Eliminations and Other Consolidated
(millions of Canadian dollars) Revenues 109 - 71 - 180 Operating and administrative (276) - (16) - (292) Depreciation and amortization (136) - (27) - (163)
(303) - 28 - (275) Income/(loss) from equity investments - 40 (1) - 39 Other income/(expense) (54) (9) - 63 -
Earnings/(loss) before interest and taxes (357) 31 27 63 (236) Interest expense (90) Income taxes recovery 66 Special interest rights distributions (14)
Loss attributable to general and limited partners (274)
Additions to property, plant and equipment1 715 - 1 - 716
Three months ended September 30, 2014
Liquids Pipelines
Gas Pipelines
Green Power
Eliminations and Other Consolidated
(millions of Canadian dollars) Revenues 295 - 63 - 358 Operating and administrative (240) - (15) (1) (256) Depreciation and amortization (114) - (25) - (139)
(59) - 23 (1) (37) Income from equity investments - 31 1 - 32 Other income 16 - - 18 34
Earnings/(loss) before interest and taxes (43) 31 24 17 29 Interest expense (66) Income taxes recovery 51
Earnings attributable to general and limited partners 14
Additions to property, plant and equipment1 1,030 - 8 - 1,038
Nine months ended September 30, 2015
Liquids Pipelines
Gas Pipelines
Green Power
Eliminations and Other Consolidated
(millions of Canadian dollars) Revenues 891 - 236 - 1,127 Operating and administrative (767) - (43) - (810) Depreciation and amortization (376) - (82) - (458)
(252) - 111 - (141) Income/(loss) from equity investments - 127 (2) - 125 Other income/(expense) (35) (19) - 131 77
Earnings/(loss) before interest and taxes (287) 108 109 131 61 Interest expense (232) Income taxes recovery 79 Special interest rights distributions (14)
Loss attributable to general and limited partners (106)
Additions to property, plant and equipment1 2,367 - 8 - 2,375
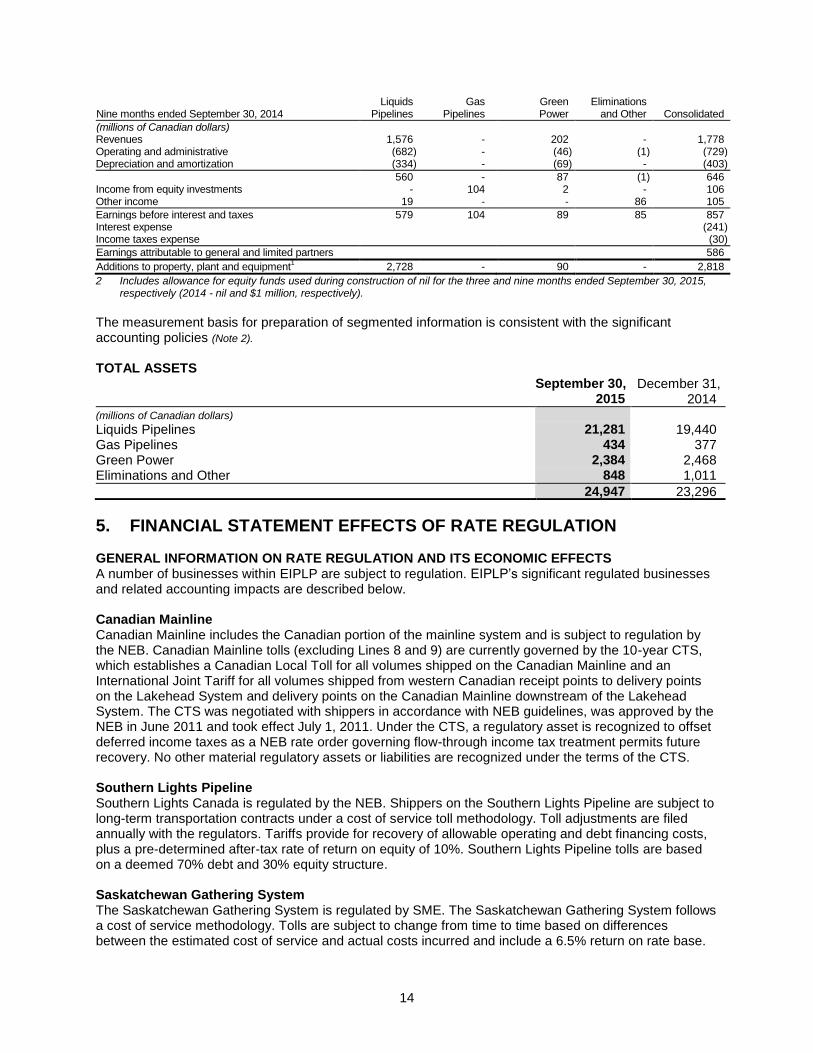
14
Nine months ended September 30, 2014
Liquids Pipelines
Gas Pipelines
Green Power
Eliminations and Other Consolidated
(millions of Canadian dollars) Revenues 1,576 - 202 - 1,778 Operating and administrative (682) - (46) (1) (729) Depreciation and amortization (334) - (69) - (403)
560 - 87 (1) 646 Income from equity investments - 104 2 - 106 Other income 19 - - 86 105
Earnings before interest and taxes 579 104 89 85 857 Interest expense (241) Income taxes expense (30)
Earnings attributable to general and limited partners 586
Additions to property, plant and equipment1 2,728 - 90 - 2,818
2 Includes allowance for equity funds used during construction of nil for the three and nine months ended September 30, 2015, respectively (2014 - nil and $1 million, respectively).
The measurement basis for preparation of segmented information is consistent with the significant accounting policies (Note 2). TOTAL ASSETS
September 30, 2015
December 31, 2014
(millions of Canadian dollars) Liquids Pipelines 21,281 19,440 Gas Pipelines 434 377 Green Power 2,384 2,468 Eliminations and Other
848 1,011
24,947 23,296
5. FINANCIAL STATEMENT EFFECTS OF RATE REGULATION
GENERAL INFORMATION ON RATE REGULATION AND ITS ECONOMIC EFFECTS A number of businesses within EIPLP are subject to regulation. EIPLP’s significant regulated businesses and related accounting impacts are described below. Canadian Mainline Canadian Mainline includes the Canadian portion of the mainline system and is subject to regulation by the NEB. Canadian Mainline tolls (excluding Lines 8 and 9) are currently governed by the 10-year CTS, which establishes a Canadian Local Toll for all volumes shipped on the Canadian Mainline and an International Joint Tariff for all volumes shipped from western Canadian receipt points to delivery points on the Lakehead System and delivery points on the Canadian Mainline downstream of the Lakehead System. The CTS was negotiated with shippers in accordance with NEB guidelines, was approved by the NEB in June 2011 and took effect July 1, 2011. Under the CTS, a regulatory asset is recognized to offset deferred income taxes as a NEB rate order governing flow-through income tax treatment permits future recovery. No other material regulatory assets or liabilities are recognized under the terms of the CTS. Southern Lights Pipeline Southern Lights Canada is regulated by the NEB. Shippers on the Southern Lights Pipeline are subject to long-term transportation contracts under a cost of service toll methodology. Toll adjustments are filed annually with the regulators. Tariffs provide for recovery of allowable operating and debt financing costs, plus a pre-determined after-tax rate of return on equity of 10%. Southern Lights Pipeline tolls are based on a deemed 70% debt and 30% equity structure. Saskatchewan Gathering System The Saskatchewan Gathering System is regulated by SME. The Saskatchewan Gathering System follows a cost of service methodology. Tolls are subject to change from time to time based on differences between the estimated cost of service and actual costs incurred and include a 6.5% return on rate base.
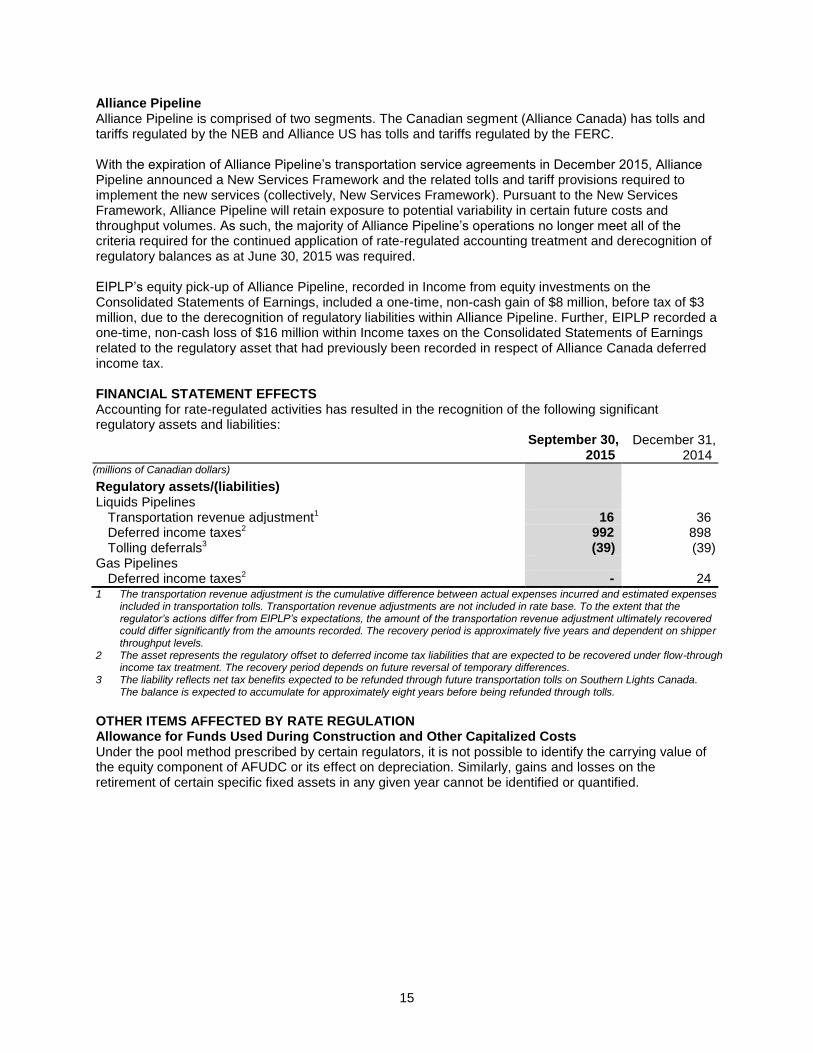
15
Alliance Pipeline Alliance Pipeline is comprised of two segments. The Canadian segment (Alliance Canada) has tolls and tariffs regulated by the NEB and Alliance US has tolls and tariffs regulated by the FERC. With the expiration of Alliance Pipeline’s transportation service agreements in December 2015, Alliance Pipeline announced a New Services Framework and the related tolls and tariff provisions required to implement the new services (collectively, New Services Framework). Pursuant to the New Services Framework, Alliance Pipeline will retain exposure to potential variability in certain future costs and throughput volumes. As such, the majority of Alliance Pipeline’s operations no longer meet all of the criteria required for the continued application of rate-regulated accounting treatment and derecognition of regulatory balances as at June 30, 2015 was required. EIPLP’s equity pick-up of Alliance Pipeline, recorded in Income from equity investments on the Consolidated Statements of Earnings, included a one-time, non-cash gain of $8 million, before tax of $3 million, due to the derecognition of regulatory liabilities within Alliance Pipeline. Further, EIPLP recorded a one-time, non-cash loss of $16 million within Income taxes on the Consolidated Statements of Earnings related to the regulatory asset that had previously been recorded in respect of Alliance Canada deferred income tax. FINANCIAL STATEMENT EFFECTS Accounting for rate-regulated activities has resulted in the recognition of the following significant regulatory assets and liabilities:
September 30,
2015 December 31,
2014 (millions of Canadian dollars) Regulatory assets/(liabilities) Liquids Pipelines
Transportation revenue adjustment1 16 36
Deferred income taxes2 992 898
Tolling deferrals3 (39) (39) Gas Pipelines
Deferred income taxes2 - 24
1 The transportation revenue adjustment is the cumulative difference between actual expenses incurred and estimated expenses included in transportation tolls. Transportation revenue adjustments are not included in rate base. To the extent that the regulator’s actions differ from EIPLP’s expectations, the amount of the transportation revenue adjustment ultimately recovered could differ significantly from the amounts recorded. The recovery period is approximately five years and dependent on shipper throughput levels.
2 The asset represents the regulatory offset to deferred income tax liabilities that are expected to be recovered under flow-through income tax treatment. The recovery period depends on future reversal of temporary differences.
3 The liability reflects net tax benefits expected to be refunded through future transportation tolls on Southern Lights Canada. The balance is expected to accumulate for approximately eight years before being refunded through tolls.
OTHER ITEMS AFFECTED BY RATE REGULATION Allowance for Funds Used During Construction and Other Capitalized Costs Under the pool method prescribed by certain regulators, it is not possible to identify the carrying value of the equity component of AFUDC or its effect on depreciation. Similarly, gains and losses on the retirement of certain specific fixed assets in any given year cannot be identified or quantified.

16
6. ACQUISITIONS PURCHASED ENTITIES On September 1, 2015, EIPLP acquired 100% interests in the Purchased Entities from Enbridge and certain subsidiaries of Enbridge. Consideration was $33.2 billion. The components of the consideration for this acquisition were as follows:
(millions of Canadian dollars, except for unit amounts) Cash1 2,712 Class C units (442,923,363 units at $35.44 per unit) (Note 17) 15,697 Class E unit (Note 17) 475 Special interest rights (1,000 units) (Note 17) 2,565 Long-term debt assumed 11,707
33,156 1 Includes working capital adjustments.
The acquisition of the Purchased Entities was accounted for as a transaction between entities under common control, similar to a pooling of interests, whereby the assets and liabilities of the Purchased Entities were recorded at Enbridge’s historic carrying values, with any difference from consideration paid charged to partners’ capital. The purchase price was recorded as follows:
(millions of Canadian dollars) Cash 37 Accounts receivable and other 426 Accounts receivable from affiliates 13 Property, plant and equipment, net 18,192 Investment in affiliated company (Note 22) 514 Long-term investments 22 Deferred amounts and other assets 1,410 Intangible assets, net 136 Accounts payable and other (912) Accounts payable to affiliates (311) Interest payable (42) Other long-term liabilities (1,970) Loans from affiliates (239) Deferred income taxes (892)
16,384 Excess purchase price over book value of net assets acquired 16,772
Total consideration 33,156
The allocation of the purchase price was based on information available at the time the consolidated financial statements were prepared. Accordingly, the allocation is subject to change and the impact of such changes may be material. Earnings for the three and nine months ended September 30, 2015 and 2014 include the results of the 2015 Transaction as though the acquisition occurred at the beginning of 2014. Similarly, comparative information for the prior years has been retrospectively adjusted to present the results of operations for EIPLP and the Purchased Entities on a combined basis. OTHER ACQUISITIONS In December 2014, EPI, a subsidiary of EIPLP, acquired an incremental 30% interest in the Massif du Sud Wind Project (Massif du Sud) for cash consideration of $102 million, bringing its total interest in the wind project to 80%. EPI acquired its original 50% interest in Massif du Sud in December 2012. EPI’s interest in Massif du Sud represents an undivided interest, with $97 million of the incremental purchase allocated to Property, plant and equipment and the remainder allocated to Intangible assets. Massif du Sud is currently operational and is presented within the Green Power segment.

17
In October 2014, EPI acquired an incremental 17.5% interest in the Lac Alfred Wind Project (Lac Alfred) for cash consideration of $121 million, bringing its total interest in the wind project to 67.5%. EPI acquired its original 50% interest in Lac Alfred in December 2011. EPI’s interest in Lac Alfred represents an undivided interest, with $115 million of the incremental purchase allocated to Property, plant and equipment and the remainder allocated to Intangible assets. Lac Alfred is currently operational and is presented within the Green Power segment.
7. DISPOSITION On May 1, 2015, EIPLP sold certain Virden crude oil pipeline system assets to an unrelated party for proceeds of $26 million before closing costs. The gain on disposition was $22 million, before tax of $3 million, and was presented within Other income/(expense) on the Consolidated Statements of Earnings.
8. ACCOUNTS RECEIVABLE AND OTHER
September 30,
2015 December 31,
2014
(millions of Canadian dollars) Unbilled revenues 160 141 Trade receivables 185 168 Taxes receivables 11 72 Short-term portion of derivative assets (Note 19) 1 1 Inventory 8 5 Prepaid expenses and deposits 77 39 Current deferred income taxes (Note 20) 40 22 Other 46 39
528 487
9. PROPERTY, PLANT AND EQUIPMENT
Weighted Average Depreciation Rate
September 30, 2015
December 31, 2014
(millions of Canadian dollars) Liquids Pipelines
Pipelines 2.6% 10,556 7,763 Pumping equipment, buildings, tanks and other 2.8% 8,228 7,538 Land and right-of-way 3.0% 228 154 Under construction - 3,426 4,955
22,438 20,410 Accumulated depreciation 4,053 3,812
18,385 16,598
Green Power Wind turbines, solar panels and other 3.6% 2,587 2,588 Under construction - 9 1
2,596 2,589 Accumulated depreciation 408 331
2,188 2,258
20,573 18,856
Depreciation expense for the three and nine months ended September 30, 2015 was $151 million and $420 million, respectively (2014 - $130 million and $377 million, respectively).

18
10. LONG-TERM INVESTMENTS
Ownership Interest
September 30, 2015
December 31, 2014
(millions of Canadian dollars) Equity investments Gas Pipelines Alliance Pipeline 50.0% 431 375 Green Power 50.0% 55 59 Other - long-term investments 30 -
516 434
Summarized combined financial information of EIPLP’s interests accounted for under the equity method is as follows: Three months ended
September 30,
Nine months ended September 30,
2015 2014 2015 2014
(millions of Canadian dollars)
Earnings Revenues 117 108 347 324 Operating and administrative expense (34) (36) (102) (97) Depreciation and amortization (29) (26) (86) (79) Other income/(expense) (2) - 7 1 Interest expense (13) (14) (41) (43)
39 32 125 106
September 30,
2015 December 31,
2014
(millions of Canadian dollars)
Current assets 135 120 Property, plant and equipment, net 1,167 1,228 Deferred amounts and other assets 84 15 Current liabilities (151) (228) Long-term debt (730) (683) Other long-term liabilities (19) (18)
Net assets 486 434
Certain assets of Alliance Pipeline are pledged as collateral to Alliance Pipeline’s lenders. On November 7, 2014, EIPLP acquired a 50% equity interest in Alliance US from indirect wholly-owned subsidiaries of Enbridge. The purchase was accounted for as a transaction between entities under common control, similar to a pooling of interests, whereby the investment in Alliance US was recorded at Enbridge’s historic carrying values, with any difference from consideration paid charged to Partners’ capital. The excess of consideration over the historical carrying values is as follows:
November 7, 2014
(millions of Canadian dollars) Equity investment, historical carrying value 205 Deferred income taxes 246 Cumulative translation adjustment (8)
443 Excess purchase price over historical carrying value of net assets acquired 392
Cash consideration 835

19
A deferred income tax asset has been recognized for the future tax consequences of differences between carrying amounts of assets and liabilities and their respective tax bases. The difference between the deferred income tax asset recorded by EIPLP and the historical carrying value of deferred taxes by Enbridge is recorded directly in Partners’ capital within the consolidated financial statements.
11. DEFERRED AMOUNTS AND OTHER ASSETS
September 30, 2015
December 31, 2014
(millions of Canadian dollars) Regulatory assets 1,016 966 Contractual receivables 418 382 Long-term portion of derivative assets (Note 19) 18 17 Deferred financing costs 20 7
1,472 1,372
As at September 30, 2015, deferred amounts of $49 million (December 31, 2014 - $43 million) were subject to amortization and are presented net of accumulated amortization of $21 million (December 31, 2014 - $20 million). Amortization expense for the three and nine months ended September 30, 2015 was nil and $1 million, respectively (nil and $1 million, respectively).
12. INTANGIBLE ASSETS
Weighted Average Accumulated September 30, 2015 Amortization Rate Cost Amortization Net
(millions of Canadian dollars) Software 13.5% 78 37 41 Power purchase agreements 4.0% 72 10 62 Customer lists 4.0% 27 2 25 Other 4.0% 8 2 6
185 51 134
Weighted Average Accumulated December 31, 2014 Amortization Rate Cost Amortization Net
(millions of Canadian dollars) Software 8.8% 497 115 382 Power purchase agreements 4.0% 72 8 64 Customer lists 4.0% 27 2 25 Other 4.0% 8 1 7
604 126 478
Total amortization expense for intangible assets was $11 million and $34 million (2014 - $8 million and $23 million) for the three and nine months ended September 30, 2015, respectively. EIPLP expects amortization expense for intangible assets for the years ending December 31, 2015 through 2019 of $36 million, $9 million, $8 million, $7 million and $7 million, respectively.

20
13. ACCOUNTS PAYABLE AND OTHER
September 30,
2015 December 31,
2014
(millions of Canadian dollars) Operating and accrued liabilities 213 251 Trade payables 136 59 Construction payables 327 355 Deferred revenue 77 97 Current derivative liabilities (Note 19) 8 10 Contractor holdbacks 134 171 Taxes payable 40 - Other 46 53
981 996
14. DEBT
Weighted Average
Interest Rate Maturity September 30,
2015 December 31,
2014
(millions of Canadian dollars) Liquids Pipelines
Debentures 8.2% 2024 200 200 Medium-term notes1
4.6% 2018- 2045 4,067 3,323 Commercial paper and credit
facility draws 1,180 163 Other2 4 9
Green Power Promissory notes3 - 103
Other4 (5) (2)
Total debt 5,446 3,796 Current maturities (13) (264) Short-term borrowings - (103)
Long-term debt 5,433 3,429 1 Included in medium-term notes is $100 million with a maturity date of 2112. 2 Primarily capital lease obligations. 3 A non-interest bearing demand promissory note that was re-paid on January 9, 2015. 4 Primarily debt discount.
For the years ending December 31, 2015 through 2019, debenture and term note maturities are $6 million, $14 million, $16 million, $318 million, $317 million, respectively, and $3,596 million thereafter. EIPLP’s debentures and term notes bear interest at fixed rates and the interest obligations for the years ending December 31, 2015 through 2019 are $205 million, $204 million, $203 million, $193 million and $176 million, respectively. At September 30, 2015 and December 31, 2014, all debt was unsecured. INTEREST EXPENSE Three months ended
September 30,
Nine months ended September 30,
2015 2014 2015 2014
(millions of Canadian dollars)
Debenture and term notes 48 43 138 125 Commercial paper and credit facility draws 3 2 5 10 Interest on loans from affiliated companies (Note 22) 79 77 236 232 Capitalized (40) (56) (147) (126)
90 66 232 241
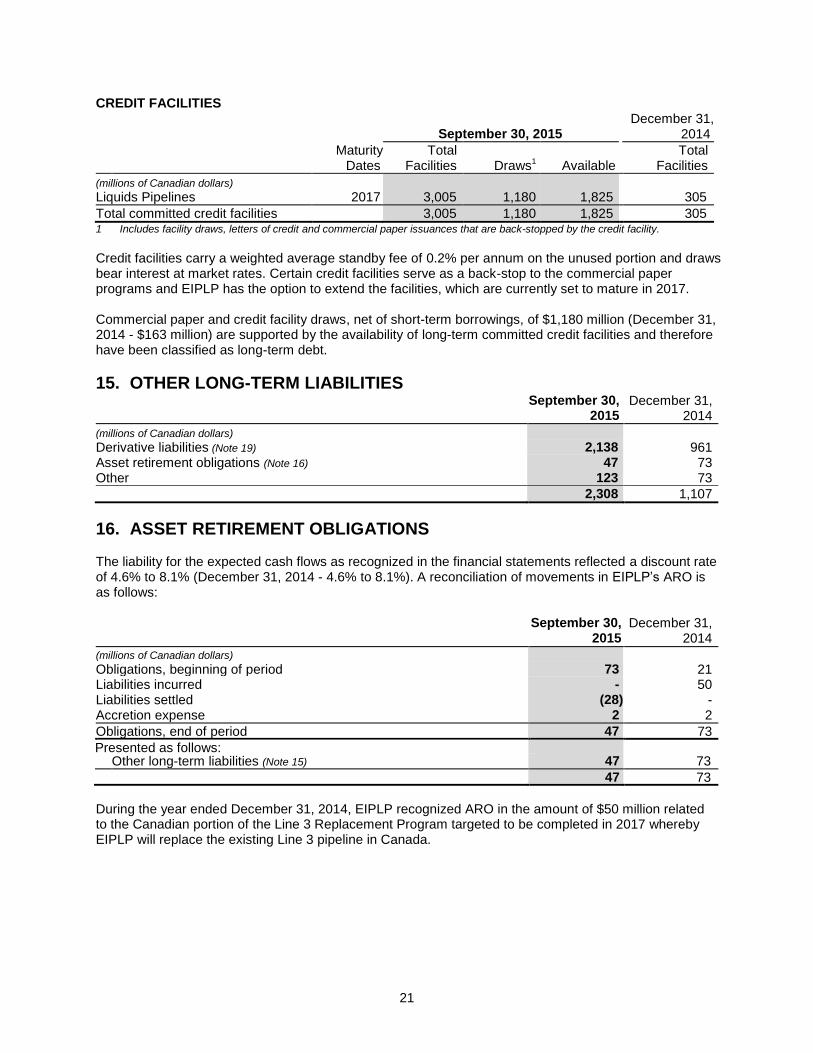
21
CREDIT FACILITIES
September 30, 2015 December 31,
2014
Maturity
Dates
Total Facilities Draws1 Available
Total
Facilities
(millions of Canadian dollars)
Liquids Pipelines
2017 3,005 1,180 1,825 305
Total committed credit facilities
3,005 1,180 1,825 305 1 Includes facility draws, letters of credit and commercial paper issuances that are back-stopped by the credit facility.
Credit facilities carry a weighted average standby fee of 0.2% per annum on the unused portion and draws bear interest at market rates. Certain credit facilities serve as a back-stop to the commercial paper programs and EIPLP has the option to extend the facilities, which are currently set to mature in 2017. Commercial paper and credit facility draws, net of short-term borrowings, of $1,180 million (December 31, 2014 - $163 million) are supported by the availability of long-term committed credit facilities and therefore have been classified as long-term debt.
15. OTHER LONG-TERM LIABILITIES
September 30,
2015 December 31,
2014
(millions of Canadian dollars) Derivative liabilities (Note 19) 2,138 961 Asset retirement obligations (Note 16) 47 73 Other 123 73
2,308 1,107
16. ASSET RETIREMENT OBLIGATIONS The liability for the expected cash flows as recognized in the financial statements reflected a discount rate of 4.6% to 8.1% (December 31, 2014 - 4.6% to 8.1%). A reconciliation of movements in EIPLP’s ARO is as follows:
September 30, 2015
December 31, 2014
(millions of Canadian dollars) Obligations, beginning of period 73 21 Liabilities incurred - 50 Liabilities settled (28) - Accretion expense 2 2
Obligations, end of period 47 73
Presented as follows: Other long-term liabilities (Note 15) 47 73
47 73
During the year ended December 31, 2014, EIPLP recognized ARO in the amount of $50 million related to the Canadian portion of the Line 3 Replacement Program targeted to be completed in 2017 whereby EIPLP will replace the existing Line 3 pipeline in Canada.
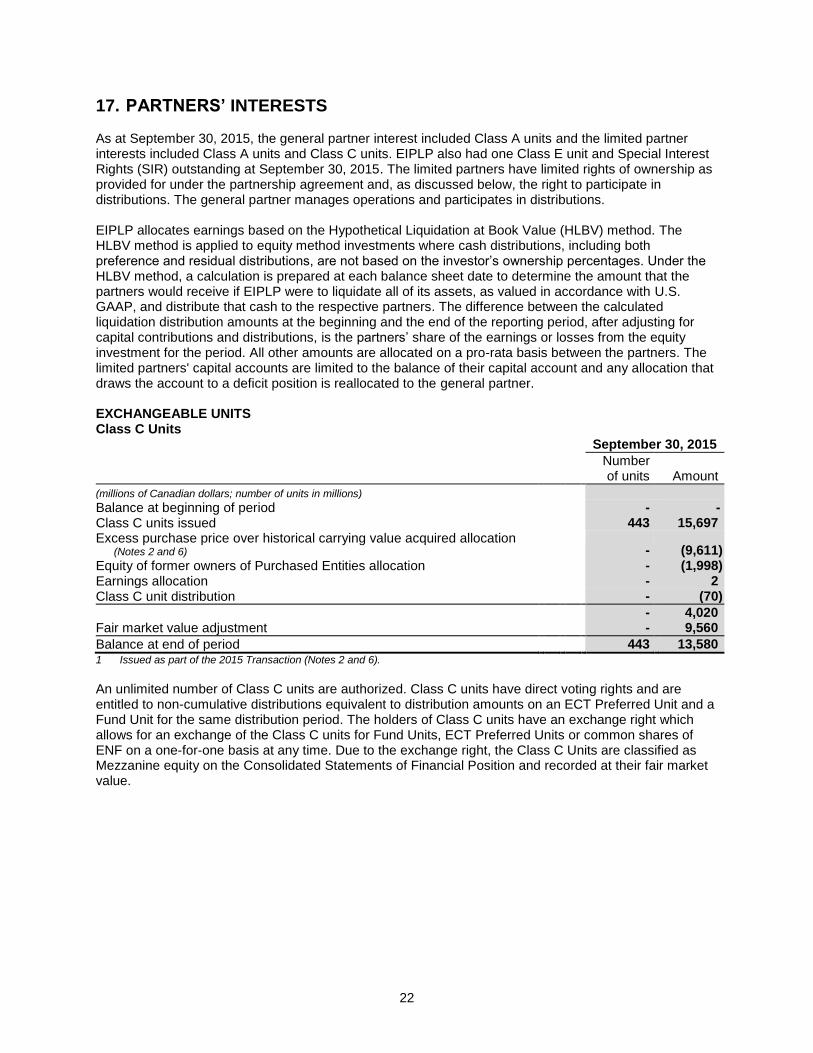
22
17. PARTNERS’ INTERESTS As at September 30, 2015, the general partner interest included Class A units and the limited partner interests included Class A units and Class C units. EIPLP also had one Class E unit and Special Interest Rights (SIR) outstanding at September 30, 2015. The limited partners have limited rights of ownership as provided for under the partnership agreement and, as discussed below, the right to participate in distributions. The general partner manages operations and participates in distributions. EIPLP allocates earnings based on the Hypothetical Liquidation at Book Value (HLBV) method. The HLBV method is applied to equity method investments where cash distributions, including both preference and residual distributions, are not based on the investor’s ownership percentages. Under the HLBV method, a calculation is prepared at each balance sheet date to determine the amount that the partners would receive if EIPLP were to liquidate all of its assets, as valued in accordance with U.S. GAAP, and distribute that cash to the respective partners. The difference between the calculated liquidation distribution amounts at the beginning and the end of the reporting period, after adjusting for capital contributions and distributions, is the partners’ share of the earnings or losses from the equity investment for the period. All other amounts are allocated on a pro-rata basis between the partners. The limited partners' capital accounts are limited to the balance of their capital account and any allocation that draws the account to a deficit position is reallocated to the general partner. EXCHANGEABLE UNITS Class C Units September 30, 2015
Number of units
Amount
(millions of Canadian dollars; number of units in millions) Balance at beginning of period
-
-
Class C units issued 443
15,697 Excess purchase price over historical carrying value acquired allocation
(Notes 2 and 6) -
(9,611) Equity of former owners of Purchased Entities allocation -
(1,998)
Earnings allocation -
2 Class C unit distribution -
(70)
-
4,020 Fair market value adjustment -
9,560
Balance at end of period
443
13,580 1 Issued as part of the 2015 Transaction (Notes 2 and 6).
An unlimited number of Class C units are authorized. Class C units have direct voting rights and are entitled to non-cumulative distributions equivalent to distribution amounts on an ECT Preferred Unit and a Fund Unit for the same distribution period. The holders of Class C units have an exchange right which allows for an exchange of the Class C units for Fund Units, ECT Preferred Units or common shares of ENF on a one-for-one basis at any time. Due to the exchange right, the Class C Units are classified as Mezzanine equity on the Consolidated Statements of Financial Position and recorded at their fair market value.

23
Class E Unit September 30, 2015
Number of units
Amount
(millions of Canadian dollars; except number of units) Balance at beginning of period
-
-
Class E unit issued1 1
475
Balance at end of period
1
475 1 Issued as part of the 2015 Transaction (Notes 2 and 6).
One Class E unit has been authorized and issued. The Class E unit does not receive distributions other than being entitled to receive a distribution amount approximately equal to the after-tax redemption amount of the Enbridge Employee Services Canada Inc. (EESCI) Series A Preferred Shares (Note 22), which will be paid in priority to all other distributions payable upon redemption of the EESCI Series A Preferred Shares. The Class E unit has no voting rights, except in limited circumstances. Due to the redemption feature, the Class E Units are classified as Mezzanine equity on the Consolidated Statement of Financial Position and recorded at their maximum redemption value. NON-EXCHANGEABLE UNITS Class A Units September 30, 2015 December 31, 2014
Number of units
Amount
Number of units
Amount
(millions of Canadian dollars; number of units in millions) Balance at beginning of period
245 5,049 187
3,289
Class A units issued1 85 3,000 58
1,760
Balance at end of period
330 8,049 245
5,049 1 Issued as part of the 2015 Transaction (Notes 2 and 6).
An unlimited number of Class A units are authorized. Class A units have direct voting rights. Class A units’ distributions are equal to the distributable cash less the aggregate of all distributions properly payable on any other class of units and SIR. PREFERENCE RIGHTS Special Interest Rights September 30, 2015
Number of units
Amount
(millions of Canadian dollars; except number of units) Balance at beginning of period
-
-
Special interest rights issued1 1,000
2,565
Balance at end of period
1,000
2,565 1 Issued as part of the 2015 Transaction (Notes 2 and 6).
An unlimited number of SIR are authorized. SIR have no direct voting rights, except in limited circumstances. The holders of SIR are entitled to receive Incentive Distribution Right (IDR) and Temporary Performance Distribution Right (TPDR) distributions in priority to any distributions which are to be paid to holders of any other units, except the Class E unit. SIR distributions are paid in a combination of cash distributions (IDR) and Class D units (TPDR).

24
18. COMPONENTS OF ACCUMULATED OTHER COMPREHENSIVE LOSS Changes in AOCI for the nine months ended September 30, 2015 and 2014 are as follows:
Cash Flow Hedges
Cumulative Translation Adjustment Total
(millions of Canadian dollars)
Balance at January 1, 2015 (81) 8 (73) Other comprehensive income/(loss) retained in AOCI (130) 62 (68) Other comprehensive (income)/loss reclassified to earnings
Interest rate contracts1
3 - 3 Commodity contracts
2 (4) - (4)
(131) 62 (69) Tax impact
Income tax on amounts retained in AOCI
35 - 35 Income tax on amounts reclassified to earnings
- - -
35 - 35
Balance at September 30, 2015 (177) 70 (107)
Cash Flow Hedges
Cumulative Translation Adjustment Total
(millions of Canadian dollars)
Balance at January 1, 2014 39 3 42 Other comprehensive income/(loss) retained in AOCI (129) 5 (124) Other comprehensive (income)/loss reclassified to earnings
Interest rate contracts1
1 - 1 Commodity contracts
2 5 - 5
Foreign exchange contracts3
(1) - (1)
(124) 5 (119) Tax impact
Income tax on amounts retained in AOCI
32 - 32 Income tax on amounts reclassified to earnings
(2) - (2)
30 - 30
Balance at September 30, 2014 (55) 8 (47) 1 Reported within Interest income/(expense) in the Consolidated Statements of Earnings. 2 Reported within Commodity costs in the Consolidated Statements of Earnings. 3 Reported within Other income/(expense) in the Consolidated Statements of Earnings.

25
19. RISK MANAGEMENT AND FINANCIAL INSTRUMENTS MARKET PRICE RISK EIPLP’s earnings, cash flows and OCI are subject to movements in interest rates, foreign exchange rates and commodity prices (collectively, market price risk). Formal risk management policies, processes and systems have been designed to mitigate these risks.
The following summarizes the types of market price risks to which EIPLP is exposed and the risk management instruments used to mitigate them. EIPLP uses a combination of qualifying and non-qualifying derivative instruments to manage the risks noted below. Interest Rate Risk EIPLP’s earnings, cash flows and OCI are exposed to short term interest rate variability due to the regular repricing of its variable rate debt, primarily commercial paper. Pay fixed-receive floating interest rate swaps are used to hedge against the effect of future interest rate movements. EIPLP has implemented a program to significantly mitigate the volatility of short-term interest rates on interest expense through 2019 with the execution of floating to fixed rate interest rate swaps with an average swap rate of 1.4%. EIPLP’s earnings, cash flows and OCI are also exposed to variability in longer term interest rates ahead of anticipated fixed rate debt issuances. Forward starting interest rate swaps are used to hedge against the effect of future interest rate movements. EIPLP has implemented a program to significantly mitigate its exposure to long-term interest rate variability on select forecast term debt issuances through 2019 with the execution of floating to fixed rate interest rate swaps with an average swap rate of 3.1%. EIPLP’s portfolio mix of fixed and variable rate debt instruments is managed at the consolidated Enbridge level. EIPLP does not typically manage the fair value of its debt instruments. Foreign Exchange Risk EIPLP generates certain revenues, incurs expenses, and holds investments and subsidiaries that are denominated in currencies other than Canadian dollars. As a result, EIPLP’s earnings, cash flows and OCI are exposed to fluctuations resulting from foreign exchange rate variability. EIPLP has implemented a policy whereby, at a minimum, it hedges a level of foreign currency denominated cash flow exposures over a five year forecast horizon. A combination of qualifying and non-qualifying derivative instruments is used to hedge anticipated foreign currency denominated revenues and expenses, and to manage variability in cash flows. Commodity Price Risk EIPLP’s earnings, cash flows and OCI are exposed to changes in commodity prices as a result of its ownership interest in certain assets and investments. These commodities include natural gas, crude oil power and NGL. EIPLP employs financial derivative instruments to fix a portion of the variable price exposures that arise from physical transactions involving these commodities. EIPLP may use a combination of qualifying and non-qualifying derivative instruments to manage commodity price risk. TOTAL DERIVATIVE INSTRUMENTS The following table summarizes the Consolidated Statements of Financial Position location and carrying value of EIPLP’s derivative instruments. EIPLP did not have any outstanding fair value hedges as at September 30, 2015 or December 31, 2014. EIPLP generally has a policy of entering into individual International Swaps and Derivatives Association, Inc. agreements, or other similar derivative agreements, with the majority of its derivative counterparties. These agreements provide for the net settlement of derivative instruments outstanding with specific counterparties in the event of bankruptcy or other significant credit event, and would reduce EIPLP’s credit risk exposure on derivative asset positions outstanding with the counterparties in these particular circumstances. The following table also summarizes the maximum potential settlement amount in the event of these specific circumstances. All amounts are presented gross in the Consolidated Statements of Financial Position.

26
September 30, 2015
Derivative Instruments
Used as Cash Flow Hedges
Non-Qualifying Derivative
Instruments
Total Gross Derivative
Instruments as Presented
Amounts Available for
Offset
Total Net Derivative
Instruments
(millions of Canadian dollars)
Accounts receivable and other (Note 8)
Foreign exchange contracts 1 1 2 (1) 1
Interest rate contracts 1 - 1 - 1
Commodity contracts - 10 10 - 10
2 11 131
(1) 12
Deferred amounts and other assets (Note 11)
Foreign exchange contracts 2 - 2 - 2
Interest rate contracts 1 - 1 (1) -
Commodity contracts 13 2 15 (13) 2
16 2 18 (14) 4
Accounts payable and other (Note 13)
Foreign exchange contracts - (356) (356) 1 (355)
Interest rate contracts (2) - (2) - (2)
Commodity contracts - (19) (19) - (19)
(2) (375) (377)2
1 (376)
Other long-term liabilities (Note 15)
Foreign exchange contracts - (1,797) (1,797) - (1,797)
Interest rate contracts (166) - (166) 1 (165)
Commodity contracts - (175) (175) 13 (162)
(166) (1,972) (2,138) 14 (2,124)
Total net derivative asset/(liability)
Foreign exchange contracts 3 (2,152) (2,149) - (2,149)
Interest rate contracts (166) - (166) - (166)
Commodity contracts 13 (182) (169) -
(169)
(150) (2,334) (2,484) - (2,484)
December 31, 2014
Derivative Instruments
Used as Cash Flow Hedges
Non-Qualifying Derivative
Instruments
Total Gross Derivative
Instruments as Presented
Amounts Available for
Offset
Total Net Derivative
Instruments
(millions of Canadian dollars)
Accounts receivable and other (Note 8)
Foreign exchange contracts - 2 2 (2) -
Interest rate contracts - - - - -
Commodity contracts - 16 16 - 16
- 18 181 (2) 16
Deferred amounts and other assets (Note 11)
Foreign exchange contracts 1 - 1 - 1
Interest rate contracts - - - - -
Commodity contracts 14 2 16 (14) 2
15 2 17 (14) 3
Accounts payable and other (Note 13)
Foreign exchange contracts - (101) (101) 2 (99)
Interest rate contracts (51) - (51) - (51)
Commodity contracts - (12) (12) - (12)
(51) (113) (164)2 2 (162)
Other long-term liabilities (Note 15)
Foreign exchange contracts - (703) (703) - (703)
Interest rate contracts (82) - (82) - (82)
Commodity contracts - (176) (176) 14 (162)
(82) (879) (961) 14 (947)
Total net derivative asset/(liability)
Foreign exchange contracts 1 (802) (801) - (801)
Interest rate contracts (133) - (133) - (133)
Commodity contracts 14 (170) (156) - (156)
(118) (972) (1,090) - (1,090)
1 Reported within Accounts receivable and other (2015 - $1 million; 2014 - $1 million) and Accounts receivable from affiliates (2015 - $12 million; 2014 - $17 million) on the Consolidated Statements of Financial Position.
2 Reported within Accounts payable and other (2015 - $8 million; 2014 - $10 million) and Accounts payable to affiliates (2015 - $369 million; 2014 - $154 million) on the Consolidated Statements of Financial Position.

27
The following table summarizes the maturity and notional principal or quantity outstanding related to EIPLP’s derivative instruments. September 30, 2015 2015 2016 2017 2018 2019 Thereafter
Interest rate contracts - short-term borrowings (millions of Canadian dollars) 166 1,702 1,502 511 36 242
Interest rate contracts - long-term debt (millions of Canadian dollars) - 780 560 610 200 - Foreign exchange contracts - United States dollar forwards - sell
(millions of United States dollars) 665 1,470 1,564 2,008 1,807 2,211 Foreign exchange contracts - United States dollar forwards -
purchase (millions of United States dollars) 110 2 2 2 2 2
Commodity contracts - power (megawatt hours (MWH)) 32 40 40 30 31 (23)
December 31, 2014 2015 2016 2017 2018 2019 Thereafter
Interest rate contracts - short-term borrowings (millions of Canadian dollars) 107 178 114 151 28 242
Interest rate contracts - long-term debt (millions of Canadian dollars) 730 420 210 - - - Foreign exchange contracts - United States dollar forwards - sell
(millions of United States dollars) 1,415 1,312 1,564 2,008 1,807 2,211 Foreign exchange contracts - United States dollar forwards -
purchase (millions of United States dollars) 94 2 2 2 2 2 Foreign exchange contracts - Euro forwards - purchase
(millions of Euros) 1 - - - - -
Commodity contracts - power (MWH) 22 40 40 31 31 1
The Effect of Derivative Instruments on the Statements of Earnings and Comprehensive Income The following table presents the effect of cash flow hedges on EIPLP’s consolidated earnings and consolidated comprehensive income, before the effect of income taxes. Three months ended
September 30,
Nine months ended September 30,
2015 2014 2015 2014
(millions of Canadian dollars)
Amount of unrealized gains/(loss) recognized in OCI Cash flow hedges
Foreign exchange contracts 2 1 2 1 Interest rate contracts 10 (25) (36) (120) Commodity contracts 10 (2) 3 (5)
22 (26) (31) (124)
Amount of gains/(loss) reclassified from AOCI to earnings (effective portion)
Foreign exchange contracts2
- - - (1) Interest rate contracts
1 1 1 3 2
Commodity contracts3
(1) - (4) -
- 1 (1) 1
Amount of gains/(loss) reclassified from AOCI to earnings (ineffective portion and amount excluded from effectiveness testing)
Interest rate contracts1
1 (1) - (1) Commodity contracts
3 - 1 - 5
1 - - 4 1 Reported within Interest income/(expense) in the Consolidated Statements of Earnings. 2 Reported within Transportation and other services revenues and Other income/(expense) in the Consolidated Statements of
Earnings. 3 Reported within Electricity sales revenues, Commodity costs and Other income/(expense) in the Consolidated Statements of
Earnings. EIPLP estimates that $1 million of AOCI related to cash flow hedges will be reclassified to earnings in the next 12 months. Actual amounts reclassified to earnings depend on the interest rates, foreign exchange rates and commodity prices in effect when derivative contracts that are currently outstanding mature. For all forecasted transactions, the maximum term over which EIPLP is hedging exposures to the variability of cash flows is 51 months at September 30, 2015.

28
Non-Qualifying Derivatives The following table presents the unrealized gains and losses associated with changes in the fair value of EIPLP’s non-qualifying derivatives. Three months ended
September 30,
Nine months ended September 30,
2015 2014 2015 2014
(millions of Canadian dollars)
Foreign exchange contracts1 (741) (301) (1,350) (243)
Commodity contracts2 (9) 4 (12) (3)
Total unrealized derivative fair value loss (750) (297) (1,362) (246) 1 Reported within Transportation and other services revenues (2015 - $1,256 million loss; 2014 - $256 million loss) and Other
income/(expense) (2015 - $94 million loss; 2014 - $13 million gain) in the Consolidated Statements of Earnings. 2 Reported within Transportation and other services revenues (2015 - $6 million loss; 2014 - $3 million gain), Operating and
administrative expense (2015 - $6 million loss; 2014 - $6 million loss) in the Consolidated Statements of Earnings.
LIQUIDITY RISK Liquidity risk is the risk EIPLP will not be able to meet its financial obligations, including commitments (Note 23) and guarantees (Note 24), as they become due. In order to manage this risk, EIPLP forecasts cash requirements over the near and long term to determine whether sufficient funds will be available when required. EIPLP generates cash from operations, commercial paper issuances and credit facility draws, through the periodic issuance of public term debt and issuance of units to its unitholders and general partner. Additionally, to ensure ongoing liquidity and to mitigate the risk of market disruption, EIPLP maintains a level of committed bank credit facilities. In addition, to ensure adequate liquidity, EIPLP actively manages its bank funding sources to optimize pricing and other terms. Additional liquidity, if necessary, is expected to be available through intercompany transactions with Enbridge or other related entities. CREDIT RISK Entering into derivative financial instruments may result in exposure to credit risk. Credit risk arises from the possibility that a counterparty will default on its contractual obligations. In order to mitigate this risk, EIPLP enters into risk management transactions primarily with institutions that possess investment grade credit ratings. Credit risk relating to derivative counterparties is mitigated by credit exposure limits and contractual requirements, frequent assessment of counterparty credit ratings and netting arrangements. EIPLP had group credit concentrations and maximum credit exposure, with respect to derivative instruments, in the following counterparty segments:
September 30,
2015 December 31,
2014
(millions of Canadian dollars) Canadian financial institutions 1 1 European financial institutions 1 - Other1 17 20
19 21 1 Other is comprised of primarily Enbridge and its affiliates.
Derivative assets are adjusted for non-performance risk of EIPLP’s counterparties using their credit default swap spread rates, and are reflected in the fair value. For derivative liabilities, EIPLP’s non-performance risk is considered in the valuation. Credit risk also arises from trade and other long-term receivables, and is mitigated through credit exposure limits, contractual requirements, assessment of credit ratings and netting arrangements. Generally, EIPLP classifies and provides for receivables older than 30 days as past due. The maximum exposure to credit risk related to non-derivative financial assets is their carrying value. FAIR VALUE MEASUREMENTS EIPLP’s financial assets and liabilities measured at fair value on a recurring basis include derivative instruments. EIPLP also discloses the fair value of other financial instruments not measured at fair value.
29
The fair value of financial instruments reflects EIPLP’s best estimates of market value based on generally accepted valuation techniques or models and are supported by observable market prices and rates. When such values are not available, EIPLP uses discounted cash flow analysis from applicable yield curves based on observable market inputs to estimate fair value. FAIR VALUE OF FINANCIAL INSTRUMENTS EIPLP categorizes its financial instruments measured at fair value into one of three different levels depending on the observability of the inputs employed in the measurement. Level 1 Level 1 includes derivatives measured at fair value based on unadjusted quoted prices for identical assets and liabilities in active markets that are accessible at the measurement date. An active market for a derivative is considered to be a market where transactions occur with sufficient frequency and volume to provide pricing information on an ongoing basis. EIPLP does not have any financial instruments valued using Level 1 inputs. Level 2 Level 2 includes derivative valuations determined using directly or indirectly observable inputs other than quoted prices included within Level 1. Derivatives in this category are valued using models or other industry standard valuation techniques derived from observable market data. Such valuation techniques include inputs such as quoted forward prices, time value, volatility factors and broker quotes that can be observed or corroborated in the market for the entire duration of the derivative. Derivatives valued using Level 2 inputs include non-exchange traded derivatives such as over-the-counter foreign exchange forward contracts and interest rate swaps for which observable inputs can be obtained. EIPLP has also categorized the fair value of its investment in affiliated company and long-term debt as Level 2. The fair value is based on quoted market prices for instruments of similar yield, credit risk and tenor. Level 3 Level 3 includes derivative valuations based on inputs which are less observable, unavailable or where the observable data does not support a significant portion of the derivatives' fair value. Generally, Level 3 derivatives are longer dated transactions, occur in less active markets, occur at locations where pricing information is not available or have no binding broker quote to support Level 2 classification. EIPLP has developed methodologies, benchmarked against industry standards, to determine fair value for these derivatives based on extrapolation of observable future prices and rates. Derivatives valued using Level 3 inputs include long-dated derivative power contracts, basis swaps, commodity swaps, power and energy swaps, options and long-dated commodity derivative contracts. EIPLP uses the most observable inputs available to estimate the fair value of its derivatives. When possible, EIPLP estimates the fair value of its derivatives based on quoted market prices. If quoted market prices are not available, EIPLP uses estimates from third party brokers. For non-exchange traded derivatives classified in Levels 2 and 3, EIPLP uses standard valuation techniques to calculate the estimated fair value. These methods include discounted cash flows for forwards and swaps and Black-Scholes-Merton pricing models for options. Depending on the type of derivative and nature of the underlying risk, EIPLP uses observable market prices (interest, foreign exchange and commodity) and volatility as primary inputs to these valuation techniques. Finally, EIPLP considers its own credit default swap spread as well as the credit default swap spreads associated with its counterparties in its estimation of fair value.

30
Fair Value of Derivatives EIPLP has categorized its derivative assets and liabilities measured at fair value as follows:
September 30, 2015 Level 1 Level 2 Level 3
Total Gross Derivative
Instruments
(millions of Canadian dollars) Financial assets Current derivative assets Foreign exchange contracts - 2 - 2 Interest rate contracts - 1 - 1 Commodity contracts - 10 - 10
- 13 - 13
Long-term derivative assets Foreign exchange contracts - 2 - 2 Interest rate contracts - 1 - 1 Commodity contracts - 2 13 15
- 5 13 18
Financial liabilities Current derivative liabilities Foreign exchange contracts - (356) - (356) Interest rate contracts - (2) - (2) Commodity contracts - - (19) (19)
- (358) (19) (377)
Long-term derivative liabilities Foreign exchange contracts - (1,797) - (1,797) Interest rate contracts - (166) - (166) Commodity contracts - - (175) (175)
- (1,963) (175) (2,138)
Total net financial asset/(liability) Foreign exchange contracts - (2,149) - (2,149) Interest rate contracts - (166) - (166) Commodity contracts - 12 (181) (169)
- (2,303) (181) (2,484)

31
December 31, 2014 Level 1 Level 2 Level 3
Total Gross Derivative
Instruments
(millions of Canadian dollars) Financial assets Current derivative assets Foreign exchange contracts - 2 - 2 Interest rate contracts - - - - Commodity contracts - 16 - 16
- 18 - 18
Long-term derivative assets Foreign exchange contracts - 1 - 1 Interest rate contracts - - - - Commodity contracts - 1 15 16
- 2 15 17
Financial liabilities Current derivative liabilities Foreign exchange contracts - (101) - (101) Interest rate contracts - (51) - (51) Commodity contracts - - (12) (12)
- (152) (12) (164)
Long-term derivative liabilities Foreign exchange contracts - (703) - (703) Interest rate contracts - (82) - (82) Commodity contracts - - (176) (176)
- (785) (176) (961)
Total net financial asset/(liability) Foreign exchange contracts - (801) - (801) Interest rate contracts - (133) - (133) Commodity contracts - 17 (173) (156)
- (917) (173) (1,090)
The significant unobservable inputs used in fair value measurement of Level 3 derivative instruments were as follows:
September 30, 2015 Fair value Unobservable
Input Minimum
Price Maximum
Price
Weighted Average
Price
Unit of
Measurement
(fair value in millions of Canadian dollars) Commodity contracts - financial
1
Power (181) Forward power price 34.00 75.22 53.12 $/MWH
1 Financial and physical forward commodity contracts are valued using a market approach valuation technique.
If adjusted, the significant unobservable inputs disclosed in the table above would have a direct impact on the fair value of EIPLP’s Level 3 derivative instruments. The significant unobservable inputs used in the fair value measurement of Level 3 derivative instruments include forward commodity prices and, for option contracts, price volatility. Changes in forward commodity prices could result in significantly different fair values for EIPLP’s Level 3 derivatives. Changes in price volatility would change the value of the option contracts. Generally speaking, a change in the estimate of forward commodity prices is unrelated to a change in the estimate of price volatility.

32
Changes in net fair value of derivative assets and liabilities classified as Level 3 in the fair value hierarchy were as follows: Nine months ended September 30, 2015 2014
(millions of Canadian dollars) Level 3 net derivative liability at beginning of period (174) (172) Total loss, unrealized Included in earnings1 (6) (5) Included in OCI (1) (4) Settlements - -
Level 3 net derivative liability at end of period (181) (181) 2 Reported within Transportation and other services revenues, Commodity costs and Operating and administrative expense in
the Consolidated Statements of Earnings.
EIPLP’s policy is to recognize transfers as at the last day of the reporting period. There were no transfers between levels as at September 30, 2015 and 2014. Fair Value of Other Financial Instruments EIPLP has restricted investments held in trust totalling $31 million as at September 30, 2015 (December 31, 2014 - nil). At September 30, 2015, EIPLP’s long-term debt had a carrying value of $5,446 million (December 31, 2014 - $3,693 million) and a fair value of $5,824 million (December 31, 2014 - $4,216 million). At September 30, 2015, EPI, a subsidiary of EIPLP, had an investment of $514 million (December 31, 2014 - nil) in non-voting, redeemable Series A Preferred Shares in EESCI (Note 22). EIPLP has classified these investments in affiliated company as available-for-sale debt securities and carries them at fair value, with changes in fair value recorded in OCI. As at September 30, 2015, the fair value of these investments approximates their cost and redemption value. EIPLP holds Class A Units of Southern Lights Holdings, L.L.C., which is an indirect wholly-owned subsidiary of Enbridge, providing defined, scheduled and fixed distributions that represent the equity cash flows derived from the core rate base of Southern Lights US until June 30, 2040. At September 30, 2015, EIPLP’s investment had a carrying value of $821 million (December 31, 2014 - $719 million) included in Long-term receivable from affiliate and Accounts receivable from affiliates on the Consolidated Statements of Financial Position and a fair value of $805 million (December 31, 2014 - $719 million).

33
20. INCOME TAXES INCOME TAX RATE RECONCILIATION Three months ended
September 30,
Nine months ended September 30,
2015 2014 2015 2014
(millions of Canadian dollars)
Earnings/(loss) before income taxes (326) (37) (171) 616 Federal statutory income tax rate 15% 15% 15% 15%
Expected federal taxes at statutory rate (49) (6) (26) 92 Increase/(decrease) resulting from:
Provincial and state income taxes
(51) (37) (70) (26) Foreign and other statutory rate differentials1 6 7 18 15 Effects of rate-regulated accounting
29 (20) (6) (55)
Part VI.1 tax, net of federal Part I deduction2 14 11 41 32 Deductible dividends
- (2) - (10)
Unremitted Foreign subsidiary earnings 3 - 4 - Earnings in non-taxable entities (10) (5) (28) (16) Non-taxable portion of capital gains and losses (4) - (10) - Other3
(4) 1 (2) (2)
Income taxes/(recovery) on earnings (66) (51) (79) 30
Effective income tax rate 20.2% 137.8% 46.2% 4.9% 1 The effective income tax rate for 2014 reflected the increase in earnings in EIPLP’s United States operations and the higher
United States federal statutory rate over the Canadian federal statutory rate. 2 Represents Part VI.1 tax on preference share dividend distributions, net of an allowed federal deduction. 3 Included in Other are miscellaneous permanent differences that generally represent less than 5% of expected tax expense.
These include the federal tax effect of items such as deductible state taxes, meals and entertainment and other similar non-deductible expenses.
COMPONENTS OF PRETAX EARNINGS AND INCOME TAXES Three months ended Nine months ended September 30, September 30,
2015 2014 2015 2014
(millions of Canadian dollars) Earnings/(loss) before income taxes Canada (355) (55) (260) 559 United States 29 18 89 57
(326) (37) (171) 616
Current income taxes Canada 40 21 114 (15) United States (1) 6 1 17
39 27 115 2
Deferred income taxes Canada (110) (79) (222) 22 United States 5 1 28 6
(105) (78) (194) 28
Income taxes/(recovery) on earnings (66) (51) (79) 30

34
COMPONENTS OF DEFERRED INCOME TAXES Deferred tax assets and liabilities are recognized for the future tax consequences of differences between carrying amounts of assets and liabilities and their respective tax bases. Major components of deferred income tax assets and liabilities are as follows:
September 30,
2015 December 31,
2014
(millions of Canadian dollars) Deferred income tax liabilities
Property, plant and equipment (1,255) (1,063) Investments (289) (212) Regulatory assets (257) (220) Deferred revenue (117) (119) Other - -
Total deferred income tax liabilities (1,918) (1,614)
Deferred income tax assets Financial instruments 657 258 Asset retirement obligations 19 18 Loss carryforwards 246 103 Other 21 15
Total deferred income tax assets 943 394
Net deferred income tax liabilities (975) (1,220)
Presented as follows: Assets
Accounts receivable and other (Note 8) 40 22 Deferred income taxes 249 242
Total deferred income tax assets 289 264 Liabilities
Accounts payable and other (4) - Deferred income taxes (1,260) (1,484)
Total deferred income tax liabilities (1,264) (1,484)
Net deferred income tax liabilities (975) (1,220)
As at September 30, 2015, EIPLP recognized the benefit of unused tax loss carryforwards of $911 million (December 31, 2014 - $404 million) in Canada which expire in 2033 to 2035.
EIPLP and its subsidiaries are subject to taxation in Canada and the United States. The material jurisdictions in which EIPLP is subject to potential examinations are within Canada (Federal, Alberta, Ontario and Quebec) and the United States (Federal, Illinois, Iowa, Minnesota, North Dakota and Wisconsin). EIPLP is open to examination by certain Canadian tax authorities for the 2010 to 2014 tax years and by certain United States tax authorities for the 2014 tax year. EIPLP is currently under examination for income tax matters in Canada for the 2011 and 2012 taxation years. UNRECOGNIZED TAX BENEFITS EIPLP has no unrecognized tax benefits related to uncertain tax positions as at September 30, 2015 and no accrued interest or penalties thereon.

35
21. CHANGES IN OPERATING ASSETS AND LIABILITIES Three months ended Nine months ended September 30, September 30,
2015 2014 2015 2014
(millions of Canadian dollars) Accounts receivable and other (27) 1 (21) 62 Accounts receivable from affiliates (23) 24 (12) 17 Deferred amounts and other assets (23) 4 (27) 2 Accounts payable and other (212) (30) (346) (59) Accounts payable to affiliates 73 50 210 72 Interest payable 15 13 15 12 Other long-term liabilities 55 2 94 (2)
(142) 64 (87) 104
22. RELATED PARTY TRANSACTIONS All related party transactions are entered into in the normal course of business and, unless otherwise noted, are measured at the exchange amount, which is the amount of consideration established and agreed to by the related parties. Affiliates refer to Enbridge and companies that are either directly or indirectly owned by Enbridge. The acquisition of the Purchased Entities and equity investment in Alliance US were accounted for as transactions among entities under common control. See Notes 6 and 10, respectively, for additional disclosure. GENERAL PARTNER EIPGP is the general partner of EIPLP and has a 0.01% interest in the Class A Units of EIPLP. As at September 30, 2015, Enbridge holds a 51% direct interest in EIPGP. Per the Limited Partnership Agreement, EIPGP has the right to manage, control and operate the businesses of EIPLP. EIPGP delegates the execution of certain of its powers to Enbridge Management Services Inc., a wholly-owned subsidiary of Enbridge, who administers EIPLP. INTERCORPORATE SERVICES On August 2, 2015 all Canadian employees of EPI and EPAI were transferred to an affiliated company which assumed all employment related obligations, commitments and liabilities. The related net pension and other postemployment benefit liability as well as the related unamortized losses recorded in AOCI, were not included in the retrospective consolidated financial statements as EIPLP has elected to recognize required contributions for the period as net pension costs without reflecting related plan benefit obligations and plan assets. Earnings for the three and nine months ended September 30, 2015 include pension related costs of $6 million and $45 million respectively compared with $12 million and $36 million for the three and nine months ended September 30, 2014. As at September 30, 2015, EIPLP and its subsidiaries do not have any employees and receives services from affiliates for managing and operating the business. These services, which are charged at cost in accordance with service agreements or which reflect normal commercial trade terms, totalled $71 million and $129 million for the three and nine months ended September 30, 2015, respectively (2014 - $22 million and $67 million, respectively). EIPLP provides certain operational services to affiliates. These services, which are charged at cost in accordance with service agreements or which reflect normal commercial trade terms, totalled $46 million and $159 million for the three and nine months ended September 30, 2015, respectively (2014 - $54 million and $158 million, respectively).

36
LIQUIDS PIPELINES EIPLP has contracts with shippers who are also affiliates of EIPLP through common ownership interests of Enbridge. Revenues from affiliates, which reflect normal commercial trade terms, totalled $24 million and $52 million for the three and nine months ended September 30, 2015, respectively (2014 - $6 million and $24 million, respectively). GAS PIPELINES Alliance Pipeline has contracts with shippers that are also affiliates of EIPLP through common ownership interests of Enbridge. EIPLP’s share of Alliance Pipeline’s revenues from affiliates for the three and nine months ended September 30, 2015 was $14 million and $40 million, respectively (2014 - $13 million and $37 million, respectively). LONG-TERM RECEIVABLE FROM AFFILIATE Long-term receivable from affiliate includes the carrying value of Class A Units of Southern Lights Holdings, L.L.C., which is an indirect wholly-owned subsidiary of Enbridge. At September 30, 2015, $804 million (December 31, 2014 - $707 million) is included in Long-term receivable from affiliate and $17 million (December 31, 2014 - $12 million) is included in Accounts receivable from affiliates. Interest income of $16 million and $45 million for the three and nine months ended September 30, 2015, respectively (2014 - nil and nil, respectively), has been recorded within Other income - affiliates on the Consolidated Statements of Earnings. INVESTMENT IN AFFILIATED COMPANY As at September 30, 2015, EIPLP had an investment of $514 million in 500,000 non-voting, redeemable Series A Preferred Shares of EESCI. These Preferred Shares entitle EIPLP to receive annual dividends through 2021. EESCI has the option to redeem the outstanding Preferred Shares at any time. EIPLP is also entitled to require redemption of these Preferred Shares at any time. INTERCORPORATE LOANS AND BALANCES Loans to Affiliates The following loans to affiliates are evidenced by formal loan agreements. Interest rates for short-term loans are based on the applicable short-term LIBOR for the United States dollar loans and Canadian Depository Offering Rate for the Canadian dollar loans. September 30, 2015 December 31, 2014
Maturity
Weighted Average Interest
Rate
Amount
Weighted Average Interest
Rate
Amount
(millions of Canadian dollars) Affiliate Current 12.0% 3 12.0% 3 Enbridge - - - 7.9% 325
3 328 Current portion of loans to affiliates (3) (3)
- 325

37
Loans from Affiliates The following loans from affiliates are evidenced by formal loan agreements: September 30, 2015 December 31, 2014
Maturity
Weighted Average Interest
Rate
Amount
Weighted Average Interest
Rate
Amount
(millions of Canadian dollars) Enbridge 2020-2064 4.6% 4,191 - - Enbridge 2025 4.0% 624 - - Affiliate Current 1.8% 105 2.4% 216 Affiliate Current 4.3% 42 4.3% 31 Affiliate 2020 7.1% 100 7.1% 100 Affiliate 2045 4.0% 734 - - Affiliate 2045 4.0% 652 - - Enbridge - - - 3.3% 3,463 Enbridge - - - 4.8% 3,307 Enbridge - - - 7.2% 160 Affiliate - - - 1.6% 634 Affiliate - - - 1.5% 487 Affiliate - - - 3.5% 229
6,448 8,627 Current portion of loans from affiliates (147) (8,367)
6,301 260
Loans from affiliates’ maturities remaining for the year ending December 31, 2015 are $147 million, nil for each of the years ending December 31, 2016 through 2019, and $600 million for the year ending December 31, 2020. These loans are subordinate to senior, unsecured debt. The affiliate loan interest obligations remaining for the year ending December 31, 2015 are $86 million, $280 million for each of the years ending December 31, 2016 through 2019, and $261 million for the year ending December 31, 2020. As at September 30, 2015, EIPLP had a net hedge payable balance of $2,380 million (December 31, 2014 - $1,023 million net payable) to affiliates in respect of derivative instruments that the affiliates entered into on EIPLP’s behalf. These amounts are recorded in Accounts receivable from affiliates, Deferred amounts and other assets, Accounts payable to affiliates and Other long-term liabilities on the Consolidated Statements of Financial Position.
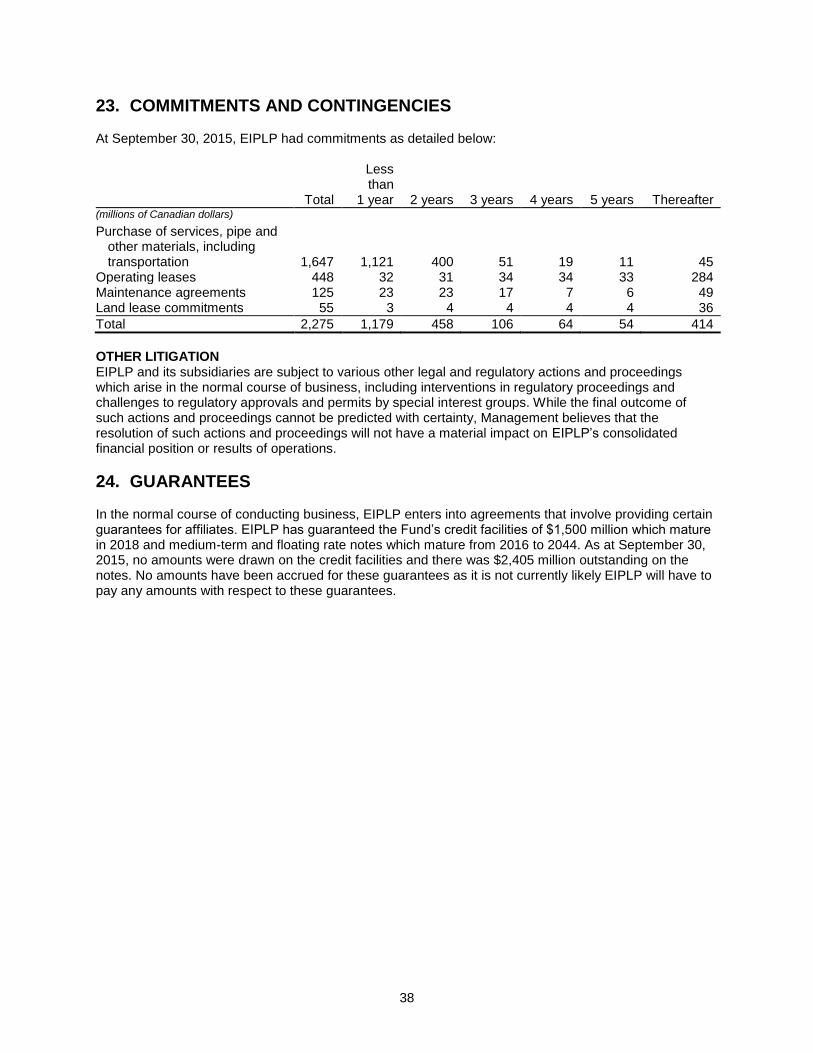
38
23. COMMITMENTS AND CONTINGENCIES At September 30, 2015, EIPLP had commitments as detailed below:
Total
Less than
1 year 2 years 3 years 4 years 5 years Thereafter (millions of Canadian dollars) Purchase of services, pipe and
other materials, including transportation 1,647 1,121 400 51 19 11 45
Operating leases 448 32 31 34 34 33 284 Maintenance agreements 125 23 23 17 7 6 49 Land lease commitments 55 3 4 4 4 4 36
Total 2,275 1,179 458 106 64 54 414
OTHER LITIGATION EIPLP and its subsidiaries are subject to various other legal and regulatory actions and proceedings which arise in the normal course of business, including interventions in regulatory proceedings and challenges to regulatory approvals and permits by special interest groups. While the final outcome of such actions and proceedings cannot be predicted with certainty, Management believes that the resolution of such actions and proceedings will not have a material impact on EIPLP’s consolidated financial position or results of operations.
24. GUARANTEES In the normal course of conducting business, EIPLP enters into agreements that involve providing certain guarantees for affiliates. EIPLP has guaranteed the Fund’s credit facilities of $1,500 million which mature in 2018 and medium-term and floating rate notes which mature from 2016 to 2044. As at September 30, 2015, no amounts were drawn on the credit facilities and there was $2,405 million outstanding on the notes. No amounts have been accrued for these guarantees as it is not currently likely EIPLP will have to pay any amounts with respect to these guarantees.