Embed Size (px)
Citation preview
ENBRIDGE INCOME PARTNERS LP
MANAGEMENT’S DISCUSSION AND ANALYSIS
December 31, 2017
1
GLOSSARY Adjusted EBITDA Adjusted earnings before interest, income taxes and depreciation and
amortization ASU Accounting Standards Update bpd Barrels per day Canadian L3R Program Canadian portion of the Line 3 Replacement Program CTS Competitive Toll Settlement DCF Distributable cash flow EBITDA Earnings before interest, income taxes and depreciation and
amortization ECT Enbridge Commercial Trust EEP Enbridge Energy Partners, L.P. EIPLP Enbridge Income Partners LP Enbridge Enbridge Inc. EPI Enbridge Pipelines Inc. IDR Incentive Distribution Right IJT International Joint Tariff MD&A Management's Discussion and Analysis MNPUC Minnesota Public Utilities Commission MW Megawatts NEB National Energy Board NGL Natural gas liquids OCI Other comprehensive income OPEC Organization of Petroleum Exporting Countries PPA(s) Power purchase agreement(s) SIR Special Interest Rights Southern Lights US The United States portion of Southern Lights Pipeline the Fund Enbridge Income Fund the Fund Group The Fund, ECT, EIPLP and the subsidiaries and investees of EIPLP the Manager or EMSI Enbridge Management Services Inc. TPDR Temporary Performance Distribution Right U.S. GAAP Generally accepted accounting principles in the United States of America WCSB Western Canadian Sedimentary Basin

2
MANAGEMENT’S DISCUSSION AND ANALYSIS This Management’s Discussion and Analysis (MD&A) dated February 16, 2018 should be read in conjunction with the audited consolidated financial statements and notes thereto of Enbridge Income Partners LP for the year ended December 31, 2017, prepared in accordance with generally accepted accounting principles in the United States of America (U.S. GAAP). All financial measures presented in this MD&A are expressed in Canadian dollars, unless otherwise indicated. Enbridge Income Partners LP supplements Enbridge Income Fund’s (the Fund) financial statements and MD&A, and additional information related to Enbridge Income Partners LP is available under the Fund’s profile on SEDAR at www.sedar.com. Effective January 1, 2018, Enbridge Income Partners LP revised its segmented information presentation on a retrospective basis to align with current changes in reporting to the Chief Operating Decision Maker in assessing Enbridge Income Partners LP's performance and making decisions on allocation of resources to the segments. Enbridge Income Partners LP changed its profit measure to Earnings before interest, income taxes and depreciation and amortization (EBITDA) from its previous measure of Earnings before interest and income taxes. OVERVIEW The terms “we,” “our,” “us” and “EIPLP” as used in this MD&A refer to Enbridge Income Partners LP unless the context suggests otherwise. EIPLP was formed in 2002, and we are involved in the generation, transportation and storage of energy through our interests in our liquids pipelines business, including the Canadian Mainline and the Regional Oil Sands System, our 50% interest in the Alliance Pipeline, which transports natural gas from Canada to the United States, and our renewable and alternative power generation assets. EIPLP is a member of the Fund Group, which also includes Enbridge Commercial Trust (ECT) and the Fund. We hold all of the underlying operating entities of the Fund Group through our subsidiaries and investees. Enbridge Inc. (Enbridge), through its wholly-owned subsidiary, Enbridge Management Services Inc. (the Manager or EMSI), is responsible for the operations and day-to-day management of the Fund Group. The Manager also provides administrative and general support services to the Fund Group. The limited partners of EIPLP are ECT and Enbridge and certain of its subsidiaries. We conduct our business through three business segments: Liquids Pipelines, Gas Pipelines and Green Power. LIQUIDS PIPELINES Liquids Pipelines consists of common carrier and contract pipelines, feeder pipelines and gathering systems that transport crude oil, natural gas liquids (NGL) and terminals in Canada, including Canadian Mainline, Regional Oil Sands System, Southern Lights Pipeline, which includes the Canadian portion of Southern Lights Pipeline (Southern Lights Canada) and Class A units of certain Enbridge subsidiaries which provide a defined cash flow stream (Southern Lights Class A units) from the United States portion of Southern Lights Pipeline (Southern Lights US), Bakken Expansion Pipeline and Feeder Pipelines and Other. GAS PIPELINES Gas Pipelines includes our 50% interest in the Alliance Pipeline system, which transports liquids-rich natural gas from northeast British Columbia, northwest Alberta and the Bakken area of North Dakota to Channahon, Illinois.
3
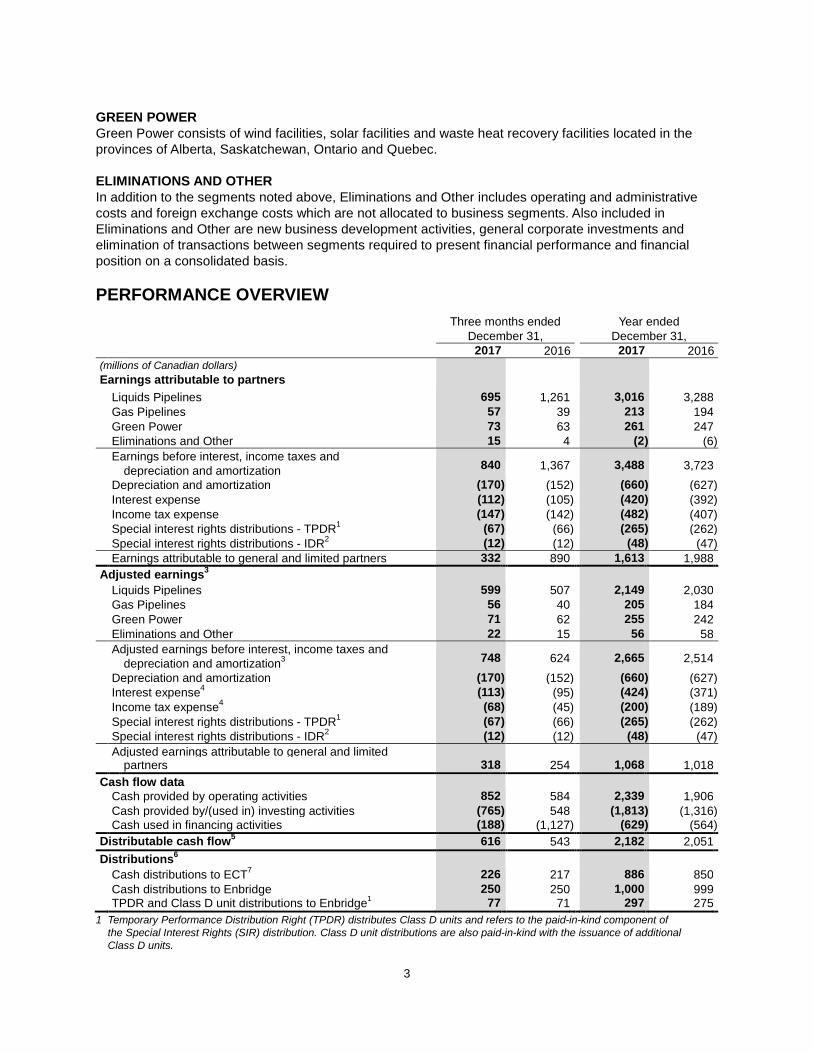
GREEN POWER Green Power consists of wind facilities, solar facilities and waste heat recovery facilities located in the provinces of Alberta, Saskatchewan, Ontario and Quebec. ELIMINATIONS AND OTHER In addition to the segments noted above, Eliminations and Other includes operating and administrative costs and foreign exchange costs which are not allocated to business segments. Also included in Eliminations and Other are new business development activities, general corporate investments and elimination of transactions between segments required to present financial performance and financial position on a consolidated basis. PERFORMANCE OVERVIEW Three months ended Year ended December 31, December 31, 2017 2016 2017 2016 (millions of Canadian dollars) Earnings attributable to partners Liquids Pipelines 695 1,261 3,016 3,288 Gas Pipelines 57 39 213 194 Green Power 73 63 261 247 Eliminations and Other 15 4 (2 ) (6 )
Earnings before interest, income taxes and
depreciation and amortization 840
1,367 3,488
3,723
Depreciation and amortization (170 ) (152 ) (660 ) (627 ) Interest expense (112 ) (105 ) (420 ) (392 ) Income tax expense (147 ) (142 ) (482 ) (407 ) Special interest rights distributions - TPDR1 (67 ) (66 ) (265 ) (262 ) Special interest rights distributions - IDR2 (12 ) (12 ) (48 ) (47 ) Earnings attributable to general and limited partners 332 890 1,613 1,988 Adjusted earnings3 Liquids Pipelines 599 507 2,149 2,030 Gas Pipelines 56 40 205 184 Green Power 71 62 255 242 Eliminations and Other 22 15 56 58
Adjusted earnings before interest, income taxes and
depreciation and amortization3 748
624 2,665
2,514
Depreciation and amortization (170 ) (152 ) (660 ) (627 ) Interest expense4 (113 ) (95 ) (424 ) (371 ) Income tax expense4 (68 ) (45 ) (200 ) (189 ) Special interest rights distributions - TPDR1 (67 ) (66 ) (265 ) (262 ) Special interest rights distributions - IDR2 (12 ) (12 ) (48 ) (47 ) Adjusted earnings attributable to general and limited partners 318 254 1,068 1,018 Cash flow data Cash provided by operating activities 852 584 2,339 1,906 Cash provided by/(used in) investing activities (765 ) 548 (1,813 ) (1,316 ) Cash used in financing activities (188 ) (1,127 ) (629 ) (564 ) Distributable cash flow5 616 543 2,182 2,051 Distributions6 Cash distributions to ECT7 226 217 886 850 Cash distributions to Enbridge 250 250 1,000 999 TPDR and Class D unit distributions to Enbridge1 77 71 297 275
1 Temporary Performance Distribution Right (TPDR) distributes Class D units and refers to the paid-in-kind component of the Special Interest Rights (SIR) distribution. Class D unit distributions are also paid-in-kind with the issuance of additional Class D units.
4
2 Incentive Distribution Right (IDR) refers to the cash component of the SIR distribution (see Liquidity and Capital Resources – Sources and Uses of Cash – Distributions).
3 Adjusted earnings before interest, income taxes and depreciation and amortization (Adjusted EBITDA) and adjusted earnings are non-GAAP measures that do not have any standardized meaning prescribed by U.S. GAAP. For more information on non-GAAP measures, refer to page 8.
4 These balances are presented net of adjusting items. 5 Distributable cash flow (DCF) is defined as adjusted EBITDA further adjusted for distributions from investments in excess of/(less
than) equity earnings, less deductions for maintenance capital expenditures, interest expense, applicable taxes and other adjusting items. For further information on DCF, refer to Performance Overview – Distributable Cash Flow. DCF is a non-GAAP measure that does not have any standardized meaning prescribed by U.S. GAAP – see Non-GAAP Measures.
6 Refer to Liquidity and Capital Resources – Sources and Uses of Cash – Distributions for distribution rates. 7 Amounts do not include the one-time Class A unit distribution of $264 million paid in December 2016 following the close of the
disposition of the South Prairie Region assets. EARNINGS ATTRIBUTABLE TO GENERAL AND LIMITED PARTNERS Earnings attributable to general and limited partners were $1,613 million for 2017 compared with $1,988 million in 2016. Fourth quarter earnings attributable to general and limited partners were $332 million for 2017 compared with $890 million in 2016. The comparability of our earnings were impacted by a number of unusual, non-recurring or non-operating factors that are listed in the Non-GAAP Reconciliation tables and discussed in the results for each reporting segment. Details of unusual, non-recurring or non-operating factors impacting the comparability of our earnings attributable to general and limited partners year-over-year include:
• net unrealized derivative gains for Canadian Mainline of $841 million in 2017 ($612 million after-tax) compared with $467 million ($331 million after-tax) in 2016. Financial derivative instruments are used to hedge exposure to fluctuations in foreign exchange rates, power costs and the price of allowance oil that are inherent in the Competitive Toll Settlement (CTS), which drives Canadian Mainline revenue. We have a comprehensive long-term economic hedging program to mitigate interest rate, foreign exchange and commodity price risks that create volatility in short-term earnings through the recognition of unrealized non-cash gains and losses on financial derivative instruments used to hedge these risks. Over the long term, we believe our hedging program supports reliable cash flows;
• a $52 million deferred tax expense as a result of the federal corporate income tax rate change due to the United States "Tax Cuts and Jobs Act" (TCJA) enacted in December 2017;
• a $47 million charge ($35 million after-tax) for costs incurred to bring pipelines and facilities back into service following the northeastern Alberta wildfires in the second quarter of 2016; and
• an $850 million gain ($731 million after-tax) within our Liquids Pipelines segment related to the disposition of the South Prairie Region assets in December 2016.
Within our asset portfolio, we hold investments that are subject to the United States TCJA enacted on December 22, 2017. Substantially all of the provisions of the United States TCJA are effective for taxation years beginning after December 31, 2017. The TCJA includes significant changes to the Internal Revenue Code of 1986, including amendments which significantly change the taxation of individuals and business entities, and includes specific provisions related to regulated public utilities. Under U.S. GAAP, the tax effects of changes in tax laws must be recognized in the period in which the law is enacted, or December 22, 2017 for the TCJA. The most significant change included in the United States TCJA with respect to our audited consolidated financial statements was a reduction in the corporate federal income tax rate from 35% to 21%, resulting in a $52 million deferred tax expense discussed above. We expect that our cash flows will be positively impacted by a higher Canadian Mainline International Joint Tariff (IJT) Residual Benchmark Toll as a result of the tax rate reduction’s expected impact on Enbridge Energy Partners, L.P.'s (EEP) income tax allowance component of the tolls in its Federal Energy Regulatory Commission (FERC) regulated cost-of-service based Facility Surcharge Mechanism projects.
5
Excluding the impact of unusual, non-recurring or non-operating factors, factors impacting our earnings attributable to general and limited partners year-over-year primarily include:
• stronger performance from the Canadian Mainline within our Liquids Pipelines segment in 2017, primarily due to capacity optimization initiatives implemented in 2017 that significantly reduced heavy crude oil apportionment allowing incremental heavy crude oil barrels to be shipped and a higher Canadian Mainline IJT Residual Benchmark Toll;
• an increase in seasonal firm service revenue in 2017 at Alliance Pipeline within our Gas Pipelines segment; and
• stronger contributions from our Green Power segment due to stronger wind resources in the second and fourth quarters of 2017; partially offset by
• an increase in interest expense due to higher levels of debt outstanding in 2017 as well as lower capitalized interest; and
• higher income tax expense reflecting an increase in earnings before income taxes in 2017 after adjusting for the unusual, non-recurring factors discussed above, specifically the gain on the South Prairie Region assets disposition in December 2016.
Refer to Performance Overview – Adjusted Earnings Attributable to General and Limited Partners and the results of operations for each reporting segment for further discussion. Fourth quarter performance factors were largely consistent with the year-to-date trends discussed above. Factors unique to the fourth quarters include the tax impact of the United States TCJA enacted in December 2017 and the before-tax gain of $850 million related to the disposition of the South Prairie Region assets in December 2016. ADJUSTED EARNINGS ATTRIBUTABLE TO GENERAL AND LIMITED PARTNERS Adjusted earnings attributable to general and limited partners were $1,068 million for 2017 compared with $1,018 million in 2016. Fourth quarter adjusted earnings attributable to general and limited partners were $318 million for 2017 compared with $254 million in 2016. Factors increasing our adjusted earnings attributable to general and limited partners year-over-year include:
• higher Canadian Mainline revenues due to increases in the Canadian Mainline IJT Residual Benchmark Toll from US$1.47 to US$1.62 in April 2017, which was further increased to US$1.64 in July 2017;
• strengthened Canadian Mainline throughput driven by growing oil sands production in western Canada along with capacity optimization initiatives implemented in 2017, partially offset by lower throughput in the second quarter of 2017 due to an unexpected outage and accelerated maintenance at a customer’s upstream facility;
• lower throughput in the second quarter of 2016 due to the impacts of the northeastern Alberta wildfires; and
• additional revenue generated on the Regional Oil Sands System due to new projects that went into service in 2017.
The positive factors above were partially offset by:
• a lower foreign exchange hedge rate used to record United States dollar denominated Canadian Mainline revenues in 2017. The IJT Benchmark Toll and its components are set in United States dollars, and the majority of our foreign exchange risk on Canadian Mainline revenues is hedged;
• an increase in interest expense due to higher levels of debt outstanding in 2017 as well as lower capitalized interest; and
• higher income tax expense, reflecting the increase in adjusted earnings before income taxes in 2017.
6
Fourth quarter performance factors were largely consistent with the year-to-date trends discussed above. CASH FLOWS Cash provided by operating activities was $2,339 million for 2017 compared with $1,906 million in 2016. Cash used in investing activities was $1,813 million for 2017 compared with $1,316 million in 2016. Cash used in financing activities was $629 million for 2017 compared with $564 million in 2016. Fourth quarter cash provided by operating activities was $852 million for 2017 compared with $584 million in 2016. Fourth quarter cash used in investing activities was $765 million for 2017 compared with cash provided by financing activities of $548 million in 2016. Fourth quarter cash used in financing activities was $188 million for 2017 compared with $1,127 million in 2016. Factors impacting our cash flows year-over-year primarily include:
• an increase in cash provided by operating activities driven by the operating factors discussed under Adjusted Earnings Attributable to General and Limited Partners, most notably stronger contributions from our Liquids Pipelines segment in 2017;
• an increase in cash used in investing activities due to proceeds of $1.08 billion received in December 2016 from the disposition of the South Prairie Region assets, partially offset by lower capital expenditures required to execute our growth capital program in 2017;
• an increase in cash used in financing activities, which primarily reflects a decrease in cash received from term notes issuances by Enbridge Pipelines Inc. (EPI) and affiliate loan issuances in 2017, which was partially offset by an increase in credit facility draws and lower total distributions to partners; and
• an impact in both 2017 and 2016 due to our issuance of Class A units to ECT for gross proceeds of $718 million in each of December 2017 and April 2016.
Refer to Liquidity and Capital Resources – Sources and Uses of Cash for further discussion. Fourth quarter cash flow factors were largely consistent with the year-to-date trends discussed above. Factors unique to the fourth quarters include our disposition of the South Prairie Region assets along with the one-time Class A unit distribution to ECT of $264 million in December 2016 and our issuance of Class A units to ECT for gross proceeds of $718 million in December 2017. DISTRIBUTABLE CASH FLOW DCF represents cash available to fund distributions on Class A and Class C units, as well as for debt repayments and reserves. Such reserves are determined by the Manager and are used for payment of committed charges, such as interest and income taxes, and for execution of the capital maintenance program. Our DCF was $2,182 million for 2017 compared with $2,051 million in 2016. Fourth quarter DCF was $616 million for 2017 compared with $543 million in 2016. Factors impacting our DCF year-over-year include:
• stronger contributions from our Liquids Pipelines segment due to a higher Canadian Mainline IJT Residual Benchmark Toll and higher liquids pipelines throughput as a result of capacity optimization initiatives implemented in 2017, which was partially offset by an unexpected outage and accelerated maintenance at a customer’s upstream facility in the second quarter of 2017; and
• lower maintenance capital expenditures in 2017 due to the timing of maintenance activities; partially offset by
• higher interest expense due to an increase in debt outstanding in 2017; and • higher current income taxes due to an increase in adjusted earnings before income taxes in 2017.
7
Fourth quarter DCF factors were largely consistent with the year-to-date trends discussed above. DISTRIBUTIONS Distributions to partners are declared monthly and paid in the following month. Monthly distributions declared to partners increased in 2017 compared with 2016, which excludes the one-time distribution to ECT of $264 million in 2016 following the disposition of the South Prairie Region assets. Factors impacting our monthly distributions to partners year-over-year primarily include:
• a higher distribution rate for Class A units in 2017 as well as additional Class A units outstanding
to ECT following the December 2017 and April 2016 issuances; and • additional Class D units outstanding in 2017 due to the monthly distributions that are paid-in-kind.
Refer to Liquidity and Capital Resources – Sources and Uses of Cash – Distributions for more details on distributions. FORWARD-LOOKING INFORMATION Forward-looking information, or forward-looking statements, have been included in this MD&A to provide information about EIPLP and EIPLP’s subsidiaries and affiliates, including management’s assessment of EIPLP’s plans and operations. This information may not be appropriate for other purposes. Forward-looking statements are typically identified by words such as “anticipate”, “expect”, “project”, “estimate”, “forecast”, “plan”, “intend”, “target”, “believe”, “likely” and similar words suggesting future outcomes or statements regarding an outlook. Forward-looking information or statements included or incorporated by reference in this document include, but are not limited to, statements with respect to the following: earnings/(loss) or adjusted earnings/(loss); EBITDA or adjusted EBITDA; effect of the increase or decrease of the Canadian Mainline IJT Residual Benchmark Toll on adjusted EBITDA; DCF; cash flows; distributions and policy; costs related to announced projects and projects under construction; in-service dates for announced projects and projects under construction; capital expenditures; recovery of the costs of the Canadian portion of the Line 3 Replacement Program (Canadian L3R Program) through the use of surcharges; actions of regulators; commodity prices; supply forecasts; impact of hedging program; impact of the Canadian L3R Program on existing integrity programs; outcome of proceedings in respect of the Canadian L3R Program; and sources of liquidity and sufficiency of financial resources. Although EIPLP believes these forward-looking statements are reasonable based on the information available on the date such statements are made and processes used to prepare the information, such statements are not guarantees of future performance and readers are cautioned against placing undue reliance on forward-looking statements. By their nature, these statements involve a variety of assumptions, known and unknown risks and uncertainties and other factors, which may cause actual results, levels of activity and achievements to differ materially from those expressed or implied by such statements. Material assumptions include assumptions about the following: supply of and demand for crude oil, natural gas, NGL and renewable energy; prices of crude oil, natural gas, NGL and renewable energy; exchange rates; inflation; Canadian pipeline export capacity; levels of competition; interest rates; availability and price of labor and construction materials; operational reliability; customer and regulatory approvals; maintenance of support and regulatory approvals for EIPLP’s projects (including the Canadian L3R Program); anticipated in-service dates; weather; credit ratings; capital project funding; anticipated refinancing of debt upon maturity; potential acquisitions, dispositions or other strategic transactions; earnings/(loss) or adjusted earnings/(loss); EBITDA or adjusted EBITDA; cash flows and DCF; and distributions. Assumptions regarding the expected supply of and demand for crude oil, natural gas, NGL and renewable energy, and the prices of these commodities, are material to and underlie all forward-looking statements. These factors are relevant to all forward-looking statements as they may impact current and future levels of demand for EIPLP’s services. Similarly, exchange rates, inflation and interest rates impact the economies and business environments in which EIPLP operates and may impact levels of demand for EIPLP’s services and cost of inputs, and are therefore inherent in all forward-looking statements. Due to the interdependencies and correlation of these macroeconomic factors, the impact of any one assumption on a forward-looking statement cannot be determined with certainty, particularly with respect to earnings/(loss), adjusted earnings/(loss), EBITDA, adjusted EBITDA, DCF, cash flows and distributions. The most relevant assumptions associated with forward-looking statements on announced projects and projects under construction, including estimated completion dates and expected capital expenditures, include the following: availability and price of labor and construction materials; effects of inflation and foreign exchange rates on labor and material costs; effects of interest rates on borrowing costs; and impact of weather and customer, government and regulatory approvals on construction and in-service schedules and cost recovery regimes.
8
EIPLP’s forward-looking statements are subject to risks and uncertainties pertaining to distribution policy, operating performance, regulatory parameters, project approval and support, renewals of rights of way, weather, economic and competitive conditions, public opinion, changes in tax laws and tax rates, changes in trade agreements, exchange rates, interest rates, commodity prices, political decisions and supply of and demand for commodities, including but not limited to those risks and uncertainties discussed in this MD&A. The impact of any one risk, uncertainty or factor on a particular forward-looking statement is not determinable with certainty as these are interdependent and EIPLP’s future course of action depends on management’s assessment of all information available at the relevant time. Except to the extent required by applicable law, EIPLP assumes no obligation to publicly update or revise any forward-looking statements made in this MD&A or otherwise, whether as a result of new information, future events or otherwise. All subsequent forward-looking statements, whether written or oral, attributable to EIPLP or persons acting on EIPLP’s behalf, are expressly qualified in their entirety by these cautionary statements. NON-GAAP MEASURES This MD&A contains references to adjusted EBITDA, adjusted earnings and DCF. Adjusted EBITDA represents EBITDA adjusted for unusual, non-recurring or non-operating factors on both a consolidated and segmented basis. Adjusted earnings represent earnings adjusted for unusual, non-recurring or non-operating factors included in adjusted EBITDA, as well as adjustments for unusual, non-recurring or non-operating factors in respect of interest expense and income taxes on a consolidated basis. These factors, referred to as adjusting items, are reconciled and discussed in the financial results sections for the affected business segments. DCF represents cash available to fund distributions on Class A and Class C units, as well as for debt repayments and reserves. DCF consists of adjusted EBITDA further adjusted for non-cash items, representing cash flow from our underlying businesses, less deductions for maintenance capital expenditures, interest expense, applicable taxes and further adjusted for unusual, non-recurring or non-operating factors not indicative of the underlying or sustainable cash flows of the business. DCF is important to unitholders as the Fund Group’s objective is to provide a predictable flow of distributions to unitholders. The Manager believes the presentation of adjusted EBITDA, adjusted earnings and DCF give useful information to partners and unitholders as they provide increased transparency and insight into our performance. The Manager uses adjusted EBITDA, adjusted earnings and DCF to set targets and to assess our performance. Adjusted EBITDA, adjusted earnings and DCF are not measures that have standardized meaning prescribed by U.S. GAAP and are not U.S. GAAP measures. Therefore, these measures may not be comparable with similar measures presented by other issuers. The tables below provide a reconciliation of the GAAP and non-GAAP measures.
9
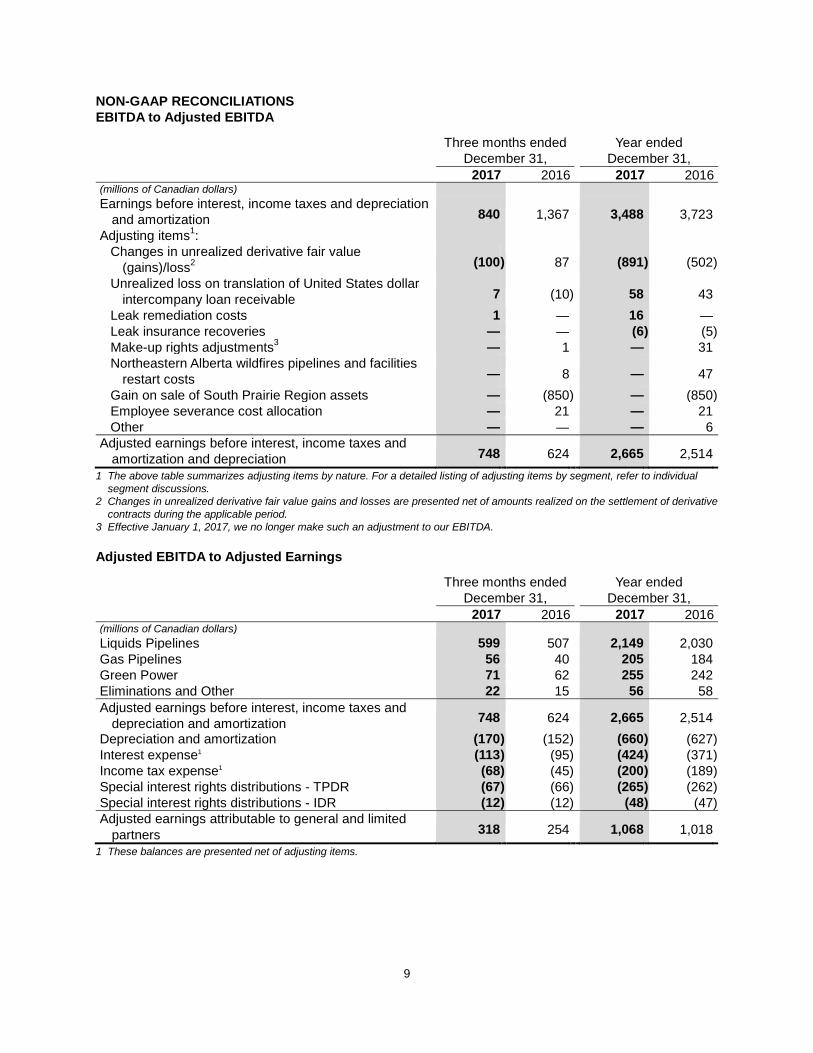
NON-GAAP RECONCILIATIONS EBITDA to Adjusted EBITDA
Three months ended Year ended December 31, December 31, 2017 2016 2017 2016 (millions of Canadian dollars) Earnings before interest, income taxes and depreciation
and amortization 840
1,367 3,488
3,723
Adjusting items1:
Changes in unrealized derivative fair value
(gains)/loss2 (100 ) 87 (891 ) (502 )
Unrealized loss on translation of United States dollar
intercompany loan receivable 7
(10 ) 58
43
Leak remediation costs 1 — 16 — Leak insurance recoveries — — (6 ) (5 ) Make-up rights adjustments3 — 1 — 31
Northeastern Alberta wildfires pipelines and facilities
restart costs —
8 —
47
Gain on sale of South Prairie Region assets — (850 ) — (850 ) Employee severance cost allocation — 21 — 21 Other — — — 6 Adjusted earnings before interest, income taxes and
amortization and depreciation 748
624 2,665
2,514
1 The above table summarizes adjusting items by nature. For a detailed listing of adjusting items by segment, refer to individual segment discussions.
2 Changes in unrealized derivative fair value gains and losses are presented net of amounts realized on the settlement of derivative contracts during the applicable period.
3 Effective January 1, 2017, we no longer make such an adjustment to our EBITDA. Adjusted EBITDA to Adjusted Earnings
Three months ended Year ended December 31, December 31, 2017 2016 2017 2016 (millions of Canadian dollars) Liquids Pipelines 599 507 2,149 2,030 Gas Pipelines 56 40 205 184 Green Power 71 62 255 242 Eliminations and Other 22 15 56 58 Adjusted earnings before interest, income taxes and
depreciation and amortization 748
624
2,665
2,514
Depreciation and amortization (170 ) (152 ) (660 ) (627 ) Interest expense1 (113 ) (95 ) (424 ) (371 ) Income tax expense1 (68 ) (45 ) (200 ) (189 ) Special interest rights distributions - TPDR (67 ) (66 ) (265 ) (262 ) Special interest rights distributions - IDR (12 ) (12 ) (48 ) (47 ) Adjusted earnings attributable to general and limited
partners
318
254
1,068
1,018
1 These balances are presented net of adjusting items.
10
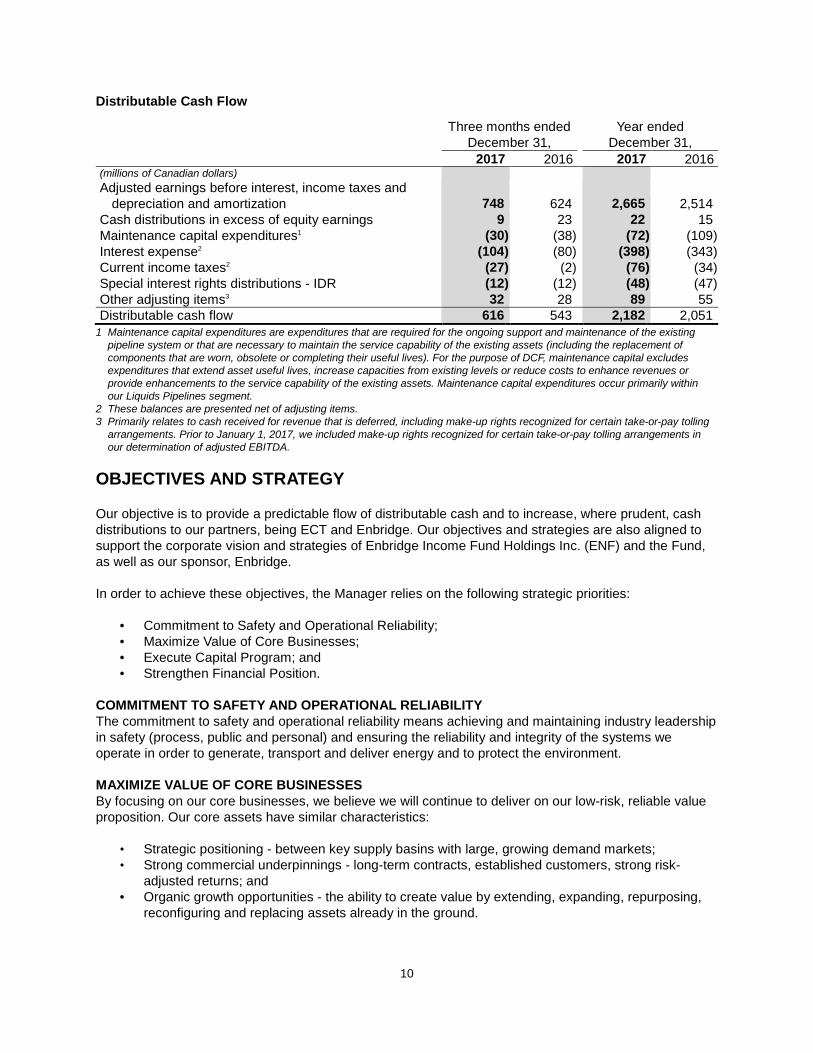
Distributable Cash Flow
Three months ended Year ended December 31, December 31, 2017 2016 2017 2016 (millions of Canadian dollars) Adjusted earnings before interest, income taxes and depreciation and amortization 748 624 2,665 2,514 Cash distributions in excess of equity earnings 9 23 22 15 Maintenance capital expenditures1 (30 ) (38 ) (72 ) (109 ) Interest expense2 (104 ) (80 ) (398 ) (343 ) Current income taxes2 (27 ) (2 ) (76 ) (34 ) Special interest rights distributions - IDR (12 ) (12 ) (48 ) (47 ) Other adjusting items3 32 28 89 55 Distributable cash flow 616 543 2,182 2,051
1 Maintenance capital expenditures are expenditures that are required for the ongoing support and maintenance of the existing pipeline system or that are necessary to maintain the service capability of the existing assets (including the replacement of components that are worn, obsolete or completing their useful lives). For the purpose of DCF, maintenance capital excludes expenditures that extend asset useful lives, increase capacities from existing levels or reduce costs to enhance revenues or provide enhancements to the service capability of the existing assets. Maintenance capital expenditures occur primarily within our Liquids Pipelines segment.
2 These balances are presented net of adjusting items. 3 Primarily relates to cash received for revenue that is deferred, including make-up rights recognized for certain take-or-pay tolling
arrangements. Prior to January 1, 2017, we included make-up rights recognized for certain take-or-pay tolling arrangements in our determination of adjusted EBITDA.
OBJECTIVES AND STRATEGY Our objective is to provide a predictable flow of distributable cash and to increase, where prudent, cash distributions to our partners, being ECT and Enbridge. Our objectives and strategies are also aligned to support the corporate vision and strategies of Enbridge Income Fund Holdings Inc. (ENF) and the Fund, as well as our sponsor, Enbridge. In order to achieve these objectives, the Manager relies on the following strategic priorities:
• Commitment to Safety and Operational Reliability; • Maximize Value of Core Businesses; • Execute Capital Program; and • Strengthen Financial Position.
COMMITMENT TO SAFETY AND OPERATIONAL RELIABILITY The commitment to safety and operational reliability means achieving and maintaining industry leadership in safety (process, public and personal) and ensuring the reliability and integrity of the systems we operate in order to generate, transport and deliver energy and to protect the environment. MAXIMIZE VALUE OF CORE BUSINESSES By focusing on our core businesses, we believe we will continue to deliver on our low-risk, reliable value proposition. Our core assets have similar characteristics:
• Strategic positioning - between key supply basins with large, growing demand markets; • Strong commercial underpinnings - long-term contracts, established customers, strong risk-
adjusted returns; and • Organic growth opportunities - the ability to create value by extending, expanding, repurposing,
reconfiguring and replacing assets already in the ground.

11
Our liquids pipelines business is expected to have future organic growth opportunities beyond our current secured projects. We will generally have a first right to execute any such projects that fall within the footprint of Enbridge's Canadian liquids pipelines business. For gas pipelines assets, we seek to optimize the competitive advantage of our existing asset footprint, as the Alliance Pipeline is well-positioned to provide liquids-rich gas transportation services to developing regions in northeastern British Columbia, northwestern Alberta and the Bakken. In 2017, Alliance Pipeline benefited from strong demand for seasonal firm service through its open season process. Our green power asset strategies are driven by the objective to manage and maintain facilities in such a way as to maximize power generation and related revenues when the relevant wind, solar or waste heat energy resource is available. In 2017, the green power assets benefited from strong wind resources in the second and fourth quarters. EXECUTE CAPITAL PROGRAM Enbridge's enterprise-wide objective is to safely deliver projects on time and on budget and at the lowest practical cost while maintaining the highest standards for safety, quality, customer satisfaction and environmental and regulatory compliance. Project execution is integral to our near-term financial performance and balance sheet strength, but also to positioning the business for the long-term. Growth projects across the Enbridge entities, including those undertaken by EIPLP, are managed by Enbridge’s Major Projects Group, which continues to build upon and enhance the key elements of its project management processes, including: employee and contractor safety; long-term supply chain agreements; quality design, materials and construction; extensive regulatory and public consultation; robust cost, schedule and risk controls; and efficient transition of projects to operating units. Ensuring our project execution costs remain competitive in any market environment is a priority. STRENGTHEN FINANCIAL POSITION The maintenance of financial strength is crucial to our growth strategy. Our financing strategies are designed to ensure we have sufficient financial flexibility to meet our capital requirements. Ongoing access to cost effective sources of debt and equity capital is critical to the successful execution of our strategy to expand existing assets and acquire or develop new energy infrastructure. For further discussion on our financing strategies, refer to Liquidity and Capital Resources. Consistent with our risk management policy, we have implemented a comprehensive long-term economic hedging program to mitigate the impact of fluctuations in interest rates, foreign exchange and commodity price on our earnings and cash flow. For further details, refer to Risk Management and Financial Instruments. The Manager will continue to assess ways to generate value for our partners, including reviewing opportunities that may lead to acquisitions, dispositions or other strategic transactions, some of which may be material and involve our sponsor, Enbridge. Opportunities are screened, analyzed and assessed using strict operating, strategic and financial criteria with the objective of ensuring the effective deployment of capital and the enduring financial strength and stability of EIPLP. An independent committee may be utilized when opportunities involve Enbridge and its affiliates. To the extent that ENF does not fund growth capital for the Canadian L3R Program, Enbridge is obligated to fund the equity requirements until the project is placed into service.
12
INDUSTRY FUNDAMENTALS SUPPLY AND DEMAND FOR LIQUIDS Enbridge has an established and successful history of being the largest transporter of crude oil to the United States, the world’s largest market. While United States’ demand for Canadian crude oil production will support the use of Enbridge's infrastructure for the foreseeable future, North American and global crude oil supply and demand fundamentals are shifting, and Enbridge has a role to play in this transition by developing long-term transportation options that enable the efficient flow of crude oil from supply regions to end-user markets. The downturn in crude oil prices which began in 2014 has impacted our liquids pipelines’ customers, who responded by reducing their exploration and development spending for 2016 and 2017 in higher cost basins. However, the international market for crude oil has continued to see an increase in production from the North American shale oil producing basins and increased production from specific Organization of Petroleum Exporting Countries (OPEC). West Texas Intermediate (WTI) crude price has been strengthening from US$30 per barrel at the beginning of 2016 as the market has fought to re-balance supply and demand. Prices began to recover in response to cuts in OPEC and non-OPEC production and have continued to recover through 2017. The WTI crude prices averaged US$51 per barrel for 2017 and ended the year above US$60 per barrel. Notwithstanding the current price environment, our mainline system has thus far continued to be highly utilized and in fact, mainline throughput as measured at the Canada/United States border at Gretna, Manitoba saw record throughput of 2.7 million barrels per day (bpd) in December 2017. The mainline system continues to be subject to apportionment of heavy crude oil, as nominated volumes currently exceed capacity on portions of the system. The impact of a low crude oil price environment on the financial performance of our liquids pipelines business is expected to be relatively modest given the commercial arrangements which underpin many of the pipelines that make up our liquids system and provide a significant measure of protection against volume fluctuations. In addition, our mainline is well positioned to continue to provide safe and efficient transportation which will enable western Canadian and Bakken production to reach attractive markets in the United States and eastern Canada at a competitive cost relative to other alternatives. The fundamentals of oil sands production and low crude oil prices have caused some sponsors to reconsider the timing of their upstream oil sands development projects. However, recently updated forecasts continue to reflect long-term supply growth from the Western Canadian Sedimentary Basin (WCSB), although the projected pace of growth is slower than previous forecasts as companies continue to assess the viability of certain capital investments in the current price environment and with the ongoing uncertainty related to timing and completion of competing pipeline systems. Over the long term, global energy consumption is expected to continue to grow, with the growth in crude oil demand primarily driven by emerging economies in regions outside the Organization for Economic Cooperation and Development (OECD), mainly India and China. While OECD countries, including Canada, the United States and western European nations, will experience population growth, the emphasis placed on energy efficiency, conservation and a shift to lower carbon fuels, such as natural gas and renewables, is expected to reduce crude oil demand over the long term. Accordingly, there is a strategic opportunity for North American producers to grow production to displace foreign imports and participate in the growing global demand outside North America. In terms of supply, long-term global crude oil production is expected to continue to grow through 2035, with growth in supply primarily contributed by North America, Brazil and OPEC. The expected growth in North America is largely driven by production from the oil sands and the continued development of tight oil plays including the Permian, Bakken and Eagle Ford formations. Growth in supply from OPEC is primarily a result of a shift in OPEC’s strategy from ‘balancing supply’ to ‘competing for market share’ in Asia and Europe. However, political uncertainty in certain oil producing countries, including Venezuela,
13
Libya, Nigeria and Iraq, increases risk in those regions’ supply growth forecasts and makes North America one of the most secure supply sources of crude oil. As witnessed throughout 2016 and 2017, North American supply growth can be influenced by macro-economic factors that drive down the global crude prices. Over the longer term, North American production from tight oil plays, including the Bakken, is expected to grow as technology continues to improve well productivity and efficiencies. The WCSB, in Canada, is viewed as one of the world’s largest and most secure supply sources of crude oil. However, the pace of growth in North America and level of investment in the WCSB could be tempered in future years by a number of factors including a sustained period of low crude oil prices and corresponding production decisions by OPEC, increasing environmental regulation, and prolonged approval processes for new pipelines with access to tide-water for export. In recent years, the combination of relatively flat domestic demand, growing supply and long-lead time to build pipeline infrastructure led to a fundamental change in the North American crude oil landscape. The inability to move increasing inland supply to tide-water markets resulted in a divergence between WTI and world pricing, resulting in lower netbacks for North American producers than could otherwise be achieved if selling into global markets. The impact of price differentials has been even more pronounced for western Canadian producers as insufficient pipeline infrastructure resulted in a further discounting of Alberta crude against WTI. With a number of market access initiatives completed by the industry in recent years, including those introduced by us, the crude oil price differentials significantly narrowed in 2015, and resulted in higher netbacks for producers. The capacity from these initiatives was for the most part exhausted by the end of 2017 from growth in the Oil Sands and has resulted in crude differentials widening once more. Canadian pipeline export capacity is expected to remain essentially full, resulting in incremental production utilizing non-pipeline transportation services until such time as pipeline capacity is made available. As the supply in North America continues to grow, the growth and flexibility of pipeline infrastructure will need to keep pace with the sensitive demand and supply balance. Over the longer term, we believe pipelines will continue to be the most cost-effective means of transportation in markets where the differential between North American and global oil prices remain narrow. Utilization of rail to transport crude is expected to be substantially limited to those markets not readily accessible by pipelines. Our role in helping to address the evolving supply and demand fundamentals and alleviating price discounts for producers and supply costs to refiners is to provide expanded pipeline capacity and sustainable connectivity to alternative markets. As discussed in Growth Projects, in 2017, we continued to execute our growth projects plan in furtherance of this objective. SUPPLY AND DEMAND FOR NATURAL GAS AND NGL Global energy demand is expected to increase approximately 30% by 2040, according to the International Energy Agency, driven primarily by economic growth in non-OECD countries. Natural gas will play an important role in meeting this energy demand as gas consumption is anticipated to grow by nearly 50% during this period as one of the world’s fastest growing energy sources, second only to renewables. Globally, most natural gas demand will stem from the need for greater power generation capacity, as natural gas is a cleaner alternative to coal, which currently has the largest market share for power generation. Within North America, United States natural gas demand growth is expected to be driven by the next wave of gas-intensive petrochemical facilities which are now starting to enter service, along with power generation, an increase in the volume of liquefied natural gas (LNG) exports and additional pipeline exports to Mexico. Within Canada, natural gas demand growth is expected to be largely tied to oil sands development and growth in gas-fired power generation. Canadian gas demand growth will be accelerated with implementation of proposed government regulations to replace coal fired power, designed to meet emissions targets. North American supply from tight formations continues to create a demand and supply imbalance for natural gas and some NGL products. North American gas supply continues to be significantly impacted by development in the northeastern United States, primarily the prolific Marcellus and Utica shales in

14
Appalachia. The abundance of supply from these shale plays continues to alter natural gas flow patterns in North America, as this region has largely displaced flows from the Gulf Coast and WCSB that historically supplied eastern markets. Similar pressures are also being felt in the Midwest United States and southern markets. Beyond growing Appalachian production, natural gas supply growth has been largely tied to crude oil and NGL production. In the Permian Basin, for example, rapid expansion of crude oil drilling activity has increased associated gas supplies from the region by approximately 2.0 billion cubic feet per day (bcf/d) over the past two years and growth is forecasted to continue for the next decade. Similarly, WCSB natural gas production growth has been primarily attributable to production of NGLs, which provide strong producer netbacks. However, growing local demand from gas-fired power generation and continued oil sands development should stabilize WCSB natural gas economics, even as regional exports face steeper competition in Eastern Canada and the Midwest United States. The continued increase in North American gas production and the resulting surplus supply has limited gas price advances, which remained largely within range throughout 2017. In response to low prices, producers have introduced new technologies and more efficient drilling and completion techniques to maximize production and improve break-even economics on new wells. While domestic gas demand and growing North American gas exports provide support for future prices, abundant low cost supplies are likely to continue to limit high prices through the next decade. Growth in global demand for natural gas will necessitate growing LNG trade to facilitate the movement of gas supply from producing regions to consuming regions. North America and the USGC in particular are positioned to benefit from this trend as low-cost tight gas production from the Permian, Eagle Ford and Appalachia continues to enable growing LNG exports. The United States exported approximately 3.0 bcf/d of natural gas from the United States Gulf Coast at the end of 2017 with export capacity of approximately 9.0 bcf/d scheduled to be in service by 2020. While the short term outlook for LNG fundamentals points to a continued global oversupply, as the market absorbs the large volumes of new supply coming online, forecasts indicate demand will exceed projected LNG supply in the early 2020s as growing markets seek to diversify supply sources. In addition to LNG export facilities under construction, the United States remains well positioned to serve this next round of global trade expansion. Canada is well positioned to provide LNG export facilities, although these facilities are not likely to be in service in the near term. NGL production growth is increasingly linked to growing associated gas volumes related to the development of tight oil plays such as the Permian. NGLs that can be extracted from liquids-rich gas streams include ethane, propane, butane and natural gasoline, which are used in a variety of industrial, commercial and other applications. Robust gas production has created regional supply imbalances for some NGL products and weakened the economics of NGL extraction, although these imbalances modestly improved over 2017 as crude prices have rebounded and NGL export capacity has expanded. Over the longer term, the growth in NGL demand is expected to be robust, driven largely by incremental ethane demand and exports. Ethane is the key feedstock to the United States Gulf Coast petrochemical industry, which is among the world’s lowest-cost ethylene producing regions and is currently undergoing significant expansion. As this new infrastructure is completed, ethane prices and resulting extraction margins are expected to improve, reducing the amount of ethane retained in the gas stream. In addition to ethane, the outlook for abundant propane supplies has prompted the development and expansion of export facilities for liquefied petroleum gas. Over a few short years, the United States has become the world’s largest liquefied petroleum gas exporter, which has helped to reduce the inventory overhang and provide support for propane prices.
15
In Canada, the WCSB is well situated to capitalize on the evolving NGL fundamentals over the longer term as the Montney and Duvernay shale plays contain significant liquids-rich resources at highly competitive extraction costs. In response to growing regional NGL supply, several propane export solutions are being developed to move WCSB NGLs from western Canada to global markets. Longer term, NGL fundamentals indicate a positive outlook for demand growth and would be further supported with a continued recovery in crude oil prices. Consequently, the crude-to-gas price ratio is expected to remain well above energy conversion value levels and continue to be supportive of NGL extraction over the longer term. In response to these evolving natural gas and NGL fundamentals, we believe we are well-positioned to provide value-added solutions to producers. Alliance Pipeline traverses through the heart of key liquids-rich plays in the WCSB and Bakken, and is uniquely positioned to transport liquids-rich gas. Alliance Pipeline has developed new service offerings to best meet the needs of producers and shippers, and demand for transportation services continues to be robust. SUPPLY AND DEMAND FOR RENEWABLE ENERGY The power generation and transmission network in North America is expected to undergo significant growth over the next 20 years. On the demand side, North American economic growth over the longer term is expected to drive growing electricity demand, although continued efficiency gains are expected to make the economy less energy-intensive and temper demand growth. On the supply side, impending legislation in Canada is expected to accelerate the retirement of aging coal-fired generation plants, resulting in a requirement for significant new generation capacity. While coal and nuclear facilities will continue to be core components of power generation in North America, gas-fired and renewable energy facilities, including biomass, hydro, solar and wind, are expected to be the preferred sources to replace coal-fired generation due to their lower carbon intensities. North American wind and solar resources fundamentals remain strong. In the United States, there is over 85 gigawatts (GW) of installed wind power capacity and in Canada over 12 GW of installed wind power capacity. Solar resources in southwestern states such as Arizona, California and Nevada are considered to be some of the best in the world for large-scale solar plants and the United States currently has over 35 GW of installed solar photovoltaic capacity. In late 2015, the United States passed legislation extending the availability of certain Federal tax incentives which have supported the profitability of wind and solar projects. However, expanding renewable energy infrastructure in North America is not without challenges. Growing renewable generation capacity is expected to necessitate substantial capital investment to upgrade existing transmission systems or, in many cases, build new transmission lines, as these high quality wind and solar resources are often found in regions that are not in close proximity to markets. In the near-term, uncertainty over the availability of tax or other government incentives in various jurisdictions, the ability to secure long-term power purchase agreements through government or investor-owned power authorities and low market prices of electricity may hinder the pace of future new renewable capacity development. However, continued improvement in technology and manufacturing capacity in the past few years has reduced capital costs associated with renewable energy infrastructure and has also improved yield factors of power generation assets. These positive developments are expected to render renewable energy more competitive and support ongoing investment over the long term.
16
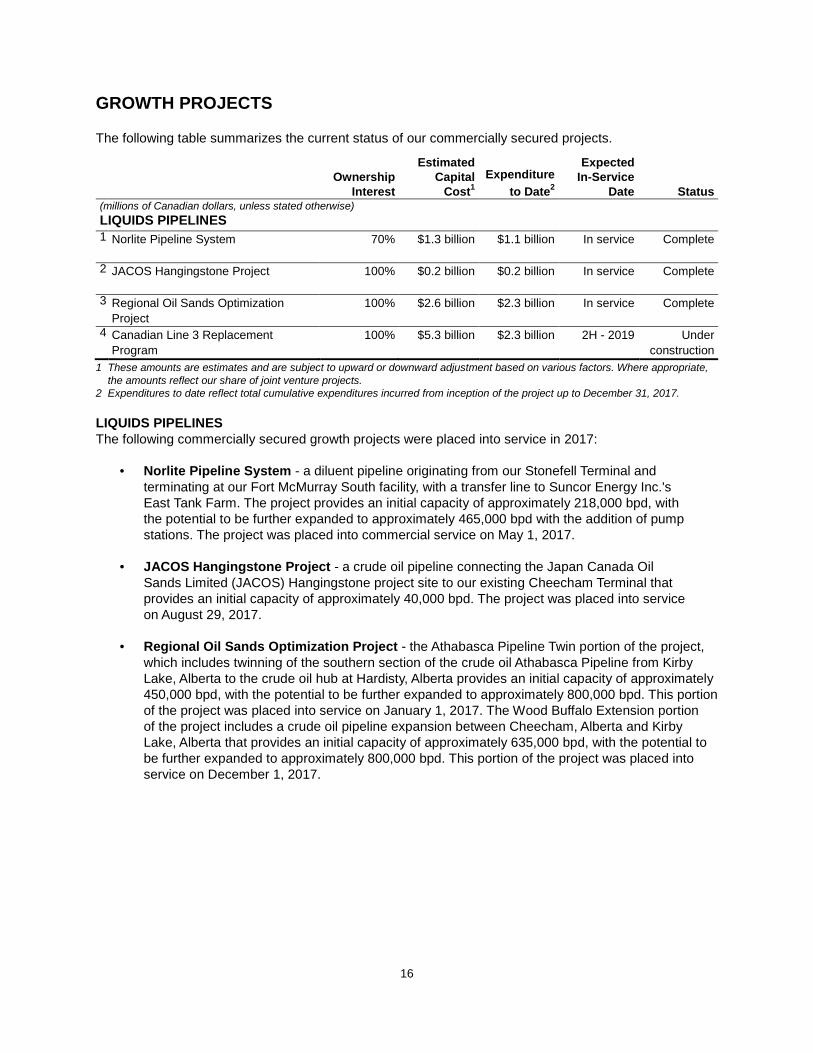
GROWTH PROJECTS The following table summarizes the current status of our commercially secured projects.
Estimated Expected Ownership Capital Expenditure
In-Service
Interest Cost1 to Date2 Date Status (millions of Canadian dollars, unless stated otherwise) LIQUIDS PIPELINES 1
Norlite Pipeline System 70% $1.3 billion $1.1 billion In service Complete 2
JACOS Hangingstone Project 100% $0.2 billion $0.2 billion In service Complete 3
Regional Oil Sands Optimization 100% $2.6 billion $2.3 billion In service Complete Project 4
Canadian Line 3 Replacement 100% $5.3 billion $2.3 billion 2H - 2019 Under Program construction
1 These amounts are estimates and are subject to upward or downward adjustment based on various factors. Where appropriate, the amounts reflect our share of joint venture projects.
2 Expenditures to date reflect total cumulative expenditures incurred from inception of the project up to December 31, 2017. LIQUIDS PIPELINES The following commercially secured growth projects were placed into service in 2017:
• Norlite Pipeline System - a diluent pipeline originating from our Stonefell Terminal and terminating at our Fort McMurray South facility, with a transfer line to Suncor Energy Inc.'s East Tank Farm. The project provides an initial capacity of approximately 218,000 bpd, with the potential to be further expanded to approximately 465,000 bpd with the addition of pump stations. The project was placed into commercial service on May 1, 2017.
• JACOS Hangingstone Project - a crude oil pipeline connecting the Japan Canada Oil Sands Limited (JACOS) Hangingstone project site to our existing Cheecham Terminal that provides an initial capacity of approximately 40,000 bpd. The project was placed into service on August 29, 2017.
• Regional Oil Sands Optimization Project - the Athabasca Pipeline Twin portion of the project,
which includes twinning of the southern section of the crude oil Athabasca Pipeline from Kirby Lake, Alberta to the crude oil hub at Hardisty, Alberta provides an initial capacity of approximately 450,000 bpd, with the potential to be further expanded to approximately 800,000 bpd. This portion of the project was placed into service on January 1, 2017. The Wood Buffalo Extension portion of the project includes a crude oil pipeline expansion between Cheecham, Alberta and Kirby Lake, Alberta that provides an initial capacity of approximately 635,000 bpd, with the potential to be further expanded to approximately 800,000 bpd. This portion of the project was placed into service on December 1, 2017.
17
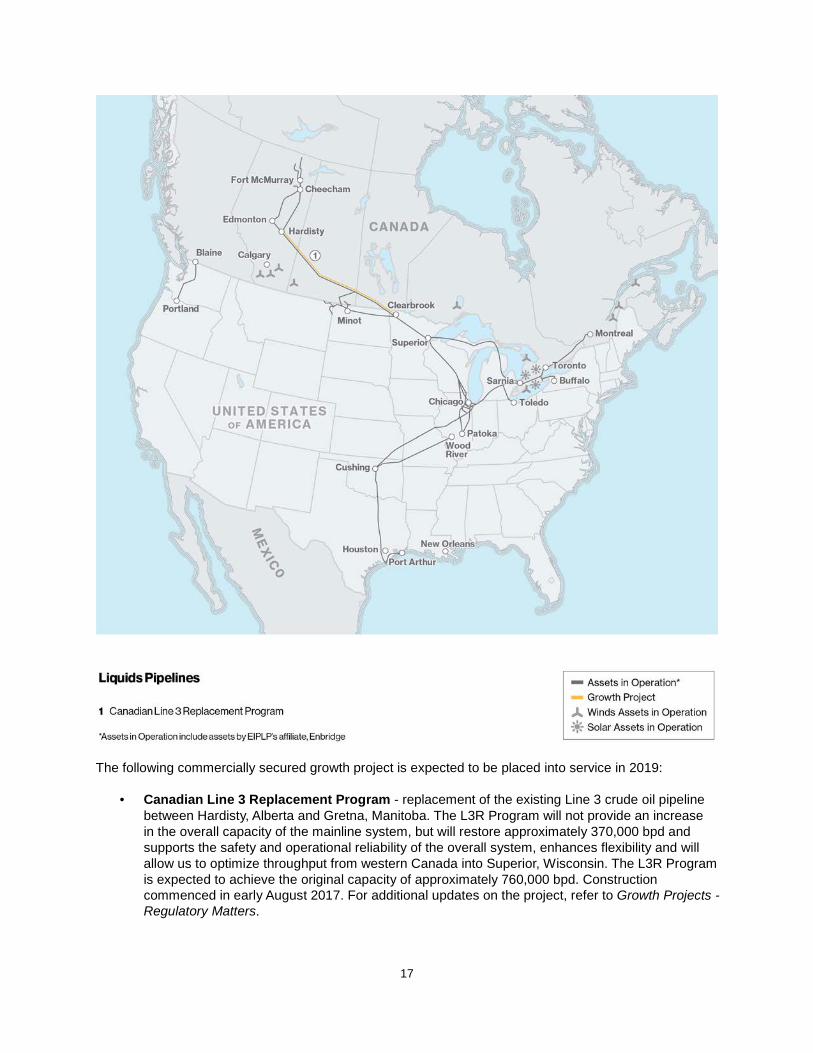
The following commercially secured growth project is expected to be placed into service in 2019:
• Canadian Line 3 Replacement Program - replacement of the existing Line 3 crude oil pipeline between Hardisty, Alberta and Gretna, Manitoba. The L3R Program will not provide an increase in the overall capacity of the mainline system, but will restore approximately 370,000 bpd and supports the safety and operational reliability of the overall system, enhances flexibility and will allow us to optimize throughput from western Canada into Superior, Wisconsin. The L3R Program is expected to achieve the original capacity of approximately 760,000 bpd. Construction commenced in early August 2017. For additional updates on the project, refer to Growth Projects - Regulatory Matters.
18
OTHER ANNOUNCED PROJECTS UNDER DEVELOPMENT The following project has not yet met our criteria to be classified as commercially secured: GAS PIPELINES
• Alliance Pipeline Expansion Project - Alliance Pipeline announced a non-binding request for
expressions of interest for additional transportation service on the Alliance Pipeline Canada and Alliance Pipeline US systems. Alliance Pipeline continues to engage with interested parties and assess the addition of more compression facilities along the system in order to increase throughput capacity by up to 500 mmcf/d. The projected in-service date for the potential capacity expansion is the second half of 2021.
GROWTH PROJECTS - REGULATORY MATTERS Canadian Line 3 Replacement Program In December 2016, the Manitoba Metis Federation (MMF) and the Association of Manitoba Chiefs (AMC) applied to the Federal Court of Appeal for leave, which was subsequently granted, to judicially review the Government of Canada’s decision to approve the Canadian L3R Program. On July 4, 2017, the MMF discontinued its judicial review application. On October 25, 2017, the AMC discontinued its judicial review application. As a result, no further challenges to the Government of Canada's decision to approve the Canadian L3R Program may be brought by any party. All required pre-construction filings have been approved by the National Energy Board (NEB). The United States portion of the Line 3 Replacement Program (U.S. L3R Program) is being executed by EEP and will complement existing integrity programs by replacing approximately 576 kilometers (358 miles) of the remaining line segments of the existing Line 3 pipeline between Neche, North Dakota and Superior, Wisconsin. EEP has the authorization to replace Line 3 in North Dakota and Wisconsin. EEP is in the process of obtaining the appropriate permits for constructing the U.S. L3R Program in Minnesota. The project requires both a Certificate of Need and an approval of the pipeline’s route (Route Permit) from the Minnesota Public Utilities Commission (MNPUC). The MNPUC found both the Certificate of Need and Route Permit applications for the U.S. L3R Program through Minnesota to be complete. On February 1, 2016, the MNPUC issued a written order requiring the Minnesota Department of Commerce (DOC) to prepare an Environmental Impact Statement (EIS) before the filing of intervenor testimony in the Certificate of Need and Route Permit processes. The DOC issued the final EIS on August 17, 2017. The MNPUC determined the final EIS to be inadequate in four specific areas on December 7, 2017. The DOC provided a supplemental EIS on February 12, 2018, and the MNPUC will determine its adequacy in the second quarter of 2018. In the parallel Certificate of Need and Route Permit dockets, public and evidentiary hearings were held at locations along the proposed route and in Saint Paul, Minnesota from September to November 2017 and are now complete. The MNPUC is expected to vote on the Certificate of Need and Route Permit at the end of the second quarter of 2018. On October 16, 2017, the United States Department of State issued a Presidential permit to EEP to operate Line 67 at its design capacity of 888,889 bpd at the international border of the United States and Canada near Neche, North Dakota.
19
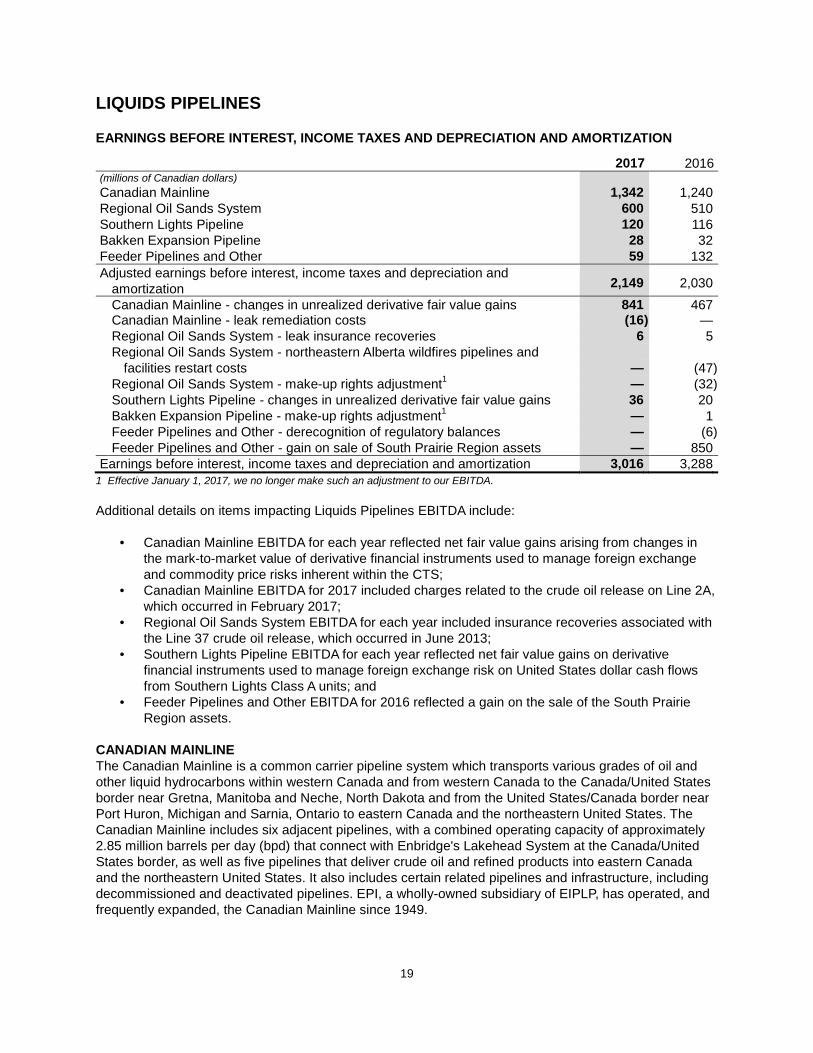
LIQUIDS PIPELINES EARNINGS BEFORE INTEREST, INCOME TAXES AND DEPRECIATION AND AMORTIZATION
2017 2016 (millions of Canadian dollars) Canadian Mainline 1,342 1,240 Regional Oil Sands System 600 510 Southern Lights Pipeline 120 116 Bakken Expansion Pipeline 28 32 Feeder Pipelines and Other 59 132 Adjusted earnings before interest, income taxes and depreciation and
amortization 2,149
2,030
Canadian Mainline - changes in unrealized derivative fair value gains 841 467 Canadian Mainline - leak remediation costs (16 ) — Regional Oil Sands System - leak insurance recoveries 6 5 Regional Oil Sands System - northeastern Alberta wildfires pipelines and facilities restart costs — (47 ) Regional Oil Sands System - make-up rights adjustment1 — (32 ) Southern Lights Pipeline - changes in unrealized derivative fair value gains 36 20 Bakken Expansion Pipeline - make-up rights adjustment1 — 1 Feeder Pipelines and Other - derecognition of regulatory balances — (6 ) Feeder Pipelines and Other - gain on sale of South Prairie Region assets — 850 Earnings before interest, income taxes and depreciation and amortization 3,016 3,288
1 Effective January 1, 2017, we no longer make such an adjustment to our EBITDA. Additional details on items impacting Liquids Pipelines EBITDA include:
• Canadian Mainline EBITDA for each year reflected net fair value gains arising from changes in the mark-to-market value of derivative financial instruments used to manage foreign exchange and commodity price risks inherent within the CTS;
• Canadian Mainline EBITDA for 2017 included charges related to the crude oil release on Line 2A, which occurred in February 2017;
• Regional Oil Sands System EBITDA for each year included insurance recoveries associated with the Line 37 crude oil release, which occurred in June 2013;
• Southern Lights Pipeline EBITDA for each year reflected net fair value gains on derivative financial instruments used to manage foreign exchange risk on United States dollar cash flows from Southern Lights Class A units; and
• Feeder Pipelines and Other EBITDA for 2016 reflected a gain on the sale of the South Prairie Region assets.
CANADIAN MAINLINE The Canadian Mainline is a common carrier pipeline system which transports various grades of oil and other liquid hydrocarbons within western Canada and from western Canada to the Canada/United States border near Gretna, Manitoba and Neche, North Dakota and from the United States/Canada border near Port Huron, Michigan and Sarnia, Ontario to eastern Canada and the northeastern United States. The Canadian Mainline includes six adjacent pipelines, with a combined operating capacity of approximately 2.85 million barrels per day (bpd) that connect with Enbridge's Lakehead System at the Canada/United States border, as well as five pipelines that deliver crude oil and refined products into eastern Canada and the northeastern United States. It also includes certain related pipelines and infrastructure, including decommissioned and deactivated pipelines. EPI, a wholly-owned subsidiary of EIPLP, has operated, and frequently expanded, the Canadian Mainline since 1949.
20
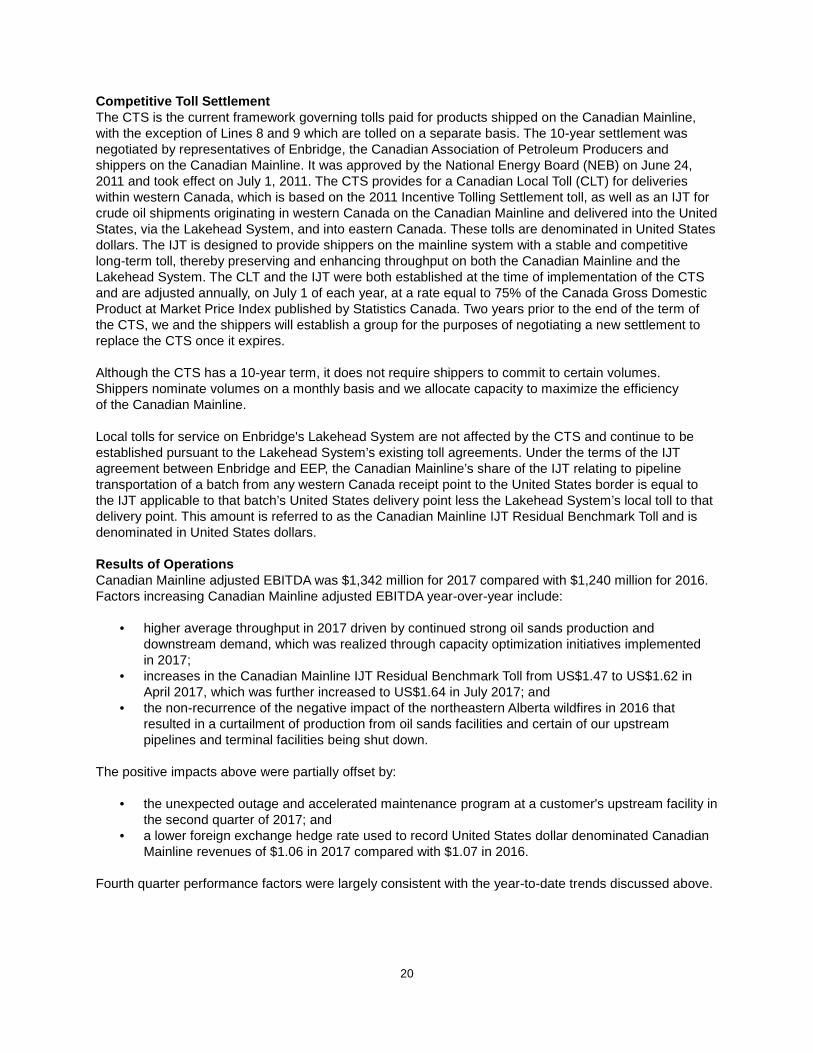
Competitive Toll Settlement The CTS is the current framework governing tolls paid for products shipped on the Canadian Mainline, with the exception of Lines 8 and 9 which are tolled on a separate basis. The 10-year settlement was negotiated by representatives of Enbridge, the Canadian Association of Petroleum Producers and shippers on the Canadian Mainline. It was approved by the National Energy Board (NEB) on June 24, 2011 and took effect on July 1, 2011. The CTS provides for a Canadian Local Toll (CLT) for deliveries within western Canada, which is based on the 2011 Incentive Tolling Settlement toll, as well as an IJT for crude oil shipments originating in western Canada on the Canadian Mainline and delivered into the United States, via the Lakehead System, and into eastern Canada. These tolls are denominated in United States dollars. The IJT is designed to provide shippers on the mainline system with a stable and competitive long-term toll, thereby preserving and enhancing throughput on both the Canadian Mainline and the Lakehead System. The CLT and the IJT were both established at the time of implementation of the CTS and are adjusted annually, on July 1 of each year, at a rate equal to 75% of the Canada Gross Domestic Product at Market Price Index published by Statistics Canada. Two years prior to the end of the term of the CTS, we and the shippers will establish a group for the purposes of negotiating a new settlement to replace the CTS once it expires. Although the CTS has a 10-year term, it does not require shippers to commit to certain volumes. Shippers nominate volumes on a monthly basis and we allocate capacity to maximize the efficiency of the Canadian Mainline. Local tolls for service on Enbridge's Lakehead System are not affected by the CTS and continue to be established pursuant to the Lakehead System’s existing toll agreements. Under the terms of the IJT agreement between Enbridge and EEP, the Canadian Mainline’s share of the IJT relating to pipeline transportation of a batch from any western Canada receipt point to the United States border is equal to the IJT applicable to that batch’s United States delivery point less the Lakehead System’s local toll to that delivery point. This amount is referred to as the Canadian Mainline IJT Residual Benchmark Toll and is denominated in United States dollars. Results of Operations Canadian Mainline adjusted EBITDA was $1,342 million for 2017 compared with $1,240 million for 2016. Factors increasing Canadian Mainline adjusted EBITDA year-over-year include:
• higher average throughput in 2017 driven by continued strong oil sands production and downstream demand, which was realized through capacity optimization initiatives implemented in 2017;
• increases in the Canadian Mainline IJT Residual Benchmark Toll from US$1.47 to US$1.62 in April 2017, which was further increased to US$1.64 in July 2017; and
• the non-recurrence of the negative impact of the northeastern Alberta wildfires in 2016 that resulted in a curtailment of production from oil sands facilities and certain of our upstream pipelines and terminal facilities being shut down.
The positive impacts above were partially offset by:
• the unexpected outage and accelerated maintenance program at a customer's upstream facility in the second quarter of 2017; and
• a lower foreign exchange hedge rate used to record United States dollar denominated Canadian Mainline revenues of $1.06 in 2017 compared with $1.07 in 2016.
Fourth quarter performance factors were largely consistent with the year-to-date trends discussed above.
21
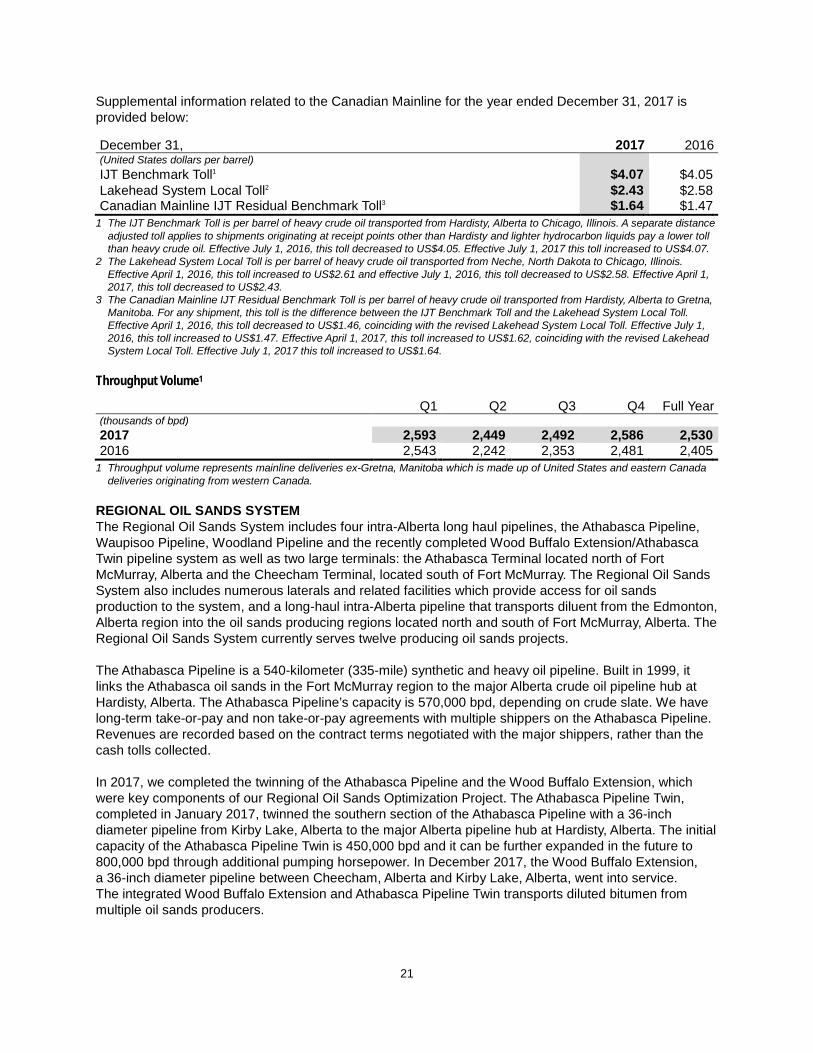
Supplemental information related to the Canadian Mainline for the year ended December 31, 2017 is provided below:
December 31, 2017 2016 (United States dollars per barrel) IJT Benchmark Toll1 $4.07 $4.05 Lakehead System Local Toll2 $2.43 $2.58 Canadian Mainline IJT Residual Benchmark Toll3 $1.64 $1.47
1 The IJT Benchmark Toll is per barrel of heavy crude oil transported from Hardisty, Alberta to Chicago, Illinois. A separate distance adjusted toll applies to shipments originating at receipt points other than Hardisty and lighter hydrocarbon liquids pay a lower toll than heavy crude oil. Effective July 1, 2016, this toll decreased to US$4.05. Effective July 1, 2017 this toll increased to US$4.07.
2 The Lakehead System Local Toll is per barrel of heavy crude oil transported from Neche, North Dakota to Chicago, Illinois. Effective April 1, 2016, this toll increased to US$2.61 and effective July 1, 2016, this toll decreased to US$2.58. Effective April 1, 2017, this toll decreased to US$2.43.
3 The Canadian Mainline IJT Residual Benchmark Toll is per barrel of heavy crude oil transported from Hardisty, Alberta to Gretna, Manitoba. For any shipment, this toll is the difference between the IJT Benchmark Toll and the Lakehead System Local Toll. Effective April 1, 2016, this toll decreased to US$1.46, coinciding with the revised Lakehead System Local Toll. Effective July 1, 2016, this toll increased to US$1.47. Effective April 1, 2017, this toll increased to US$1.62, coinciding with the revised Lakehead System Local Toll. Effective July 1, 2017 this toll increased to US$1.64.
Throughput Volume1
Q1 Q2 Q3 Q4 Full Year (thousands of bpd) 2017 2,593 2,449 2,492 2,586 2,530 2016 2,543 2,242 2,353 2,481 2,405
1 Throughput volume represents mainline deliveries ex-Gretna, Manitoba which is made up of United States and eastern Canada deliveries originating from western Canada.
REGIONAL OIL SANDS SYSTEM The Regional Oil Sands System includes four intra-Alberta long haul pipelines, the Athabasca Pipeline, Waupisoo Pipeline, Woodland Pipeline and the recently completed Wood Buffalo Extension/Athabasca Twin pipeline system as well as two large terminals: the Athabasca Terminal located north of Fort McMurray, Alberta and the Cheecham Terminal, located south of Fort McMurray. The Regional Oil Sands System also includes numerous laterals and related facilities which provide access for oil sands production to the system, and a long-haul intra-Alberta pipeline that transports diluent from the Edmonton, Alberta region into the oil sands producing regions located north and south of Fort McMurray, Alberta. The Regional Oil Sands System currently serves twelve producing oil sands projects. The Athabasca Pipeline is a 540-kilometer (335-mile) synthetic and heavy oil pipeline. Built in 1999, it links the Athabasca oil sands in the Fort McMurray region to the major Alberta crude oil pipeline hub at Hardisty, Alberta. The Athabasca Pipeline’s capacity is 570,000 bpd, depending on crude slate. We have long-term take-or-pay and non take-or-pay agreements with multiple shippers on the Athabasca Pipeline. Revenues are recorded based on the contract terms negotiated with the major shippers, rather than the cash tolls collected. In 2017, we completed the twinning of the Athabasca Pipeline and the Wood Buffalo Extension, which were key components of our Regional Oil Sands Optimization Project. The Athabasca Pipeline Twin, completed in January 2017, twinned the southern section of the Athabasca Pipeline with a 36-inch diameter pipeline from Kirby Lake, Alberta to the major Alberta pipeline hub at Hardisty, Alberta. The initial capacity of the Athabasca Pipeline Twin is 450,000 bpd and it can be further expanded in the future to 800,000 bpd through additional pumping horsepower. In December 2017, the Wood Buffalo Extension, a 36-inch diameter pipeline between Cheecham, Alberta and Kirby Lake, Alberta, went into service. The integrated Wood Buffalo Extension and Athabasca Pipeline Twin transports diluted bitumen from multiple oil sands producers.
22
The Waupisoo Pipeline is a 380-kilometer (236-mile) synthetic and heavy oil pipeline that entered service in 2008 and provides access to the Edmonton market for oil sands producers. The Waupisoo Pipeline originates at the Cheecham Terminal and terminates at the major Alberta pipeline hub at Edmonton. The pipeline has a capacity of 550,000 bpd, depending on the crude slate. We have long-term take-or-pay agreements with multiple shippers on the Waupisoo Pipeline who have collectively contracted for 80% to 90% of the capacity, subject to the timing of when shippers’ commitments commence and expire. The Woodland Pipeline is a 50/50 joint venture between us and Imperial Oil Resources Ventures Limited and ExxonMobil Canada Properties that was constructed in two phases. The first phase, completed in 2013, consists of a 140-kilometer (87-mile) 36-inch diameter pipeline from the Kearl oil sands mine to the Cheecham Terminal, and service on our existing Waupisoo Pipeline from Cheecham to the Edmonton area. The second phase extended the Woodland Pipeline south from our Cheecham Terminal to our Edmonton Terminal. Completed in 2014, the extension involved the construction of a 385-kilometer (239-mile) 36-inch diameter pipeline adding 379,000 bpd of capacity to the Regional Oil Sands System. The Woodland Pipeline is anchored by long-term commitments. The Norlite Pipeline System (Norlite) was placed into service in May 2017, offering a new diluent supply alternative to meet the needs of multiple producers in the Athabasca oil sands region. Norlite is a 24-inch-diameter pipeline, originating at our Stonefell Terminal, in Strathcona County near Edmonton, Alberta, and terminating at our Fort McMurray South facility, near Fort McMurray, Alberta, with a transfer line to Suncor's East Tank Farm. The pipeline has a capacity of approximately 218,000 bpd of diluent, with the potential to be further expanded to approximately 465,000 bpd of capacity with the addition of pump stations. Under an agreement with Keyera Corp. (Keyera), Norlite has the right to access certain existing capacity on Keyera’s pipelines between Edmonton, Alberta and Stonefell, Alberta and, in exchange, Keyera has elected to participate in the new pipeline infrastructure project as a 30% non-operating owner. Norlite is anchored by long-term throughput commitments from a number of oil sands producers. Results of Operations Regional Oil Sands System adjusted EBITDA was $600 million for 2017 compared with $510 million for 2016. Factors impacting Regional Oil Sands System adjusted EBITDA year-over-year include:
• additional EBITDA generated as a result of new projects coming into service in 2017 including the Regional Oil Sands Optimization Project and Norlite Pipeline System, as discussed under Growth Projects; partially offset by
• a decrease to EBITDA due to a change in practice in 2017 whereby we no longer include cash received under certain take-or-pay contracts with make-up rights in our determination of adjusted EBITDA.
Fourth quarter performance factors were largely consistent with the year-to-date trends discussed above. SOUTHERN LIGHTS PIPELINE Southern Lights Pipeline is a fully-contracted single stream pipeline that ships diluent from the Manhattan Terminal near Chicago, Illinois to three western Canadian delivery facilities, located at the Edmonton and Hardisty terminals in Alberta and the Kerrobert terminal in Saskatchewan. This 180,000 bpd 16/18/20-inch diameter pipeline was placed into service in 2010. Both Southern Lights Canada and Southern Lights US receive tariff revenues under long-term contracts with committed shippers. Tariffs provide for recovery of all operating and debt financing costs plus a return on equity of 10%. Southern Lights Pipeline has assigned 10% of the capacity (18,000 bpd) for shippers to ship uncommitted volumes. In addition, we indirectly own all of the Class B units of Southern Lights Canada. As a result, EIPLP holds all the ownership, economic interests and voting rights, direct and indirect, in Southern Lights Canada. Wholly-owned subsidiaries of EIPLP own Southern Lights Class A units, which provide a defined cash flow stream and represent the equity cash flows derived from the core rate base of Southern Lights US until June 30, 2040. Payments are received quarterly, each of which is comprised of return on and return

23
of capital components. The return on capital is included in earnings for the period, and the return of capital reduces the balance of the investment on the Consolidated Statements of Financial Position. Enbridge indirectly owns all of the Class B units of Southern Lights US. Results of Operations Southern Lights Pipeline adjusted EBITDA was comparable year-over-year at $120 million for 2017 and $116 million for 2016. BAKKEN EXPANSION PIPELINE Bakken Expansion Pipeline is the Canadian portion of Enbridge's North Dakota System, which delivers crude oil production from Enbridge’s terminal in North Dakota to Cromer, Manitoba, where products enter the mainline system to be transported to the United States or eastern Canada. We own the Canadian portion of the North Dakota System, and EEP owns the United States portion of the North Dakota System. Bakken Expansion Pipeline is categorized as a Group 2 pipeline, and as such its tolls are regulated by the NEB on a complaint basis. Tolls are based on long-term take-or-pay agreements with anchor shippers. Results of Operations Bakken Expansion Pipeline adjusted EBITDA was comparable year-over-year at $28 million for 2017 and $32 million for 2016. FEEDER PIPELINES AND OTHER Feeder Pipelines and Other includes the Hardisty Contract Terminal and Hardisty Storage Caverns located near Hardisty, Alberta, a key crude oil pipeline hub in western Canada. Also reported in Feeder Pipelines and Other results for 2016 are contributions from the South Prairie Region assets which transport crude oil and NGL from producing fields and facilities in southeastern Saskatchewan and southwestern Manitoba to Cromer, Manitoba, where products enter the mainline system to be transported to the United States or eastern Canada. On December 1, 2016, we sold the South Prairie Region assets within Feeder Pipelines and Other to an unrelated party for cash proceeds of $1.08 billion. Results of Operations Feeder Pipelines and Other adjusted EBITDA was $59 million for 2017 compared with $132 million for 2016. Factors impacting Feeder Pipelines and Other adjusted EBITDA year-over-year include:
• the absence of EBITDA from the South Prairie Region assets that were sold in December 2016. BUSINESS RISKS The risks identified below are specific to Liquids Pipelines. General risks that affect EIPLP as a whole are described under Risk Management and Financial Instruments – General Business Risks. Asset Utilization We are exposed to throughput risk under the CTS on the Canadian Mainline and under certain tolling agreements applicable to other liquids pipelines assets and the Lakehead Mainline System owned by EEP. A decrease in volumes transported can directly and adversely affect revenues and earnings. Factors such as changing market fundamentals, capacity bottlenecks, operational incidents, regulatory restrictions, system maintenance and increased competition can all impact the utilization of the liquids pipelines assets.
24
Market fundamentals, such as commodity prices and price differentials, weather, gasoline prices and consumption, alternative energy sources and global supply disruptions outside of our control can impact both the supply of and demand for crude oil and other liquid hydrocarbons transported on our pipelines. However, the long-term outlook for Canadian crude oil production, particularly from western Canada, and increasing United States domestic production indicates a growing source of potential supply of crude oil. We seek to mitigate utilization risks within our control. The market access expansion initiatives, which have had components placed into service over the past several years, and those currently under development have and are expected to further reduce capacity bottlenecks and enhance access to markets for customers. We also seek to optimize capacity and throughput on our existing assets by working with the shipper community to enhance scheduling efficiency and communications, as well as make continuous improvements to scheduling models and timelines to maximize throughput. We are also undertaking the Canadian L3R Program, which upon completion, will support the safety and operational reliability of the overall system and enhance the flexibility on the mainline system allowing us to restore the original capacity. Throughput risk is partially mitigated by provisions in the CTS agreement, which allow us to negotiate an amendment to the agreement in the event certain minimum threshold volumes are not met on the Canadian Mainline. Once the Canadian L3R Program is placed into service, the applicable surcharge may be adjusted if volumes fall below defined thresholds. Interdependence with the Lakehead System Enbridge’s mainline system is an integrated system which transports liquids hydrocarbons between receipt and delivery points across Canada and the United States. The integration of the Canadian Mainline and Enbridge’s Lakehead System results in an interdependence of the two systems, such that operational factors on one system may impact the other system. Such factors may include, but are not limited to, volume throughput increases or decreases, capacity bottlenecks, operational incidents, regulatory restrictions or system maintenance. Any such factor, individually, in combination or over a prolonged period of time, could have a material adverse effect on our cash flows or the financial condition and therefore could impact distributions. The CTS framework also results in the Lakehead System having an impact on revenues generated by the Canadian Mainline. Since the Lakehead System local tolls are determined under a tolling agreement which is separate from CTS, changes in the Canadian Mainline IJT Residual Benchmark Toll are inversely related to Lakehead System local tolls. Operational and Economic Regulation Operational regulation risks relate to failing to comply with applicable operational rules and regulations from government organizations and could result in fines or operating restrictions or an overall increase in operating and compliance costs. Regulatory scrutiny over the integrity of liquids pipelines assets has the potential to increase operating costs or limit future projects. Potential regulatory changes could have an impact on our future earnings and the cost related to the construction of new projects. The Manager believes operational regulation risk is mitigated by active monitoring and consulting on potential regulatory requirement changes with the respective regulators or through industry associations. We also develop robust response plans to regulatory changes or enforcement actions. While the Manager believes the safe and reliable operation of its assets and adherence to existing regulations is the best approach to managing operational regulatory risk, the potential remains for regulators to make unilateral decisions that could have a financial impact on us. Our liquids pipelines also face economic regulatory risk. Broadly defined, economic regulation risk is the risk regulators or other government entities change or reject proposed or existing commercial arrangements including permits and regulatory approvals for new projects. The Canadian Mainline, Enbridge’s Lakehead System and other liquids pipelines are subject to the actions of various regulators, including the NEB, with respect to the tariffs and tolls of those operations. The changing or rejecting of commercial arrangements, including decisions by regulators on the applicable tariff structure or changes in interpretations of existing regulations by courts or regulators, could have an adverse effect on our
25
revenues and earnings. Delays in regulatory approvals could result in cost escalations and construction delays, which also negatively impact our operations. The Manager believes that economic regulatory risk is reduced through the negotiation of long-term agreements with shippers that govern the majority of our liquids pipeline assets. The Manager also involves its legal and regulatory teams in the review of new projects to ensure compliance with applicable regulations as well as in the establishment of tariffs and tolls on new and existing pipelines. However, despite the efforts to mitigate economic regulation risk, there remains a risk that a regulator could overturn long-term agreements between us and shippers or deny the approval and permits for new projects. Competition Competition may result in a reduction in demand for our services, fewer project opportunities or assumption of risk that results in weaker or more volatile financial performance than expected. Competition among existing pipelines is based primarily on the cost of transportation, access to supply, the quality and reliability of service, contract carrier alternatives and proximity to markets. Other competing carriers available to ship western Canadian liquid hydrocarbons to markets in Canada, the United States and internationally represent competition to our liquids pipelines network, including those held by us. Competition also arises from proposed pipelines that seek to access markets currently served by our liquids pipelines, such as proposed projects enhancing infrastructure in the Alberta regional oil sands market. Competition also exists from proposed projects enhancing infrastructure in the Alberta regional oil sands market. The Bakken systems also face competition from existing competing pipelines, proposed future pipelines and existing and alternative gathering facilities. Additionally, volatile crude price differentials and insufficient pipeline capacity on either our pipelines or other competitor pipelines can make transportation of crude oil by rail competitive, particularly to markets not currently serviced by pipelines. The Manager believes that liquids pipelines continue to provide attractive options to producers in the WCSB due to its competitive tolls and flexibility through its multiple delivery and storage points. Our current growth project to enhance capacity on our pipeline system combined with our commitment to project execution is expected to further provide shippers reliable and long-term competitive solutions for oil transportation. Our existing right-of-way for the mainline system also provides a competitive advantage as it can be difficult and costly to obtain rights of way for new pipelines traversing new areas. We also employ long-term agreements with shippers, which mitigate competition risk by ensuring consistent supply to our liquids pipelines network. Foreign Exchange and Commodity Price Risk The CTS agreement for the Canadian Mainline exposes us to risks related to movements in foreign exchange rates and commodity prices. Foreign exchange risk arises as the IJT under the CTS is charged in United States dollars. These risks have been substantially managed through Enbridge’s enterprise-wide hedging program by using financial contracts to fix the prices of United States dollars and to mitigate commodity price risk. Certain of these financial contracts do not qualify for cash flow hedge accounting and, therefore, our earnings are exposed to associated changes in the mark-to-market value of these contracts. Commodity Prices Current oil sands production is very robust and is expected to grow in the future as producers actively improve the competitiveness of their existing projects; however, prolonged low prices negatively impact producers' balance sheets and their ability to invest. Sanctioned projects due to come on stream in the next 24 months are not as sensitive to short-term declines in crude oil prices, as investment commitments have already been made. A protracted long-term outlook for low crude oil prices could result in delay or cancellation of future projects. Wide commodity price basis between western Canada and global tidewater markets have also negatively impacted producer netbacks and margins in the past years that
26
largely resulted from pipeline infrastructure takeaway capacity from producing regions in western Canada and North Dakota operating at capacity. The tight oil plays of western Canada and the Bakken region of North Dakota have short cycle break-even time horizons, typically less than 24 months, and high decline rates that can be well managed through active hedging programs and are positioned to react quickly at market signals. Accordingly, during periods of comparatively low prices, drilling programs, unsupported by hedging programs, will be reduced and as such supply growth from tight oil basins may be lower, which may impact volumes on our pipeline systems. Renewal of Line 5 Easement On January 4, 2017, the Tribal Council of the Bad River Band of Lake Superior Tribe of Chippewa Indians (the Band) issued a press release indicating that the Band had passed a resolution not to renew its interest in certain Line 5 easements through the Bad River Reservation. Line 5 is included within Enbridge’s mainline system and it runs from Superior, Wisconsin to Sarnia, Ontario. The Canadian portion of Line 5 is owned by EIPLP and is located within the Canadian Mainline. The Band’s resolution calls for decommissioning and removal of the pipeline from all Bad River tribal lands and watershed. The Tribal Resolution may impact our ability to operate the Canadian portion of Line 5. Since the Band passed the resolution, the parties have agreed to ongoing discussions with the objective of understanding and resolving the Band’s concerns on a long-term basis. GAS PIPELINES EARNINGS BEFORE INTEREST, INCOME TAXES AND DEPRECIATION AND AMORTIZATION
2017 2016 (millions of Canadian dollars) Gas Pipelines 205 184 Adjusted earnings before interest, income taxes and depreciation and
amortization 205
184
Changes in unrealized derivative fair value gains 8 10 Earnings before interest, income taxes and depreciation and amortization 213 194
Additional details on items impacting Gas Pipelines EBITDA include:
• Gas Pipelines EBITDA for each year reflected net fair value gains arising from the change in the mark-to-market of derivative financial instruments used to manage foreign exchange exposures associated with United States dollar denominated distributions from Alliance Pipeline.
ALLIANCE PIPELINE SYSTEM Gas Pipelines consists of our 50% interest in the Alliance Pipeline, a 3,000-kilometer natural gas mainline pipeline and approximately 860 kilometers of lateral pipelines and related infrastructure. The Alliance Pipeline begins near Aiken Creek, British Columbia and crosses the Canada/United States border near Elmore, Saskatchewan, where it continues to the Aux Sable gas processing plant near Chicago, Illinois and the Alliance Chicago gas exchange hub. Alliance Pipeline has annual firm transportation service shipping contract capacity of 1,325 million cubic feet per day (mmcf/d) in Canada and 1,455 mmcf/d in the United States, respectively. Alliance Pipeline New Services Framework The Alliance Pipeline has tolls and tariffs regulated by the NEB in Canada and the FERC in the United States. In December 2015, Alliance Pipeline implemented a new services framework and the related tolls and tariff provisions (collectively, the New Services Framework). Pursuant to the New Services Framework, Alliance Pipeline retains exposure to potential variability in certain future costs and revenues.
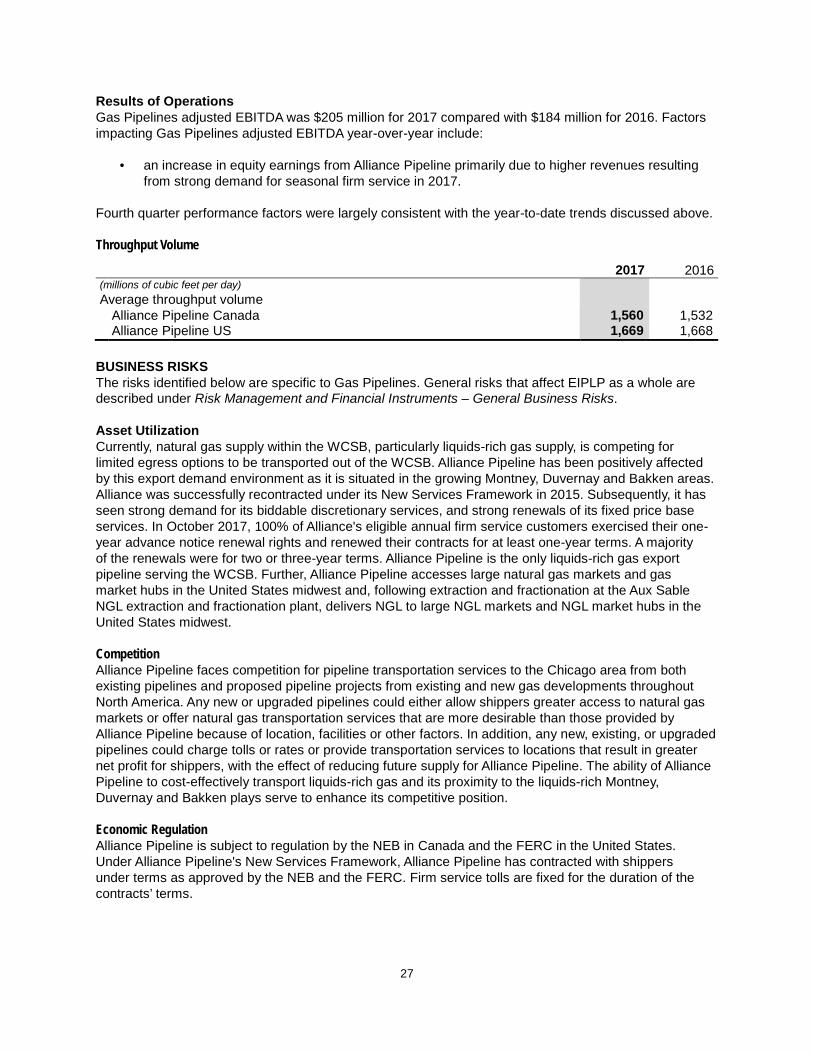
27
Results of Operations Gas Pipelines adjusted EBITDA was $205 million for 2017 compared with $184 million for 2016. Factors impacting Gas Pipelines adjusted EBITDA year-over-year include:
• an increase in equity earnings from Alliance Pipeline primarily due to higher revenues resulting from strong demand for seasonal firm service in 2017.
Fourth quarter performance factors were largely consistent with the year-to-date trends discussed above. Throughput Volume
2017 2016 (millions of cubic feet per day) Average throughput volume Alliance Pipeline Canada 1,560 1,532 Alliance Pipeline US 1,669 1,668
BUSINESS RISKS The risks identified below are specific to Gas Pipelines. General risks that affect EIPLP as a whole are described under Risk Management and Financial Instruments – General Business Risks. Asset Utilization Currently, natural gas supply within the WCSB, particularly liquids-rich gas supply, is competing for limited egress options to be transported out of the WCSB. Alliance Pipeline has been positively affected by this export demand environment as it is situated in the growing Montney, Duvernay and Bakken areas. Alliance was successfully recontracted under its New Services Framework in 2015. Subsequently, it has seen strong demand for its biddable discretionary services, and strong renewals of its fixed price base services. In October 2017, 100% of Alliance's eligible annual firm service customers exercised their one-year advance notice renewal rights and renewed their contracts for at least one-year terms. A majority of the renewals were for two or three-year terms. Alliance Pipeline is the only liquids-rich gas export pipeline serving the WCSB. Further, Alliance Pipeline accesses large natural gas markets and gas market hubs in the United States midwest and, following extraction and fractionation at the Aux Sable NGL extraction and fractionation plant, delivers NGL to large NGL markets and NGL market hubs in the United States midwest. Competition Alliance Pipeline faces competition for pipeline transportation services to the Chicago area from both existing pipelines and proposed pipeline projects from existing and new gas developments throughout North America. Any new or upgraded pipelines could either allow shippers greater access to natural gas markets or offer natural gas transportation services that are more desirable than those provided by Alliance Pipeline because of location, facilities or other factors. In addition, any new, existing, or upgraded pipelines could charge tolls or rates or provide transportation services to locations that result in greater net profit for shippers, with the effect of reducing future supply for Alliance Pipeline. The ability of Alliance Pipeline to cost-effectively transport liquids-rich gas and its proximity to the liquids-rich Montney, Duvernay and Bakken plays serve to enhance its competitive position. Economic Regulation Alliance Pipeline is subject to regulation by the NEB in Canada and the FERC in the United States. Under Alliance Pipeline's New Services Framework, Alliance Pipeline has contracted with shippers under terms as approved by the NEB and the FERC. Firm service tolls are fixed for the duration of the contracts’ terms.
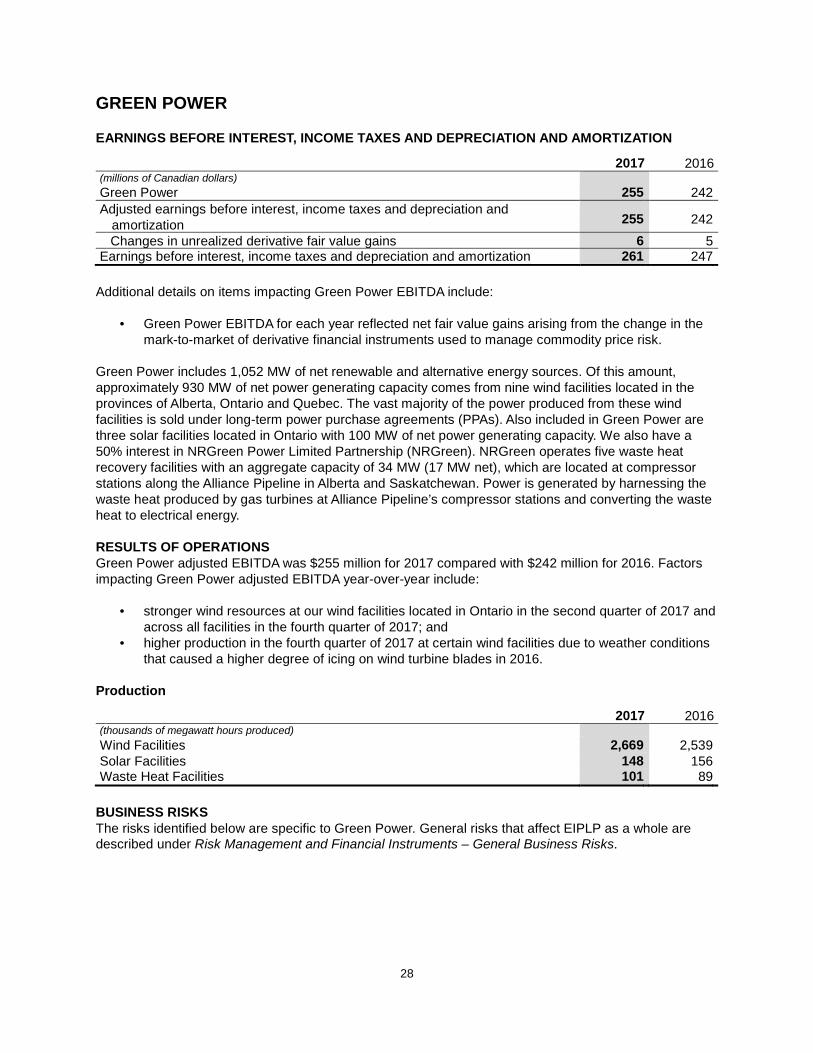
28
GREEN POWER EARNINGS BEFORE INTEREST, INCOME TAXES AND DEPRECIATION AND AMORTIZATION
2017 2016 (millions of Canadian dollars) Green Power 255 242 Adjusted earnings before interest, income taxes and depreciation and
amortization 255
242
Changes in unrealized derivative fair value gains 6 5 Earnings before interest, income taxes and depreciation and amortization 261 247
Additional details on items impacting Green Power EBITDA include:
• Green Power EBITDA for each year reflected net fair value gains arising from the change in the mark-to-market of derivative financial instruments used to manage commodity price risk.
Green Power includes 1,052 MW of net renewable and alternative energy sources. Of this amount, approximately 930 MW of net power generating capacity comes from nine wind facilities located in the provinces of Alberta, Ontario and Quebec. The vast majority of the power produced from these wind facilities is sold under long-term power purchase agreements (PPAs). Also included in Green Power are three solar facilities located in Ontario with 100 MW of net power generating capacity. We also have a 50% interest in NRGreen Power Limited Partnership (NRGreen). NRGreen operates five waste heat recovery facilities with an aggregate capacity of 34 MW (17 MW net), which are located at compressor stations along the Alliance Pipeline in Alberta and Saskatchewan. Power is generated by harnessing the waste heat produced by gas turbines at Alliance Pipeline’s compressor stations and converting the waste heat to electrical energy. RESULTS OF OPERATIONS Green Power adjusted EBITDA was $255 million for 2017 compared with $242 million for 2016. Factors impacting Green Power adjusted EBITDA year-over-year include:
• stronger wind resources at our wind facilities located in Ontario in the second quarter of 2017 and across all facilities in the fourth quarter of 2017; and
• higher production in the fourth quarter of 2017 at certain wind facilities due to weather conditions that caused a higher degree of icing on wind turbine blades in 2016.
Production
2017 2016 (thousands of megawatt hours produced) Wind Facilities 2,669 2,539 Solar Facilities 148 156 Waste Heat Facilities 101 89
BUSINESS RISKS The risks identified below are specific to Green Power. General risks that affect EIPLP as a whole are described under Risk Management and Financial Instruments – General Business Risks.
29
Asset Utilization Earnings from our wind and solar assets are highly dependent on weather and atmospheric conditions as well as continued operational availability. While the expected energy yields for the Green Power assets are predicted using long-term historical data, wind and solar resources are subject to natural variation from year to year and from season to season. Any prolonged reduction in wind or solar resources at any of our facilities could lead to a decrease in our earnings and cash flows. Additionally, inefficiencies or interruptions of Green Power facilities due to operational disturbances or outages resulting from weather conditions or other factors could also impact earnings. We mitigate the risk of operational availability by establishing Operations and Maintenance contracts with the original equipment manufacturers that include a negotiated operational performance asset and monitoring the operational performance and reliability of the assets on a 24-hour basis. Power produced from Green Power assets is also often sold under PPAs or other long-term pricing arrangements to a single counterparty. The majority of power sold under our PPAs is contracted with Hydro-Quebec or the Independent Electricity System Operator of Ontario (IESO). In this respect, the performance of the Green Power assets is dependent on each counterparty performing its contractual obligations under the PPA or pricing arrangement applicable to it. Competition Green Power operates in the Canadian power market, which is subject to competition and the supply and demand balance for power in the provinces in which they operate. The renewable energy market sector includes large utilities and small independent power producers, which are expected to aggressively compete with the Manager for project development opportunities. Regulatory Specific to our wind facilities located in the province of Ontario, renewable generators are classified as intermittent generators under the IESO Market Rules. Amendments to the IESO Market Rules were passed on November 29, 2012, to allow for curtailment of intermittent generators in times of surplus base-load generation. EIPLP and other renewable power generators reached an agreement with the IESO in February 2013 to amend certain existing PPAs to include both annual and contract term curtailment caps beyond which renewable power generators will be compensated for forgone production. Uncompensated curtailment impacts less than 1% of the operating hours of the Ontario wind facilities and is expected to remain consistent over the life of the PPAs. Transmission Systems The ability of Green Power assets to deliver power is impacted by the availability of, and access to, interconnection facilities and transmission systems. The inability to access or unavailability of such systems, the operational failure of such systems or the lack of adequate capacity on them could have an adverse impact on our ability to deliver power to counterparties or the requirement of counterparties to pay for energy delivery under various contracts, which in turn could have an adverse effect on our cash flows or financial condition.
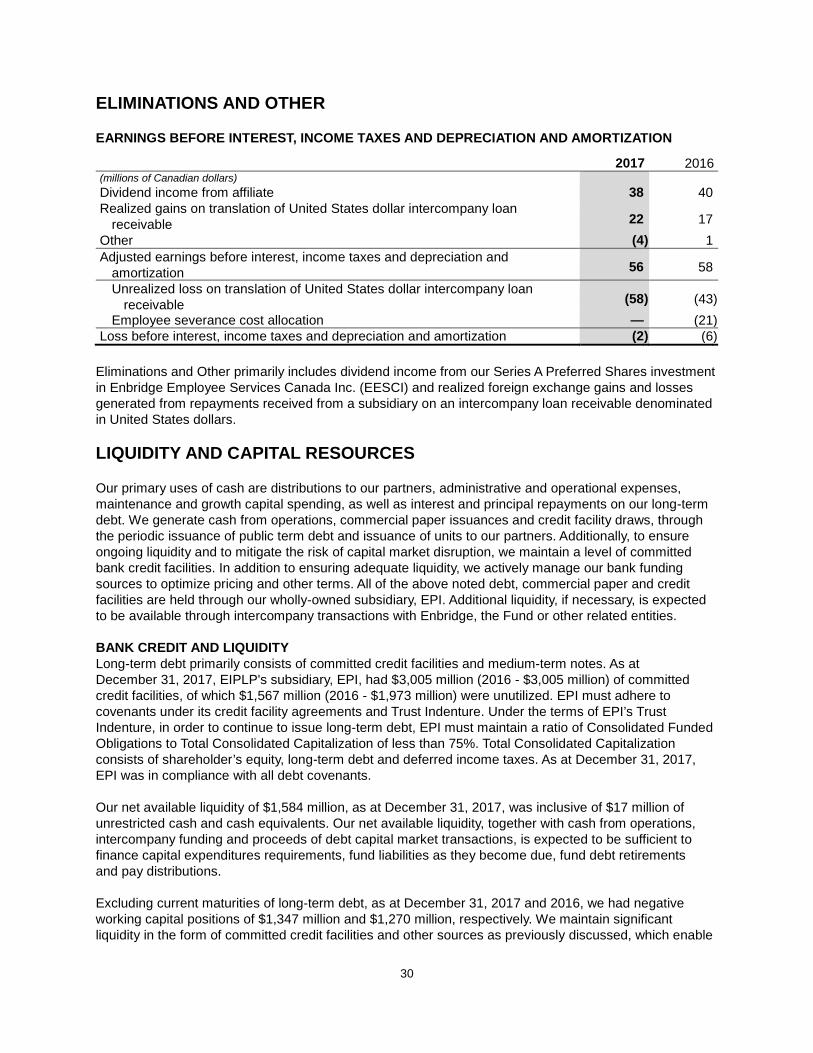
30
ELIMINATIONS AND OTHER EARNINGS BEFORE INTEREST, INCOME TAXES AND DEPRECIATION AND AMORTIZATION
2017 2016 (millions of Canadian dollars) Dividend income from affiliate 38 40 Realized gains on translation of United States dollar intercompany loan
receivable 22
17
Other (4 ) 1 Adjusted earnings before interest, income taxes and depreciation and
amortization 56
58
Unrealized loss on translation of United States dollar intercompany loan receivable (58 ) (43 )
Employee severance cost allocation — (21 ) Loss before interest, income taxes and depreciation and amortization (2 ) (6 )
Eliminations and Other primarily includes dividend income from our Series A Preferred Shares investment in Enbridge Employee Services Canada Inc. (EESCI) and realized foreign exchange gains and losses generated from repayments received from a subsidiary on an intercompany loan receivable denominated in United States dollars. LIQUIDITY AND CAPITAL RESOURCES Our primary uses of cash are distributions to our partners, administrative and operational expenses, maintenance and growth capital spending, as well as interest and principal repayments on our long-term debt. We generate cash from operations, commercial paper issuances and credit facility draws, through the periodic issuance of public term debt and issuance of units to our partners. Additionally, to ensure ongoing liquidity and to mitigate the risk of capital market disruption, we maintain a level of committed bank credit facilities. In addition to ensuring adequate liquidity, we actively manage our bank funding sources to optimize pricing and other terms. All of the above noted debt, commercial paper and credit facilities are held through our wholly-owned subsidiary, EPI. Additional liquidity, if necessary, is expected to be available through intercompany transactions with Enbridge, the Fund or other related entities. BANK CREDIT AND LIQUIDITY Long-term debt primarily consists of committed credit facilities and medium-term notes. As at December 31, 2017, EIPLP's subsidiary, EPI, had $3,005 million (2016 - $3,005 million) of committed credit facilities, of which $1,567 million (2016 - $1,973 million) were unutilized. EPI must adhere to covenants under its credit facility agreements and Trust Indenture. Under the terms of EPI’s Trust Indenture, in order to continue to issue long-term debt, EPI must maintain a ratio of Consolidated Funded Obligations to Total Consolidated Capitalization of less than 75%. Total Consolidated Capitalization consists of shareholder’s equity, long-term debt and deferred income taxes. As at December 31, 2017, EPI was in compliance with all debt covenants. Our net available liquidity of $1,584 million, as at December 31, 2017, was inclusive of $17 million of unrestricted cash and cash equivalents. Our net available liquidity, together with cash from operations, intercompany funding and proceeds of debt capital market transactions, is expected to be sufficient to finance capital expenditures requirements, fund liabilities as they become due, fund debt retirements and pay distributions. Excluding current maturities of long-term debt, as at December 31, 2017 and 2016, we had negative working capital positions of $1,347 million and $1,270 million, respectively. We maintain significant liquidity in the form of committed credit facilities and other sources as previously discussed, which enable
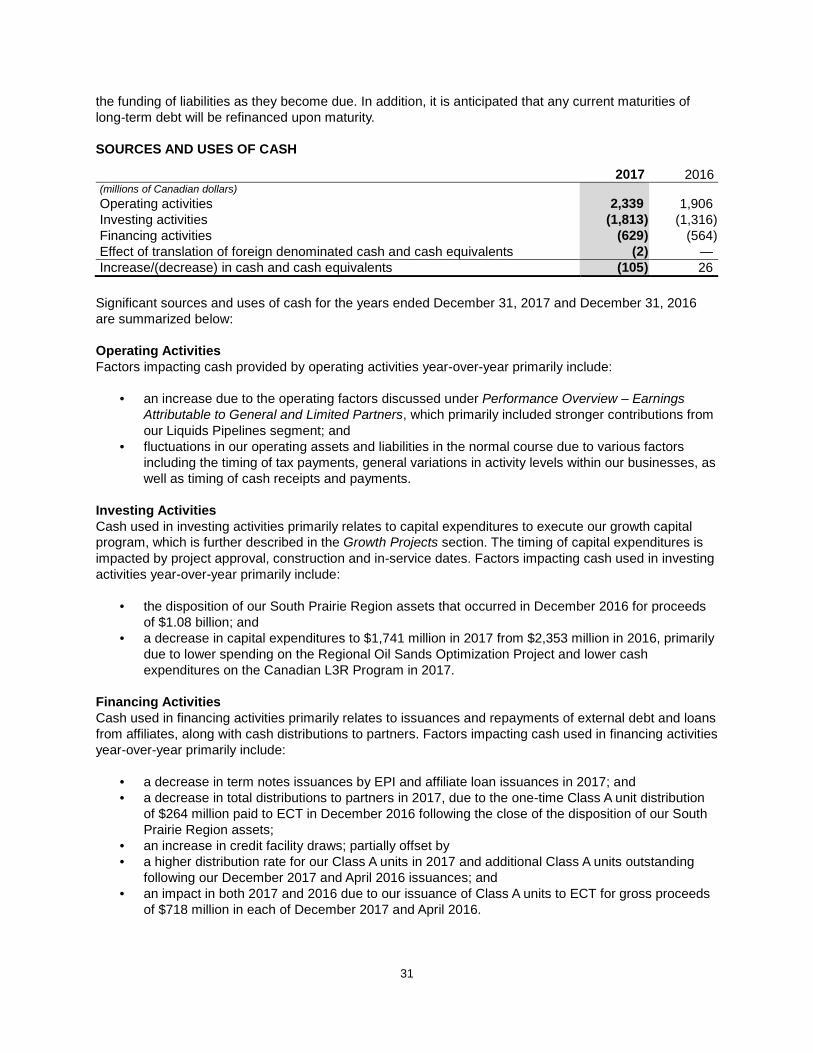
31
the funding of liabilities as they become due. In addition, it is anticipated that any current maturities of long-term debt will be refinanced upon maturity. SOURCES AND USES OF CASH
2017 2016 (millions of Canadian dollars) Operating activities 2,339 1,906 Investing activities (1,813 ) (1,316 ) Financing activities (629 ) (564 ) Effect of translation of foreign denominated cash and cash equivalents (2 ) — Increase/(decrease) in cash and cash equivalents (105 ) 26
Significant sources and uses of cash for the years ended December 31, 2017 and December 31, 2016 are summarized below: Operating Activities Factors impacting cash provided by operating activities year-over-year primarily include:
• an increase due to the operating factors discussed under Performance Overview – Earnings Attributable to General and Limited Partners, which primarily included stronger contributions from our Liquids Pipelines segment; and
• fluctuations in our operating assets and liabilities in the normal course due to various factors including the timing of tax payments, general variations in activity levels within our businesses, as well as timing of cash receipts and payments.
Investing Activities Cash used in investing activities primarily relates to capital expenditures to execute our growth capital program, which is further described in the Growth Projects section. The timing of capital expenditures is impacted by project approval, construction and in-service dates. Factors impacting cash used in investing activities year-over-year primarily include:
• the disposition of our South Prairie Region assets that occurred in December 2016 for proceeds of $1.08 billion; and
• a decrease in capital expenditures to $1,741 million in 2017 from $2,353 million in 2016, primarily due to lower spending on the Regional Oil Sands Optimization Project and lower cash expenditures on the Canadian L3R Program in 2017.
Financing Activities Cash used in financing activities primarily relates to issuances and repayments of external debt and loans from affiliates, along with cash distributions to partners. Factors impacting cash used in financing activities year-over-year primarily include:
• a decrease in term notes issuances by EPI and affiliate loan issuances in 2017; and • a decrease in total distributions to partners in 2017, due to the one-time Class A unit distribution
of $264 million paid to ECT in December 2016 following the close of the disposition of our South Prairie Region assets;
• an increase in credit facility draws; partially offset by • a higher distribution rate for our Class A units in 2017 and additional Class A units outstanding
following our December 2017 and April 2016 issuances; and • an impact in both 2017 and 2016 due to our issuance of Class A units to ECT for gross proceeds
of $718 million in each of December 2017 and April 2016.

32
Distributions The following tables summarize the cash and non-cash distributions declared by EIPLP for the years ended December 31, 2017, 2016 and 2015, and the quarters therein, as applicable. Class A Units
2017 2016 2015
Distribution Total
Distribution Total
Distribution Total per Unit1 per Unit1 per Unit1
(millions of Canadian dollars, except distribution rate)
Three months ended March 31, 0.5760 220 0.5585 199 0.4938 121 Three months ended June 30, 0.5760 220 0.5667 217 0.4938 121 Three months ended September 30, 0.5760 220 0.5667 217 0.4919 135 Three months ended December 31, 0.5760 226 0.5667 217 0.4874 169 Year ended December 31, 2.3040 886 2.2586 850 1.9669 546
1 Class A unit distributions are declared monthly and paid in cash in the following month.
In December 2016, we also paid a one-time Class A unit distribution to ECT of $0.6933 per unit or $264 million following the close of the disposition of the South Prairie Region assets. Class C Units
2017 2016 2015
Distribution Total
Distribution Total
Distribution Total per Unit1 per Unit1 per Unit1
(millions of Canadian dollars, except distribution rate)
Three months ended March 31, 0.5376 238 0.5376 237 — — Three months ended June 30, 0.5376 238 0.5376 239 — — Three months ended September 30, 0.5376 238 0.5376 238 0.1574 70 Three months ended December 31, 0.5376 238 0.5376 238 0.4723 209 Year ended December 31, 2.1504 952 2.1504 952 0.6297 279
1 Class C unit distributions are declared monthly and paid in cash in the following month. Class C units were first issued on September 1, 2015.
Class D Units
2017 2016 2015
Distribution Distribution Distribution Total per Unit1 Total per Unit1 Total per Unit1
(millions of Canadian dollars, except distribution rate)
Three months ended March 31, 0.5376 6 0.5376 1 — — Three months ended June 30, 0.5376 7 0.5376 3 — — Three months ended September 30, 0.5376 9 0.5376 4 — — Three months ended December 31, 0.5376 10 0.5376 5 0.4723 1 Year ended December 31, 2.1504 32 2.1504 13 0.4723 1
1 Class D unit distributions are declared monthly and paid-in-kind with the issuance of additional Class D units in the following month. Class D units were first issued in October 2015 pursuant to the first payment of TPDR distributions of the SIR.
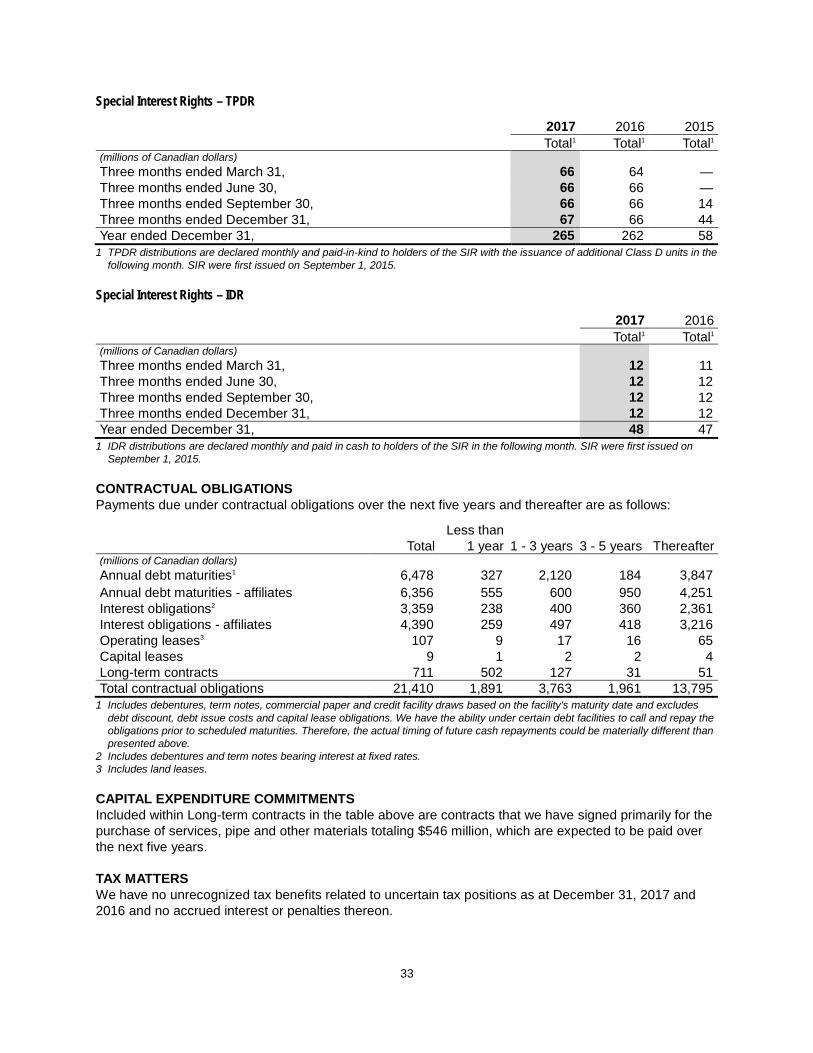
33
Special Interest Rights – TPDR
2017 2016 2015 Total1 Total1 Total1 (millions of Canadian dollars) Three months ended March 31, 66 64 — Three months ended June 30, 66 66 — Three months ended September 30, 66 66 14 Three months ended December 31, 67 66 44 Year ended December 31, 265 262 58
1 TPDR distributions are declared monthly and paid-in-kind to holders of the SIR with the issuance of additional Class D units in the following month. SIR were first issued on September 1, 2015.
Special Interest Rights – IDR
2017 2016 Total1 Total1 (millions of Canadian dollars) Three months ended March 31, 12 11 Three months ended June 30, 12 12 Three months ended September 30, 12 12 Three months ended December 31, 12 12 Year ended December 31, 48 47
1 IDR distributions are declared monthly and paid in cash to holders of the SIR in the following month. SIR were first issued on September 1, 2015.
CONTRACTUAL OBLIGATIONS Payments due under contractual obligations over the next five years and thereafter are as follows:
Less than Total 1 year 1 - 3 years 3 - 5 years Thereafter (millions of Canadian dollars) Annual debt maturities1 6,478 327 2,120 184 3,847 Annual debt maturities - affiliates 6,356 555 600 950 4,251 Interest obligations2 3,359 238 400 360 2,361 Interest obligations - affiliates 4,390 259 497 418 3,216 Operating leases3 107 9 17 16 65 Capital leases 9 1 2 2 4 Long-term contracts 711 502 127 31 51 Total contractual obligations 21,410 1,891 3,763 1,961 13,795
1 Includes debentures, term notes, commercial paper and credit facility draws based on the facility's maturity date and excludes debt discount, debt issue costs and capital lease obligations. We have the ability under certain debt facilities to call and repay the obligations prior to scheduled maturities. Therefore, the actual timing of future cash repayments could be materially different than presented above.
2 Includes debentures and term notes bearing interest at fixed rates. 3 Includes land leases. CAPITAL EXPENDITURE COMMITMENTS Included within Long-term contracts in the table above are contracts that we have signed primarily for the purchase of services, pipe and other materials totaling $546 million, which are expected to be paid over the next five years. TAX MATTERS We have no unrecognized tax benefits related to uncertain tax positions as at December 31, 2017 and 2016 and no accrued interest or penalties thereon.
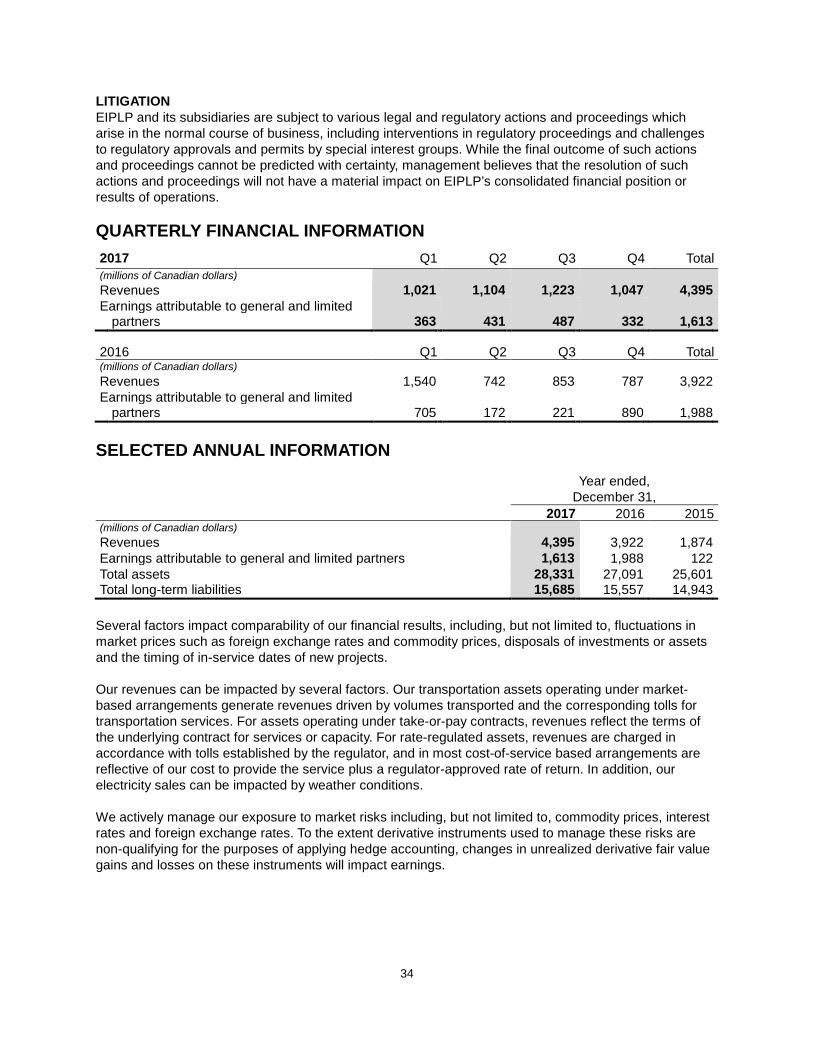
34
LITIGATION EIPLP and its subsidiaries are subject to various legal and regulatory actions and proceedings which arise in the normal course of business, including interventions in regulatory proceedings and challenges to regulatory approvals and permits by special interest groups. While the final outcome of such actions and proceedings cannot be predicted with certainty, management believes that the resolution of such actions and proceedings will not have a material impact on EIPLP’s consolidated financial position or results of operations. QUARTERLY FINANCIAL INFORMATION 2017 Q1 Q2 Q3 Q4 Total (millions of Canadian dollars) Revenues 1,021 1,104 1,223 1,047 4,395 Earnings attributable to general and limited partners 363 431 487 332 1,613
2016 Q1 Q2 Q3 Q4 Total (millions of Canadian dollars) Revenues 1,540 742 853 787 3,922 Earnings attributable to general and limited partners 705 172 221 890 1,988
SELECTED ANNUAL INFORMATION Year ended, December 31, 2017 2016 2015 (millions of Canadian dollars) Revenues 4,395 3,922 1,874 Earnings attributable to general and limited partners 1,613 1,988 122 Total assets 28,331 27,091 25,601 Total long-term liabilities 15,685 15,557 14,943
Several factors impact comparability of our financial results, including, but not limited to, fluctuations in market prices such as foreign exchange rates and commodity prices, disposals of investments or assets and the timing of in-service dates of new projects. Our revenues can be impacted by several factors. Our transportation assets operating under market-based arrangements generate revenues driven by volumes transported and the corresponding tolls for transportation services. For assets operating under take-or-pay contracts, revenues reflect the terms of the underlying contract for services or capacity. For rate-regulated assets, revenues are charged in accordance with tolls established by the regulator, and in most cost-of-service based arrangements are reflective of our cost to provide the service plus a regulator-approved rate of return. In addition, our electricity sales can be impacted by weather conditions. We actively manage our exposure to market risks including, but not limited to, commodity prices, interest rates and foreign exchange rates. To the extent derivative instruments used to manage these risks are non-qualifying for the purposes of applying hedge accounting, changes in unrealized derivative fair value gains and losses on these instruments will impact earnings.
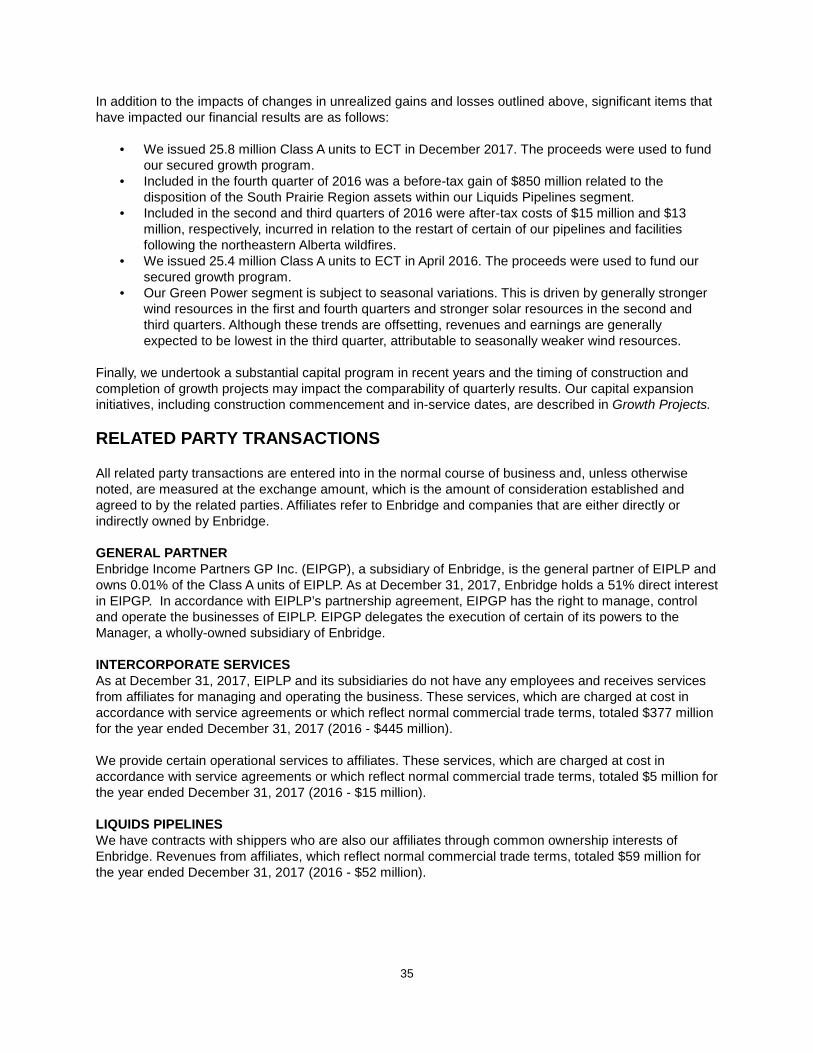
35
In addition to the impacts of changes in unrealized gains and losses outlined above, significant items that have impacted our financial results are as follows:
• We issued 25.8 million Class A units to ECT in December 2017. The proceeds were used to fund our secured growth program.
• Included in the fourth quarter of 2016 was a before-tax gain of $850 million related to the disposition of the South Prairie Region assets within our Liquids Pipelines segment.
• Included in the second and third quarters of 2016 were after-tax costs of $15 million and $13 million, respectively, incurred in relation to the restart of certain of our pipelines and facilities following the northeastern Alberta wildfires.
• We issued 25.4 million Class A units to ECT in April 2016. The proceeds were used to fund our secured growth program.
• Our Green Power segment is subject to seasonal variations. This is driven by generally stronger wind resources in the first and fourth quarters and stronger solar resources in the second and third quarters. Although these trends are offsetting, revenues and earnings are generally expected to be lowest in the third quarter, attributable to seasonally weaker wind resources.
Finally, we undertook a substantial capital program in recent years and the timing of construction and completion of growth projects may impact the comparability of quarterly results. Our capital expansion initiatives, including construction commencement and in-service dates, are described in Growth Projects. RELATED PARTY TRANSACTIONS All related party transactions are entered into in the normal course of business and, unless otherwise noted, are measured at the exchange amount, which is the amount of consideration established and agreed to by the related parties. Affiliates refer to Enbridge and companies that are either directly or indirectly owned by Enbridge. GENERAL PARTNER Enbridge Income Partners GP Inc. (EIPGP), a subsidiary of Enbridge, is the general partner of EIPLP and owns 0.01% of the Class A units of EIPLP. As at December 31, 2017, Enbridge holds a 51% direct interest in EIPGP. In accordance with EIPLP’s partnership agreement, EIPGP has the right to manage, control and operate the businesses of EIPLP. EIPGP delegates the execution of certain of its powers to the Manager, a wholly-owned subsidiary of Enbridge. INTERCORPORATE SERVICES As at December 31, 2017, EIPLP and its subsidiaries do not have any employees and receives services from affiliates for managing and operating the business. These services, which are charged at cost in accordance with service agreements or which reflect normal commercial trade terms, totaled $377 million for the year ended December 31, 2017 (2016 - $445 million). We provide certain operational services to affiliates. These services, which are charged at cost in accordance with service agreements or which reflect normal commercial trade terms, totaled $5 million for the year ended December 31, 2017 (2016 - $15 million). LIQUIDS PIPELINES We have contracts with shippers who are also our affiliates through common ownership interests of Enbridge. Revenues from affiliates, which reflect normal commercial trade terms, totaled $59 million for the year ended December 31, 2017 (2016 - $52 million).
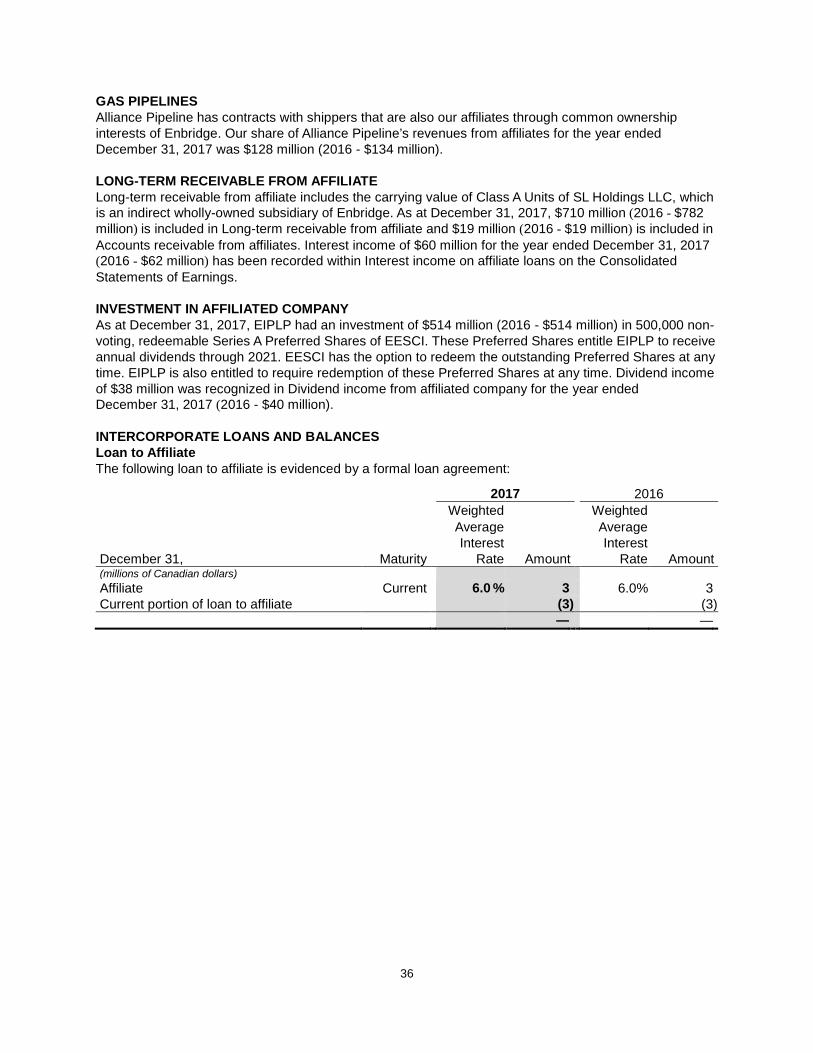
36
GAS PIPELINES Alliance Pipeline has contracts with shippers that are also our affiliates through common ownership interests of Enbridge. Our share of Alliance Pipeline’s revenues from affiliates for the year ended December 31, 2017 was $128 million (2016 - $134 million). LONG-TERM RECEIVABLE FROM AFFILIATE Long-term receivable from affiliate includes the carrying value of Class A Units of SL Holdings LLC, which is an indirect wholly-owned subsidiary of Enbridge. As at December 31, 2017, $710 million (2016 - $782 million) is included in Long-term receivable from affiliate and $19 million (2016 - $19 million) is included in Accounts receivable from affiliates. Interest income of $60 million for the year ended December 31, 2017 (2016 - $62 million) has been recorded within Interest income on affiliate loans on the Consolidated Statements of Earnings. INVESTMENT IN AFFILIATED COMPANY As at December 31, 2017, EIPLP had an investment of $514 million (2016 - $514 million) in 500,000 non-voting, redeemable Series A Preferred Shares of EESCI. These Preferred Shares entitle EIPLP to receive annual dividends through 2021. EESCI has the option to redeem the outstanding Preferred Shares at any time. EIPLP is also entitled to require redemption of these Preferred Shares at any time. Dividend income of $38 million was recognized in Dividend income from affiliated company for the year ended December 31, 2017 (2016 - $40 million). INTERCORPORATE LOANS AND BALANCES Loan to Affiliate The following loan to affiliate is evidenced by a formal loan agreement:
2017 2016 Weighted Weighted Average Average Interest Interest December 31, Maturity Rate Amount Rate Amount (millions of Canadian dollars) Affiliate Current 6.0 % 3 6.0 % 3 Current portion of loan to affiliate (3 ) (3 ) — —
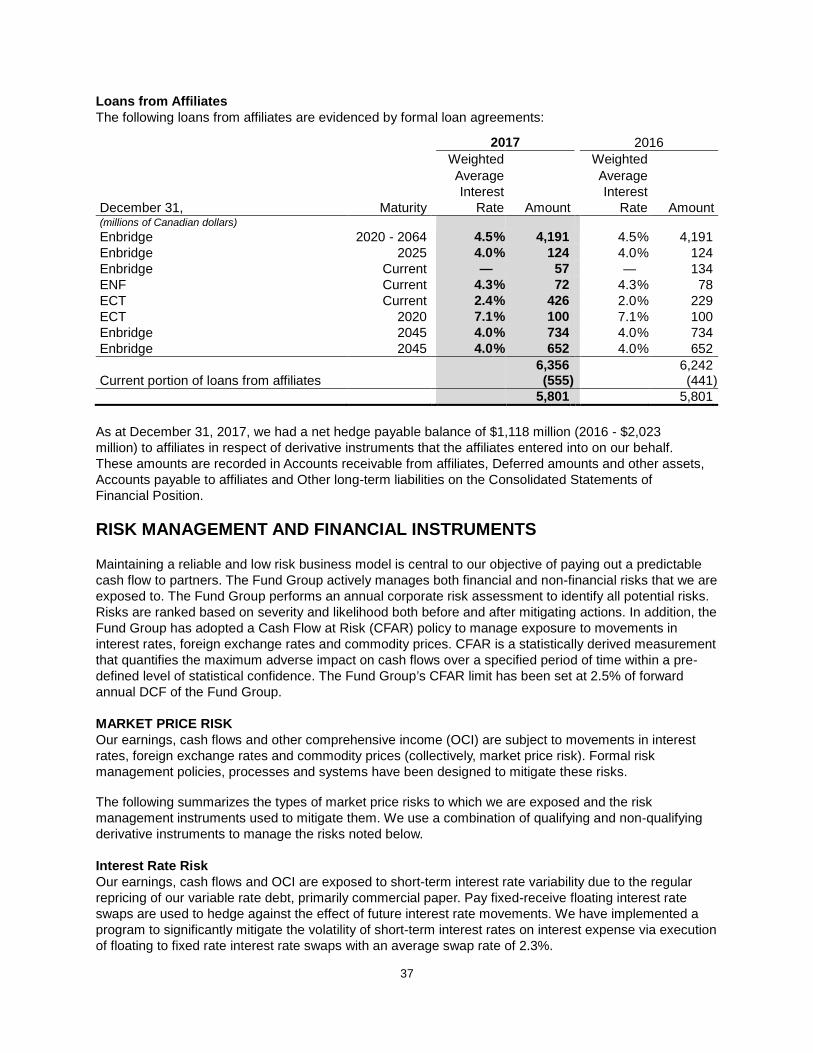
37
Loans from Affiliates The following loans from affiliates are evidenced by formal loan agreements:
2017 2016 Weighted Weighted Average Average Interest Interest December 31, Maturity Rate Amount Rate Amount (millions of Canadian dollars) Enbridge 2020 - 2064 4.5 % 4,191 4.5 % 4,191 Enbridge 2025 4.0 % 124 4.0 % 124 Enbridge Current — 57 — 134 ENF Current 4.3 % 72 4.3 % 78 ECT Current 2.4 % 426 2.0 % 229 ECT 2020 7.1 % 100 7.1 % 100 Enbridge 2045 4.0 % 734 4.0 % 734 Enbridge 2045 4.0 % 652 4.0 % 652 6,356 6,242 Current portion of loans from affiliates (555 ) (441 ) 5,801 5,801
As at December 31, 2017, we had a net hedge payable balance of $1,118 million (2016 - $2,023 million) to affiliates in respect of derivative instruments that the affiliates entered into on our behalf. These amounts are recorded in Accounts receivable from affiliates, Deferred amounts and other assets, Accounts payable to affiliates and Other long-term liabilities on the Consolidated Statements of Financial Position. RISK MANAGEMENT AND FINANCIAL INSTRUMENTS Maintaining a reliable and low risk business model is central to our objective of paying out a predictable cash flow to partners. The Fund Group actively manages both financial and non-financial risks that we are exposed to. The Fund Group performs an annual corporate risk assessment to identify all potential risks. Risks are ranked based on severity and likelihood both before and after mitigating actions. In addition, the Fund Group has adopted a Cash Flow at Risk (CFAR) policy to manage exposure to movements in interest rates, foreign exchange rates and commodity prices. CFAR is a statistically derived measurement that quantifies the maximum adverse impact on cash flows over a specified period of time within a pre-defined level of statistical confidence. The Fund Group’s CFAR limit has been set at 2.5% of forward annual DCF of the Fund Group. MARKET PRICE RISK Our earnings, cash flows and other comprehensive income (OCI) are subject to movements in interest rates, foreign exchange rates and commodity prices (collectively, market price risk). Formal risk management policies, processes and systems have been designed to mitigate these risks. The following summarizes the types of market price risks to which we are exposed and the risk management instruments used to mitigate them. We use a combination of qualifying and non-qualifying derivative instruments to manage the risks noted below. Interest Rate Risk Our earnings, cash flows and OCI are exposed to short-term interest rate variability due to the regular repricing of our variable rate debt, primarily commercial paper. Pay fixed-receive floating interest rate swaps are used to hedge against the effect of future interest rate movements. We have implemented a program to significantly mitigate the volatility of short-term interest rates on interest expense via execution of floating to fixed rate interest rate swaps with an average swap rate of 2.3%.
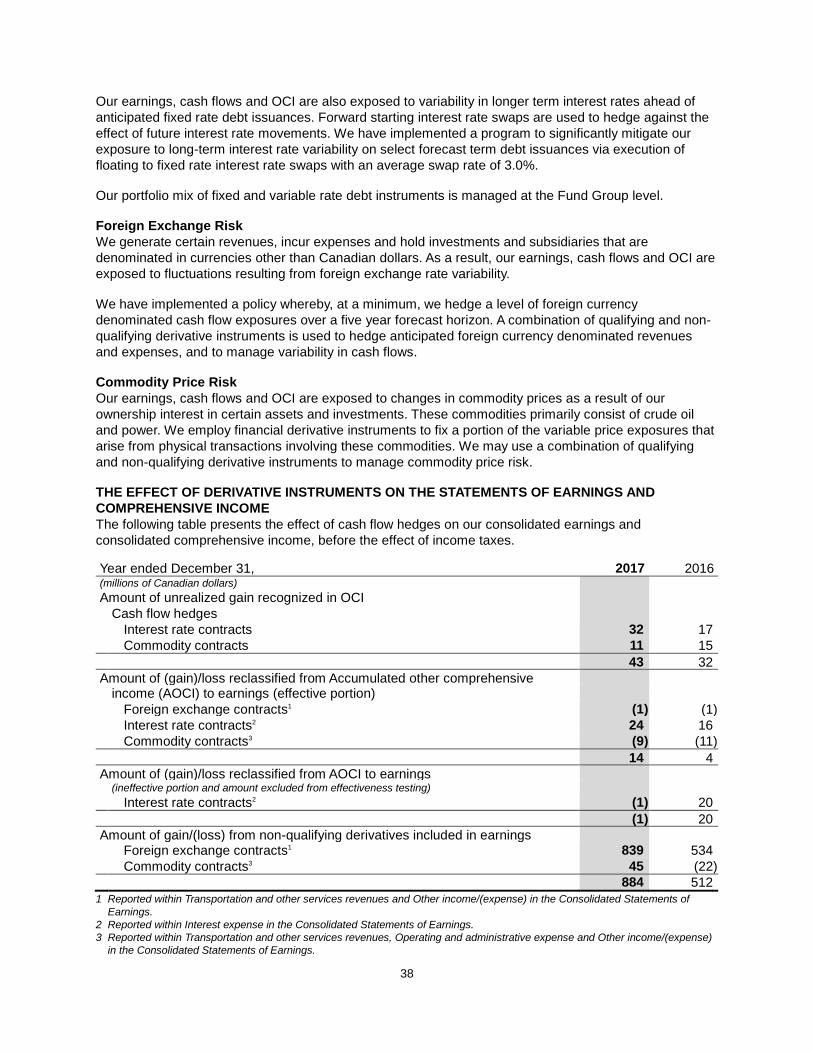
38
Our earnings, cash flows and OCI are also exposed to variability in longer term interest rates ahead of anticipated fixed rate debt issuances. Forward starting interest rate swaps are used to hedge against the effect of future interest rate movements. We have implemented a program to significantly mitigate our exposure to long-term interest rate variability on select forecast term debt issuances via execution of floating to fixed rate interest rate swaps with an average swap rate of 3.0%. Our portfolio mix of fixed and variable rate debt instruments is managed at the Fund Group level. Foreign Exchange Risk We generate certain revenues, incur expenses and hold investments and subsidiaries that are denominated in currencies other than Canadian dollars. As a result, our earnings, cash flows and OCI are exposed to fluctuations resulting from foreign exchange rate variability. We have implemented a policy whereby, at a minimum, we hedge a level of foreign currency denominated cash flow exposures over a five year forecast horizon. A combination of qualifying and non-qualifying derivative instruments is used to hedge anticipated foreign currency denominated revenues and expenses, and to manage variability in cash flows. Commodity Price Risk Our earnings, cash flows and OCI are exposed to changes in commodity prices as a result of our ownership interest in certain assets and investments. These commodities primarily consist of crude oil and power. We employ financial derivative instruments to fix a portion of the variable price exposures that arise from physical transactions involving these commodities. We may use a combination of qualifying and non-qualifying derivative instruments to manage commodity price risk. THE EFFECT OF DERIVATIVE INSTRUMENTS ON THE STATEMENTS OF EARNINGS AND COMPREHENSIVE INCOME The following table presents the effect of cash flow hedges on our consolidated earnings and consolidated comprehensive income, before the effect of income taxes.
Year ended December 31, 2017 2016 (millions of Canadian dollars) Amount of unrealized gain recognized in OCI Cash flow hedges Interest rate contracts 32 17 Commodity contracts 11 15 43 32 Amount of (gain)/loss reclassified from Accumulated other comprehensive income (AOCI) to earnings (effective portion) Foreign exchange contracts1 (1 ) (1 ) Interest rate contracts2 24 16 Commodity contracts3 (9 ) (11 ) 14 4 Amount of (gain)/loss reclassified from AOCI to earnings (ineffective portion and amount excluded from effectiveness testing) Interest rate contracts2 (1 ) 20 (1 ) 20 Amount of gain/(loss) from non-qualifying derivatives included in earnings Foreign exchange contracts1 839 534 Commodity contracts3 45 (22 ) 884 512
1 Reported within Transportation and other services revenues and Other income/(expense) in the Consolidated Statements of Earnings.
2 Reported within Interest expense in the Consolidated Statements of Earnings. 3 Reported within Transportation and other services revenues, Operating and administrative expense and Other income/(expense)
in the Consolidated Statements of Earnings.
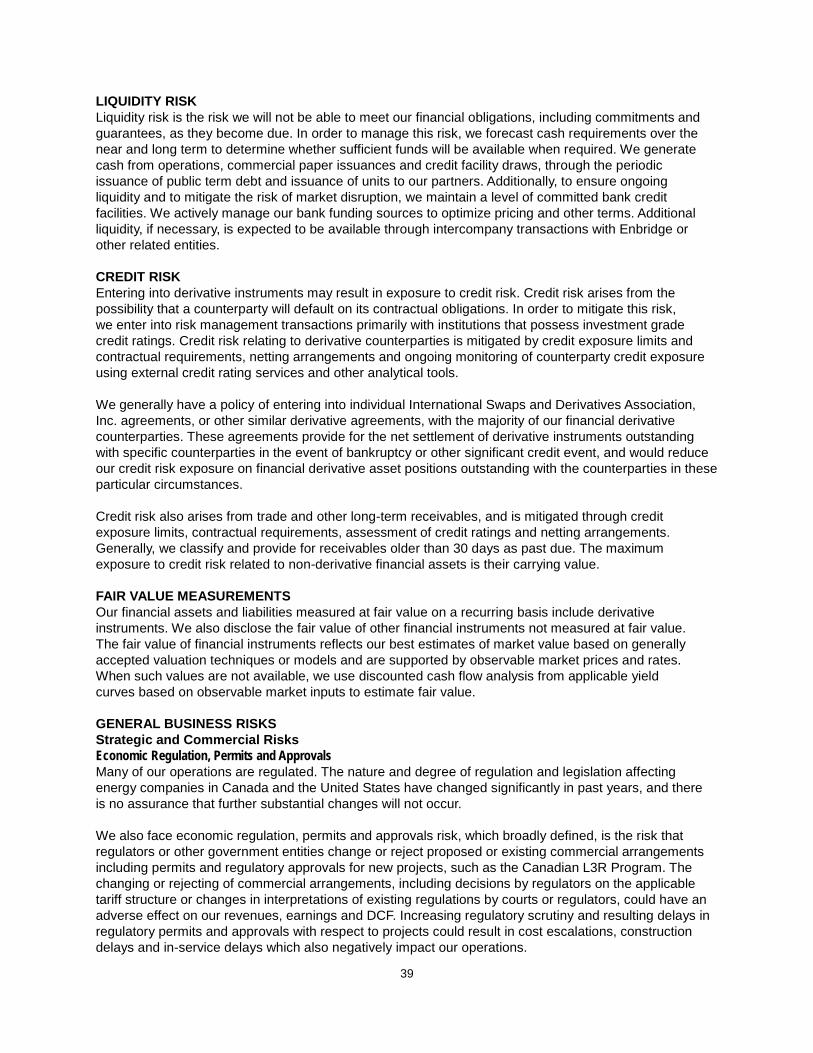
39
LIQUIDITY RISK Liquidity risk is the risk we will not be able to meet our financial obligations, including commitments and guarantees, as they become due. In order to manage this risk, we forecast cash requirements over the near and long term to determine whether sufficient funds will be available when required. We generate cash from operations, commercial paper issuances and credit facility draws, through the periodic issuance of public term debt and issuance of units to our partners. Additionally, to ensure ongoing liquidity and to mitigate the risk of market disruption, we maintain a level of committed bank credit facilities. We actively manage our bank funding sources to optimize pricing and other terms. Additional liquidity, if necessary, is expected to be available through intercompany transactions with Enbridge or other related entities. CREDIT RISK Entering into derivative instruments may result in exposure to credit risk. Credit risk arises from the possibility that a counterparty will default on its contractual obligations. In order to mitigate this risk, we enter into risk management transactions primarily with institutions that possess investment grade credit ratings. Credit risk relating to derivative counterparties is mitigated by credit exposure limits and contractual requirements, netting arrangements and ongoing monitoring of counterparty credit exposure using external credit rating services and other analytical tools. We generally have a policy of entering into individual International Swaps and Derivatives Association, Inc. agreements, or other similar derivative agreements, with the majority of our financial derivative counterparties. These agreements provide for the net settlement of derivative instruments outstanding with specific counterparties in the event of bankruptcy or other significant credit event, and would reduce our credit risk exposure on financial derivative asset positions outstanding with the counterparties in these particular circumstances. Credit risk also arises from trade and other long-term receivables, and is mitigated through credit exposure limits, contractual requirements, assessment of credit ratings and netting arrangements. Generally, we classify and provide for receivables older than 30 days as past due. The maximum exposure to credit risk related to non-derivative financial assets is their carrying value. FAIR VALUE MEASUREMENTS Our financial assets and liabilities measured at fair value on a recurring basis include derivative instruments. We also disclose the fair value of other financial instruments not measured at fair value. The fair value of financial instruments reflects our best estimates of market value based on generally accepted valuation techniques or models and are supported by observable market prices and rates. When such values are not available, we use discounted cash flow analysis from applicable yield curves based on observable market inputs to estimate fair value. GENERAL BUSINESS RISKS Strategic and Commercial Risks Economic Regulation, Permits and Approvals Many of our operations are regulated. The nature and degree of regulation and legislation affecting energy companies in Canada and the United States have changed significantly in past years, and there is no assurance that further substantial changes will not occur. We also face economic regulation, permits and approvals risk, which broadly defined, is the risk that regulators or other government entities change or reject proposed or existing commercial arrangements including permits and regulatory approvals for new projects, such as the Canadian L3R Program. The changing or rejecting of commercial arrangements, including decisions by regulators on the applicable tariff structure or changes in interpretations of existing regulations by courts or regulators, could have an adverse effect on our revenues, earnings and DCF. Increasing regulatory scrutiny and resulting delays in regulatory permits and approvals with respect to projects could result in cost escalations, construction delays and in-service delays which also negatively impact our operations.
40
On February 8, 2018, the Government of Canada introduced legislation to revise the process for assessing major resource projects. At this time, we are reviewing the proposed regulatory reforms and the effect upon us and our subsidiaries, whether adverse or favorable, if such legislation is passed in its current or revised form, is currently uncertain. The FERC continues to intensify its oversight of financial reporting, risk standards and affiliate rules, and in 2014, the Pipeline and Hazardous Materials Safety Administration issued new pipeline standards and regulations on managing gas pipeline integrity. We continue ongoing dialogue with regulatory agencies and participate in industry groups to ensure it is informed of emerging issues in a timely manner. The Manager believes that economic regulatory risk is reduced through the negotiation of long-term agreements with shippers that govern the majority of its operations. The Manager also involves its legal and regulatory teams in the review of new projects to ensure compliance with applicable regulations, as well as in the establishment of tariffs and tolls for these assets. The Manager retains dedicated professional staff and maintains strong relationships with customers, intervenors and regulators to help minimize economic regulation risk. However, despite the efforts of the Manager to mitigate economic regulation risk, there remains a risk that a regulator could overturn long-term agreements between EIPLP and shippers or deny the approval and permits for new projects. We will be required to comply with numerous federal, provincial and local laws and regulations and to maintain and comply with numerous regulatory licenses, permits and governmental approvals required for the maintenance and operation of our assets. Many of the regulatory permits that have been issued in respect of our assets contain terms, conditions and restrictions, or may have limited terms. A failure to satisfy the terms and conditions or comply with the restrictions imposed under regulatory permits or the restrictions imposed by any statutory or regulatory requirements, may result in regulatory enforcement action, which could adversely affect continued operations, or result in fines, penalties or additional costs, including requirements to suspend or cease operations. Project Execution As we continue to execute on our growth projects, we continue to focus on completing projects safely, on-time and on-budget. The ability to successfully execute the development of our organic growth projects may be influenced by capital constraints, third-party opposition, changes in shipper support over time, delays in or changes to government and regulatory approvals, cost escalations, construction delays, inadequate resources, in-service delays and increasing complexity of projects (collectively, Execution Risk). Early stage project risks include right-of-way procurement, special interest group opposition, Crown consultation and environmental and regulatory permitting. Cost escalations or missed in-service dates on future projects may impact future earnings and cash flows and may hinder the Manager’s ability to secure future projects. Construction delays due to regulatory delays, third-party opposition, contractor or supplier non-performance and weather conditions may impact project development. Enbridge, through its Major Projects Group, strives to be an industry leader in project execution. The Major Projects Group seeks to mitigate project execution risk through a centralized structure that has a clearly defined governance and process for all major projects, with dedicated resources organized to lead and execute each major project. Capital constraints and cost escalation risks are mitigated through structuring of commercial agreements, typically where shippers retain complete or a share of capital cost excess. Detailed cost tracking and centralized purchasing is used on all major projects to facilitate optimum pricing and service terms. Strategic relationships have been developed with suppliers and contractors and those selected are chosen based on the Manager’s strict adherence to safety including robust safety standards embedded in contracts with suppliers. The Major Projects Group has assessed work volumes for the next several years across its projects to optimize the expected costs, supply of services, materials and labor to execute the

41
projects. Underpinning this approach is Major Project’s Project Lifecycle Gating Control tool which helps to ensure that schedule, cost, safety and quality objectives are on track and met for each stage of a project’s development and construction. Consultations with regulators are held in-advance of project construction to enhance understanding of project rationale and ensure applications are compliant and robust, while at all times maintaining a strong focus on integrity and public safety. Enbridge also actively involves its legal and regulatory teams to work closely with the Major Projects Group to engage in open dialogue with government agencies, regulators, land owners, Indigenous peoples and special interest groups to identify and develop appropriate responses to their concerns regarding our projects. Public Opinion Enbridge’s ability to earn and sustain the trust of its stakeholders is critical to its ability to execute on its enterprise-wide growth plans and ensure that its enterprise-wide business strategy, as well as its corporate policies and management systems, are continuously informed by the social and environmental context surrounding its projects and operations. A key priority is to establish and maintain constructive relationships with local stakeholders over the life-cycle of its assets. Public opinion or reputation risk is the risk of negative impacts on our business, operations or financial condition resulting from changes in Enbridge’s enterprise-wide reputation with stakeholders, special interest groups, political leadership, the media or other entities. Public opinion may be influenced by certain media and special interest groups’ negative portrayal of the industry in which we operate as well as their opposition to development projects. Potential impacts of a negative public opinion may include loss of business, loss of ability to secure growth opportunities, delays in project execution, legal action, increased regulatory oversight or delays in regulatory approval and higher costs. Reputation risk often arises as a consequence of some other risk event, such as in connection with operational, regulatory or legal risks. Therefore, reputation risk cannot be managed in isolation from other risks. Enbridge manages enterprise-wide reputation risk by:
• having health, safety and environment management systems in place, as well as policies, programs and practices for conducting safe and environmentally sound operations with an emphasis on the prevention of any incidents;
• having formal risk management policies, procedures and systems in place to identify, assess and mitigate risks;
• operating to the highest ethical standards, with integrity, honesty and transparency, and maintaining positive relationships with customers, investors, employees, partners, regulators and other stakeholders;
• building awareness and understanding of the role energy and Enbridge play in people’s lives in order to promote better understanding of Enbridge and its businesses;
• having strong corporate governance practices, including a Statement on Business Conduct, which requires all employees to certify their compliance with Enbridge policy on an annual basis, and whistleblower procedures, which allow employees to report suspected ethical concerns on a confidential and anonymous basis; and
• pursuing socially responsible operations as a longer-term corporate strategy. More broadly, Enbridge’s goal is to build awareness and balanced dialogue on the role and value of the energy it delivers to our society and economy. Enbridge communicates with different stakeholders, decision makers, customers and other interested groups - including investors, employees and the public - about the access it provides to safe, reliable, affordable energy. Enbridge’s actions noted above are the key mitigation actions against negative public opinion; however, the public opinion risk cannot be mitigated solely by Enbridge’s individual actions. Enbridge actively works with other stakeholders in the industry to collaborate and work closely with government and Indigenous
42
Peoples communities to enhance the public opinion of Enbridge, as well as the industry in which it and its subsidiaries operate. Unless otherwise specifically stated, none of the content of the policies or initiatives described above are incorporated by reference herein. Transformation Projects Transformation project risk is the risk that modernization projects carried out by Enbridge and its subsidiaries do not fully deliver planned results due to insufficiently addressing the risks associated with project execution and change management. This could result in negative financial, operational and reputational impacts. Enbridge launched projects in 2016 to transform various processes, capabilities and reporting systems infrastructure to continuously improve effectiveness and efficiency across the organization. To monitor and mitigate project risk, Enbridge established an enterprise-wide approach to manage project planning and authorization, implement progress tracking, risk controls and mitigating strategies for risk. Expansion Projects and Potential Acquisitions and Divestitures Enbridge evaluates expansion projects and potential acquisitions and divestitures on an ongoing basis. Planning and investment analysis is highly dependent on accurate forecasting assumptions and to the extent that these assumptions do not materialize, financial performance may be lower or more volatile than expected. Volatility and unpredictability in the economy, both locally and globally, change in cost estimates, project scoping and risk assessment could result in a loss in our profits. Trade Relations between Canada and the United States The United States Government has continued interest in renegotiating and altering the North American Free Trade Agreement (NAFTA) with Canada and Mexico. NAFTA provides protection against tariffs, duties and other charges or fees and assures access by the signatories. The NAFTA negotiations have introduced a level of uncertainty in the energy markets. The outcome of the NAFTA negotiations could result in new rules or its collapse which may be disruptive to energy markets, and could jeopardize our ability to remain competitive and have a significant impact on us. United States Tax Reform Legislation On December 22, 2017, President Trump signed into law H.R. 1, “An Act to provide for reconciliation pursuant to titles II and V of the concurrent resolution on the budget for fiscal year 2018” (informally titled the TCJA). The effect of the TCJA on our subsidiaries and investees is uncertain, but will become more clear as additional guidance is issued. Environmental and Safety Risks Public, Worker and Contractor Safety Several of our pipeline systems and related assets are operated in close proximity to populated areas and a major incident could result in injury to members of the public. A public safety incident could result in reputational damage to Enbridge and its subsidiaries, material repair costs or increased costs of operating and insuring its assets. In addition, given the natural hazards inherent in the operations of Enbridge and its subsidiaries, workers and contractors are subject to personal safety risks. A public safety incident or an injury to our workers or contractors could result in reputational damage to us, material repair costs or increased costs of operating and insuring our assets. Safety and operational reliability are our most important priorities. Mitigation efforts to reduce the likelihood and severity of a public safety incident are executed primarily through Enbridge’s Operational Risk Management Plan (ORM Plan) and emergency response preparedness. Enbridge also actively engages stakeholders through public safety awareness activities to ensure the public is aware of potential hazards and understands the appropriate actions to take in the event of an emergency. Enbridge also actively engages first responders through education programs that endeavor to equip first responders with the skills and tools to safely and effectively respond to a potential incident.
43
Finally, Enbridge and its subsidiaries believe in a safety culture where safety incidents are not tolerated by employees and contractors and have established a target of zero incidents. For employees, safety objectives have been incorporated across all subsidiaries of Enbridge and are included as part of an employee’s compensation measures. Contractors are chosen following a rigorous selection process that includes a strict adherence to Enbridge’s safety culture. Environmental Incident We are subject to numerous environmental laws and regulations affecting many aspects of our present and future operations, including air emissions, water quality, wastewater discharges, solid waste and hazardous waste. Failure to comply with environmental laws and regulations may result in the imposition of fines, penalties and injunctive measures affecting our operating assets. In addition, changes in environmental laws and regulations or the enactment of new environmental laws or regulations could result in a material increase in our cost of compliance with such laws and regulations. We may not be able to obtain or maintain all required environmental regulatory approvals for our operating assets or development projects. If there is a delay in obtaining any required environmental regulatory approvals, if we fail to obtain or comply with them, or if environmental laws or regulations change or are administered in a more stringent manner, the operations of facilities or the development of new facilities could be prevented, delayed or become subject to additional costs. We expect that costs we incur to comply with environmental regulations in the future will have a significant effect on our earnings and cash flows. Although the Manager believes its integrated management system, plans and processes mitigate the risk of environmental incidents, there remains a chance that an environmental incident could occur. Enbridge's ORM Plan also seeks to mitigate the severity of a potential environmental incident through continued process improvements, regular inspections and monitoring of facilities, as well as enhancements in leak detection processes and alarm analysis procedures. The Manager has also invested significant resources to enhance its emergency response plans, operator training and landowner education programs to address any potential environmental incident. We are included in Enbridge’s comprehensive insurance coverage, which covers Enbridge subsidiaries and affiliates and is renewed annually. The insurance program includes coverage for commercial liability that is considered customary for our industry and includes coverage for environmental incidents excluding costs for fines and penalties. In the unlikely event that multiple insurable incidents which in aggregate exceed coverage limits occur within the same insurance period, the total insurance coverage will be allocated among Enbridge entities on an equitable basis based on an insurance allocation agreement among Enbridge and its subsidiaries and affiliates. Terrorism and Asset Security Incident Terrorist attacks and threats, escalation of military activity or acts of war, or other civil unrest or activism may have significant effects on general economic conditions, fluctuations in consumer confidence and spending and market liquidity, each of which could adversely affect our business. Future terrorist attacks, rumors or threats of war, actual conflicts involving the United States, or Canada, or military or trade disruptions may significantly affect our operations and those of our customers. Strategic targets, such as energy related assets, may be at greater risk of future attacks than other targets in the United States and Canada. In addition, increased environmental activism against pipeline construction and operation could potentially result in work delays, reduced demand for our products and services, increased legislation or denial or delay of permits and rights-of-way. Finally, the disruption or a significant increase in energy prices could result in government-imposed price controls. It is possible that any of these occurrences, or a combination of them, could adversely affect our business, operations or financial results. Cyber-attacks, Information Technology Security or Systems Incident Our business is dependent upon information systems and other digital technologies for controlling our pipelines, processing transactions and summarizing and reporting results of operations. The secure

44
processing, maintenance and transmission of information is critical to our operations. A security breach of our network or systems could result in improper operation of our assets, potentially including delays in the delivery or availability of our customers’ products, contamination or degradation of the products we transport, store or distribute, or releases of hydrocarbon products for which we could be held liable. Furthermore, we collect and store sensitive data in the ordinary course of our business, including personal identification information of our employees as well as our proprietary business information and that of our customers, suppliers, investors and other stakeholders. Enbridge has a central cyber-security controls framework in place which has been derived from the National Institute of Standards and Technology Cyber-security Framework and International Organization for Standardization 27001 standards. Enbridge monitors its control effectiveness in an increasing threat landscape and continuously take action to improve its security posture. Enbridge has implemented a 7X24 security operations center to monitor, detect and investigate any anomalous activity in our network together with an incident response process that we test on a monthly basis. Enbridge conducts independent cyber-security audits and penetration tests on a regular basis to test that its preventative and detective controls are working as designed. Despite Enbridge's central security measures, our information systems may become the target of cyber-attacks or security breaches (including employee error, malfeasance or other breaches), which could compromise our network or systems and result in the release or loss of the information stored therein, misappropriation of assets, disruption to our operations or damage to our facilities. Our current insurance coverage programs do not contain specific coverage for cyber-attacks or security breaches. As a result of a cyber-attack or security breach, we could also be liable under laws that protect the privacy of personal information, subject to regulatory penalties, experience damage to our reputation or a loss of consumer confidence in our products and services, or incur additional costs for remediation and modification or enhancement of our information systems to prevent future occurrences, all of which could adversely affect our business, operations or financial results. Service Interruption Incident A service interruption due to a major power disruption or curtailment on commodity supply could have a significant impact on our ability to operate our assets and negatively impact financial results, relationships with stakeholders and Enbridge’s enterprise-wide reputation. Service interruptions that impact our crude oil transportation services can negatively impact shippers’ operations and earnings as they are dependent on our services to move their product to market or fulfill their own contractual arrangements. We mitigate service interruption risk through our diversified sources of supply, storage withdrawal flexibility, backup power systems, critical parts inventory and redundancies for critical equipment. Business Environment Risks Indigenous Peoples Relations Canadian judicial decisions have recognized that Indigenous peoples’ rights and treaty rights exist in proximity to our operations and future project developments. The courts have also confirmed that the Crown has a duty to consult with Indigenous peoples when its decisions or actions may adversely affect Indigenous peoples’ rights and interests or treaty rights. Crown consultation has the potential to delay regulatory approval processes and construction, which may affect project economics. In some cases, respecting Indigenous peoples’ rights may mean regulatory approval is denied or the conditions in the approval make a project economically challenging. Due to the linear nature of Enbridge’s energy infrastructure, it is in contact with a large number of diverse communities, landowners and regulatory bodies across North America. Because Indigenous communities have distinct rights as discussed above, Enbridge has dedicated resources focused on Indigenous consultation and inclusion. Early identification of local concerns enables us to respond quickly and take a proactive approach to problem solving. Early engagement also enables us to provide expanded opportunities for socio-economic participation through employment, training, and procurement, as well as through the development of joint initiatives on safety, environmental and cultural protection. Given this environment and the breadth of relationships across our geographic span, Enbridge has implemented an enterprise-wide Indigenous Peoples Policy. This policy promotes the achievement of
45
participative and mutually beneficial relationships with Indigenous peoples affected by our projects and operations. Specifically, the policy sets out principles governing our relationships with Indigenous peoples and makes commitments to work with Indigenous peoples so they may realize benefits from our projects and operations. Notwithstanding our efforts to this end, the issues are complex and the impact of Indigenous peoples’ relations on operations and development initiatives is uncertain. Special Interest Groups including Non-Governmental Organizations We are exposed to the risk of higher costs, delays or even project cancellations due to increasing pressure on governments and regulators by special interest groups, including non-governmental organizations. Recent judicial decisions have increased the ability of special interest groups to make claims and oppose projects in regulatory and legal forums. In addition to issues raised by groups focused on particular project impacts, EIPLP and others in the energy and pipeline businesses are facing opposition from organizations opposed to oil sands development and shipment of production from oil sands regions. Enbridge and its subsidiaries work proactively with special interest groups and non-governmental organizations to identify and develop appropriate responses to concerns regarding its projects. CRITICAL ACCOUNTING ESTIMATES The following critical accounting estimates discussed below have an impact across the various segments of EIPLP. DEPRECIATION Depreciation of property, plant and equipment, our largest asset with a net book value at December 31, 2017 of $23,622 million (2016 - $22,455 million), or 83% of total assets, is provided following two primary methods. For distinct assets, depreciation is generally provided on a straight-line basis over the estimated useful lives of the assets commencing when the asset is placed in service. For largely homogeneous groups of assets with comparable useful lives, the pool method of accounting is followed whereby similar assets are grouped and depreciated as a pool. When the group assets are retired or otherwise disposed of, gains and losses are not reflected in earnings but are booked as an adjustment to accumulated depreciation. When it is determined that the estimated service life of an asset no longer reflects the expected remaining period of benefit, prospective changes are made to the estimated service life. Estimates of useful lives are based on third party engineering studies, experience and/or industry practice. There are a number of assumptions inherent in estimating the service lives of our assets, including the level of development, exploration, drilling, reserves and production of crude oil and natural gas in the supply areas served by our pipelines as well as the demand for crude oil and natural gas and the integrity of our systems. Changes in these assumptions could result in adjustments to the estimated service lives, which could result in material changes to depreciation expense in future periods in any of our business segments. For certain rate-regulated operations, depreciation rates are approved by the regulator and the regulator may require periodic studies or technical updates on useful lives which may change depreciation rates. IMPAIRMENT We evaluate the recoverability of our property, plant and equipment when events or circumstances such as economic obsolescence, business climate, legal or regulatory changes, or other factors indicate we may not recover the carrying amount of our assets. We continually monitor our businesses, the market and business environments to identify indicators that could suggest an asset may not be recoverable. If it is determined that the carrying value of an asset exceeds the undiscounted cash flows expected from the asset, we calculate fair value based on the discounted cash flows and write the assets down to the extent that the carrying value exceeds the fair value. The determination of the fair value using present value techniques requires the use of projections and assumptions regarding future cash flows and weighted average cost of capital. Any changes to these projections and assumptions
46
could result in revisions to the evaluation of the recoverability of the property, plant and equipment and the recognition of an impairment loss in the Consolidated Statements of Earnings. We assess our goodwill for impairment at least annually unless events or changes in circumstances indicate that it is more likely than not that the fair value of a reporting unit is below its carrying value. For the purposes of impairment testing, reporting units are identified as business operations within an operating segment. We have the option to first assess qualitative factors to determine whether it is necessary to perform the quantitative goodwill impairment test. The quantitative goodwill impairment test involves determining the fair value of our reporting units inclusive of goodwill and comparing those values to the carrying value of each reporting unit. If the carrying value of a reporting unit, including allocated goodwill, exceeds its fair value, goodwill impairment is measured as the excess of the carrying amount of the reporting unit’s allocated goodwill over the fair value of the goodwill based on the fair value of the reporting unit’s assets and liabilities. REGULATORY ASSETS AND LIABILITIES Certain of our businesses are subject to regulation by various authorities, including the NEB, the FERC, the Alberta Energy Regulator and Manitoba Mineral Resources. Regulatory bodies exercise statutory authority over matters such as construction, rates and ratemaking and agreements with customers. To recognize the economic effects of the actions of the regulator, the timing of recognition of certain revenues and expenses in these operations may differ from that otherwise expected under U.S. GAAP for non rate-regulated entities. Regulatory assets represent amounts that are expected to be recovered from customers in future periods through rates. Long-term regulatory assets are recorded in Deferred amounts and other assets and current regulatory assets are recorded in Accounts receivable and other. Long-term regulatory liabilities are included in Other long-term liabilities and current regulatory liabilities are recorded in Accounts payable and other. Regulatory assets are assessed for impairment if we identify an event indicative of possible impairment. The recognition of regulatory assets and liabilities is based on the actions, or expected future actions, of the regulator. To the extent that the regulator’s actions differ from our expectations, the timing and amount of recovery or settlement of regulatory balances could differ significantly from those recorded. In the absence of rate regulation, we would generally not recognize regulatory assets or liabilities and the earnings impact would be recorded in the period the expenses are incurred or revenues are earned. A regulatory asset or liability is recognized in respect of deferred income taxes when it is expected the amounts will be recovered or settled through future regulator-approved rates. As at December 31, 2017, our net regulatory assets totaled $1,317 million (2016 - $1,145 million). CONTINGENT LIABILITIES Provisions for claims filed against EIPLP are determined on a case-by-case basis. Case estimates are reviewed on a regular basis and are updated as new information is received. The process of evaluating claims involves the use of estimates and a high degree of management judgment. Claims outstanding are detailed in Note 24, Commitments and Contingencies, of the 2017 Annual Consolidated Financial Statements. In addition, any unasserted claims that later may become evident could have a material impact on the financial results of EIPLP and certain of EIPLP’s subsidiaries and investments. ASSET RETIREMENT OBLIGATIONS Asset retirement obligations (ARO) associated with the retirement of long-lived assets are measured at fair value and recognized as Other long-term liabilities in the period in which they can be reasonably determined. The fair value approximates the cost a third party would charge to perform the tasks necessary to retire such assets and is recognized at the present value of expected future cash flows. Discount rates used to present value the expected future cash flows for the year ended December 31, 2017 range from 3.9% to 11.0% (2016 - 4.6% to 9.4%). ARO are added to the carrying value of the associated asset and depreciated over the asset’s useful life. The corresponding liability is accreted over time through charges to earnings and is reduced by actual costs of decommissioning and
47
reclamation. Our estimates of retirement costs could change as a result of changes in cost estimates and regulatory requirements. Currently, for certain of our assets, there is insufficient data or information to reasonably determine the timing of settlement for estimating the fair value of the ARO. In these cases, the ARO cost is considered indeterminate for accounting purposes, as there is no data or information that can be derived from past practice, industry practice or the estimated economic life of the asset. In 2009, the NEB issued a decision related to the Land Matters Consultation Initiative, which required holders of an authorization to operate a pipeline under the NEB Act to file a proposed process and mechanism to set aside funds to pay for future abandonment costs in respect of the sites in Canada used for the operation of a pipeline. The NEB’s decision stated that while pipeline companies are ultimately responsible for the full costs of abandoning pipelines, abandonment costs are a legitimate cost of providing service and are recoverable from the users of the pipeline upon approval by the NEB. We collect and set aside funds to cover future abandonment costs. The funds collected are held in trust in accordance with the NEB decision. The funds collected from shippers are reported within Transportation and other services revenues and Restricted long-term investments. Concurrently, we reflect the future abandonment cost as an increase to Operating and administrative expense and Other long-term liabilities. CHANGES IN ACCOUNTING POLICIES ADOPTION OF NEW STANDARDS Simplifying the Measurement of Goodwill Impairment Effective January 1, 2017, we early adopted Accounting Standards Update (ASU) 2017-04 and applied the standard on a prospective basis. Under the new guidance, goodwill impairment will now be the amount by which a reporting unit’s carrying value exceeds its fair value; this amount should not exceed the carrying amount of goodwill. The adoption of the pronouncement did not have a material impact on our consolidated financial statements. Clarifying the Definition of a Business in an Acquisition Effective January 1, 2017, we early adopted ASU 2017-01 on a prospective basis. The new standard was issued with the objective of adding guidance to assist entities with evaluating whether transactions should be accounted for as acquisitions (disposals) of assets or businesses. The adoption of the pronouncement did not have a material impact on our consolidated financial statements. Accounting for Intra-Entity Asset Transfers Effective January 1, 2017, we early adopted ASU 2016-16 on a modified retrospective basis. The new standard was issued with the intent of improving the accounting for the income tax consequences of intra-entity asset transfers other than inventory. Under the new guidance, an entity should recognize the income tax consequences of an intra-entity transfer of an asset, other than inventory, when the transfer occurs. The adoption of the pronouncement did not have a material impact on our consolidated financial statements. FUTURE ACCOUNTING POLICY CHANGES Improvements to Accounting for Hedging Activities ASU 2017-12 was issued in August 2017 with the objective of better aligning a company’s risk management activities and the resulting hedge accounting reflected in the financial statements. The accounting update allows cash flow hedging of contractually specified components in financial and non-financial items. Under the new guidance, hedge ineffectiveness is no longer required to be measured and hedging instruments’ fair value changes will be recorded in the same income statement line as the hedged item. The ASU also allows the initial quantitative hedge effectiveness assessment to be
48
performed at any time before the end of the quarter in which the hedge is designated. After initial quantitative testing is performed, an ongoing qualitative effectiveness assessment is permitted. The accounting update is effective January 1, 2019 and is to be applied on a modified retrospective basis. We are currently assessing the impact of the new standard on our consolidated financial statements. Clarifying Guidance on Derecognition and Partial Sales of Nonfinancial Assets ASU 2017-05 was issued in February 2017 with the intent of clarifying the scope of asset derecognition guidance and accounting for partial sales of nonfinancial assets. The ASU clarifies the scope provisions of nonfinancial assets and how to allocate consideration to each distinct asset, and amends the guidance for derecognition of a distinct nonfinancial asset in partial sale transactions. The accounting update is effective January 1, 2018 and will be applied on a modified retrospective basis. We do not expect the adoption of this accounting update to have a material impact on our consolidated financial statements. Simplifying Cash Flow Classification ASU 2016-15 was issued in August 2016 with the intent of reducing diversity in practice of how certain cash receipts and cash payments are classified in the statement of cash flows. The new guidance addresses eight specific presentation issues. The accounting update is effective January 1, 2018 and will be applied on a retrospective basis. We assessed each of the eight specific presentation issues and the adoption of this ASU does not have a material impact on our consolidated financial statements. Accounting for Credit Losses ASU 2016-13 was issued in June 2016 with the intent of providing financial statement users with more useful information about the expected credit losses on financial instruments and other commitments to extend credit held by a reporting entity at each reporting date. Current treatment uses the incurred loss methodology for recognizing credit losses that delays the recognition until it is probable a loss has been incurred. The accounting update adds a new impairment model, known as the current expected credit loss model, which is based on expected losses rather than incurred losses. Under the new guidance, an entity recognizes as an allowance its estimate of expected credit losses, which the Financial Accounting Standards Board believes will result in more timely recognition of such losses. We are currently assessing the impact of the new standard on our consolidated financial statements. The accounting update is effective January 1, 2020. Recognition of Leases ASU 2016-02 was issued in February 2016 with the intent to increase transparency and comparability among organizations. It requires lessees of operating lease arrangements to recognize lease assets and lease liabilities on the statement of financial position and disclose additional key information about lease agreements. The accounting update also replaces the current definition of a lease and requires that an arrangement be recognized as a lease when a customer has the right to obtain substantially all of the economic benefits from the use of an asset, as well as the right to direct the use of the asset. We are currently gathering a complete inventory of our lease contracts in order to assess the impact of the new standard on our consolidated financial statements. The accounting update is effective January 1, 2019 and is to be applied using a modified retrospective approach. Recognition and Measurement of Financial Assets and Liabilities ASU 2016-01 was issued in January 2016 with the intent to address certain aspects of recognition, measurement, presentation and disclosure of financial assets and liabilities. Investments in equity securities, excluding equity method and consolidated investments, are no longer classified as trading or available-for-sale securities. All investments in equity securities with readily determinable fair values are classified as investments at fair value through net income. Investments in equity securities without readily determinable fair values are measured using the fair value measurement alternative and are recorded at cost minus impairment, if any, plus or minus changes resulting from observable price changes in orderly transactions for an identical or similar investment of the same issuer. Investments in equity securities measured using the fair value measurement alternative are reviewed for indicators of impairment each reporting period. Fair value of financial instruments for disclosure purposes is

49
measured using exit price. The accounting update is effective January 1, 2018 and will be applied on a prospective basis. We do not expect the adoption of this accounting update to have a material impact on our consolidated financial statements. Revenue from Contracts with Customers ASU 2014-09 was issued in 2014 with the intent of significantly enhancing consistency and comparability of revenue recognition practices across entities and industries. The new standard establishes a single, principles-based five-step model to be applied to all contracts with customers and introduces new and enhanced disclosure requirements. It also requires the use of more estimates and judgments than the present standards in addition to additional disclosures. The new standard is effective January 1, 2018. The new standard permits either a full retrospective method of adoption with restatement of all prior periods presented, or a modified retrospective method with the cumulative effect of applying the new standard recognized as an adjustment to opening retained earnings in the period of adoption. We have decided to adopt the new standard using the modified retrospective method. We have reviewed our revenue contracts in order to evaluate the effect of the new standard on our revenue recognition practices. Based on our assessment, the adoption of the new standard will have the following impact to our financial statements:
• Estimates of variable consideration which will be required under the new standard for certain revenue contracts as well as the allocation of the transaction price for certain Liquids Pipelines revenue contracts, may result in changes to the pattern or timing of revenue recognition for those contracts.
• Certain payments received from customers to offset the cost of constructing assets required to provide services to those customers, referred to as Contributions in Aid of Construction (CIACs) were previously recorded as reductions of property, plant and equipment regardless of whether the amounts were imposed by regulation or negotiated. Under the new standard, negotiated CIACs are deemed to be advance payments for services and must be recognized when those future services are provided. Negotiated CIACs will be accounted for as deferred revenue and recognized over the term of the associated revenue contract.
Upon adoption, we will recognize the cumulative effect of initially applying the new standard. The significant impacts of adoption include a decrease in the opening balance of partners’ capital of approximately $140 million, an increase in property, plant and equipment of $100 million and an increase in deferred revenue of $110 million, subject to final determination, as at January 1, 2018. The cumulative effect of initially applying the new standard will be allocated to the General Partner and the Limited Partners based on their respective partnership interests, with any remaining negative balance in Limited Partners’ capital allocated to the General Partner. We have also developed and tested processes to generate the disclosures which will be required under the new standard commencing in the first quarter of 2018.

CONFIDENTIAL DRAFT - NOT FOR DISTRIBUTION
50
EIPLP OWNERSHIP The following presents the partners' ownership of EIPLP:
As at February 2, 2018 (number of units outstanding) Class A units Held by Enbridge Income Partners GP Inc. 40,471 Held by Enbridge Commercial Trust 408,045,956 408,086,427 Class C units1 Held by Enbridge Inc. 442,923,363 Class D units2 Held by Enbridge Inc. 19,957,803 Class E unit Held by Enbridge Inc. 1 Special Interest Rights - SIR Held by Enbridge Inc. 1,000
1 Class C units may, at the option of the holder, be exchanged in whole or in part for preferred units of ECT, Fund Units or ENF common shares.
2 The Class D units may, at the option of the holder, be exchanged for Class C units commencing on the fourth anniversary of the year of issuance.
ENBRIDGE INCOME PARTNERS LP
CONSOLIDATED FINANCIAL STATEMENTS
December 31, 2017
1
Independent Auditor’s Report To the Partners of Enbridge Income Partners LP We have audited the accompanying consolidated financial statements of Enbridge Income Partners LP and its subsidiaries, which comprise the consolidated statements of financial position as at December 31, 2017 and December 31, 2016 and the consolidated statements of earnings, comprehensive income, partners’ capital and cash flows for the years then ended, and the related notes, which comprise a summary of significant accounting policies and other explanatory information. Management’s responsibility for the consolidated financial statements Management is responsible for the preparation and fair presentation of these consolidated financial statements in accordance with generally accepted accounting principles in the United States of America and for such internal control as management determines is necessary to enable the preparation of consolidated financial statements that are free from material misstatement, whether due to fraud or error. Auditor’s responsibility Our responsibility is to express an opinion on these consolidated financial statements based on our audits. We conducted our audits in accordance with Canadian generally accepted auditing standards. Those standards require that we comply with ethical requirements and plan and perform the audit to obtain reasonable assurance about whether the consolidated financial statements are free from material misstatement. An audit involves performing procedures to obtain audit evidence about the amounts and disclosures in the consolidated financial statements. The procedures selected depend on the auditor’s judgment, including the assessment of the risks of material misstatement of the consolidated financial statements, whether due to fraud or error. In making those risk assessments, the auditor considers internal control relevant to the entity’s preparation and fair presentation of the consolidated financial statements in order to design audit procedures that are appropriate in the circumstances, but not for the purpose of expressing an opinion on the effectiveness of the entity’s internal control. An audit also includes evaluating the appropriateness of accounting policies used and the reasonableness of accounting estimates made by management, as well as evaluating the overall presentation of the consolidated financial statements. We believe that the audit evidence we have obtained in our audits is sufficient and appropriate to provide a basis for our audit opinion. Opinion In our opinion, the consolidated financial statements present fairly, in all material respects, the financial position of Enbridge Income Partners LP and its subsidiaries as at December 31, 2017 and December 31, 2016 and the results of their operations and their cash flows for the years then ended in accordance with accounting principles generally accepted in the United States of America. Chartered Professional Accountants Calgary, Alberta February 16, 2018
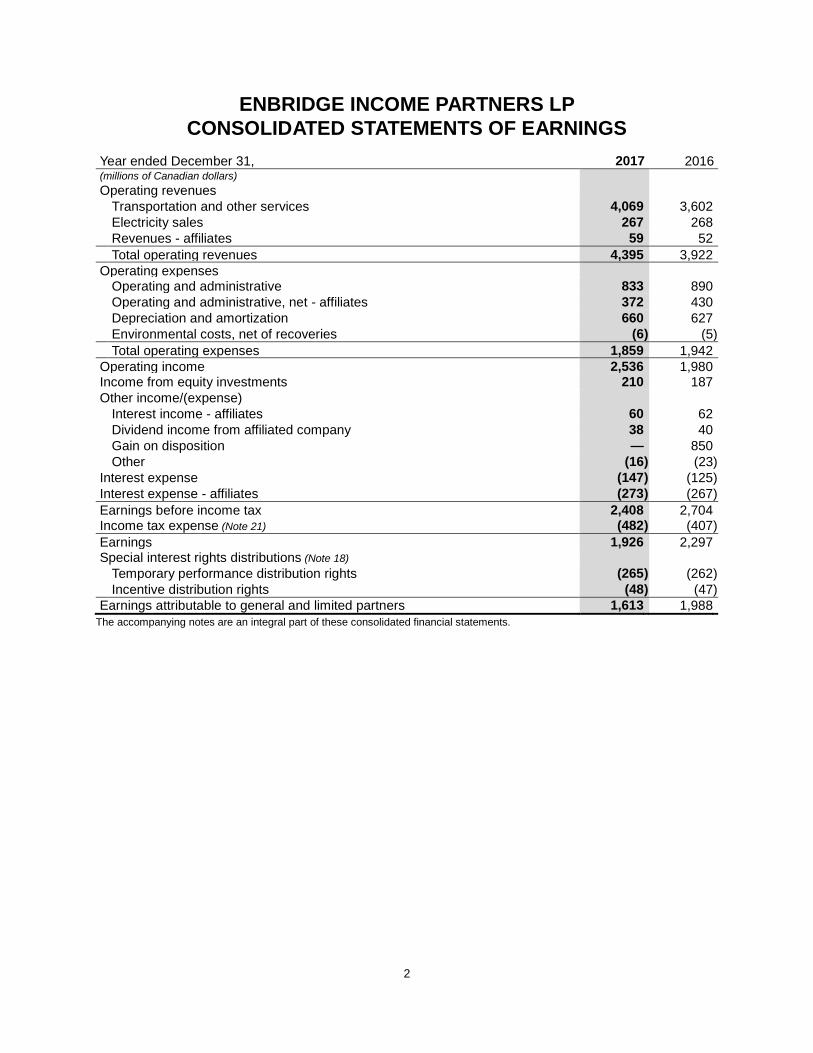
2
ENBRIDGE INCOME PARTNERS LP CONSOLIDATED STATEMENTS OF EARNINGS
Year ended December 31, 2017 2016 (millions of Canadian dollars) Operating revenues Transportation and other services 4,069 3,602 Electricity sales 267 268 Revenues - affiliates 59 52 Total operating revenues 4,395 3,922 Operating expenses Operating and administrative 833 890 Operating and administrative, net - affiliates 372 430 Depreciation and amortization 660 627 Environmental costs, net of recoveries (6 ) (5 ) Total operating expenses 1,859 1,942 Operating income 2,536 1,980 Income from equity investments 210 187 Other income/(expense) Interest income - affiliates 60 62 Dividend income from affiliated company 38 40 Gain on disposition — 850 Other (16 ) (23 ) Interest expense (147 ) (125 ) Interest expense - affiliates (273 ) (267 ) Earnings before income tax 2,408 2,704 Income tax expense (Note 21) (482 ) (407 ) Earnings 1,926 2,297 Special interest rights distributions (Note 18) Temporary performance distribution rights (265 ) (262 ) Incentive distribution rights (48 ) (47 ) Earnings attributable to general and limited partners 1,613 1,988
The accompanying notes are an integral part of these consolidated financial statements.
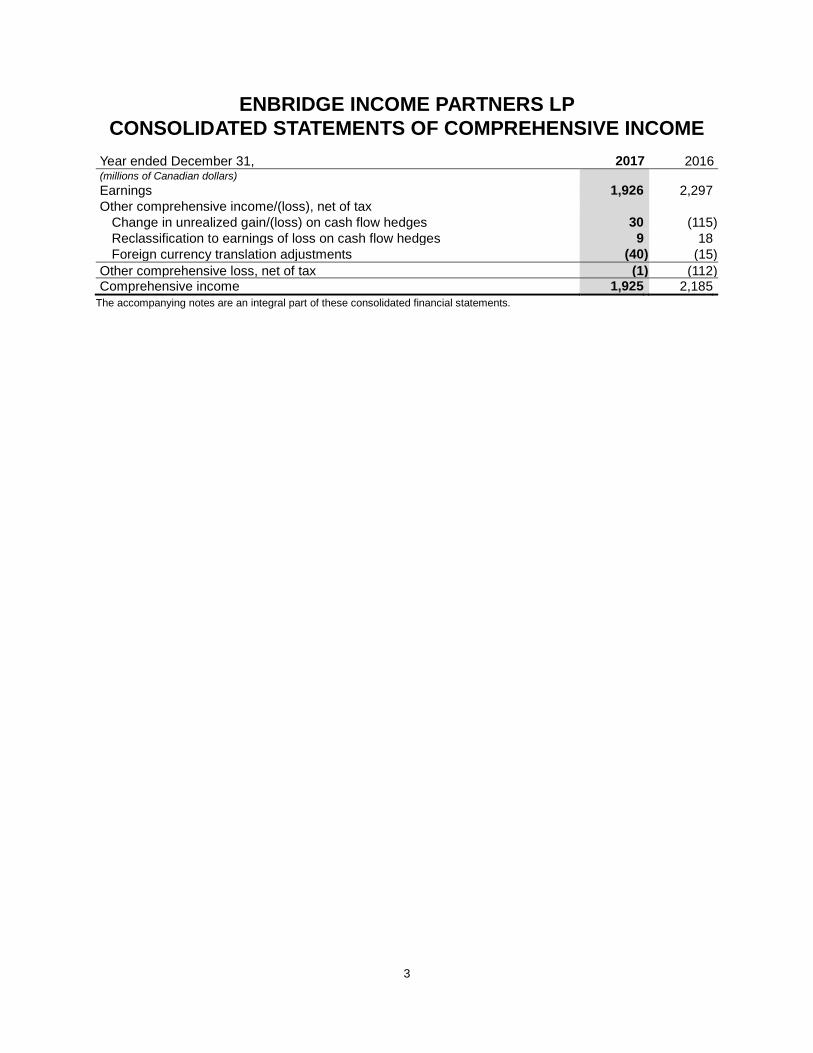
3
ENBRIDGE INCOME PARTNERS LP CONSOLIDATED STATEMENTS OF COMPREHENSIVE INCOME
Year ended December 31, 2017 2016 (millions of Canadian dollars) Earnings 1,926 2,297 Other comprehensive income/(loss), net of tax Change in unrealized gain/(loss) on cash flow hedges 30 (115 ) Reclassification to earnings of loss on cash flow hedges 9 18 Foreign currency translation adjustments (40 ) (15 ) Other comprehensive loss, net of tax (1 ) (112 ) Comprehensive income 1,925 2,185
The accompanying notes are an integral part of these consolidated financial statements.
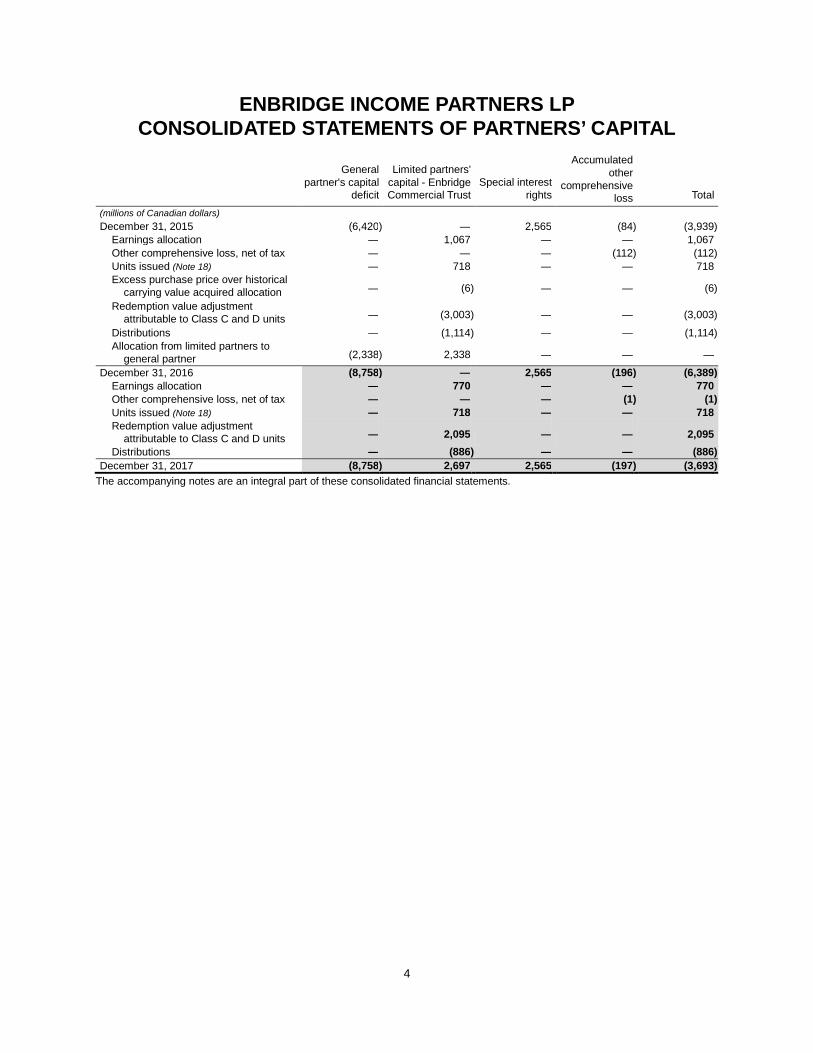
4
ENBRIDGE INCOME PARTNERS LP CONSOLIDATED STATEMENTS OF PARTNERS’ CAPITAL
General partner's capital
deficit
Limited partners' capital - Enbridge Commercial Trust
Special interest rights
Accumulated other
comprehensive loss Total
(millions of Canadian dollars) December 31, 2015 (6,420 ) — 2,565 (84 ) (3,939 ) Earnings allocation — 1,067 — — 1,067 Other comprehensive loss, net of tax — — — (112 ) (112 ) Units issued (Note 18) — 718 — — 718
Excess purchase price over historical
carrying value acquired allocation —
(6 ) —
—
(6 )
Redemption value adjustment
attributable to Class C and D units —
(3,003 ) —
—
(3,003 )
Distributions — (1,114 ) — — (1,114 )
Allocation from limited partners to
general partner (2,338 ) 2,338
—
—
—
December 31, 2016 (8,758 ) — 2,565 (196 ) (6,389 ) Earnings allocation — 770 — — 770 Other comprehensive loss, net of tax — — — (1 ) (1 ) Units issued (Note 18) — 718 — — 718
Redemption value adjustment
attributable to Class C and D units —
2,095
—
—
2,095
Distributions — (886 ) — — (886 ) December 31, 2017 (8,758 ) 2,697 2,565 (197 ) (3,693 )
The accompanying notes are an integral part of these consolidated financial statements.
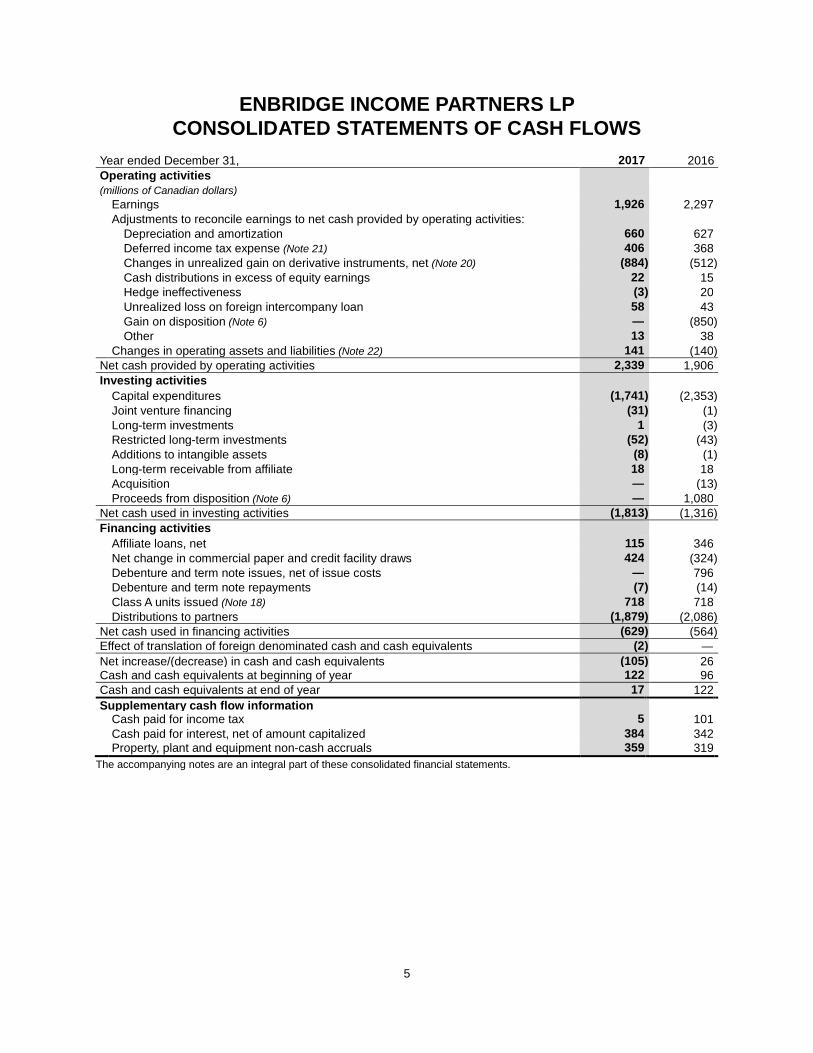
5
ENBRIDGE INCOME PARTNERS LP CONSOLIDATED STATEMENTS OF CASH FLOWS
Year ended December 31, 2017 2016 Operating activities (millions of Canadian dollars) Earnings 1,926 2,297 Adjustments to reconcile earnings to net cash provided by operating activities: Depreciation and amortization 660 627 Deferred income tax expense (Note 21) 406 368 Changes in unrealized gain on derivative instruments, net (Note 20) (884 ) (512 ) Cash distributions in excess of equity earnings 22 15 Hedge ineffectiveness (3 ) 20 Unrealized loss on foreign intercompany loan 58 43 Gain on disposition (Note 6) — (850 ) Other 13 38 Changes in operating assets and liabilities (Note 22) 141 (140 ) Net cash provided by operating activities 2,339 1,906 Investing activities Capital expenditures (1,741 ) (2,353 ) Joint venture financing (31 ) (1 ) Long-term investments 1 (3 ) Restricted long-term investments (52 ) (43 ) Additions to intangible assets (8 ) (1 ) Long-term receivable from affiliate 18 18 Acquisition — (13 ) Proceeds from disposition (Note 6) — 1,080 Net cash used in investing activities (1,813 ) (1,316 ) Financing activities Affiliate loans, net 115 346 Net change in commercial paper and credit facility draws 424 (324 ) Debenture and term note issues, net of issue costs — 796 Debenture and term note repayments (7 ) (14 ) Class A units issued (Note 18) 718 718 Distributions to partners (1,879 ) (2,086 ) Net cash used in financing activities (629 ) (564 ) Effect of translation of foreign denominated cash and cash equivalents (2 ) — Net increase/(decrease) in cash and cash equivalents (105 ) 26 Cash and cash equivalents at beginning of year 122 96 Cash and cash equivalents at end of year 17 122 Supplementary cash flow information Cash paid for income tax 5 101 Cash paid for interest, net of amount capitalized 384 342 Property, plant and equipment non-cash accruals 359 319
The accompanying notes are an integral part of these consolidated financial statements.
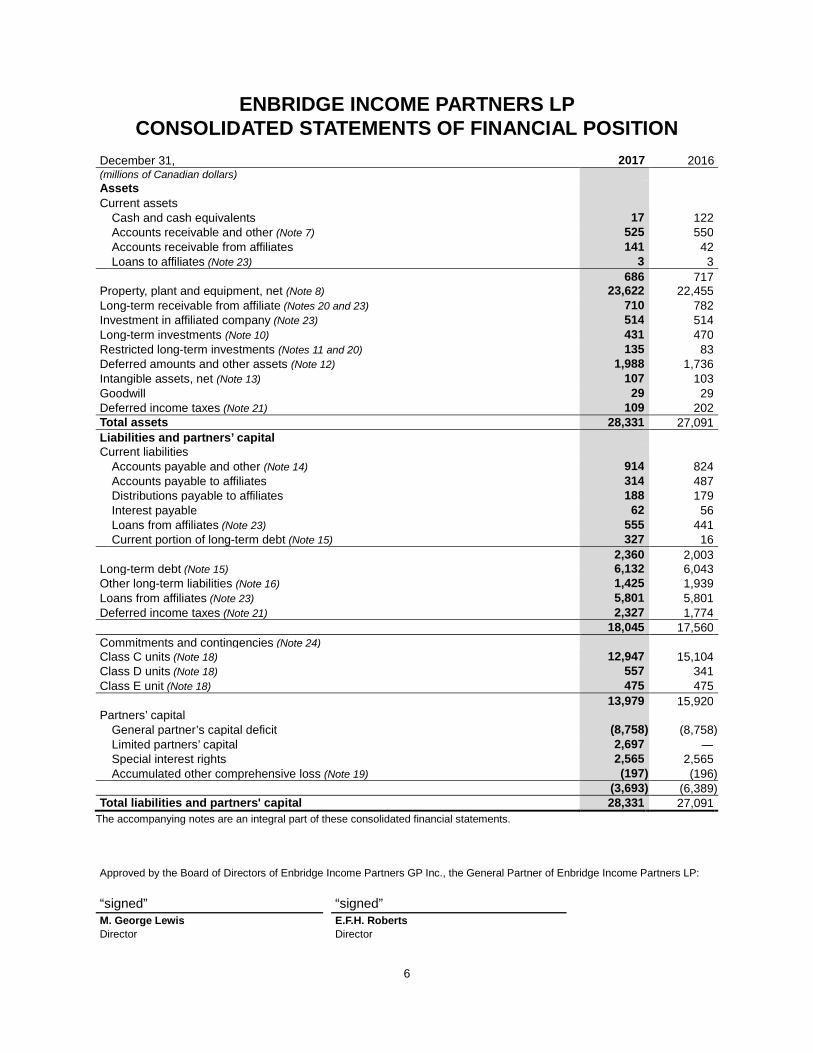
6
ENBRIDGE INCOME PARTNERS LP CONSOLIDATED STATEMENTS OF FINANCIAL POSITION
December 31, 2017 2016 (millions of Canadian dollars) Assets Current assets Cash and cash equivalents 17 122 Accounts receivable and other (Note 7) 525 550 Accounts receivable from affiliates 141 42 Loans to affiliates (Note 23) 3 3 686 717 Property, plant and equipment, net (Note 8) 23,622 22,455 Long-term receivable from affiliate (Notes 20 and 23) 710 782 Investment in affiliated company (Note 23) 514 514 Long-term investments (Note 10) 431 470 Restricted long-term investments (Notes 11 and 20) 135 83 Deferred amounts and other assets (Note 12) 1,988 1,736 Intangible assets, net (Note 13) 107 103 Goodwill 29 29 Deferred income taxes (Note 21) 109 202 Total assets 28,331 27,091 Liabilities and partners’ capital Current liabilities Accounts payable and other (Note 14) 914 824 Accounts payable to affiliates 314 487 Distributions payable to affiliates 188 179 Interest payable 62 56 Loans from affiliates (Note 23) 555 441 Current portion of long-term debt (Note 15) 327 16 2,360 2,003 Long-term debt (Note 15) 6,132 6,043 Other long-term liabilities (Note 16) 1,425 1,939 Loans from affiliates (Note 23) 5,801 5,801 Deferred income taxes (Note 21) 2,327 1,774 18,045 17,560 Commitments and contingencies (Note 24) Class C units (Note 18) 12,947 15,104 Class D units (Note 18) 557 341 Class E unit (Note 18) 475 475 13,979 15,920 Partners’ capital General partner’s capital deficit (8,758 ) (8,758 ) Limited partners’ capital 2,697 — Special interest rights 2,565 2,565 Accumulated other comprehensive loss (Note 19) (197 ) (196 ) (3,693 ) (6,389 ) Total liabilities and partners' capital 28,331 27,091
The accompanying notes are an integral part of these consolidated financial statements.
Approved by the Board of Directors of Enbridge Income Partners GP Inc., the General Partner of Enbridge Income Partners LP: “signed” “signed” M. George Lewis E.F.H. Roberts Director Director
7
NOTES TO THE CONSOLIDATED FINANCIAL STATEMENTS 1. BUSINESS OVERVIEW Enbridge Income Partners LP (EIPLP) was formed in 2002 and is involved in the transportation, storage and generation of energy. EIPLP owns interests in liquids transportation and storage assets, including the Canadian Mainline, the Regional Oil Sands System, a 50% interest in the Alliance Pipeline, which transports natural gas from Canada to the United States, and interests in renewable and alternative power generation assets. EIPLP is a member of the Fund Group, which also includes Enbridge Commercial Trust (ECT) and Enbridge Income Fund (the Fund). EIPLP holds all of the underlying operating entities of the Fund Group through its subsidiaries and investees. Enbridge Inc. (Enbridge), through its wholly-owned subsidiary Enbridge Management Services Inc. (the Manager), is responsible for the operations and day-to-day management of the Fund Group. The Manager also provides administrative and general support services to the Fund Group. The limited partners of EIPLP are Enbridge and certain of its subsidiaries and ECT. As at December 31, 2017, Enbridge held an approximate 53% interest in EIPLP with the remaining 47% held by ECT. Additionally, Enbridge holds a 51% direct interest in the general partner of EIPLP. EIPLP conducts its business through three business segments (Note 4): Liquids Pipelines, Gas Pipelines and Green Power. These operating segments are strategic business units established by senior management to facilitate the achievement of EIPLP’s long-term objectives and the objectives of EIPLP’s partners, as well as to aid in resource allocation decisions and to assess operational performance. LIQUIDS PIPELINES Liquids Pipelines consists of common carrier and contract pipelines, feeder pipelines and gathering systems that transport crude oil, natural gas liquids and refined products and terminals in Canada, including Canadian Mainline, Regional Oil Sands System, Southern Lights Pipeline, which includes the Canadian portion of Southern Lights Pipeline (Southern Lights Canada) and Class A units of certain Enbridge subsidiaries which provide a defined cash flow stream (Southern Lights Class A units) from the United States portion of Southern Lights Pipeline (Southern Lights US), Bakken Expansion Pipeline and Feeder Pipelines and Other. GAS PIPELINES Gas Pipelines includes EIPLP’s 50% interest in the Alliance Pipeline system, which transports liquids-rich natural gas from northeast British Columbia, northwest Alberta and the Bakken area of North Dakota to Channahon, Illinois. GREEN POWER Green Power consists of wind facilities, solar facilities and waste heat recovery facilities located in the provinces of Alberta, Saskatchewan, Ontario and Quebec. ELIMINATIONS AND OTHER In addition to the segments noted above, Eliminations and Other includes operating and administrative costs and foreign exchange impacts which are not allocated to business segments. Also included in Eliminations and Other are new business development activities, general corporate investments and elimination of transactions between segments required to present financial performance and financial position on a consolidated basis.
8
2. SIGNIFICANT ACCOUNTING POLICIES These consolidated financial statements are prepared in accordance with generally accepted accounting principles in the United States of America (U.S. GAAP). Amounts are stated in Canadian dollars unless otherwise noted. EIPLP is permitted to use U.S. GAAP as its primary basis of accounting to enable the Fund to meet its continuous disclosure obligations under an exemption granted by securities regulators in Canada. BASIS OF PRESENTATION AND USE OF ESTIMATES The preparation of financial statements in conformity with U.S. GAAP requires management to make estimates and assumptions that affect the reported amounts of assets, liabilities, revenues and expenses, as well as the disclosure of contingent assets and liabilities in the consolidated financial statements. Significant estimates and assumptions used in the preparation of the consolidated financial statements include, but are not limited to: carrying values of regulatory assets and liabilities (Note 5); unbilled revenues; allowance for doubtful accounts; depreciation rates and carrying value of property, plant and equipment (Note 8); amortization rates of intangible assets (Note 13); measurement of goodwill; fair value of asset retirement obligations (ARO) (Note 17); fair value of financial instruments (Note 20); provisions for income taxes (Note 21); and commitments and contingencies (Note 24). Actual results could differ from these estimates. Effective September 30, 2017, EIPLP combined Cash and cash equivalents and amounts previously presented as Bank indebtedness where the corresponding bank accounts are subject to cash pooling arrangements. As at December 31, 2017, $77 million (2016 - $171 million) of Bank indebtedness has been combined within Cash and cash equivalents. Net cash provided by/(used in) financing activities in EIPLP's Consolidated Statements of Cash Flows for the year ended December 31, 2016 has decreased by $138 million to reflect this change. PRINCIPLES OF CONSOLIDATION The consolidated financial statements include the accounts of EIPLP, its subsidiaries and variable interest entities (VIEs), for which EIPLP is the primary beneficiary. A VIE is a legal entity that does not have sufficient equity at risk to finance its activities without additional subordinated financial support or is structured such that equity investors lack the ability to make significant decisions relating to the entity’s operations through voting rights or do not substantively participate in the gains and losses of the entity. Upon inception of a contractual agreement, EIPLP performs an assessment to determine whether the arrangement contains a variable interest in a legal entity and whether that legal entity is a VIE. The primary beneficiary has both the power to direct the activities of the VIE that most significantly impact the entity’s economic performance and the obligation to absorb losses or the right to receive benefits from the VIE entity that could potentially be significant to the VIE. Where EIPLP concludes it is the primary beneficiary of a VIE, it will consolidate the accounts of that VIE. EIPLP assesses all variable interests in the entity and uses its judgment when determining if EIPLP is the primary beneficiary. Other qualitative factors that are considered include decision-making responsibilities, the VIE capital structure, risk and rewards sharing, contractual agreements with the VIE, voting rights and level of involvement of other parties. A reconsideration of whether an entity is a VIE occurs when there are certain changes in the facts and circumstances related to a VIE. EIPLP assesses the primary beneficiary determination for a VIE on an ongoing basis, as there are changes in the facts and circumstances related to a VIE. The consolidated financial statements also include the accounts of any limited partnerships where EIPLP represents the general partner and, based on all facts and circumstances, controls such limited partnerships, unless the limited partner has substantive participating rights or substantive kick-out rights. For certain investments where EIPLP retains an undivided interest in assets and liabilities, EIPLP records its proportionate share of assets, liabilities, revenues and expenses. If an entity is determined to not be a VIE, the voting interest entity model will be applied.
9
All significant intercompany accounts and transactions are eliminated upon consolidation. Investments and entities over which EIPLP exercises significant influence are accounted for using the equity method. EARNINGS ALLOCATION EIPLP allocates earnings based on the Hypothetical Liquidation at Book Value (HLBV) method. EIPLP applies the HLBV method for allocation of earnings and other comprehensive income/loss (OCI) where cash distributions, including both preference and residual distributions are not based on the investor’s ownership percentages. Under the HLBV method, a calculation is prepared at each balance sheet date to determine the amount that the partners would receive if EIPLP were to liquidate all of its assets, as valued in accordance with U.S. GAAP, and distribute that cash to the respective partners. The difference between the calculated liquidation distribution amounts at the beginning and the end of the reporting period, after adjusting for capital contributions and distributions, is the partners’ share of the earnings or loss from EIPLP for the period. The limited partners' capital accounts are limited to the balance of their capital account and any allocation that draws the account to a deficit position is reallocated to the general partner. REGULATION Certain of EIPLP’s businesses are subject to regulation by various authorities including, but not limited to, the National Energy Board (NEB), the Federal Energy Regulatory Commission (FERC), the Alberta Energy Regulator, and Manitoba Mineral Resources. Regulatory bodies exercise statutory authority over matters such as construction, rates and ratemaking and agreements with customers. To recognize the economic effects of the actions of the regulator, the timing of recognition of certain revenues and expenses in these operations may differ from that otherwise expected under U.S. GAAP for non rate-regulated entities. Regulatory assets represent amounts that are expected to be recovered from customers in future periods through rates. Regulatory liabilities represent amounts that are expected to be refunded to customers in future periods through rates or expected to be paid to cover future abandonment costs in relation to the NEB’s Land Matters Consultation Initiative (LMCI). Long-term regulatory assets are recorded in Deferred amounts and other assets and current regulatory assets are recorded in Accounts receivable and other. Long-term regulatory liabilities are included in Other long-term liabilities and current regulatory liabilities are recorded in Accounts payable and other. Regulatory assets are assessed for impairment if EIPLP identifies an event indicative of possible impairment. The recognition of regulatory assets and liabilities is based on the actions, or expected future actions, of the regulator. To the extent that the regulator’s actions differ from EIPLP’s expectations, the timing and amount of recovery or settlement of regulatory balances could differ significantly from those recorded. In the absence of rate regulation, EIPLP would generally not recognize regulatory assets or liabilities and the earnings impact would be recorded in the period the expenses are incurred or revenues are earned. A regulatory asset or liability is recognized in respect of deferred income taxes when it is expected the amounts will be recovered or settled through future regulator-approved rates. Allowance for funds used during construction (AFUDC) is included in the cost of property, plant and equipment and is depreciated over future periods as part of the total cost of the related asset. AFUDC includes both an interest component and, if approved by the regulator, a cost of equity component, which are both capitalized based on rates set out in a regulatory agreement. In the absence of rate regulation, EIPLP would capitalize interest using a capitalization rate based on its cost of borrowing, whereas the capitalized equity component, the corresponding earnings during the construction phase and the subsequent depreciation would not be recognized.
10
REVENUE RECOGNITION For businesses that are not rate-regulated, revenues are recorded when products have been delivered or services have been performed, the amount of revenue can be reliably measured and collectability is reasonably assured. Customer credit worthiness is assessed prior to agreement signing as well as throughout the contract duration. Certain revenues from liquids are recognized under the terms of committed delivery contracts rather than the cash tolls received. Long-term take-or-pay contracts, under which shippers are obligated to pay fixed amounts rateably over the contract period regardless of volumes shipped, may contain make-up rights. Make-up rights are earned by shippers when minimum volume commitments are not utilized during the period but under certain circumstances can be used to offset overages in future periods, subject to expiry periods. EIPLP recognizes revenues associated with make-up rights at the earlier of when the make-up volume is shipped, the make-up right expires or when it is determined that the likelihood that the shipper will utilize the make-up right is remote. For the year ended December 31, 2017, cash received net of revenue recognized for contracts under make-up rights and similar deferred revenue arrangements was $65 million (2016 - $57 million). For rate-regulated businesses, revenues are recognized in a manner that is consistent with the underlying agreements as approved by the regulators. From July 1, 2011 onward, Canadian Mainline (excluding Lines 8 and 9) earnings are governed by the Competitive Toll Settlement (CTS), under which revenues are recorded when services are performed. Effective on that date, EIPLP prospectively discontinued the application of rate-regulated accounting for those assets with the exception of flow-through income taxes covered by a specific rate order. DERIVATIVE INSTRUMENTS AND HEDGING Non-qualifying Derivatives Non-qualifying derivative instruments are used primarily to economically hedge foreign exchange, interest rate and commodity price earnings exposure. Non-qualifying derivatives are measured at fair value with changes in fair value recognized in earnings in Transportation and other services revenues, Operating and administrative expense, Other income/(expense) and Interest expense. Derivatives in Qualifying Hedging Relationships EIPLP uses derivative financial instruments to manage its exposure to changes in commodity prices, foreign exchange rates, and interest rates. Hedge accounting is optional and requires EIPLP to document the hedging relationship and test the hedging item’s effectiveness in offsetting changes in fair values or cash flows of the underlying hedged item on an ongoing basis. EIPLP presents the earnings effects of hedging items with the hedged transaction. Derivatives in qualifying hedging relationships are categorized as cash flow hedges, fair value hedges and net investment hedges. As at December 31, 2017 and 2016, EIPLP did not have any fair value or net investment hedges. Cash Flow Hedges EIPLP uses cash flow hedges to manage its exposure to changes in commodity prices, foreign exchange rates and interest rates. The effective portion of the change in the fair value of a cash flow hedging instrument is recorded in OCI and is reclassified to earnings when the hedged item impacts earnings. Any hedge ineffectiveness is recorded in current period earnings. If a derivative instrument designated as a cash flow hedge ceases to be effective or is terminated, hedge accounting is discontinued and the gain or loss at that date is deferred in OCI and recognized concurrently with the related transaction. If a hedged anticipated transaction is no longer probable, the gain or loss is recognized immediately in earnings. Subsequent gains and losses from derivative instruments for which hedge accounting has been discontinued are recognized in earnings in the period in which they occur.
11
Classification of Derivatives EIPLP recognizes the fair market value of derivative instruments on the Consolidated Statements of Financial Position as current and non-current assets or liabilities depending on the timing of the settlements and the resulting cash flows associated with the instruments. Fair value amounts related to cash flows occurring beyond one year are classified as non-current. Cash inflows and outflows related to derivative instruments are classified as Operating activities on the Consolidated Statements of Cash Flows. Balance Sheet Offset Assets and liabilities arising from derivative instruments may be offset in the Consolidated Statements of Financial Position when EIPLP has the legal right and intention to settle them on a net basis. Transaction Costs Transaction costs are incremental costs directly related to the acquisition of a financial asset or the issuance of a financial liability. EIPLP incurs transaction costs primarily from the issuance of debt and accounts for these costs as a deduction from Long-term debt on the Consolidated Statements of Financial Position. These costs are amortized using the effective interest rate method over the life of the related debt instrument and are recorded in Interest expense. EQUITY INVESTMENTS Equity investments over which EIPLP exercises significant influence, but does not have controlling financial interests, are accounted for using the equity method. Equity investments are initially measured at cost and are adjusted for EIPLP’s proportionate share of undistributed equity earnings or loss. Equity investments are increased for contributions made to and decreased for distributions received from the investees. To the extent an equity investee undertakes activities necessary to commence its planned principal operations, EIPLP capitalizes interest costs associated with its investment during such period. RESTRICTED LONG-TERM INVESTMENTS Long-term investments that are restricted as to withdrawal or usage, for the purposes of the NEB’s LMCI, are presented as Restricted long-term investments on the Consolidated Statements of Financial Position. INCOME TAX Pursuant to the Income Tax Act (Canada), EIPLP, as a partnership, is not subject to income taxes. However, subsidiary corporations are taxable and applicable income taxes have been reflected in these consolidated financial statements. The liability method of accounting for income taxes is followed for subsidiary corporations. Deferred income tax assets and liabilities are recorded based on temporary differences between the tax bases of assets and liabilities and their carrying values for accounting purposes. Deferred income tax assets and liabilities are measured using the tax rate that is expected to apply when the temporary differences reverse. For EIPLP’s regulated operations, a deferred income tax liability is recognized with a corresponding regulatory asset to the extent taxes can be recovered through rates. Any interest and/or penalty incurred related to tax is reflected in Income tax expense. FOREIGN CURRENCY TRANSACTIONS AND TRANSLATION Foreign currency transactions are those transactions whose terms are denominated in a currency other than the currency of the primary economic environment in which EIPLP or a reporting subsidiary operates, referred to as the functional currency. Transactions denominated in foreign currencies are translated into the functional currency using the exchange rate prevailing at the date of transaction. Monetary assets and liabilities denominated in foreign currencies are translated to the functional currency using the rate of exchange in effect at the balance sheet date. Exchange gains and losses resulting from translation of monetary assets and liabilities are included in the Consolidated Statements of Earnings in the period in which they arise.
12
Gains and losses arising from translation of foreign operations’ functional currencies to EIPLP’s Canadian dollar presentation currency are included in the cumulative translation adjustment component of accumulated other comprehensive income/(loss) (AOCI) and are recognized in earnings upon sale of the foreign operation. Asset and liability accounts are translated at the exchange rates in effect on the balance sheet date, while revenues and expenses are translated using monthly average exchange rates. CASH AND CASH EQUIVALENTS Cash and cash equivalents include short-term investments with a term to maturity of three months or less when purchased. LOANS AND RECEIVABLES Affiliate long-term notes receivable are measured at amortized cost using the effective interest rate method, net of any impairment losses recognized. Accounts receivable and other are measured at cost. Interest income is recognized in earnings as it is earned with the passage of time. ALLOWANCE FOR DOUBTFUL ACCOUNTS Allowance for doubtful accounts is determined based on collection history. When EIPLP has determined that further collection efforts are unlikely to be successful, amounts charged to the allowance for doubtful accounts are applied against the impaired accounts receivable. PROPERTY, PLANT AND EQUIPMENT Property, plant and equipment is recorded at historical cost. Expenditures for construction, expansion, major renewals and betterments are capitalized. Maintenance and repair costs are expensed as incurred. Expenditures for project development are capitalized if they are expected to have future benefit. EIPLP capitalizes interest incurred during construction for non rate-regulated assets. For rate-regulated assets, AFUDC is included in the cost of property, plant and equipment and is depreciated over future periods as part of the total cost of the related asset. AFUDC includes both an interest component and, if approved by the regulator, a cost of equity component. Two primary methods of depreciation are utilized. For distinct assets, depreciation is generally provided on a straight-line basis over the estimated useful lives of the assets commencing when the asset is placed in service. For largely homogeneous groups of assets with comparable useful lives, the pool method of accounting for property, plant and equipment is followed whereby similar assets are grouped and depreciated as a pool. When group assets are retired or otherwise disposed of, gains and losses are not reflected in earnings but are booked as an adjustment to accumulated depreciation. DEFERRED AMOUNTS AND OTHER ASSETS Deferred amounts and other assets primarily include: costs which regulatory authorities have permitted, or are expected to permit, to be recovered through future rates including deferred income taxes; contractual receivables under the terms of long-term delivery contracts; and derivative financial instruments. GOODWILL Goodwill represents the excess of the purchase price over the fair value of net identifiable assets on acquisition of a business. The carrying value of goodwill, which is not amortized, is assessed for impairment annually, or more frequently if events or changes in circumstances arise that suggest the carrying value of goodwill may be impaired. EIPLP performs its annual review for impairment at the reporting unit level, which is identified by assessing whether the components of its operating segments constitute businesses for which discrete information is available, whether segment management regularly reviews the operating results of those components and whether the economic and regulatory characteristics are similar. EIPLP determined that its reporting units are equivalent to its reportable segments. EIPLP has the option to first assess

13
qualitative factors to determine whether it is necessary to perform the quantitative goodwill impairment test. The quantitative goodwill impairment test involves determining the fair value of its reporting units and comparing those values to the carrying value of each reporting unit. If the carrying value of a reporting unit, including allocated goodwill, exceeds its fair value, goodwill impairment is measured at the amount by which the reporting unit’s carrying value exceeds its fair value. This amount should not exceed the carrying amount of goodwill. INTANGIBLE ASSETS Intangible assets consist primarily of certain software costs, acquired power purchase agreements, land leases and permits. EIPLP capitalizes costs incurred during the application development stage of internal use software projects. Intangible assets are amortized on a straight-line basis over their expected lives, commencing when the asset is available for use. IMPAIRMENT EIPLP reviews the carrying values of its long-lived assets as events or changes in circumstances warrant. If it is determined that the carrying value of an asset exceeds the undiscounted cash flows expected from the asset, EIPLP calculates fair value based on the discounted cash flows and writes the assets down to the extent that the carrying value exceeds fair value. With respect to investments in debt and equity securities, EIPLP assesses at each balance sheet date whether there is objective evidence that a financial asset is impaired by completing a quantitative or qualitative analysis of factors impacting the investment. If there is determined to be objective evidence of impairment, EIPLP internally values the expected discounted cash flows using observable market inputs and determines whether the decline below carrying value is other than temporary. If the decline is determined to be other than temporary, an impairment charge is recorded in earnings with an offsetting reduction to the carrying value of the asset. With respect to other financial assets, EIPLP assesses the assets for impairment when it no longer has reasonable assurance of timely collection. If evidence of impairment is noted, EIPLP reduces the value of the financial asset to its estimated realizable amount, determined using discounted expected future cash flows. ASSET RETIREMENT OBLIGATIONS ARO associated with the retirement of long-lived assets are measured at fair value and recognized as Accounts payable and other or Other long-term liabilities in the period in which they can be reasonably determined. The fair value approximates the cost a third party would charge to perform the tasks necessary to retire such assets and is recognized at the present value of expected future cash flows. ARO are added to the carrying value of the associated asset and depreciated over the asset’s useful life. The corresponding liability is accreted over time through charges to earnings and is reduced by actual costs of decommissioning and reclamation. EIPLP’s estimates of retirement costs could change as a result of changes in cost estimates and regulatory requirements. COMMITMENTS, CONTINGENCIES AND ENVIRONMENTAL LIABILITIES EIPLP expenses or capitalizes, as appropriate, expenditures for ongoing compliance with environmental regulations that relate to past or current operations. EIPLP expenses costs incurred for remediation of existing environmental contamination caused by past operations that do not benefit future periods by preventing or eliminating future contamination. EIPLP records liabilities for environmental matters when assessments indicate that remediation efforts are probable and the costs can be reasonably estimated. Estimates of environmental liabilities are based on currently available facts, existing technology and presently enacted laws and regulations taking into consideration the likely effects of inflation and other factors. These amounts also consider prior experience in remediating contaminated sites, other companies’ clean-up experience and data released by government organizations. EIPLP’s estimates are subject to revision in future periods based on actual costs or new information and are included in Accounts payable and other and Other long-term liabilities in the Consolidated Statements of Financial
14
Position at their undiscounted amounts. There is always a potential of incurring additional costs in connection with environmental liabilities due to variations in any or all of the categories described above, including modified or revised requirements from regulatory agencies, in addition to fines and penalties, as well as expenditures associated with litigation and settlement of claims. EIPLP evaluates recoveries from insurance coverage separately from the liability and, when recovery is probable, EIPLP records and reports an asset separately from the associated liability in the Consolidated Statements of Financial Position. An estimated loss for commitments and contingencies is recognized when, after fully analyzing available information, EIPLP determines it is either probable that an asset has been impaired, or that a liability has been incurred, and the amount of impairment or loss can be reasonably estimated. When a range of probable loss can be estimated, EIPLP recognizes the most likely amount, or if no amount is more likely than another, the minimum of the range of probable loss is accrued. EIPLP expenses legal costs associated with loss contingencies as such costs are incurred. 3. CHANGES IN ACCOUNTING POLICIES ADOPTION OF NEW STANDARDS Simplifying the Measurement of Goodwill Impairment Effective January 1, 2017, EIPLP early adopted Accounting Standards Update (ASU) 2017-04 and applied the standard on a prospective basis. Under the new guidance, goodwill impairment will now be the amount by which a reporting unit’s carrying value exceeds its fair value; this amount should not exceed the carrying amount of goodwill. The adoption of the pronouncement did not have a material impact on EIPLP’s consolidated financial statements. Clarifying the Definition of a Business in an Acquisition Effective January 1, 2017, EIPLP early adopted ASU 2017-01 on a prospective basis. The new standard was issued with the objective of adding guidance to assist entities with evaluating whether transactions should be accounted for as acquisitions (disposals) of assets or businesses. The adoption of the pronouncement did not have a material impact on EIPLP's consolidated financial statements. Accounting for Intra-Entity Asset Transfers Effective January 1, 2017, EIPLP early adopted ASU 2016-16 on a modified retrospective basis. The new standard was issued with the intent of improving the accounting for the income tax consequences of intra-entity asset transfers other than inventory. Under the new guidance, an entity should recognize the income tax consequences of an intra-entity transfer of an asset, other than inventory, when the transfer occurs. The adoption of the pronouncement did not have a material impact on EIPLP’s consolidated financial statements. FUTURE ACCOUNTING POLICY CHANGES Improvements to Accounting for Hedging Activities ASU 2017-12 was issued in August 2017 with the objective of better aligning a company’s risk management activities and the resulting hedge accounting reflected in the financial statements. The accounting update allows cash flow hedging of contractually specified components in financial and non-financial items. Under the new guidance, hedge ineffectiveness is no longer required to be measured and hedging instruments’ fair value changes will be recorded in the same income statement line as the hedged item. The ASU also allows the initial quantitative hedge effectiveness assessment to be performed at any time before the end of the quarter in which the hedge is designated. After initial quantitative testing is performed, an ongoing qualitative effectiveness assessment is permitted. The accounting update is effective January 1, 2019 and is to be applied on a modified retrospective basis. EIPLP is currently assessing the impact of the new standard on its consolidated financial statements.
15
Clarifying Guidance on Derecognition and Partial Sales of Nonfinancial Assets ASU 2017-05 was issued in February 2017 with the intent of clarifying the scope of asset derecognition guidance and accounting for partial sales of nonfinancial assets. The ASU clarifies the scope provisions of nonfinancial assets and how to allocate consideration to each distinct asset, and amends the guidance for derecognition of a distinct nonfinancial asset in partial sale transactions. The accounting update is effective January 1, 2018 and will be applied on a modified retrospective basis. EIPLP does not expect the adoption of this accounting update to have a material impact on the consolidated financial statements. Simplifying Cash Flow Classification ASU 2016-15 was issued in August 2016 with the intent of reducing diversity in practice of how certain cash receipts and cash payments are classified in the statement of cash flows. The new guidance addresses eight specific presentation issues. The accounting update is effective January 1, 2018 and will be applied on a retrospective basis. EIPLP assessed each of the eight specific presentation issues and the adoption of this ASU does not have a material impact on its consolidated financial statements. Accounting for Credit Losses ASU 2016-13 was issued in June 2016 with the intent of providing financial statement users with more useful information about the expected credit losses on financial instruments and other commitments to extend credit held by a reporting entity at each reporting date. Current treatment uses the incurred loss methodology for recognizing credit losses that delays the recognition until it is probable a loss has been incurred. The accounting update adds a new impairment model, known as the current expected credit loss model, which is based on expected losses rather than incurred losses. Under the new guidance, an entity recognizes as an allowance its estimate of expected credit losses, which the Financial Accounting Standards Board believes will result in more timely recognition of such losses. EIPLP is currently assessing the impact of the new standard on its consolidated financial statements. The accounting update is effective January 1, 2020. Recognition of Leases ASU 2016-02 was issued in February 2016 with the intent to increase transparency and comparability among organizations. It requires lessees of operating lease arrangements to recognize lease assets and lease liabilities on the statement of financial position and disclose additional key information about lease agreements. The accounting update also replaces the current definition of a lease and requires that an arrangement be recognized as a lease when a customer has the right to obtain substantially all of the economic benefits from the use of an asset, as well as the right to direct the use of the asset. EIPLP is currently gathering a complete inventory of its lease contracts in order to assess the impact of the new standard on its consolidated financial statements. The accounting update is effective January 1, 2019 and is to be applied using a modified retrospective approach. Recognition and Measurement of Financial Assets and Liabilities ASU 2016-01 was issued in January 2016 with the intent to address certain aspects of recognition, measurement, presentation and disclosure of financial assets and liabilities. Investments in equity securities, excluding equity method and consolidated investments, are no longer classified as trading or available-for-sale securities. All investments in equity securities with readily determinable fair values are classified as investments at fair value through net income. Investments in equity securities without readily determinable fair values are measured using the fair value measurement alternative and are recorded at cost minus impairment, if any, plus or minus changes resulting from observable price changes in orderly transactions for an identical or similar investment of the same issuer. Investments in equity securities measured using the fair value measurement alternative are reviewed for indicators of impairment each reporting period. Fair value of financial instruments for disclosure purposes is measured using exit price. The accounting update is effective January 1, 2018 and will be applied on a prospective basis. EIPLP does not expect the adoption of this accounting update to have a material impact on its consolidated financial statements.
16
Revenue from Contracts with Customers ASU 2014-09 was issued in 2014 with the intent of significantly enhancing consistency and comparability of revenue recognition practices across entities and industries. The new standard establishes a single, principles-based five-step model to be applied to all contracts with customers and introduces new and enhanced disclosure requirements. It also requires the use of more estimates and judgments than the present standards in addition to additional disclosures. The new standard is effective January 1, 2018. The new standard permits either a full retrospective method of adoption with restatement of all prior periods presented, or a modified retrospective method with the cumulative effect of applying the new standard recognized as an adjustment to opening retained earnings in the period of adoption. EIPLP has decided to adopt the new standard using the modified retrospective method. EIPLP has reviewed its revenue contracts in order to evaluate the effect of the new standard on its revenue recognition practices. Based on EIPLP's assessment, the adoption of the new standard will have the following impact to EIPLP's financial statements:
• Estimates of variable consideration which will be required under the new standard for certain revenue contracts as well as the allocation of the transaction price for certain Liquids Pipelines revenue contracts, may result in changes to the pattern or timing of revenue recognition for those contracts.
• Certain payments received from customers to offset the cost of constructing assets required to provide services to those customers, referred to as Contributions in Aid of Construction (CIACs) were previously recorded as reductions of property, plant and equipment regardless of whether the amounts were imposed by regulation or negotiated. Under the new standard, negotiated CIACs are deemed to be advance payments for services and must be recognized when those future services are provided. Negotiated CIACs will be accounted for as deferred revenue and recognized over the term of the associated revenue contract.
Upon adoption, EIPLP will recognize the cumulative effect of initially applying the new standard. The significant impacts of adoption include a decrease in the opening balance of partners’ capital of approximately $140 million, an increase in property, plant and equipment of $100 million and an increase in deferred revenue of $110 million, subject to final determination, as at January 1, 2018. The cumulative effect of initially applying the new standard will be allocated to the General Partner and the Limited Partners based on their respective partnership interests, with any remaining negative balance in Limited Partners’ capital allocated to the General Partner.
EIPLP has also developed and tested processes to generate the disclosures which will be required under the new standard commencing in the first quarter of 2018. 4. SEGMENTED INFORMATION Effective December 31, 2017, EIPLP revised its segmented information presentation on a retrospective basis to present Earnings before interest, income taxes and depreciation and amortization of each segment as opposed to Earnings before interest and income taxes.

17
Segmented information for the years ended December 31, 2017 and 2016 are as follows: Liquids Gas Green Eliminations Year ended December 31, 2017 Pipelines Pipelines Power and Other Consolidated (millions of Canadian dollars) Revenues 4,071 — 324 — 4,395 Operating and administrative (1,132 ) — (67 ) (6 ) (1,205 ) Environmental costs, net of recoveries 6 — — — 6 2,945 — 257 (6 ) 3,196 Income from equity investments — 208 2 — 210 Other income 71 5 2 4 82 Earnings/(loss) before interest and income taxes and
depreciation and amortization 3,016 213 261 (2 ) 3,488 Depreciation and amortization (660 ) Interest expense (420 ) Income tax expense (482 ) Special interest rights distributions (313 ) Earnings attributable to general and limited partners 1,613 Capital expenditures 1,735 — 6 — 1,741 Total assets 25,061 386 2,156 728 28,331
Liquids Gas Green Eliminations Year ended December 31, 2016 Pipelines Pipelines Power and Other Consolidated (millions of Canadian dollars) Revenues 3,609 — 313 — 3,922 Operating and administrative (1,232 ) — (66 ) (22 ) (1,320 ) Environmental costs, net of recoveries 5 — — — 5 2,382 — 247 (22 ) 2,607 Income/(loss) from equity investments — 188 (1 ) — 187 Other income 906 6 1 16 929 Earnings/(loss) before interest and income taxes and
depreciation and amortization 3,288 194 247 (6 ) 3,723 Depreciation and amortization (627 ) Interest expense (392 ) Income tax expense (407 ) Special interest rights distributions (309 ) Earnings attributable to general and limited partners 1,988 Capital expenditures 2,349 — 4 — 2,353 Total assets 23,623 423 2,254 791 27,091
The measurement basis for preparation of segmented information is consistent with the significant accounting policies (Note 2). 5. REGULATORY MATTERS GENERAL INFORMATION ON RATE REGULATION AND ITS ECONOMIC EFFECTS EIPLP's Canadian Mainline and Southern Lights Pipeline businesses are subject to regulation by the NEB. EIPLP also collects and sets aside funds to cover future pipeline abandonment costs for all NEB regulated pipelines as a result of the NEB’s regulatory requirements under LMCI (Note 11). Amounts expected to be paid to cover future abandonment costs are recognized as long-term regulatory liabilities. EIPLP’s significant regulated businesses and other related accounting impacts are described below.
18
Canadian Mainline Canadian Mainline is subject to regulation by the NEB. Canadian Mainline tolls (excluding Lines 8 and 9) are currently governed by the 10-year CTS, which establishes a Canadian Local Toll for all volumes shipped on the Canadian Mainline and an International Joint Tariff for all volumes shipped from western Canadian receipt points to delivery points on Enbridge’s Lakehead System and delivery points on the Canadian Mainline downstream of the Lakehead System. The CTS was negotiated with shippers in accordance with NEB guidelines, was approved by the NEB in June 2011 and took effect July 1, 2011. Under the CTS, a regulatory asset is recognized to offset deferred income taxes as a NEB rate order governing flow-through income tax treatment permits future recovery. No other material regulatory assets or liabilities are recognized under the terms of the CTS. Southern Lights Pipeline Southern Lights Canada is regulated by the NEB. Shippers on Southern Lights Canada are subject to long-term transportation contracts under a cost of service toll methodology. Toll adjustments are filed annually with the NEB. Tariffs provide for recovery of allowable operating and debt financing costs, plus a pre-determined after-tax rate of return on equity of 10%. Southern Lights Canada tolls are based on a deemed 70% debt and 30% equity structure. Saskatchewan Gathering System On December 1, 2016, EIPLP disposed of the Saskatchewan Gathering System as part of the sale of the South Prairie Region assets (Note 6). The Saskatchewan Gathering System is regulated by the Saskatchewan Ministry of Economy. The Saskatchewan Gathering System follows a cost of service methodology. In May 2016, EIPLP reached a Settlement Agreement (the Settlement) with a group of shippers that revised the tolling methodology on the Saskatchewan Gathering System. The regulatory governance of the Settlement changed and as such, all of the criteria required for the continued application of rate-regulated accounting treatment were no longer met and derecognition of regulatory balances as at May 1, 2016 was required. Accordingly, EIPLP recognized a one-time, non-cash loss of $6 million (net of income taxes recovery of $2 million, which was reported within Income tax expense) due to the derecognition of regulatory assets reported within Other income/(expense) on the Consolidated Statements of Earnings. Further, EIPLP recorded a one-time, non-cash gain of $9 million within Income tax expense on the Consolidated Statements of Earnings related to the regulatory liability that EIPLP had previously recorded in respect of deferred tax. Alliance Pipeline The Alliance Pipeline has tolls and tariffs regulated by the NEB in Canada and the FERC in the United States. In December 2015, Alliance Pipeline implemented a new services framework and the related tolls and tariff provisions (collectively, the New Services Framework). Pursuant to the New Services Framework, Alliance Pipeline retains exposure to potential variability in certain future costs and throughput volumes. There are no material regulatory assets or liabilities recognized under the terms of the New Service Framework.
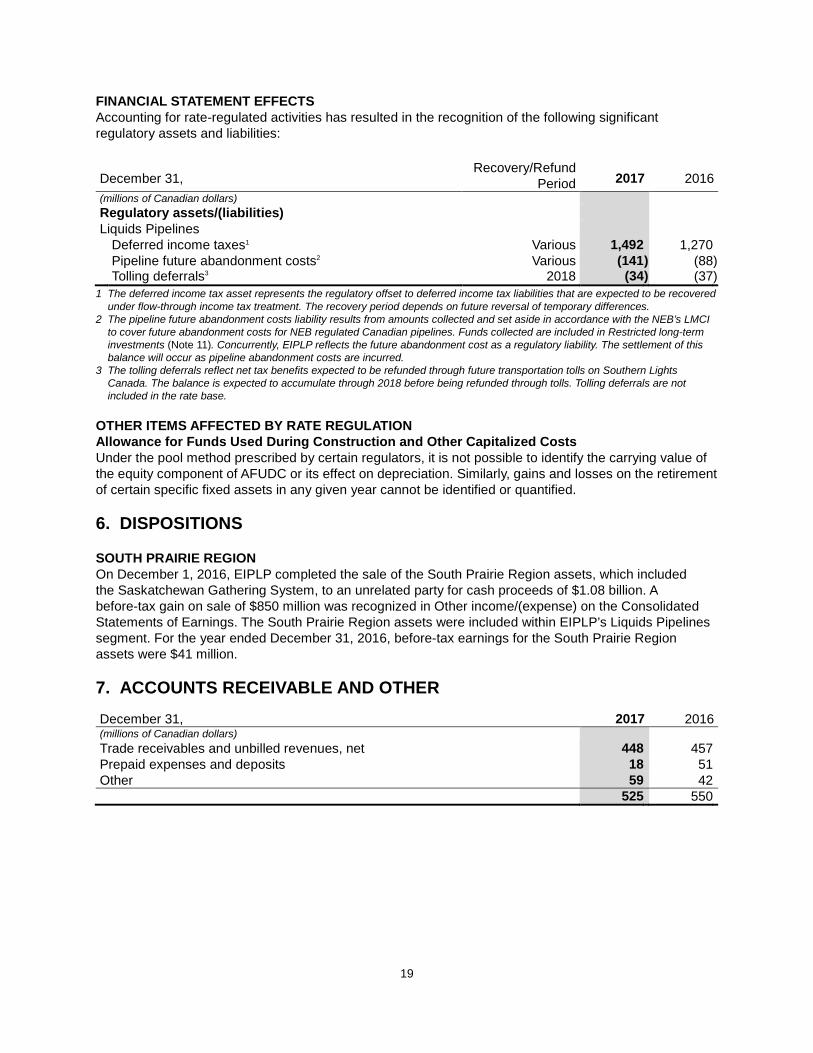
19
FINANCIAL STATEMENT EFFECTS Accounting for rate-regulated activities has resulted in the recognition of the following significant regulatory assets and liabilities:
December 31, Recovery/Refund
Period 2017 2016 (millions of Canadian dollars) Regulatory assets/(liabilities) Liquids Pipelines Deferred income taxes1 Various 1,492 1,270 Pipeline future abandonment costs2 Various (141 ) (88 ) Tolling deferrals3 2018 (34 ) (37 )
1 The deferred income tax asset represents the regulatory offset to deferred income tax liabilities that are expected to be recovered under flow-through income tax treatment. The recovery period depends on future reversal of temporary differences.
2 The pipeline future abandonment costs liability results from amounts collected and set aside in accordance with the NEB’s LMCI to cover future abandonment costs for NEB regulated Canadian pipelines. Funds collected are included in Restricted long-term investments (Note 11). Concurrently, EIPLP reflects the future abandonment cost as a regulatory liability. The settlement of this balance will occur as pipeline abandonment costs are incurred.
3 The tolling deferrals reflect net tax benefits expected to be refunded through future transportation tolls on Southern Lights Canada. The balance is expected to accumulate through 2018 before being refunded through tolls. Tolling deferrals are not included in the rate base.
OTHER ITEMS AFFECTED BY RATE REGULATION Allowance for Funds Used During Construction and Other Capitalized Costs Under the pool method prescribed by certain regulators, it is not possible to identify the carrying value of the equity component of AFUDC or its effect on depreciation. Similarly, gains and losses on the retirement of certain specific fixed assets in any given year cannot be identified or quantified. 6. DISPOSITIONS SOUTH PRAIRIE REGION On December 1, 2016, EIPLP completed the sale of the South Prairie Region assets, which included the Saskatchewan Gathering System, to an unrelated party for cash proceeds of $1.08 billion. A before-tax gain on sale of $850 million was recognized in Other income/(expense) on the Consolidated Statements of Earnings. The South Prairie Region assets were included within EIPLP’s Liquids Pipelines segment. For the year ended December 31, 2016, before-tax earnings for the South Prairie Region assets were $41 million. 7. ACCOUNTS RECEIVABLE AND OTHER December 31, 2017 2016 (millions of Canadian dollars) Trade receivables and unbilled revenues, net 448 457 Prepaid expenses and deposits 18 51 Other 59 42 525 550
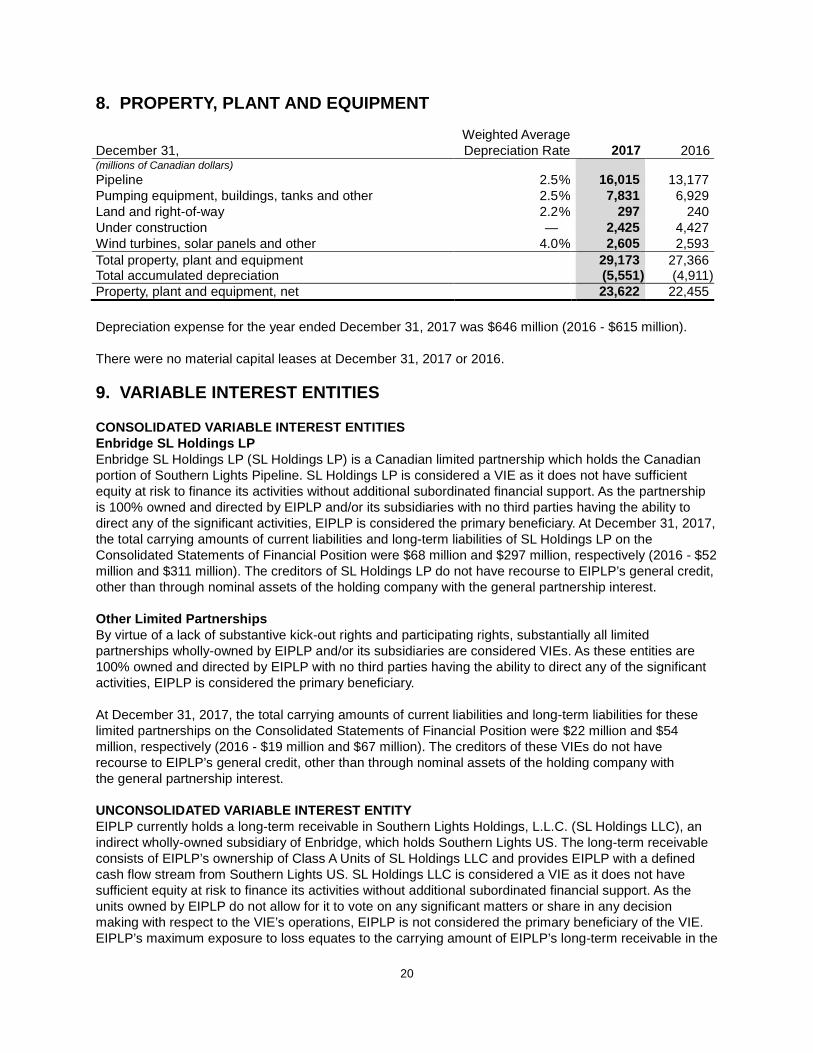
20
8. PROPERTY, PLANT AND EQUIPMENT Weighted Average December 31, Depreciation Rate 2017 2016 (millions of Canadian dollars) Pipeline 2.5 % 16,015 13,177 Pumping equipment, buildings, tanks and other 2.5 % 7,831 6,929 Land and right-of-way 2.2 % 297 240 Under construction — 2,425 4,427 Wind turbines, solar panels and other 4.0 % 2,605 2,593 Total property, plant and equipment 29,173 27,366 Total accumulated depreciation (5,551 ) (4,911 ) Property, plant and equipment, net 23,622 22,455 Depreciation expense for the year ended December 31, 2017 was $646 million (2016 - $615 million). There were no material capital leases at December 31, 2017 or 2016. 9. VARIABLE INTEREST ENTITIES CONSOLIDATED VARIABLE INTEREST ENTITIES Enbridge SL Holdings LP Enbridge SL Holdings LP (SL Holdings LP) is a Canadian limited partnership which holds the Canadian portion of Southern Lights Pipeline. SL Holdings LP is considered a VIE as it does not have sufficient equity at risk to finance its activities without additional subordinated financial support. As the partnership is 100% owned and directed by EIPLP and/or its subsidiaries with no third parties having the ability to direct any of the significant activities, EIPLP is considered the primary beneficiary. At December 31, 2017, the total carrying amounts of current liabilities and long-term liabilities of SL Holdings LP on the Consolidated Statements of Financial Position were $68 million and $297 million, respectively (2016 - $52 million and $311 million). The creditors of SL Holdings LP do not have recourse to EIPLP’s general credit, other than through nominal assets of the holding company with the general partnership interest. Other Limited Partnerships By virtue of a lack of substantive kick-out rights and participating rights, substantially all limited partnerships wholly-owned by EIPLP and/or its subsidiaries are considered VIEs. As these entities are 100% owned and directed by EIPLP with no third parties having the ability to direct any of the significant activities, EIPLP is considered the primary beneficiary. At December 31, 2017, the total carrying amounts of current liabilities and long-term liabilities for these limited partnerships on the Consolidated Statements of Financial Position were $22 million and $54 million, respectively (2016 - $19 million and $67 million). The creditors of these VIEs do not have recourse to EIPLP’s general credit, other than through nominal assets of the holding company with the general partnership interest. UNCONSOLIDATED VARIABLE INTEREST ENTITY EIPLP currently holds a long-term receivable in Southern Lights Holdings, L.L.C. (SL Holdings LLC), an indirect wholly-owned subsidiary of Enbridge, which holds Southern Lights US. The long-term receivable consists of EIPLP’s ownership of Class A Units of SL Holdings LLC and provides EIPLP with a defined cash flow stream from Southern Lights US. SL Holdings LLC is considered a VIE as it does not have sufficient equity at risk to finance its activities without additional subordinated financial support. As the units owned by EIPLP do not allow for it to vote on any significant matters or share in any decision making with respect to the VIE’s operations, EIPLP is not considered the primary beneficiary of the VIE. EIPLP’s maximum exposure to loss equates to the carrying amount of EIPLP’s long-term receivable in the
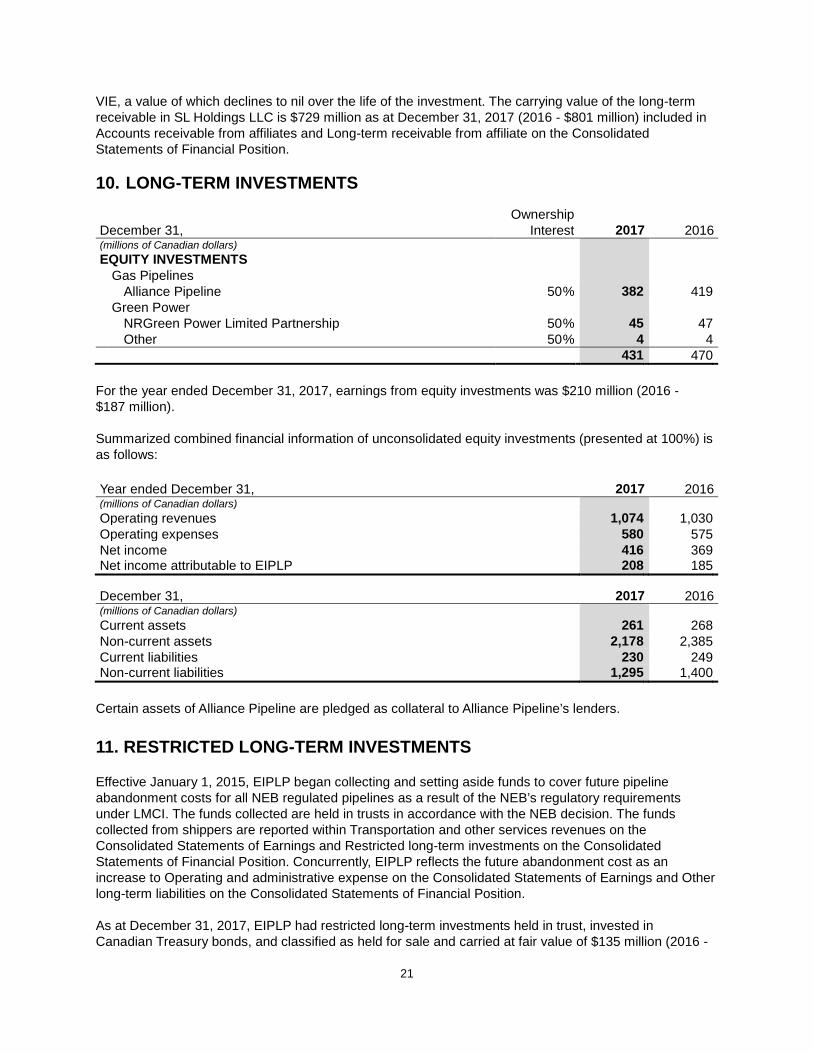
21
VIE, a value of which declines to nil over the life of the investment. The carrying value of the long-term receivable in SL Holdings LLC is $729 million as at December 31, 2017 (2016 - $801 million) included in Accounts receivable from affiliates and Long-term receivable from affiliate on the Consolidated Statements of Financial Position. 10. LONG-TERM INVESTMENTS Ownership December 31, Interest 2017 2016 (millions of Canadian dollars) EQUITY INVESTMENTS Gas Pipelines Alliance Pipeline 50 % 382 419 Green Power NRGreen Power Limited Partnership 50 % 45 47 Other 50 % 4 4 431 470
For the year ended December 31, 2017, earnings from equity investments was $210 million (2016 - $187 million). Summarized combined financial information of unconsolidated equity investments (presented at 100%) is as follows: Year ended December 31, 2017 2016 (millions of Canadian dollars) Operating revenues 1,074 1,030 Operating expenses 580 575 Net income 416 369 Net income attributable to EIPLP 208 185
December 31, 2017 2016 (millions of Canadian dollars) Current assets 261 268 Non-current assets 2,178 2,385 Current liabilities 230 249 Non-current liabilities 1,295 1,400
Certain assets of Alliance Pipeline are pledged as collateral to Alliance Pipeline’s lenders. 11. RESTRICTED LONG-TERM INVESTMENTS Effective January 1, 2015, EIPLP began collecting and setting aside funds to cover future pipeline abandonment costs for all NEB regulated pipelines as a result of the NEB’s regulatory requirements under LMCI. The funds collected are held in trusts in accordance with the NEB decision. The funds collected from shippers are reported within Transportation and other services revenues on the Consolidated Statements of Earnings and Restricted long-term investments on the Consolidated Statements of Financial Position. Concurrently, EIPLP reflects the future abandonment cost as an increase to Operating and administrative expense on the Consolidated Statements of Earnings and Other long-term liabilities on the Consolidated Statements of Financial Position. As at December 31, 2017, EIPLP had restricted long-term investments held in trust, invested in Canadian Treasury bonds, and classified as held for sale and carried at fair value of $135 million (2016 -
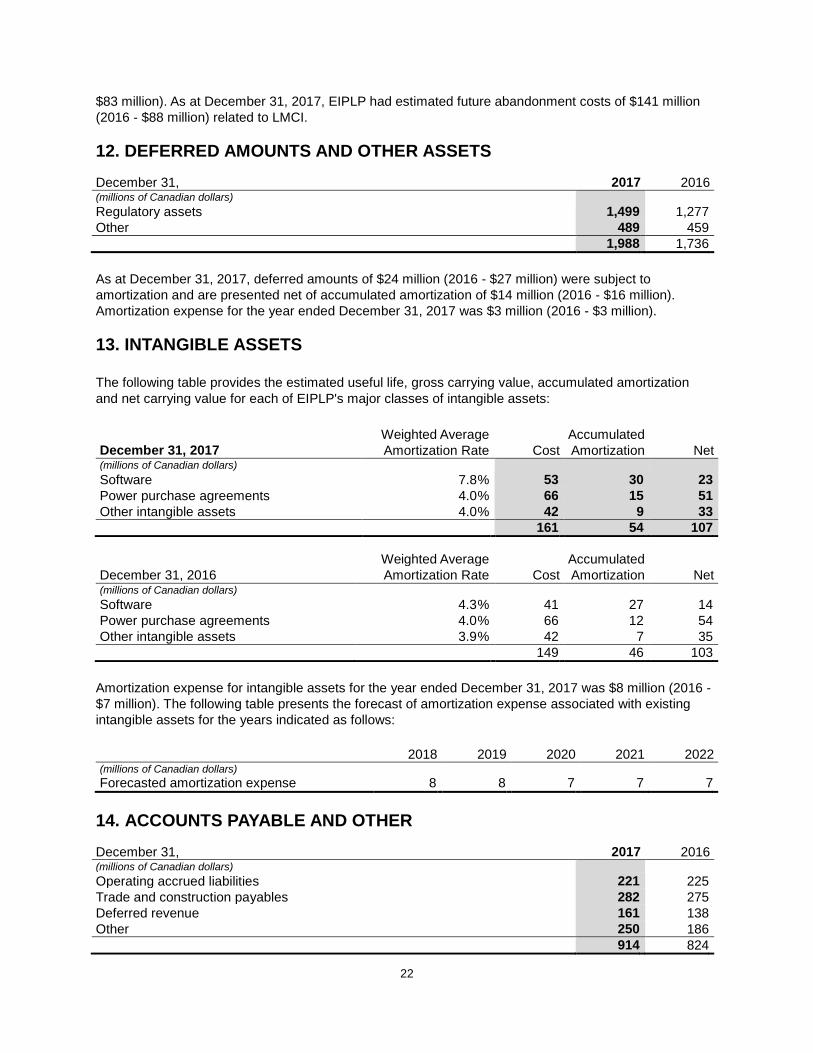
22
$83 million). As at December 31, 2017, EIPLP had estimated future abandonment costs of $141 million (2016 - $88 million) related to LMCI. 12. DEFERRED AMOUNTS AND OTHER ASSETS December 31, 2017 2016 (millions of Canadian dollars) Regulatory assets 1,499 1,277 Other 489 459 1,988 1,736 As at December 31, 2017, deferred amounts of $24 million (2016 - $27 million) were subject to amortization and are presented net of accumulated amortization of $14 million (2016 - $16 million). Amortization expense for the year ended December 31, 2017 was $3 million (2016 - $3 million). 13. INTANGIBLE ASSETS The following table provides the estimated useful life, gross carrying value, accumulated amortization and net carrying value for each of EIPLP's major classes of intangible assets: Weighted Average Accumulated December 31, 2017 Amortization Rate Cost Amortization Net (millions of Canadian dollars) Software 7.8 % 53 30 23 Power purchase agreements 4.0 % 66 15 51 Other intangible assets 4.0 % 42 9 33 161 54 107
Weighted Average Accumulated December 31, 2016 Amortization Rate Cost Amortization Net (millions of Canadian dollars) Software 4.3 % 41 27 14 Power purchase agreements 4.0 % 66 12 54 Other intangible assets 3.9 % 42 7 35 149 46 103
Amortization expense for intangible assets for the year ended December 31, 2017 was $8 million (2016 - $7 million). The following table presents the forecast of amortization expense associated with existing intangible assets for the years indicated as follows: 2018 2019 2020 2021 2022 (millions of Canadian dollars) Forecasted amortization expense 8 8 7 7 7
14. ACCOUNTS PAYABLE AND OTHER December 31, 2017 2016 (millions of Canadian dollars) Operating accrued liabilities 221 225 Trade and construction payables 282 275 Deferred revenue 161 138 Other 250 186 914 824
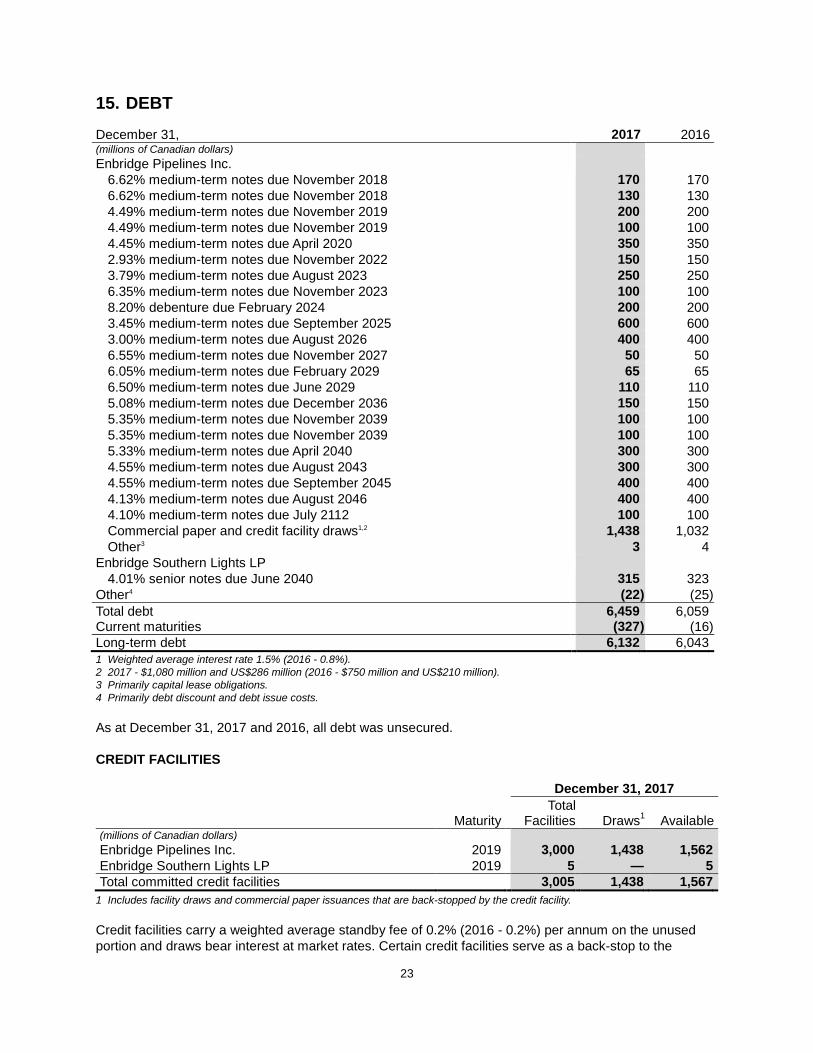
23
15. DEBT December 31, 2017 2016 (millions of Canadian dollars) Enbridge Pipelines Inc. 6.62% medium-term notes due November 2018 170 170 6.62% medium-term notes due November 2018 130 130 4.49% medium-term notes due November 2019 200 200 4.49% medium-term notes due November 2019 100 100 4.45% medium-term notes due April 2020 350 350 2.93% medium-term notes due November 2022 150 150 3.79% medium-term notes due August 2023 250 250 6.35% medium-term notes due November 2023 100 100 8.20% debenture due February 2024 200 200 3.45% medium-term notes due September 2025 600 600 3.00% medium-term notes due August 2026 400 400 6.55% medium-term notes due November 2027 50 50 6.05% medium-term notes due February 2029 65 65 6.50% medium-term notes due June 2029 110 110 5.08% medium-term notes due December 2036 150 150 5.35% medium-term notes due November 2039 100 100 5.35% medium-term notes due November 2039 100 100 5.33% medium-term notes due April 2040 300 300 4.55% medium-term notes due August 2043 300 300 4.55% medium-term notes due September 2045 400 400 4.13% medium-term notes due August 2046 400 400 4.10% medium-term notes due July 2112 100 100 Commercial paper and credit facility draws1,2 1,438 1,032 Other3 3 4 Enbridge Southern Lights LP 4.01% senior notes due June 2040 315 323 Other4 (22 ) (25 ) Total debt 6,459 6,059 Current maturities (327 ) (16 ) Long-term debt 6,132 6,043 1 Weighted average interest rate 1.5% (2016 - 0.8%). 2 2017 - $1,080 million and US$286 million (2016 - $750 million and US$210 million). 3 Primarily capital lease obligations. 4 Primarily debt discount and debt issue costs. As at December 31, 2017 and 2016, all debt was unsecured. CREDIT FACILITIES December 31, 2017 Total Maturity Facilities Draws1 Available (millions of Canadian dollars) Enbridge Pipelines Inc. 2019 3,000 1,438 1,562 Enbridge Southern Lights LP 2019 5 — 5 Total committed credit facilities 3,005 1,438 1,567
1 Includes facility draws and commercial paper issuances that are back-stopped by the credit facility. Credit facilities carry a weighted average standby fee of 0.2% (2016 - 0.2%) per annum on the unused portion and draws bear interest at market rates. Certain credit facilities serve as a back-stop to the
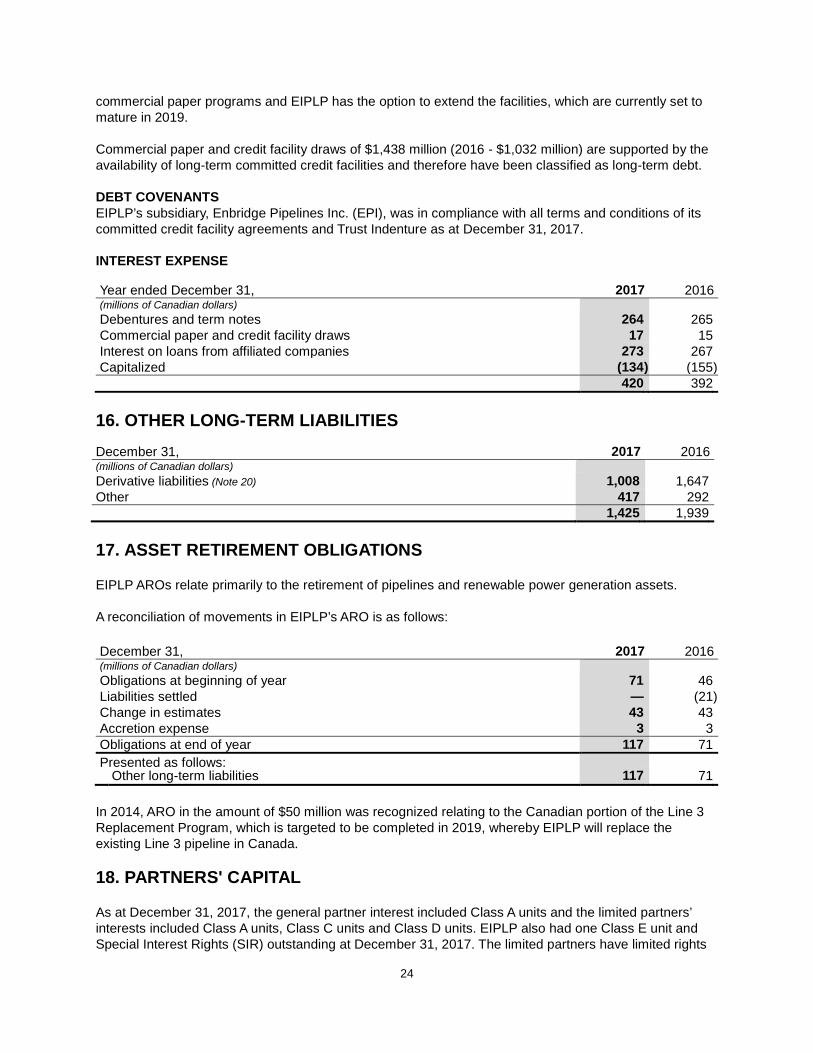
24
commercial paper programs and EIPLP has the option to extend the facilities, which are currently set to mature in 2019. Commercial paper and credit facility draws of $1,438 million (2016 - $1,032 million) are supported by the availability of long-term committed credit facilities and therefore have been classified as long-term debt. DEBT COVENANTS EIPLP’s subsidiary, Enbridge Pipelines Inc. (EPI), was in compliance with all terms and conditions of its committed credit facility agreements and Trust Indenture as at December 31, 2017. INTEREST EXPENSE Year ended December 31, 2017 2016 (millions of Canadian dollars) Debentures and term notes 264 265 Commercial paper and credit facility draws 17 15 Interest on loans from affiliated companies 273 267 Capitalized (134 ) (155 ) 420 392
16. OTHER LONG-TERM LIABILITIES December 31, 2017 2016 (millions of Canadian dollars) Derivative liabilities (Note 20) 1,008 1,647 Other 417 292 1,425 1,939 17. ASSET RETIREMENT OBLIGATIONS EIPLP AROs relate primarily to the retirement of pipelines and renewable power generation assets. A reconciliation of movements in EIPLP’s ARO is as follows: December 31, 2017 2016 (millions of Canadian dollars) Obligations at beginning of year 71 46 Liabilities settled — (21 ) Change in estimates 43 43 Accretion expense 3 3 Obligations at end of year 117 71 Presented as follows: Other long-term liabilities 117 71
In 2014, ARO in the amount of $50 million was recognized relating to the Canadian portion of the Line 3 Replacement Program, which is targeted to be completed in 2019, whereby EIPLP will replace the existing Line 3 pipeline in Canada. 18. PARTNERS' CAPITAL As at December 31, 2017, the general partner interest included Class A units and the limited partners’ interests included Class A units, Class C units and Class D units. EIPLP also had one Class E unit and Special Interest Rights (SIR) outstanding at December 31, 2017. The limited partners have limited rights
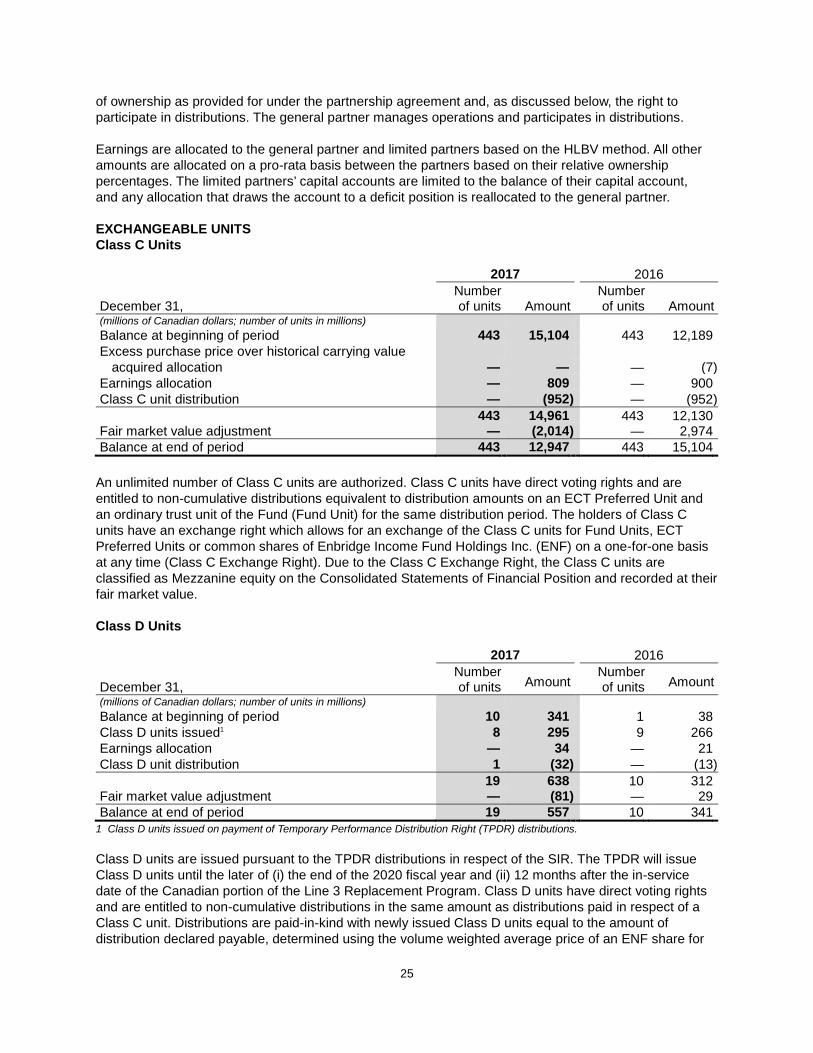
25
of ownership as provided for under the partnership agreement and, as discussed below, the right to participate in distributions. The general partner manages operations and participates in distributions. Earnings are allocated to the general partner and limited partners based on the HLBV method. All other amounts are allocated on a pro-rata basis between the partners based on their relative ownership percentages. The limited partners’ capital accounts are limited to the balance of their capital account, and any allocation that draws the account to a deficit position is reallocated to the general partner. EXCHANGEABLE UNITS Class C Units 2017 2016 Number Number December 31, of units Amount of units Amount (millions of Canadian dollars; number of units in millions) Balance at beginning of period 443 15,104 443 12,189 Excess purchase price over historical carrying value acquired allocation — — — (7 ) Earnings allocation — 809 — 900 Class C unit distribution — (952 ) — (952 ) 443 14,961 443 12,130 Fair market value adjustment — (2,014 ) — 2,974 Balance at end of period 443 12,947 443 15,104
An unlimited number of Class C units are authorized. Class C units have direct voting rights and are entitled to non-cumulative distributions equivalent to distribution amounts on an ECT Preferred Unit and an ordinary trust unit of the Fund (Fund Unit) for the same distribution period. The holders of Class C units have an exchange right which allows for an exchange of the Class C units for Fund Units, ECT Preferred Units or common shares of Enbridge Income Fund Holdings Inc. (ENF) on a one-for-one basis at any time (Class C Exchange Right). Due to the Class C Exchange Right, the Class C units are classified as Mezzanine equity on the Consolidated Statements of Financial Position and recorded at their fair market value. Class D Units 2017 2016 Number
Amount Number
Amount December 31, of units of units (millions of Canadian dollars; number of units in millions) Balance at beginning of period 10 341 1 38 Class D units issued1 8 295 9 266 Earnings allocation — 34 — 21 Class D unit distribution 1 (32 ) — (13 ) 19 638 10 312 Fair market value adjustment — (81 ) — 29 Balance at end of period 19 557 10 341
1 Class D units issued on payment of Temporary Performance Distribution Right (TPDR) distributions. Class D units are issued pursuant to the TPDR distributions in respect of the SIR. The TPDR will issue Class D units until the later of (i) the end of the 2020 fiscal year and (ii) 12 months after the in-service date of the Canadian portion of the Line 3 Replacement Program. Class D units have direct voting rights and are entitled to non-cumulative distributions in the same amount as distributions paid in respect of a Class C unit. Distributions are paid-in-kind with newly issued Class D units equal to the amount of distribution declared payable, determined using the volume weighted average price of an ENF share for
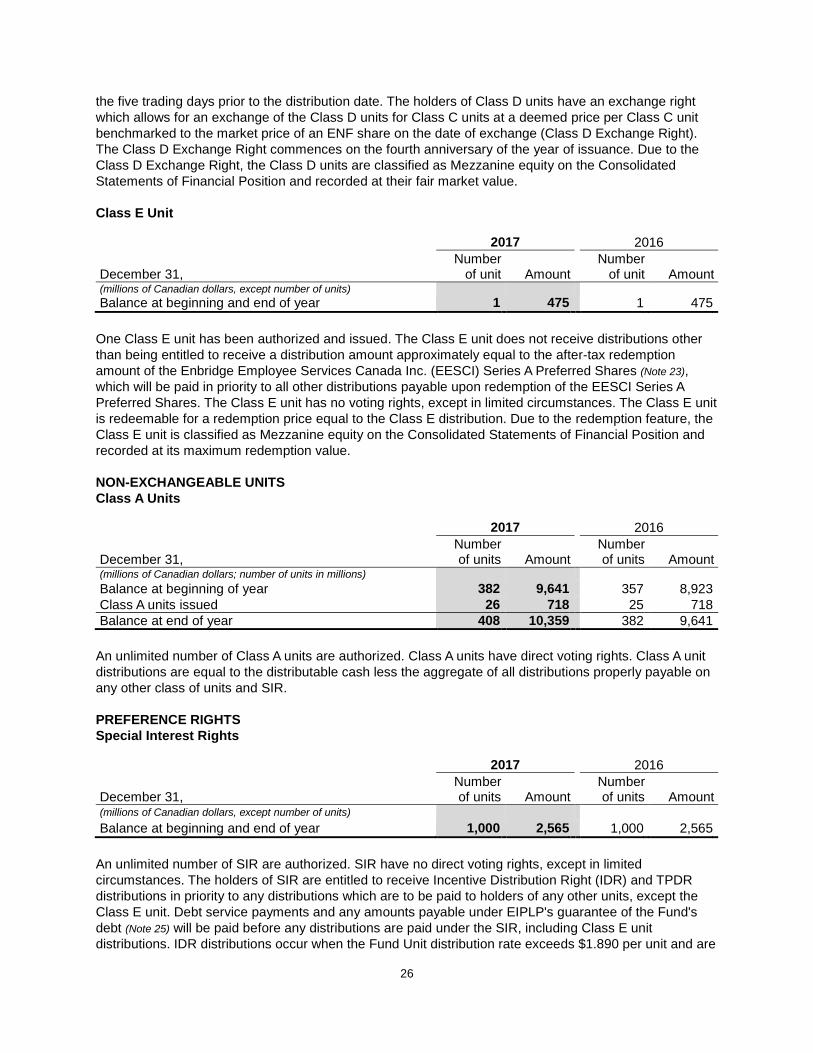
26
the five trading days prior to the distribution date. The holders of Class D units have an exchange right which allows for an exchange of the Class D units for Class C units at a deemed price per Class C unit benchmarked to the market price of an ENF share on the date of exchange (Class D Exchange Right). The Class D Exchange Right commences on the fourth anniversary of the year of issuance. Due to the Class D Exchange Right, the Class D units are classified as Mezzanine equity on the Consolidated Statements of Financial Position and recorded at their fair market value. Class E Unit 2017 2016 Number Number December 31, of unit Amount of unit Amount (millions of Canadian dollars, except number of units) Balance at beginning and end of year 1 475 1 475
One Class E unit has been authorized and issued. The Class E unit does not receive distributions other than being entitled to receive a distribution amount approximately equal to the after-tax redemption amount of the Enbridge Employee Services Canada Inc. (EESCI) Series A Preferred Shares (Note 23), which will be paid in priority to all other distributions payable upon redemption of the EESCI Series A Preferred Shares. The Class E unit has no voting rights, except in limited circumstances. The Class E unit is redeemable for a redemption price equal to the Class E distribution. Due to the redemption feature, the Class E unit is classified as Mezzanine equity on the Consolidated Statements of Financial Position and recorded at its maximum redemption value. NON-EXCHANGEABLE UNITS Class A Units 2017 2016 Number Number December 31, of units Amount of units Amount (millions of Canadian dollars; number of units in millions) Balance at beginning of year 382 9,641 357 8,923 Class A units issued 26 718 25 718 Balance at end of year 408 10,359 382 9,641
An unlimited number of Class A units are authorized. Class A units have direct voting rights. Class A unit distributions are equal to the distributable cash less the aggregate of all distributions properly payable on any other class of units and SIR. PREFERENCE RIGHTS Special Interest Rights 2017 2016 Number Number December 31, of units Amount of units Amount (millions of Canadian dollars, except number of units) Balance at beginning and end of year 1,000 2,565 1,000 2,565
An unlimited number of SIR are authorized. SIR have no direct voting rights, except in limited circumstances. The holders of SIR are entitled to receive Incentive Distribution Right (IDR) and TPDR distributions in priority to any distributions which are to be paid to holders of any other units, except the Class E unit. Debt service payments and any amounts payable under EIPLP's guarantee of the Fund's debt (Note 25) will be paid before any distributions are paid under the SIR, including Class E unit distributions. IDR distributions occur when the Fund Unit distribution rate exceeds $1.890 per unit and are
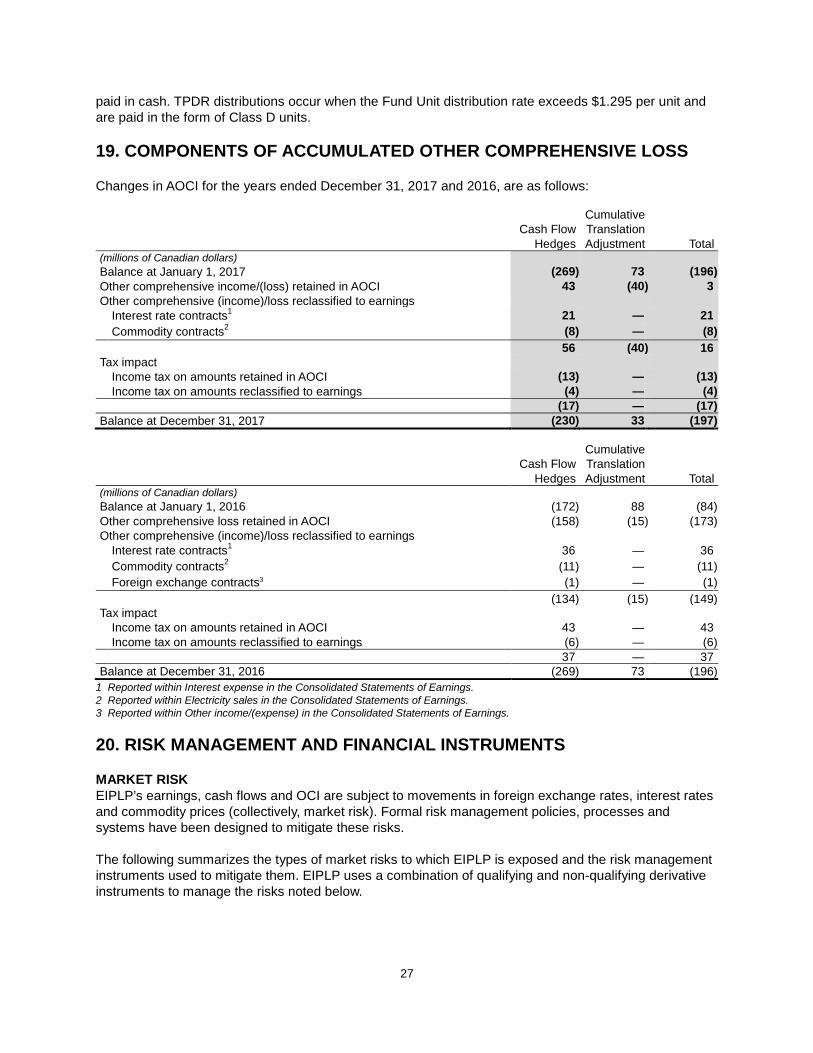
27
paid in cash. TPDR distributions occur when the Fund Unit distribution rate exceeds $1.295 per unit and are paid in the form of Class D units. 19. COMPONENTS OF ACCUMULATED OTHER COMPREHENSIVE LOSS Changes in AOCI for the years ended December 31, 2017 and 2016, are as follows: Cumulative Cash Flow Translation Hedges Adjustment Total (millions of Canadian dollars) Balance at January 1, 2017 (269 ) 73 (196 ) Other comprehensive income/(loss) retained in AOCI 43 (40 ) 3 Other comprehensive (income)/loss reclassified to earnings Interest rate contracts1 21 — 21 Commodity contracts2 (8 ) — (8 ) 56 (40 ) 16 Tax impact Income tax on amounts retained in AOCI (13 ) — (13 ) Income tax on amounts reclassified to earnings (4 ) — (4 ) (17 ) — (17 ) Balance at December 31, 2017 (230 ) 33 (197 )
Cumulative Cash Flow Translation Hedges Adjustment Total (millions of Canadian dollars) Balance at January 1, 2016 (172 ) 88 (84 ) Other comprehensive loss retained in AOCI (158 ) (15 ) (173 ) Other comprehensive (income)/loss reclassified to earnings Interest rate contracts1 36 — 36 Commodity contracts2 (11 ) — (11 ) Foreign exchange contracts3 (1 ) — (1 ) (134 ) (15 ) (149 ) Tax impact Income tax on amounts retained in AOCI 43 — 43 Income tax on amounts reclassified to earnings (6 ) — (6 ) 37 — 37 Balance at December 31, 2016 (269 ) 73 (196 )
1 Reported within Interest expense in the Consolidated Statements of Earnings. 2 Reported within Electricity sales in the Consolidated Statements of Earnings. 3 Reported within Other income/(expense) in the Consolidated Statements of Earnings.
20. RISK MANAGEMENT AND FINANCIAL INSTRUMENTS MARKET RISK EIPLP’s earnings, cash flows and OCI are subject to movements in foreign exchange rates, interest rates and commodity prices (collectively, market risk). Formal risk management policies, processes and systems have been designed to mitigate these risks. The following summarizes the types of market risks to which EIPLP is exposed and the risk management instruments used to mitigate them. EIPLP uses a combination of qualifying and non-qualifying derivative instruments to manage the risks noted below.
28
Foreign Exchange Risk EIPLP generates certain revenues, incurs expenses and holds investments and subsidiaries that are denominated in currencies other than Canadian dollars. As a result, EIPLP’s earnings, cash flows and OCI are exposed to fluctuations resulting from foreign exchange rate variability. EIPLP has implemented a policy whereby, at a minimum, it hedges a level of foreign currency denominated cash flow exposures over a five year forecast horizon. A combination of qualifying and non-qualifying derivative instruments is used to hedge anticipated foreign currency denominated revenues and expenses, and to manage variability in cash flows. Interest Rate Risk EIPLP’s earnings, cash flows and OCI are exposed to short-term interest rate variability due to the regular repricing of its variable rate debt, primarily commercial paper. Pay fixed-receive floating interest rate swaps are used to hedge against the effect of future interest rate movements. EIPLP has implemented a program to significantly mitigate the volatility of short-term interest rates on interest expense via execution of floating to fixed rate interest rate swaps with an average swap rate of 2.3%. EIPLP’s earnings, cash flows and OCI are also exposed to variability in longer term interest rates ahead of anticipated fixed rate debt issuances. Forward starting interest rate swaps are used to hedge against the effect of future interest rate movements. EIPLP has implemented a program to significantly mitigate its exposure to long-term interest rate variability on select forecast term debt issuances via execution of floating to fixed rate interest rate swaps with an average swap rate of 3.0%. EIPLP’s portfolio mix of fixed and variable rate debt instruments is managed by the Fund Group. Commodity Price Risk EIPLP’s earnings, cash flows and OCI are exposed to changes in commodity prices as a result of its ownership interest in certain assets and investments. These commodities primarily consist of crude oil and power. EIPLP employs financial derivative instruments to fix a portion of the variable price exposures that arise from physical transactions involving these commodities. EIPLP may use a combination of qualifying and non-qualifying derivative instruments to manage commodity price risk. TOTAL DERIVATIVE INSTRUMENTS The following table summarizes the Consolidated Statements of Financial Position location and carrying value of EIPLP’s derivative instruments. EIPLP generally has a policy of entering into individual International Swaps and Derivatives Association, Inc. agreements, or other similar derivative agreements, with the majority of its financial derivative counterparties. These agreements provide for the net settlement of derivative instruments outstanding with specific counterparties in the event of bankruptcy or other significant credit event, and would reduce EIPLP’s credit risk exposure on financial derivative asset positions outstanding with the counterparties in these particular circumstances. The following table also summarizes the maximum potential settlement in the event of these specific circumstances. All amounts are presented gross in the Consolidated Statements of Financial Position.
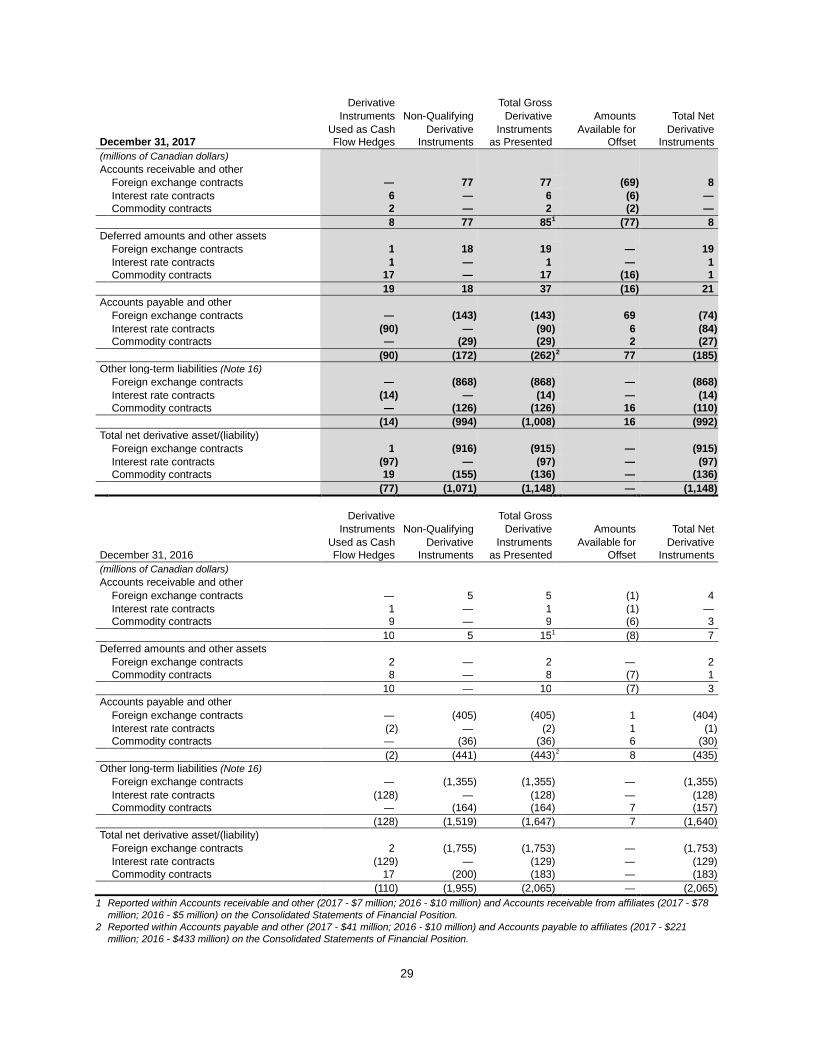
29
Derivative Total Gross Instruments Non-Qualifying Derivative Amounts Total Net Used as Cash Derivative Instruments Available for Derivative December 31, 2017 Flow Hedges Instruments as Presented Offset Instruments (millions of Canadian dollars) Accounts receivable and other Foreign exchange contracts — 77 77 (69 ) 8 Interest rate contracts 6 — 6 (6 ) — Commodity contracts 2 — 2 (2 ) — 8 77 85 1 (77 ) 8 Deferred amounts and other assets Foreign exchange contracts 1 18 19 — 19 Interest rate contracts 1 — 1 — 1 Commodity contracts 17 — 17 (16 ) 1 19 18 37 (16 ) 21 Accounts payable and other Foreign exchange contracts — (143 ) (143 ) 69 (74 ) Interest rate contracts (90 ) — (90 ) 6 (84 ) Commodity contracts — (29 ) (29 ) 2 (27 ) (90 ) (172 ) (262 ) 2 77 (185 ) Other long-term liabilities (Note 16) Foreign exchange contracts — (868 ) (868 ) — (868 ) Interest rate contracts (14 ) — (14 ) — (14 ) Commodity contracts — (126 ) (126 ) 16 (110 ) (14 ) (994 ) (1,008 ) 16 (992 ) Total net derivative asset/(liability) Foreign exchange contracts 1 (916 ) (915 ) — (915 ) Interest rate contracts (97 ) — (97 ) — (97 ) Commodity contracts 19 (155 ) (136 ) — (136 ) (77 ) (1,071 ) (1,148 ) — (1,148 )
Derivative Total Gross Instruments Non-Qualifying Derivative Amounts Total Net Used as Cash Derivative Instruments Available for Derivative December 31, 2016 Flow Hedges Instruments as Presented Offset Instruments (millions of Canadian dollars) Accounts receivable and other Foreign exchange contracts — 5 5 (1 ) 4 Interest rate contracts 1 — 1 (1 ) — Commodity contracts 9 — 9 (6 ) 3 10 5 15 1 (8 ) 7 Deferred amounts and other assets Foreign exchange contracts 2 — 2 — 2 Commodity contracts 8 — 8 (7 ) 1 10 — 10 (7 ) 3 Accounts payable and other Foreign exchange contracts — (405 ) (405 ) 1 (404 ) Interest rate contracts (2 ) — (2 ) 1 (1 ) Commodity contracts — (36 ) (36 ) 6 (30 ) (2 ) (441 ) (443 ) 2 8 (435 ) Other long-term liabilities (Note 16) Foreign exchange contracts — (1,355 ) (1,355 ) — (1,355 ) Interest rate contracts (128 ) — (128 ) — (128 ) Commodity contracts — (164 ) (164 ) 7 (157 ) (128 ) (1,519 ) (1,647 ) 7 (1,640 ) Total net derivative asset/(liability) Foreign exchange contracts 2 (1,755 ) (1,753 ) — (1,753 ) Interest rate contracts (129 ) — (129 ) — (129 ) Commodity contracts 17 (200 ) (183 ) — (183 ) (110 ) (1,955 ) (2,065 ) — (2,065 )
1 Reported within Accounts receivable and other (2017 - $7 million; 2016 - $10 million) and Accounts receivable from affiliates (2017 - $78 million; 2016 - $5 million) on the Consolidated Statements of Financial Position.
2 Reported within Accounts payable and other (2017 - $41 million; 2016 - $10 million) and Accounts payable to affiliates (2017 - $221 million; 2016 - $433 million) on the Consolidated Statements of Financial Position.
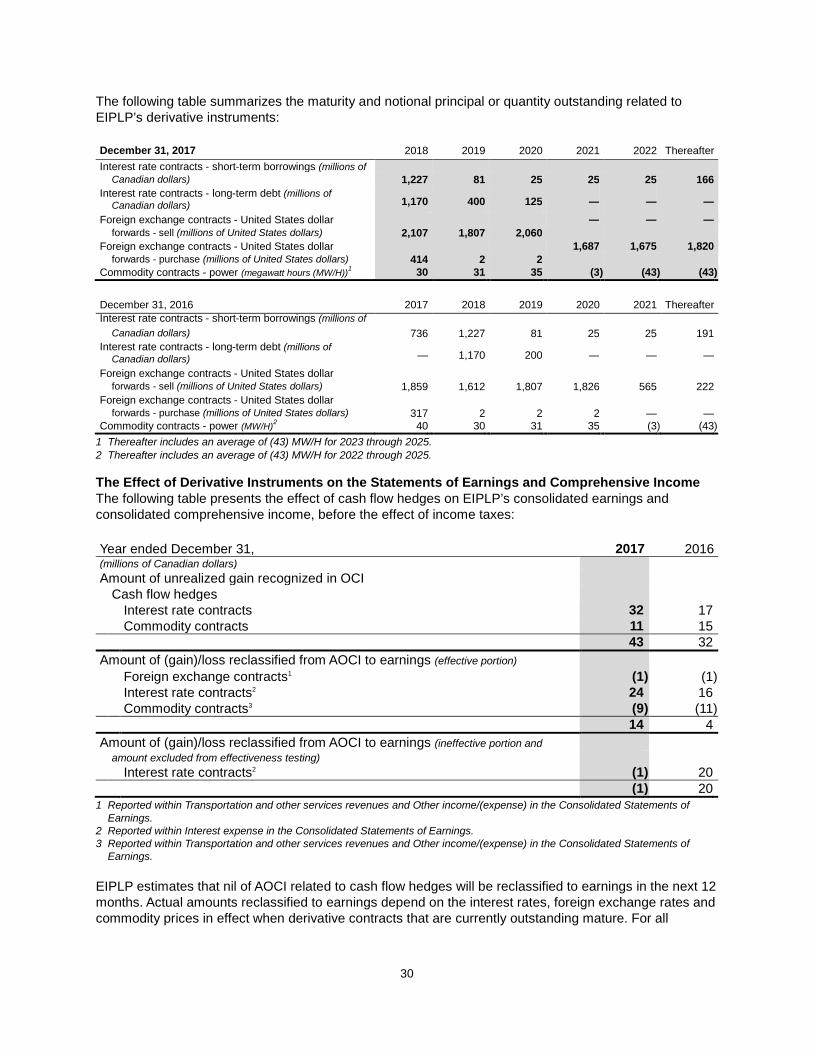
30
The following table summarizes the maturity and notional principal or quantity outstanding related to EIPLP’s derivative instruments: December 31, 2017 2018 2019 2020 2021 2022 Thereafter Interest rate contracts - short-term borrowings (millions of Canadian dollars) 1,227 81 25 25 25 166 Interest rate contracts - long-term debt (millions of
Canadian dollars) 1,170
400
125
—
—
—
Foreign exchange contracts - United States dollar — — — forwards - sell (millions of United States dollars) 2,107 1,807 2,060 Foreign exchange contracts - United States dollar 1,687 1,675 1,820 forwards - purchase (millions of United States dollars) 414 2 2 Commodity contracts - power (megawatt hours (MW/H))1 30 31 35 (3 ) (43 ) (43 )
December 31, 2016 2017 2018 2019 2020 2021 Thereafter Interest rate contracts - short-term borrowings (millions of Canadian dollars) 736 1,227 81 25 25 191 Interest rate contracts - long-term debt (millions of
Canadian dollars) —
1,170
200
—
—
—
Foreign exchange contracts - United States dollar forwards - sell (millions of United States dollars) 1,859 1,612 1,807 1,826 565 222 Foreign exchange contracts - United States dollar forwards - purchase (millions of United States dollars) 317 2 2 2 — — Commodity contracts - power (MW/H)2 40 30 31 35 (3 ) (43 )
1 Thereafter includes an average of (43) MW/H for 2023 through 2025. 2 Thereafter includes an average of (43) MW/H for 2022 through 2025. The Effect of Derivative Instruments on the Statements of Earnings and Comprehensive Income The following table presents the effect of cash flow hedges on EIPLP’s consolidated earnings and consolidated comprehensive income, before the effect of income taxes: Year ended December 31, 2017 2016 (millions of Canadian dollars) Amount of unrealized gain recognized in OCI Cash flow hedges Interest rate contracts 32 17 Commodity contracts 11 15 43 32 Amount of (gain)/loss reclassified from AOCI to earnings (effective portion) Foreign exchange contracts1 (1 ) (1 ) Interest rate contracts2 24 16 Commodity contracts3 (9 ) (11 ) 14 4 Amount of (gain)/loss reclassified from AOCI to earnings (ineffective portion and amount excluded from effectiveness testing) Interest rate contracts2 (1 ) 20 (1 ) 20
1 Reported within Transportation and other services revenues and Other income/(expense) in the Consolidated Statements of Earnings.
2 Reported within Interest expense in the Consolidated Statements of Earnings. 3 Reported within Transportation and other services revenues and Other income/(expense) in the Consolidated Statements of
Earnings. EIPLP estimates that nil of AOCI related to cash flow hedges will be reclassified to earnings in the next 12 months. Actual amounts reclassified to earnings depend on the interest rates, foreign exchange rates and commodity prices in effect when derivative contracts that are currently outstanding mature. For all
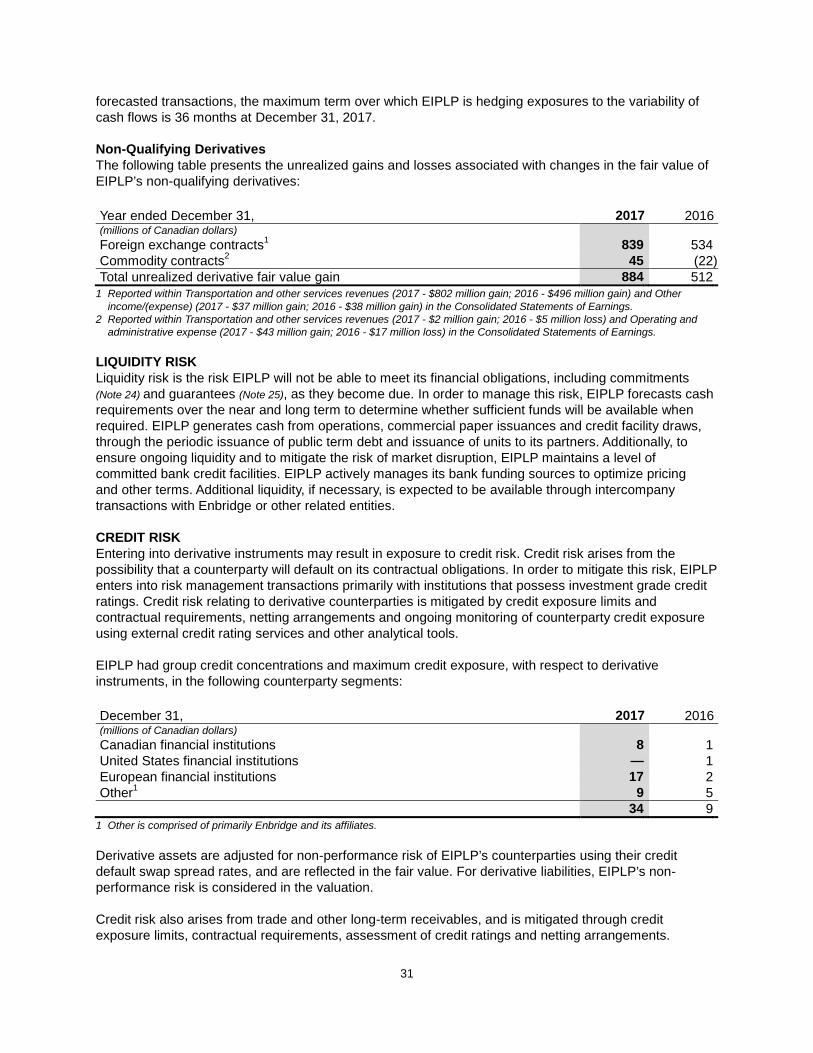
31
forecasted transactions, the maximum term over which EIPLP is hedging exposures to the variability of cash flows is 36 months at December 31, 2017. Non-Qualifying Derivatives The following table presents the unrealized gains and losses associated with changes in the fair value of EIPLP’s non-qualifying derivatives: Year ended December 31, 2017 2016 (millions of Canadian dollars) Foreign exchange contracts1 839 534 Commodity contracts2 45 (22 ) Total unrealized derivative fair value gain 884 512
1 Reported within Transportation and other services revenues (2017 - $802 million gain; 2016 - $496 million gain) and Other income/(expense) (2017 - $37 million gain; 2016 - $38 million gain) in the Consolidated Statements of Earnings.
2 Reported within Transportation and other services revenues (2017 - $2 million gain; 2016 - $5 million loss) and Operating and administrative expense (2017 - $43 million gain; 2016 - $17 million loss) in the Consolidated Statements of Earnings.
LIQUIDITY RISK Liquidity risk is the risk EIPLP will not be able to meet its financial obligations, including commitments (Note 24) and guarantees (Note 25), as they become due. In order to manage this risk, EIPLP forecasts cash requirements over the near and long term to determine whether sufficient funds will be available when required. EIPLP generates cash from operations, commercial paper issuances and credit facility draws, through the periodic issuance of public term debt and issuance of units to its partners. Additionally, to ensure ongoing liquidity and to mitigate the risk of market disruption, EIPLP maintains a level of committed bank credit facilities. EIPLP actively manages its bank funding sources to optimize pricing and other terms. Additional liquidity, if necessary, is expected to be available through intercompany transactions with Enbridge or other related entities. CREDIT RISK Entering into derivative instruments may result in exposure to credit risk. Credit risk arises from the possibility that a counterparty will default on its contractual obligations. In order to mitigate this risk, EIPLP enters into risk management transactions primarily with institutions that possess investment grade credit ratings. Credit risk relating to derivative counterparties is mitigated by credit exposure limits and contractual requirements, netting arrangements and ongoing monitoring of counterparty credit exposure using external credit rating services and other analytical tools. EIPLP had group credit concentrations and maximum credit exposure, with respect to derivative instruments, in the following counterparty segments: December 31, 2017 2016 (millions of Canadian dollars) Canadian financial institutions 8 1 United States financial institutions — 1 European financial institutions 17 2 Other1 9 5 34 9
1 Other is comprised of primarily Enbridge and its affiliates. Derivative assets are adjusted for non-performance risk of EIPLP’s counterparties using their credit default swap spread rates, and are reflected in the fair value. For derivative liabilities, EIPLP’s non-performance risk is considered in the valuation. Credit risk also arises from trade and other long-term receivables, and is mitigated through credit exposure limits, contractual requirements, assessment of credit ratings and netting arrangements.

32
Generally, EIPLP classifies and provides for receivables older than 30 days as past due. The maximum exposure to credit risk related to non-derivative financial assets is their carrying value. FAIR VALUE MEASUREMENTS EIPLP’s financial assets and liabilities measured at fair value on a recurring basis include derivative instruments. EIPLP also discloses the fair value of other financial instruments not measured at fair value. The fair value of financial instruments reflects EIPLP’s best estimates of market value based on generally accepted valuation techniques or models and are supported by observable market prices and rates. When such values are not available, EIPLP uses discounted cash flow analysis from applicable yield curves based on observable market inputs to estimate fair value. FAIR VALUE OF FINANCIAL INSTRUMENTS EIPLP categorizes its derivative instruments measured at fair value into one of three different levels depending on the observability of the inputs employed in the measurement. Level 1 Level 1 includes derivatives measured at fair value based on unadjusted quoted prices for identical assets and liabilities in active markets that are accessible at the measurement date. An active market for a derivative is considered to be a market where transactions occur with sufficient frequency and volume to provide pricing information on an ongoing basis. EIPLP does not have any financial instruments valued using Level 1 inputs. Level 2 Level 2 includes derivative valuations determined using directly or indirectly observable inputs other than quoted prices included within Level 1. Derivatives in this category are valued using models or other industry standard valuation techniques derived from observable market data. Such valuation techniques include inputs such as quoted forward prices, time value, volatility factors and broker quotes that can be observed or corroborated in the market for the entire duration of the derivative. Derivatives valued using Level 2 inputs include non-exchange traded derivatives such as over-the-counter foreign exchange forward contracts and interest rate swaps for which observable inputs can be obtained. EIPLP has also categorized the fair value of its Investment in affiliated company and Long-term debt as Level 2. The fair value is based on quoted market prices for instruments of similar yield, credit risk and tenor. Level 3 Level 3 includes derivative valuations based on inputs which are less observable, unavailable or where the observable data does not support a significant portion of the derivatives' fair value. Generally, Level 3 derivatives are longer dated transactions, occur in less active markets, occur at locations where pricing information is not available or have no binding broker quote to support Level 2 classification. EIPLP has developed methodologies, benchmarked against industry standards, to determine fair value for these derivatives based on extrapolation of observable future prices and rates. Derivatives valued using Level 3 inputs include long-dated derivative power contracts, basis swaps, commodity swaps, power and energy swaps and options. EIPLP uses the most observable inputs available to estimate the fair value of its derivatives. When possible, EIPLP estimates the fair value of its derivatives based on quoted market prices. If quoted market prices are not available, EIPLP uses estimates from third party brokers. For non-exchange traded derivatives classified in Levels 2 and 3, EIPLP uses standard valuation techniques to calculate the estimated fair value. These methods include discounted cash flows for forwards and swaps and Black-Scholes-Merton pricing models for options. Depending on the type of derivative and nature of the underlying risk, EIPLP uses observable market prices (interest, foreign exchange and commodity) and volatility as primary inputs to these valuation techniques. Finally, EIPLP considers its own credit default
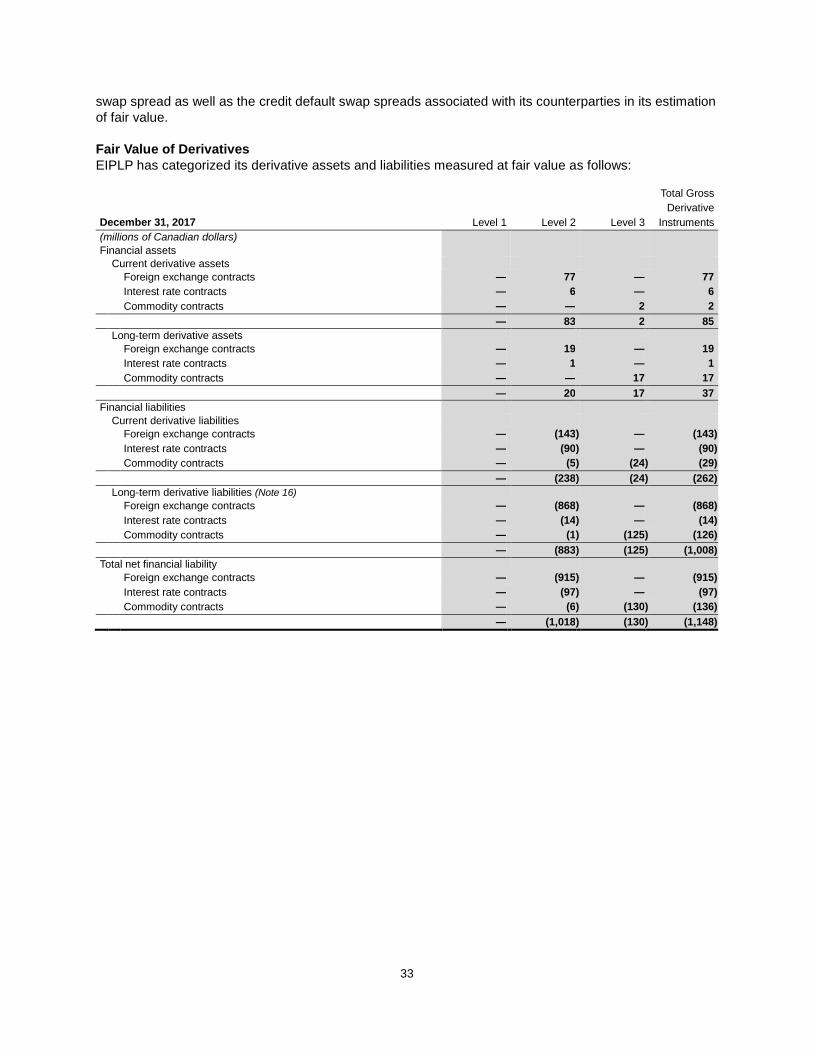
33
swap spread as well as the credit default swap spreads associated with its counterparties in its estimation of fair value. Fair Value of Derivatives EIPLP has categorized its derivative assets and liabilities measured at fair value as follows: Total Gross Derivative December 31, 2017 Level 1 Level 2 Level 3 Instruments (millions of Canadian dollars) Financial assets Current derivative assets Foreign exchange contracts — 77 — 77 Interest rate contracts — 6 — 6 Commodity contracts — — 2 2 — 83 2 85 Long-term derivative assets Foreign exchange contracts — 19 — 19 Interest rate contracts — 1 — 1 Commodity contracts — — 17 17 — 20 17 37 Financial liabilities Current derivative liabilities Foreign exchange contracts — (143 ) — (143 ) Interest rate contracts — (90 ) — (90 ) Commodity contracts — (5 ) (24 ) (29 ) — (238 ) (24 ) (262 ) Long-term derivative liabilities (Note 16) Foreign exchange contracts — (868 ) — (868 ) Interest rate contracts — (14 ) — (14 ) Commodity contracts — (1 ) (125 ) (126 ) — (883 ) (125 ) (1,008 ) Total net financial liability Foreign exchange contracts — (915 ) — (915 ) Interest rate contracts — (97 ) — (97 ) Commodity contracts — (6 ) (130 ) (136 ) — (1,018 ) (130 ) (1,148 )

34
Total Gross Derivative December 31, 2016 Level 1 Level 2 Level 3 Instruments (millions of Canadian dollars) Financial assets Current derivative assets Foreign exchange contracts — 5 — 5 Interest rate contracts — 1 — 1 Commodity contracts — — 9 9 — 6 9 15 Long-term derivative assets Foreign exchange contracts — 2 — 2 Commodity contracts — — 8 8 — 2 8 10 Financial liabilities Current derivative liabilities Foreign exchange contracts — (405 ) — (405 ) Interest rate contracts — (2 ) — (2 ) Commodity contracts — (2 ) (34 ) (36 ) — (409 ) (34 ) (443 ) Long-term derivative liabilities (Note 16) Foreign exchange contracts — (1,355 ) — (1,355 ) Interest rate contracts — (128 ) — (128 ) Commodity contracts — — (164 ) (164 ) — (1,483 ) (164 ) (1,647 ) Total net financial liability Foreign exchange contracts — (1,753 ) — (1,753 ) Interest rate contracts — (129 ) — (129 ) Commodity contracts — (2 ) (181 ) (183 ) — (1,884 ) (181 ) (2,065 )
The significant unobservable inputs used in fair value measurement of Level 3 derivative instruments were as follows: Weighted Unobservable Minimum Maximum Average Unit of December 31, 2017 Fair Value Input Price Price Price Measurement (fair value in millions of Canadian dollars) Commodity contracts - financial1 Power (130) Forward power price 35.30 71.41 50.96 $/MW/H
1 Financial and physical forward commodity contracts are valued using a market approach valuation technique. If adjusted, the significant unobservable inputs disclosed in the table above would have a direct impact on the fair value of EIPLP’s Level 3 derivative instruments. The significant unobservable inputs used in the fair value measurement of Level 3 derivative instruments include forward commodity prices and for option contracts, price volatility. Changes in forward commodity prices could result in significantly different fair values for EIPLP’s Level 3 derivatives. Changes in price volatility would change the value of the option contracts. Generally, a change in the estimate of forward commodity prices is unrelated to a change in the estimate of price volatility.
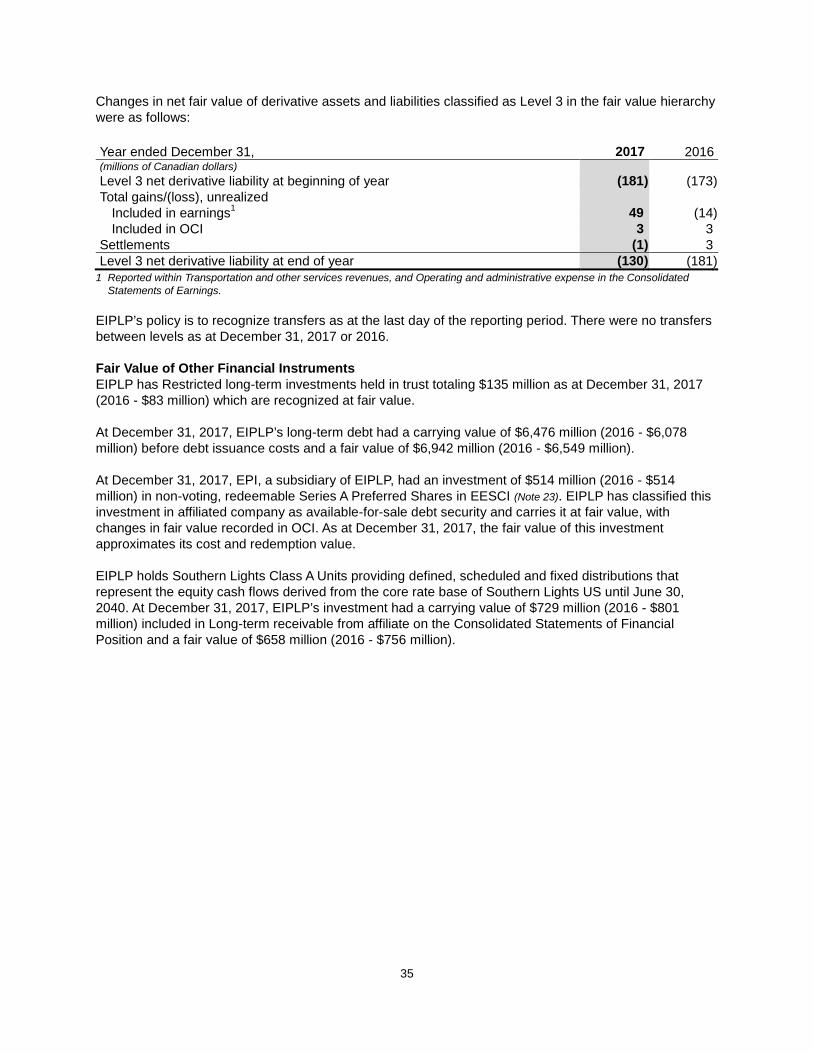
35
Changes in net fair value of derivative assets and liabilities classified as Level 3 in the fair value hierarchy were as follows: Year ended December 31, 2017 2016 (millions of Canadian dollars) Level 3 net derivative liability at beginning of year (181 ) (173 ) Total gains/(loss), unrealized Included in earnings1 49 (14 ) Included in OCI 3 3 Settlements (1 ) 3 Level 3 net derivative liability at end of year (130 ) (181 )
1 Reported within Transportation and other services revenues, and Operating and administrative expense in the Consolidated Statements of Earnings.
EIPLP’s policy is to recognize transfers as at the last day of the reporting period. There were no transfers between levels as at December 31, 2017 or 2016. Fair Value of Other Financial Instruments EIPLP has Restricted long-term investments held in trust totaling $135 million as at December 31, 2017 (2016 - $83 million) which are recognized at fair value. At December 31, 2017, EIPLP’s long-term debt had a carrying value of $6,476 million (2016 - $6,078 million) before debt issuance costs and a fair value of $6,942 million (2016 - $6,549 million). At December 31, 2017, EPI, a subsidiary of EIPLP, had an investment of $514 million (2016 - $514 million) in non-voting, redeemable Series A Preferred Shares in EESCI (Note 23). EIPLP has classified this investment in affiliated company as available-for-sale debt security and carries it at fair value, with changes in fair value recorded in OCI. As at December 31, 2017, the fair value of this investment approximates its cost and redemption value. EIPLP holds Southern Lights Class A Units providing defined, scheduled and fixed distributions that represent the equity cash flows derived from the core rate base of Southern Lights US until June 30, 2040. At December 31, 2017, EIPLP’s investment had a carrying value of $729 million (2016 - $801 million) included in Long-term receivable from affiliate on the Consolidated Statements of Financial Position and a fair value of $658 million (2016 - $756 million).

36
21. INCOME TAXES INCOME TAX RATE RECONCILIATION Year ended December 31, 2017 2016 (millions of Canadian dollars) Earnings before income tax 2,408 2,704 Canadian federal statutory income tax rate 15.0% 15.0% Expected federal tax at statutory rate 361 406 Increase/(decrease) resulting from: Provincial and state income taxes 141 155 Foreign and other statutory rate differentials 19 22 United States federal rate change 59 — Effects of rate-regulated accounting (91 ) (91 ) Part VI.1 tax, net of federal Part I deduction 35 13 Deductible dividends (6 ) (6 ) Unremitted foreign subsidiary earnings 1 3 Earnings in non-taxable entities (41 ) (42 ) Non-taxable portion of gain on sale of investment to unrelated party1 — (61 ) Non-taxable portion of capital gains and losses 3 2 Intercompany sale of investments2 — 6 Other 1 — Income tax expense on earnings 482 407 Effective income tax rate 20.0% 15.1% 1 The amount in 2016 represents the federal component of the non-taxable portion of the gain on the sale of the South Prairie
Region assets to unrelated party. 2 In November 2016, EIPLP sold certain assets to entities under common control. The intercompany gains realized on these
transfers were eliminated. However, because these transactions involved the sale of partnership units, tax consequences have been recognized in earnings.
COMPONENTS OF PRETAX EARNINGS AND INCOME TAXES
Year ended December 31, 2017 2016 (millions of Canadian dollars) Earnings before income taxes Canada 2,290 2,594 United States 118 110 2,408 2,704 Current income taxes expense Canada 60 29 United States 16 10 76 39 Deferred income taxes expense Canada 324 332 United States 82 36 406 368 Income taxes expense on earnings 482 407

37
COMPONENTS OF DEFERRED INCOME TAXES Deferred tax assets and liabilities are recognized for the future tax consequences of differences between carrying amounts of assets and liabilities and their respective tax bases. Major components of deferred income tax assets and liabilities are as follows:
December 31, 2017 2016 (millions of Canadian dollars) Deferred income tax liabilities Property, plant and equipment (1,939 ) (1,640 ) Investments (445 ) (348 ) Regulatory assets (393 ) (332 ) Deferred revenue (47 ) (71 ) Other — (6 ) Total deferred income tax liabilities (2,824 ) (2,397 ) Deferred income tax assets Financial instruments 350 600 Asset retirement obligations 64 28 Loss carryforwards 181 186 Other 11 11 Total deferred income tax assets 606 825 Net deferred income tax liabilities (2,218 ) (1,572 ) Presented as follows: Deferred income tax assets 109 202 Deferred income tax liabilities (2,327 ) (1,774 ) Net deferred income tax liabilities (2,218 ) (1,572 )
As at December 31, 2017, EIPLP recognized the benefit of unused tax loss carry forwards of $674 million (2016 - $690 million) in Canada which expire in 2031 to 2036. EIPLP and its subsidiaries are subject to taxation in Canada and the United States. The material jurisdictions in which EIPLP is subject to potential examinations are within Canada (Federal, Alberta, Ontario and Quebec) and the United States (Federal, Illinois, Iowa, Minnesota, North Dakota and Wisconsin). EIPLP is open to examination by Canadian tax authorities for the 2010 to 2017 tax years and by United States tax authorities for the 2014 and 2017 tax years. EIPLP is currently under examination for income tax matters in Canada for the 2013 to 2016 tax years. On December 22, 2017, the United States enacted the “Tax Cuts and Jobs Act” which reduces the federal corporate income tax rate from 35% to 21% effective for taxation years beginning after December 31, 2017. EIPLP recognized a $52 million deferred tax expense ($59 million federal deferred tax expense net of a $7 million state deferred tax recovery) as a result of this rate change. UNRECOGNIZED TAX BENEFITS EIPLP has no unrecognized tax benefits related to uncertain tax positions as at December 31, 2017 and 2016 and no accrued interest or penalties thereon.
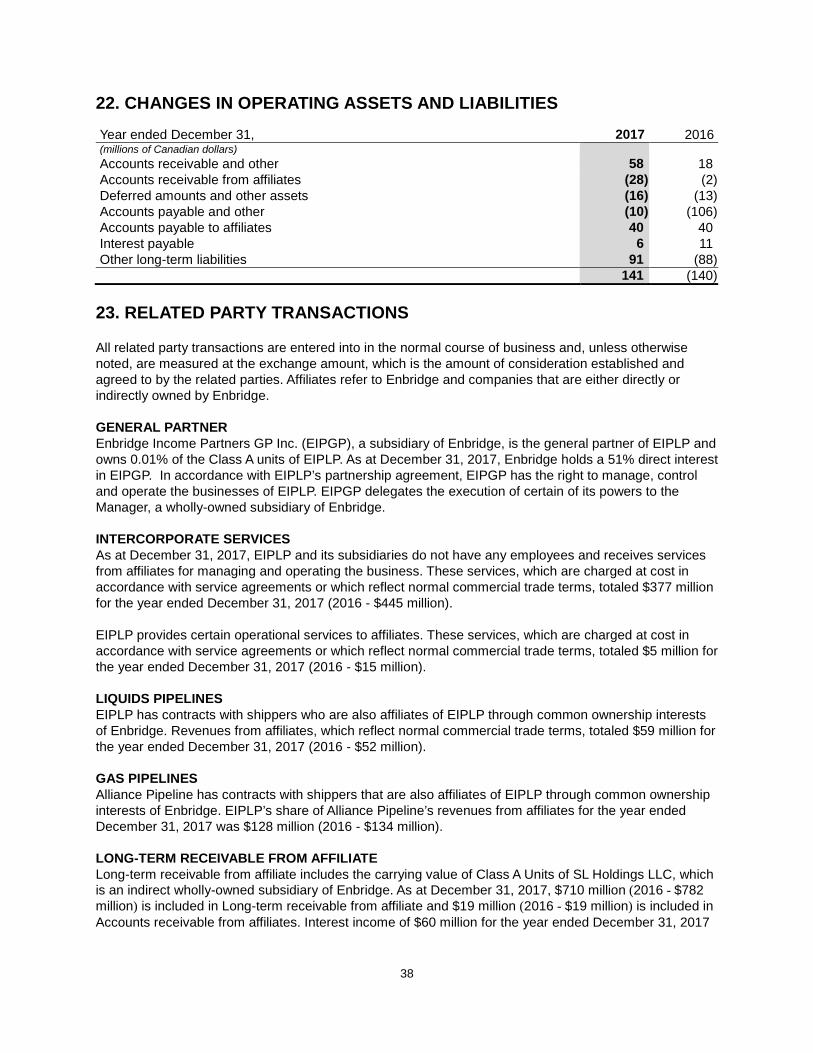
38
22. CHANGES IN OPERATING ASSETS AND LIABILITIES Year ended December 31, 2017 2016 (millions of Canadian dollars) Accounts receivable and other 58 18 Accounts receivable from affiliates (28 ) (2 ) Deferred amounts and other assets (16 ) (13 ) Accounts payable and other (10 ) (106 ) Accounts payable to affiliates 40 40 Interest payable 6 11 Other long-term liabilities 91 (88 ) 141 (140 )
23. RELATED PARTY TRANSACTIONS All related party transactions are entered into in the normal course of business and, unless otherwise noted, are measured at the exchange amount, which is the amount of consideration established and agreed to by the related parties. Affiliates refer to Enbridge and companies that are either directly or indirectly owned by Enbridge. GENERAL PARTNER Enbridge Income Partners GP Inc. (EIPGP), a subsidiary of Enbridge, is the general partner of EIPLP and owns 0.01% of the Class A units of EIPLP. As at December 31, 2017, Enbridge holds a 51% direct interest in EIPGP. In accordance with EIPLP’s partnership agreement, EIPGP has the right to manage, control and operate the businesses of EIPLP. EIPGP delegates the execution of certain of its powers to the Manager, a wholly-owned subsidiary of Enbridge. INTERCORPORATE SERVICES As at December 31, 2017, EIPLP and its subsidiaries do not have any employees and receives services from affiliates for managing and operating the business. These services, which are charged at cost in accordance with service agreements or which reflect normal commercial trade terms, totaled $377 million for the year ended December 31, 2017 (2016 - $445 million). EIPLP provides certain operational services to affiliates. These services, which are charged at cost in accordance with service agreements or which reflect normal commercial trade terms, totaled $5 million for the year ended December 31, 2017 (2016 - $15 million). LIQUIDS PIPELINES EIPLP has contracts with shippers who are also affiliates of EIPLP through common ownership interests of Enbridge. Revenues from affiliates, which reflect normal commercial trade terms, totaled $59 million for the year ended December 31, 2017 (2016 - $52 million). GAS PIPELINES Alliance Pipeline has contracts with shippers that are also affiliates of EIPLP through common ownership interests of Enbridge. EIPLP’s share of Alliance Pipeline’s revenues from affiliates for the year ended December 31, 2017 was $128 million (2016 - $134 million). LONG-TERM RECEIVABLE FROM AFFILIATE Long-term receivable from affiliate includes the carrying value of Class A Units of SL Holdings LLC, which is an indirect wholly-owned subsidiary of Enbridge. As at December 31, 2017, $710 million (2016 - $782 million) is included in Long-term receivable from affiliate and $19 million (2016 - $19 million) is included in Accounts receivable from affiliates. Interest income of $60 million for the year ended December 31, 2017
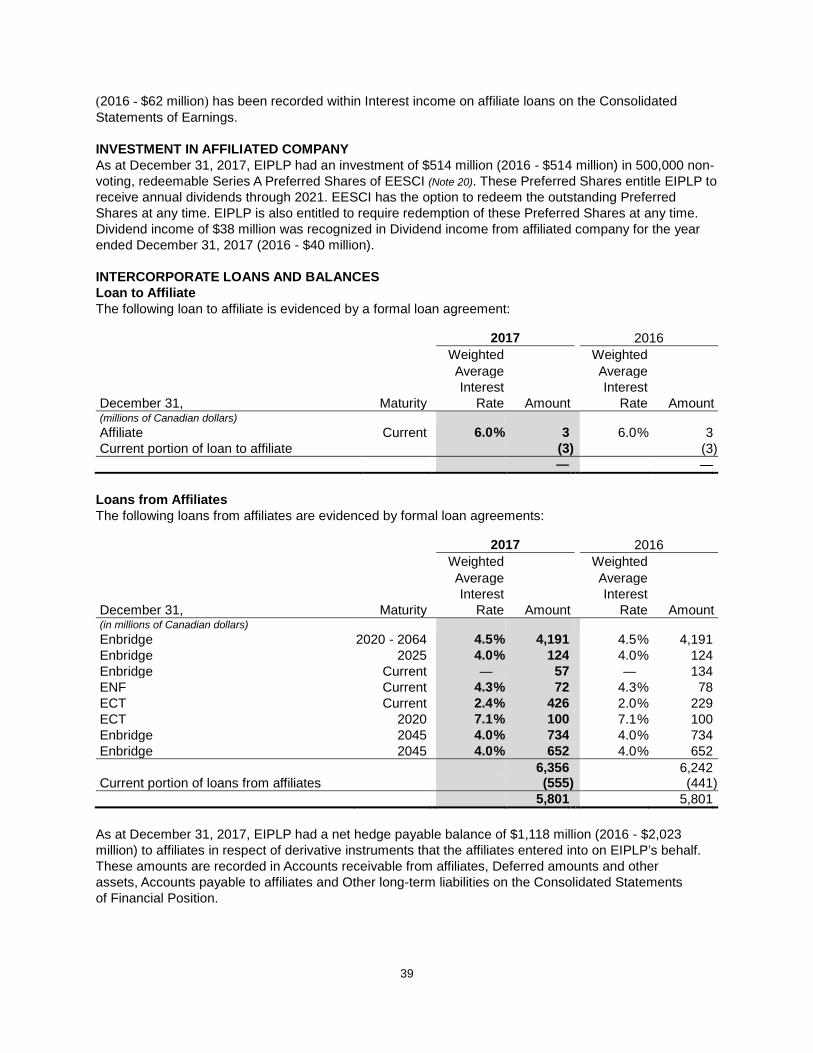
39
(2016 - $62 million) has been recorded within Interest income on affiliate loans on the Consolidated Statements of Earnings. INVESTMENT IN AFFILIATED COMPANY As at December 31, 2017, EIPLP had an investment of $514 million (2016 - $514 million) in 500,000 non-voting, redeemable Series A Preferred Shares of EESCI (Note 20). These Preferred Shares entitle EIPLP to receive annual dividends through 2021. EESCI has the option to redeem the outstanding Preferred Shares at any time. EIPLP is also entitled to require redemption of these Preferred Shares at any time. Dividend income of $38 million was recognized in Dividend income from affiliated company for the year ended December 31, 2017 (2016 - $40 million). INTERCORPORATE LOANS AND BALANCES Loan to Affiliate The following loan to affiliate is evidenced by a formal loan agreement: 2017 2016 Weighted Weighted Average Average Interest Interest December 31, Maturity Rate Amount Rate Amount (millions of Canadian dollars) Affiliate Current 6.0 % 3 6.0 % 3 Current portion of loan to affiliate (3 ) (3 ) — —
Loans from Affiliates The following loans from affiliates are evidenced by formal loan agreements: 2017 2016 Weighted Weighted Average Average Interest Interest December 31, Maturity Rate Amount Rate Amount (in millions of Canadian dollars) Enbridge 2020 - 2064 4.5 % 4,191 4.5 % 4,191 Enbridge 2025 4.0 % 124 4.0 % 124 Enbridge Current — 57 — 134 ENF Current 4.3 % 72 4.3 % 78 ECT Current 2.4 % 426 2.0 % 229 ECT 2020 7.1 % 100 7.1 % 100 Enbridge 2045 4.0 % 734 4.0 % 734 Enbridge 2045 4.0 % 652 4.0 % 652 6,356 6,242 Current portion of loans from affiliates (555 ) (441 ) 5,801 5,801
As at December 31, 2017, EIPLP had a net hedge payable balance of $1,118 million (2016 - $2,023 million) to affiliates in respect of derivative instruments that the affiliates entered into on EIPLP’s behalf. These amounts are recorded in Accounts receivable from affiliates, Deferred amounts and other assets, Accounts payable to affiliates and Other long-term liabilities on the Consolidated Statements of Financial Position.
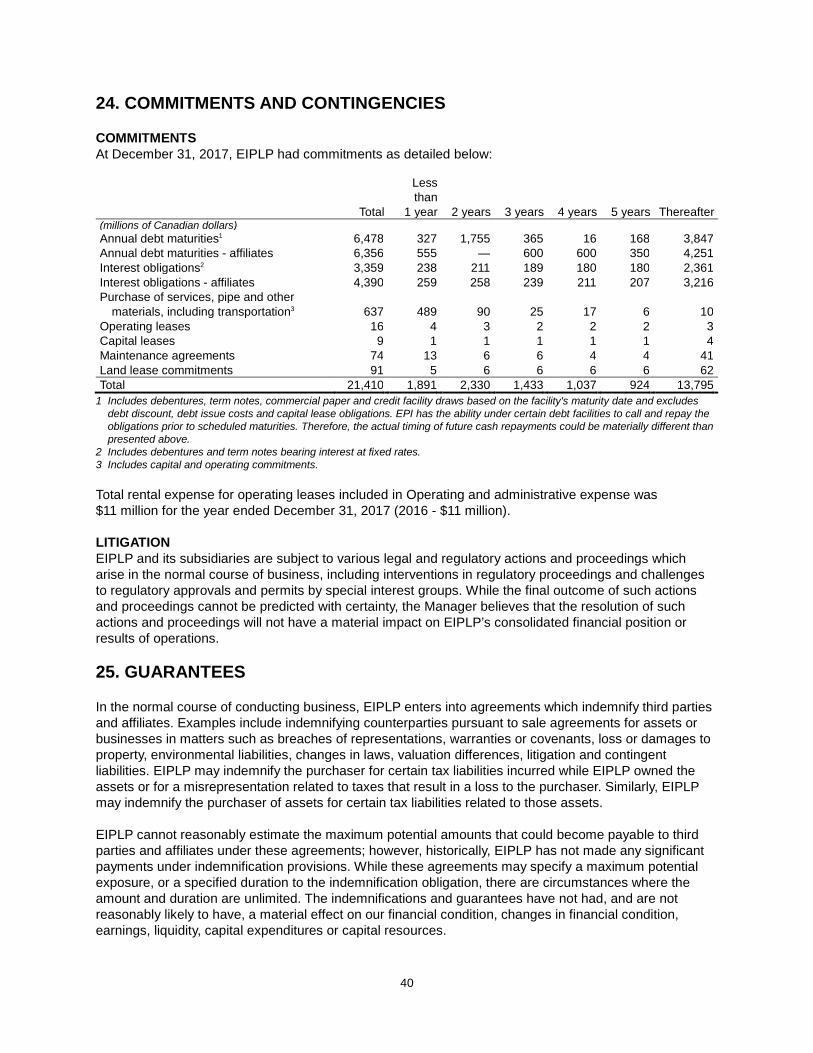
40
24. COMMITMENTS AND CONTINGENCIES COMMITMENTS At December 31, 2017, EIPLP had commitments as detailed below: Less than Total 1 year 2 years 3 years 4 years 5 years Thereafter (millions of Canadian dollars) Annual debt maturities1 6,478 327 1,755 365 16 168 3,847 Annual debt maturities - affiliates 6,356 555 — 600 600 350 4,251 Interest obligations2 3,359 238 211 189 180 180 2,361 Interest obligations - affiliates 4,390 259 258 239 211 207 3,216 Purchase of services, pipe and other materials, including transportation3 637 489 90 25 17 6 10 Operating leases 16 4 3 2 2 2 3 Capital leases 9 1 1 1 1 1 4 Maintenance agreements 74 13 6 6 4 4 41 Land lease commitments 91 5 6 6 6 6 62 Total 21,410 1,891 2,330 1,433 1,037 924 13,795
1 Includes debentures, term notes, commercial paper and credit facility draws based on the facility's maturity date and excludes debt discount, debt issue costs and capital lease obligations. EPI has the ability under certain debt facilities to call and repay the obligations prior to scheduled maturities. Therefore, the actual timing of future cash repayments could be materially different than presented above.
2 Includes debentures and term notes bearing interest at fixed rates. 3 Includes capital and operating commitments. Total rental expense for operating leases included in Operating and administrative expense was $11 million for the year ended December 31, 2017 (2016 - $11 million). LITIGATION EIPLP and its subsidiaries are subject to various legal and regulatory actions and proceedings which arise in the normal course of business, including interventions in regulatory proceedings and challenges to regulatory approvals and permits by special interest groups. While the final outcome of such actions and proceedings cannot be predicted with certainty, the Manager believes that the resolution of such actions and proceedings will not have a material impact on EIPLP’s consolidated financial position or results of operations. 25. GUARANTEES In the normal course of conducting business, EIPLP enters into agreements which indemnify third parties and affiliates. Examples include indemnifying counterparties pursuant to sale agreements for assets or businesses in matters such as breaches of representations, warranties or covenants, loss or damages to property, environmental liabilities, changes in laws, valuation differences, litigation and contingent liabilities. EIPLP may indemnify the purchaser for certain tax liabilities incurred while EIPLP owned the assets or for a misrepresentation related to taxes that result in a loss to the purchaser. Similarly, EIPLP may indemnify the purchaser of assets for certain tax liabilities related to those assets. EIPLP cannot reasonably estimate the maximum potential amounts that could become payable to third parties and affiliates under these agreements; however, historically, EIPLP has not made any significant payments under indemnification provisions. While these agreements may specify a maximum potential exposure, or a specified duration to the indemnification obligation, there are circumstances where the amount and duration are unlimited. The indemnifications and guarantees have not had, and are not reasonably likely to have, a material effect on our financial condition, changes in financial condition, earnings, liquidity, capital expenditures or capital resources.

41
In the normal course of conducting business, EIPLP enters into agreements that involve providing certain guarantees for affiliates. EIPLP has guaranteed obligations of the Fund under the Fund’s unsecured credit facility of $1,500 million (2016 - $1,500 million) which mature in 2020 and medium-term notes which mature from 2018 to 2044. As at December 31, 2017, $11 million (2016 - $11 million) was issued in letters of credit and $755 million (2016 - $225 million) was drawn on the credit facilities and there was $1,750 million (2016 - $2,075 million) outstanding on the notes. No amounts have been accrued for these guarantees as it is not currently likely EIPLP will have to pay any amounts with respect to these guarantees.