Embed Size (px)
Citation preview

Employer Incentives for Workforce Health and Productivityresearch by the integrated benefits institute
© 2008 Integrated Benefits Institute. All rights reserved.
ibi board of directorsAetnaAlereAllerganCaterpillarCisco SystemsDelta Air LinesEastman ChemicalGenentechGlaxoSmithKlineGoodyearThe HartfordHealthwaysHewitt AssociatesKaiser PermanenteLiberty Mutual GroupMarsh/MercerMedco Health SolutionsMetLifeMGM MIRAGEMHNNationwide Better HealthNovartisOptumHealthPfizerPhRMAPremera Blue CrossThe Regence GroupReliance Standard/ Matrix Absence ManagementSafewaysanofi-aventisTowers PerrinUSAAWashington MutualWaste ManagementWhirlpool
Integrated Benefits Institute 595 Market Street, Suite 810 San Francisco, CA 94105415 222 [email protected]
The Integrated Benefits Institute (IBI) provides employers and their supplier partners with resources for proving the business value of health.
As a pioneer, leader and nonprofit supplier of health and productivity research, measurement and benchmarking, IBI is the trusted source for benefits perfor-mance analysis, practical solutions, and forums for information and education. IBI’s programs, resources and expert networks advance understanding about the link between—and the impact of—health-related productivity on corporate America’s bottom line.
Increasingly, employers are implementing health and productivity initiatives with their employees to gain competitive positions in our global economy. Yet companies are learning that their workforce requires encouragement to engage in such pro-grams and to achieve the health goals employers are promoting. Employers also tell us that one of their main needs is more information about how others use incentives and disincentives to promote a healthy and productive workforce and the relative success of those efforts.
The Integrated Benefits Institute (IBI), along with Harris Interactive (authors of the Harris Poll), surveyed more than 500 employers representing approximately 5 million employees on the incentives and the disincentives they offer to promote a healthy and productive workforce. This report presents the results of that survey.
A key conclusion from this research is that employers often aren’t strategic in con-necting the incentives and the disincentives they actually use with their own views about which ones are most effective. Similarly, their most frequent program goal is to encourage employee participation in health and productivity programs instead of seeking improved health-related outcomes, a target far more important to their bottom-line needs.
In a new step to help employers improve their strategic response to our research results, IBI invited experts from its member companies to offer employers advice about the challenges, disconnects and obstacles identified in the study. The advice from this Member Solutions Board is summarized on pages 2 and 3, and detailed beginning on page 25 of this report.
Going forward, we will establish a similar Member Solutions Board for each IBI research report as a way to show employers how to use the research findings in a pragmatic, effective manner. IBI thanks the following members of this Member Solutions Board: Caterpillar, Alere, Crawford, Hewitt Associates, IncentOne, Mercer, OptumHealth, Pfizer and Towers Perrin.
Authors: Kimberly Jinnett, Ph.D.Thomas Parry, Ph.D.William Molmen, J.D.Integrated Benefits InstituteOctober 2008
Executive Summary
Employer Incentives for Workforce Health and Productivityresearch by the integrated benefits institute
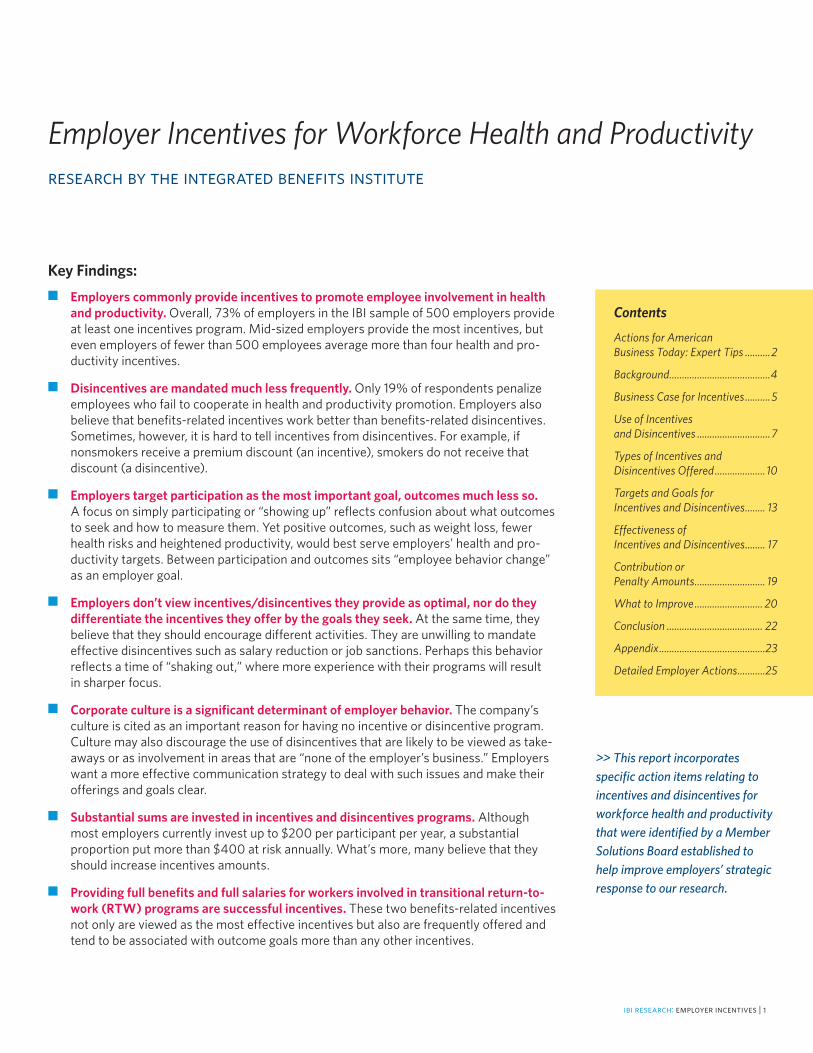
Key Findings:
■ Employers commonly provide incentives to promote employee involvement in health and productivity. Overall, 73% of employers in the IBI sample of 500 employers provide at least one incentives program. Mid-sized employers provide the most incentives, but even employers of fewer than 500 employees average more than four health and pro-ductivity incentives.
■ Disincentives are mandated much less frequently. Only 19% of respondents penalize employees who fail to cooperate in health and productivity promotion. Employers also believe that benefits-related incentives work better than benefits-related disincentives. Sometimes, however, it is hard to tell incentives from disincentives. For example, if nonsmokers receive a premium discount (an incentive), smokers do not receive that discount (a disincentive).
■ Employers target participation as the most important goal, outcomes much less so. A focus on simply participating or “showing up” reflects confusion about what outcomes to seek and how to measure them. Yet positive outcomes, such as weight loss, fewer health risks and heightened productivity, would best serve employers’ health and pro-ductivity targets. Between participation and outcomes sits “employee behavior change” as an employer goal.
■ Employers don’t view incentives/disincentives they provide as optimal, nor do they differentiate the incentives they offer by the goals they seek. At the same time, they believe that they should encourage different activities. They are unwilling to mandate effective disincentives such as salary reduction or job sanctions. Perhaps this behavior reflects a time of “shaking out,” where more experience with their programs will result in sharper focus.
■ Corporate culture is a significant determinant of employer behavior. The company’s culture is cited as an important reason for having no incentive or disincentive program. Culture may also discourage the use of disincentives that are likely to be viewed as take-aways or as involvement in areas that are “none of the employer’s business.” Employers want a more effective communication strategy to deal with such issues and make their offerings and goals clear.
■ Substantial sums are invested in incentives and disincentives programs. Although most employers currently invest up to $200 per participant per year, a substantial proportion put more than $400 at risk annually. What’s more, many believe that they should increase incentives amounts.
■ Providing full benefits and full salaries for workers involved in transitional return-to-work (RTW) programs are successful incentives. These two benefits-related incentives not only are viewed as the most effective incentives but also are frequently offered and tend to be associated with outcome goals more than any other incentives.
ibi research: employer incentives | 1
Contents
Actions for American Business Today: Expert Tips ..........2
Background........................................4
Business Case for Incentives ..........5
Use of Incentives and Disincentives .............................7
Types of Incentives and Disincentives Offered .................... 10
Targets and Goals for Incentives and Disincentives ........ 13
Effectiveness of Incentives and Disincentives ........ 17
Contribution or Penalty Amounts ............................ 19
What to Improve ........................... 20
Conclusion ...................................... 22
Appendix ..........................................23
Detailed Employer Actions ...........25
>> This report incorporates specific action items relating to incentives and disincentives for workforce health and productivity that were identified by a Member Solutions Board established to help improve employers’ strategic response to our research.
Actions for American Business Today: Expert Tips
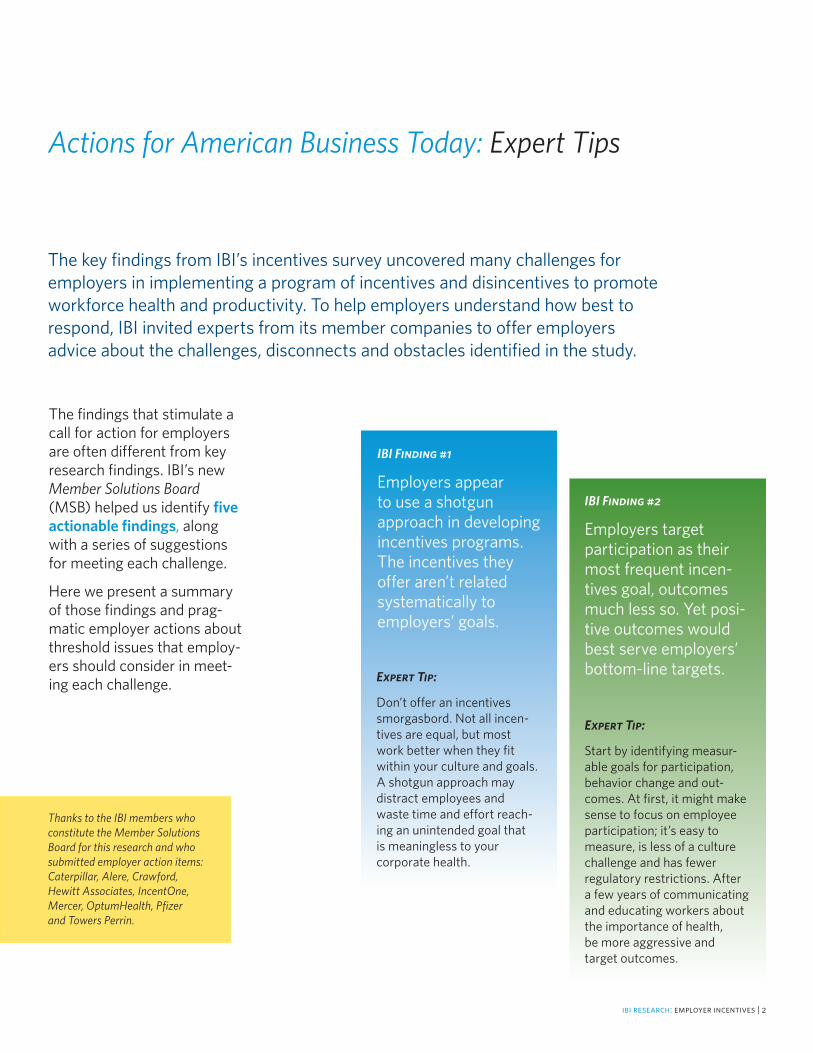
The findings that stimulate a call for action for employers are often different from key research findings. IBI’s new Member Solutions Board (MSB) helped us identify five actionable findings, along with a series of suggestions for meeting each challenge.
Here we present a summary of those findings and prag-matic employer actions about threshold issues that employ-ers should consider in meet-ing each challenge.
The key findings from IBI’s incentives survey uncovered many challenges for employers in implementing a program of incentives and disincentives to promote workforce health and productivity. To help employers understand how best to respond, IBI invited experts from its member companies to offer employers advice about the challenges, disconnects and obstacles identified in the study.
Thanks to the IBI members who constitute the Member Solutions Board for this research and who submitted employer action items: Caterpillar, Alere, Crawford, Hewitt Associates, IncentOne, Mercer, OptumHealth, Pfizer and Towers Perrin.
IBI Finding #1
Employers appear to use a shotgun approach in developing incentives programs. The incentives they offer aren’t related systematically to employers’ goals.
Expert Tip:
Don’t offer an incentives smorgasbord. Not all incen-tives are equal, but most work better when they fit within your culture and goals. A shotgun approach may distract employees and waste time and effort reach-ing an unintended goal that is meaningless to your corporate health.
IBI Finding #2
Employers target participation as their most frequent incen-tives goal, outcomes much less so. Yet posi-tive outcomes would best serve employers’ bottom-line targets.
Expert Tip:
Start by identifying measur-able goals for participation, behavior change and out-comes. At first, it might make sense to focus on employee participation; it’s easy to measure, is less of a culture challenge and has fewer regulatory restrictions. After a few years of communicating and educating workers about the importance of health, be more aggressive and target outcomes.
ibi research: employer incentives | 2
ibi research: employer incentives | 3
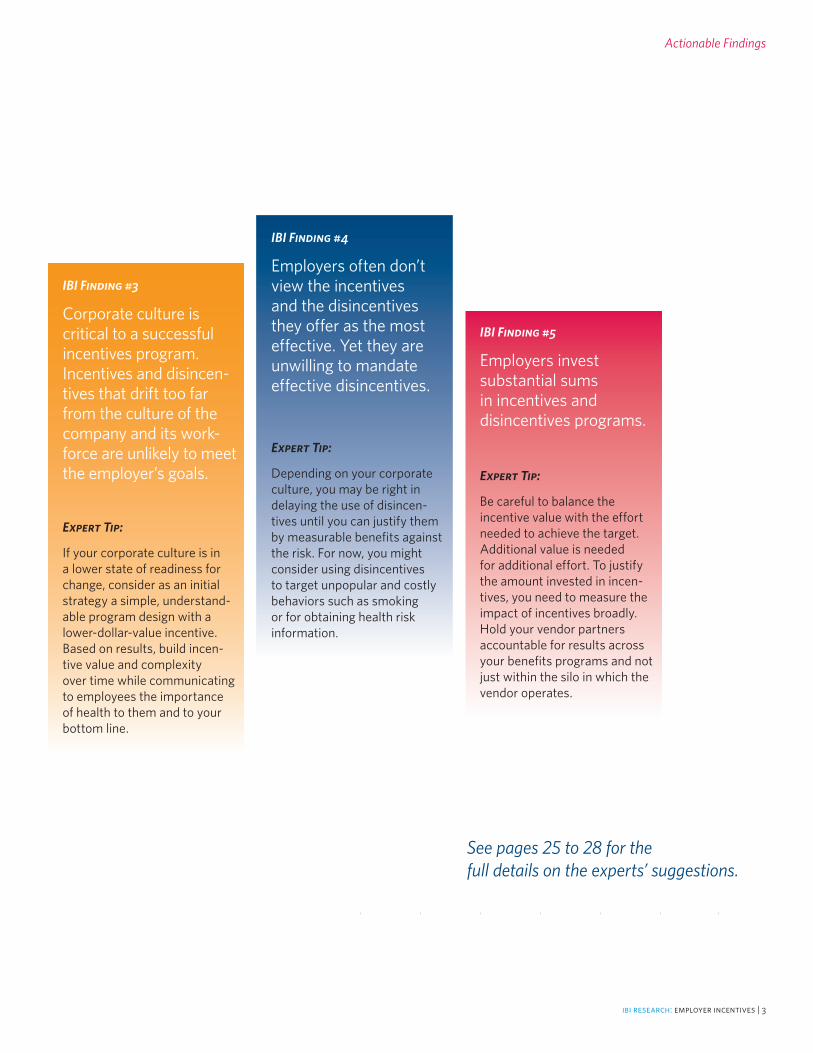
IBI Finding #3
Corporate culture is critical to a successful incentives program. Incentives and disincen-tives that drift too far from the culture of the company and its work-force are unlikely to meet the employer’s goals.
IBI Finding #4
Employers often don’t view the incentives and the disincentives they offer as the most effective. Yet they are unwilling to mandate effective disincentives.
IBI Finding #5
Employers invest substantial sums in incentives and disincentives programs.
Expert Tip:
If your corporate culture is in a lower state of readiness for change, consider as an initial strategy a simple, understand-able program design with a lower-dollar-value incentive. Based on results, build incen-tive value and complexity over time while communicating to employees the importance of health to them and to your bottom line.
Expert Tip:
Depending on your corporate culture, you may be right in delaying the use of disincen-tives until you can justify them by measurable benefits against the risk. For now, you might consider using disincentives to target unpopular and costly behaviors such as smoking or for obtaining health risk information.
Expert Tip:
Be careful to balance the incentive value with the effort needed to achieve the target. Additional value is needed for additional effort. To justify the amount invested in incen-tives, you need to measure the impact of incentives broadly. Hold your vendor partners accountable for results across your benefits programs and not just within the silo in which the vendor operates.
Actionable Findings
See pages 25 to 28 for the full details on the experts’ suggestions.
Background
A growing number of employers use incentives to motivate employees to adopt healthier lifestyles.1,2 Employers can encourage healthy behavior through various plan offerings, activities, incentives and disin-centives. Relatively little research has focused on the employer/employee relationship to assess the characteristics and the effectiveness of incentive-based programs or the employer goals in offering them.
Diabetes, hypertension, depression, high cholesterol, obesity and other common, costly chronic health conditions share one major element: Individuals can improve their health by changing their behavior. They could eat better, exercise more often, seek treatment when needed and take their medicines as prescribed.
1 Capps, and Harkey. “Employee Health and Wellness and Disease Management Programs: The Use of Incentives. A Survey of Major U.S. Employers.” Executive Brief. IncentOne, NAM and ERIC. 2008. <http://www.eric.org/forms/uploadFiles/12E8700000182.filename.2008-Wellness-DM_SurveyResults.pdf>
2 Survey Findings: “Two Roads Diverged.” Hewitt’s Annual Health Care Survey. April 2008. <www.hewittassociates.com/Intl/NA/en-US/AboutHewitt/Newsroom/PressReleaseDetail.aspx?cid=4962>
In 2007, IBI along with Harris Interactive (authors of the Harris Poll) surveyed more than 500 employers representing approxi-mately 5 million employees on the incentives and the disincen-tives they offer to promote a healthy and productive work-force. This report describes the results of that survey.
ibi research: employer incentives | 4

Back/Neck Pain
Depression
Fatigue
Other Chronic Pain
Sleeping Problems
High Cholesterol
Arthritis
Hypertension
Obesity
Anxiety Diagnosis
ibi research: employer incentives | 5
It is not just RA that presents an opportunity for substantial savings from encouraging behavior change and better health. IBI co-authored a recent article on the relative health-related costs of medical condi-tions.5 The baseline results for the top-10 full-cost drivers shown to the right were derived from a medi-cal/pharmaceutical database that researchers linked to self-reported lost time and the resulting lost productivity from absence and presenteeism (continuing to work while in ill health but at a lower capacity due to the health condi-tion). The results for the 10 most costly conditions show significant opportunity for lost-productivity savings from decreased lost time that can result from better health, in addition to medical and pharma-ceutical savings that might occur.
Business Case for Incentives for Health and Productivity
In addition to the benefits of a healthier, fuller life for the employee, the bottom-line payoff for employers from encouraging employee health-related behavior change can be significant. As one example, in 2007 the Integrated Benefits Institute conducted research on the extent to which employees diagnosed with rheumatoid arthritis (RA) complied with recommended medications.3,4 The study demonstrated that the failure by 55% of those employees diagnosed with RA (2,467 of the employees in the study group) to submit at least one prescription for disease-modifying anti-rheumatic agents was associated with $17.2 million in lost productivity associated with short-term disability alone.
3 A Broader Reach for Pharmacy Plan Design. Integrated Benefits Institute. May 2007.4 Freudenheim, Milt. “Scant Drug Benefits Called Costly to Employers,” New York Times. June 27, 2007.5 Loeppke, Taitel, Richling, Parry, Kessler, Hymel and Konicki. “Health and Productivity as a Busi-ness Strategy,” J Occup Environ Med. 49 (712-721). 2007.
$0 $100,000 $200,000 $300,000 $400,000 $500,000 $600,000
Source: Loeppke, et al.: JOEM, July 2007
MOST COSTLY CONDITIONS: TOTAL MEDICAL, PHARMACY AND PRODUCTIVITY COSTSPer 1,000 FTEs
Medical
Drug
Absence
Presenteeism
Business Case for Incentives
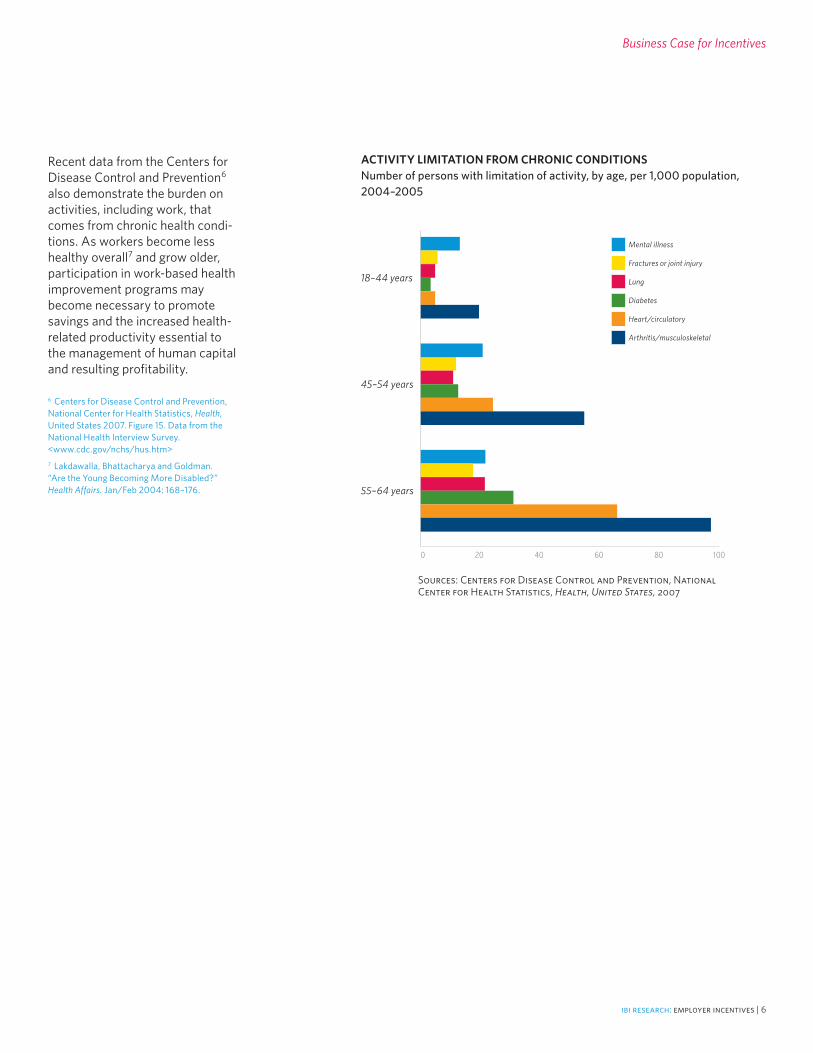
Recent data from the Centers for Disease Control and Prevention6 also demonstrate the burden on activities, including work, that comes from chronic health condi-tions. As workers become less healthy overall7 and grow older, participation in work-based health improvement programs may become necessary to promote savings and the increased health-related productivity essential to the management of human capital and resulting profitability.
6 Centers for Disease Control and Prevention, National Center for Health Statistics, Health, United States 2007. Figure 15. Data from the National Health Interview Survey. <www.cdc.gov/nchs/hus.htm>7 Lakdawalla, Bhattacharya and Goldman. “Are the Young Becoming More Disabled?” Health Affairs. Jan/Feb 2004: 168–176.
18–44 years
45–54 years
55–64 years
0 20 40 60 80 100
Sources: Centers for Disease Control and Prevention, National Center for Health Statistics, Health, United States, 2007
ACTIVITY LIMITATION FROM CHRONIC CONDITIONSNumber of persons with limitation of activity, by age, per 1,000 population, 2004–2005
Mental illness
Fractures or joint injury
Lung
Diabetes
Heart/circulatory
Arthritis/musculoskeletal
ibi research: employer incentives | 6
ibi research: employer incentives | 7
80%
60%
40%
20%
0%DisincentivesIncentives
EMPLOYERS USING INCENTIVES AND DISINCENTIVESPercentage of surveyed employers
19%
73%
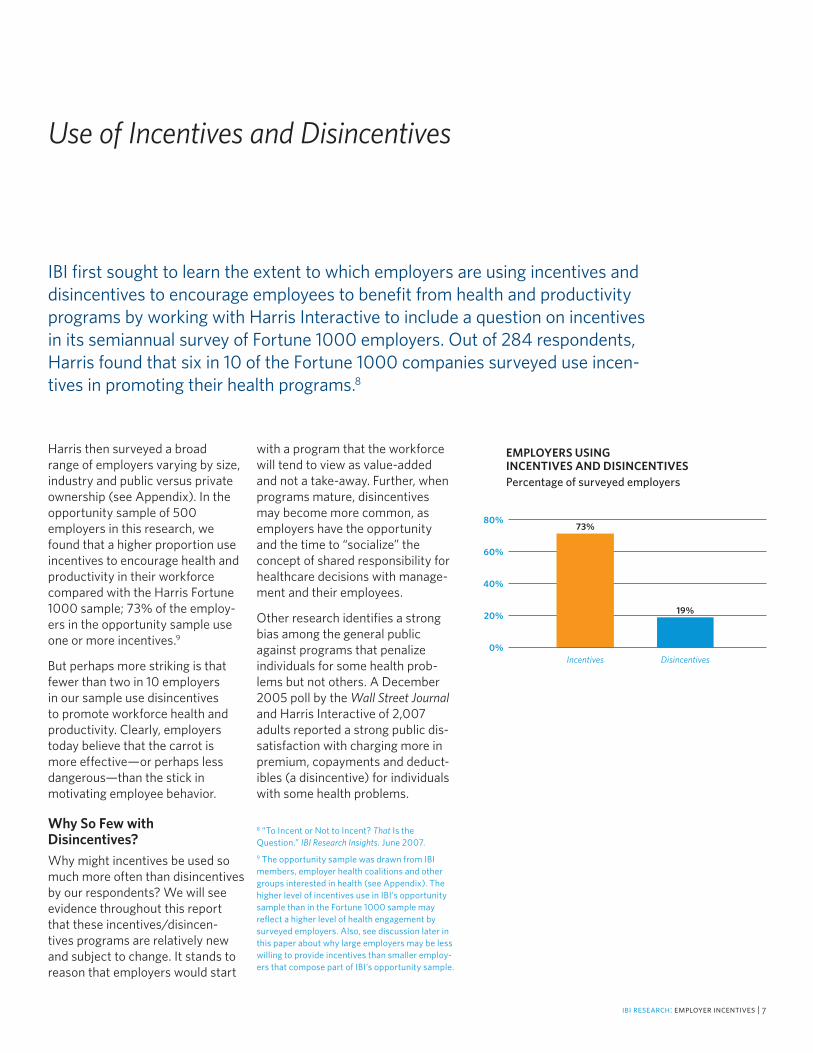
Harris then surveyed a broad range of employers varying by size, industry and public versus private ownership (see Appendix). In the opportunity sample of 500 employers in this research, we found that a higher proportion use incentives to encourage health and productivity in their workforce compared with the Harris Fortune 1000 sample; 73% of the employ-ers in the opportunity sample use one or more incentives.9
But perhaps more striking is that fewer than two in 10 employers in our sample use disincentives to promote workforce health and productivity. Clearly, employers today believe that the carrot is more effective—or perhaps less dangerous—than the stick in motivating employee behavior.
Why So Few with Disincentives? Why might incentives be used so much more often than disincentives by our respondents? We will see evidence throughout this report that these incentives/disincen-tives programs are relatively new and subject to change. It stands to reason that employers would start
with a program that the workforce will tend to view as value-added and not a take-away. Further, when programs mature, disincentives may become more common, as employers have the opportunity and the time to “socialize” the concept of shared responsibility for healthcare decisions with manage-ment and their employees.
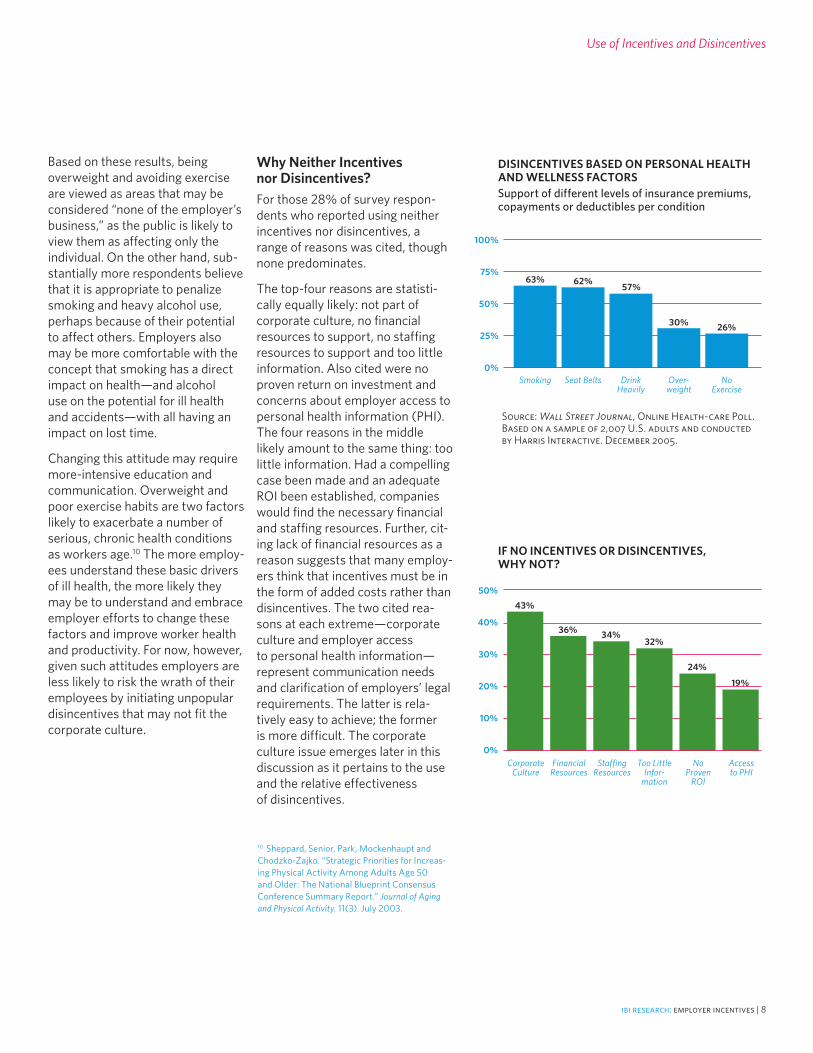
Other research identifies a strong bias among the general public against programs that penalize individuals for some health prob-lems but not others. A December 2005 poll by the Wall Street Journal and Harris Interactive of 2,007 adults reported a strong public dis-satisfaction with charging more in premium, copayments and deduct-ibles (a disincentive) for individuals with some health problems.
Use of Incentives and Disincentives
IBI first sought to learn the extent to which employers are using incentives and disincentives to encourage employees to benefit from health and productivity programs by working with Harris Interactive to include a question on incentives in its semiannual survey of Fortune 1000 employers. Out of 284 respondents, Harris found that six in 10 of the Fortune 1000 companies surveyed use incen-tives in promoting their health programs.8
8 “To Incent or Not to Incent? That Is the Question.” IBI Research Insights. June 2007.9 The opportunity sample was drawn from IBI members, employer health coalitions and other groups interested in health (see Appendix). The higher level of incentives use in IBI’s opportunity sample than in the Fortune 1000 sample may reflect a higher level of health engagement by surveyed employers. Also, see discussion later in this paper about why large employers may be less willing to provide incentives than smaller employ-ers that compose part of IBI’s opportunity sample.
100%
75%
50%
25%
0%Smoking
63%
Source: Wall Street Journal, Online Health-care Poll. Based on a sample of 2,007 U.S. adults and conducted by Harris Interactive. December 2005.
Seat Belts
62%
Drink Heavily
57%
Over-weight
30%
No Exercise
26%
Based on these results, being overweight and avoiding exercise are viewed as areas that may be considered “none of the employer’s business,” as the public is likely to view them as affecting only the individual. On the other hand, sub-stantially more respondents believe that it is appropriate to penalize smoking and heavy alcohol use, perhaps because of their potential to affect others. Employers also may be more comfortable with the concept that smoking has a direct impact on health—and alcohol use on the potential for ill health and accidents—with all having an impact on lost time.
Changing this attitude may require more-intensive education and communication. Overweight and poor exercise habits are two factors likely to exacerbate a number of serious, chronic health conditions as workers age.10 The more employ-ees understand these basic drivers of ill health, the more likely they may be to understand and embrace employer efforts to change these factors and improve worker health and productivity. For now, however, given such attitudes employers are less likely to risk the wrath of their employees by initiating unpopular disincentives that may not fit the corporate culture.
Why Neither Incentives nor Disincentives? For those 28% of survey respon-dents who reported using neither incentives nor disincentives, a range of reasons was cited, though none predominates.
The top-four reasons are statisti-cally equally likely: not part of corporate culture, no financial resources to support, no staffing resources to support and too little information. Also cited were no proven return on investment and concerns about employer access to personal health information (PHI). The four reasons in the middle likely amount to the same thing: too little information. Had a compelling case been made and an adequate ROI been established, companies would find the necessary financial and staffing resources. Further, cit-ing lack of financial resources as a reason suggests that many employ-ers think that incentives must be in the form of added costs rather than disincentives. The two cited rea-sons at each extreme—corporate culture and employer access to personal health information—represent communication needs and clarification of employers’ legal requirements. The latter is rela-tively easy to achieve; the former is more difficult. The corporate culture issue emerges later in this discussion as it pertains to the use and the relative effectiveness of disincentives.
Use of Incentives and Disincentives
DISINCENTIVES BASED ON PERSONAL HEALTH AND WELLNESS FACTORSSupport of different levels of insurance premiums, copayments or deductibles per condition
10 Sheppard, Senior, Park, Mockenhaupt and Chodzko-Zajko. “Strategic Priorities for Increas-ing Physical Activity Among Adults Age 50 and Older: The National Blueprint Consensus Conference Summary Report.” Journal of Aging and Physical Activity. 11(3). July 2003.
50%
40%
30%
20%
10%
0%Corporate
Culture
43%
IF NO INCENTIVES OR DISINCENTIVES, WHY NOT?
Financial Resources
36%
Staffing Resources
34%
Too Little Infor-
mation
32%
No Proven
ROI
24%
Access to PHI
19%
ibi research: employer incentives | 8
ibi research: employer incentives | 9
Use of Incentives and Disincentives
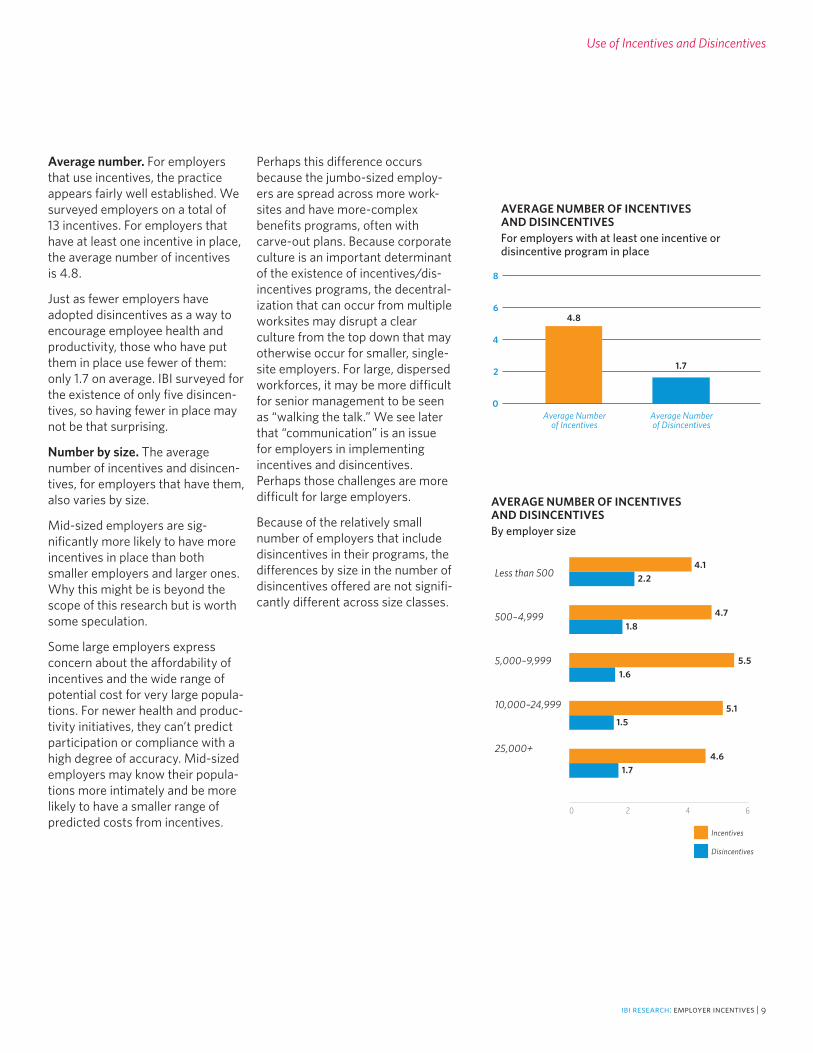
Average number. For employers that use incentives, the practice appears fairly well established. We surveyed employers on a total of 13 incentives. For employers that have at least one incentive in place, the average number of incentives is 4.8.
Just as fewer employers have adopted disincentives as a way to encourage employee health and productivity, those who have put them in place use fewer of them: only 1.7 on average. IBI surveyed for the existence of only five disincen-tives, so having fewer in place may not be that surprising.
Number by size. The average number of incentives and disincen-tives, for employers that have them, also varies by size.
Mid-sized employers are sig-nificantly more likely to have more incentives in place than both smaller employers and larger ones. Why this might be is beyond the scope of this research but is worth some speculation.
Some large employers express concern about the affordability of incentives and the wide range of potential cost for very large popula-tions. For newer health and produc-tivity initiatives, they can’t predict participation or compliance with a high degree of accuracy. Mid-sized employers may know their popula-tions more intimately and be more likely to have a smaller range of predicted costs from incentives.
Perhaps this difference occurs because the jumbo-sized employ-ers are spread across more work-sites and have more-complex benefits programs, often with carve-out plans. Because corporate culture is an important determinant of the existence of incentives/dis-incentives programs, the decentral-ization that can occur from multiple worksites may disrupt a clear culture from the top down that may otherwise occur for smaller, single-site employers. For large, dispersed workforces, it may be more difficult for senior management to be seen as “walking the talk.” We see later that “communication” is an issue for employers in implementing incentives and disincentives. Perhaps those challenges are more difficult for large employers.
Because of the relatively small number of employers that include disincentives in their programs, the differences by size in the number of disincentives offered are not signifi-cantly different across size classes.
8
6
4
2
0Average Number
of IncentivesAverage Number of Disincentives
AVERAGE NUMBER OF INCENTIVES AND DISINCENTIVESFor employers with at least one incentive or disincentive program in place
4.8
1.7
Less than 500
500–4,999
5,000–9,999
10,000–24,999
25,000+
AVERAGE NUMBER OF INCENTIVES AND DISINCENTIVESBy employer size
Incentives
Disincentives
4.12.2
4.71.8
5.51.6
5.11.5
4.61.7
0 2 4 6
Types of Incentives and Disincentives Offered
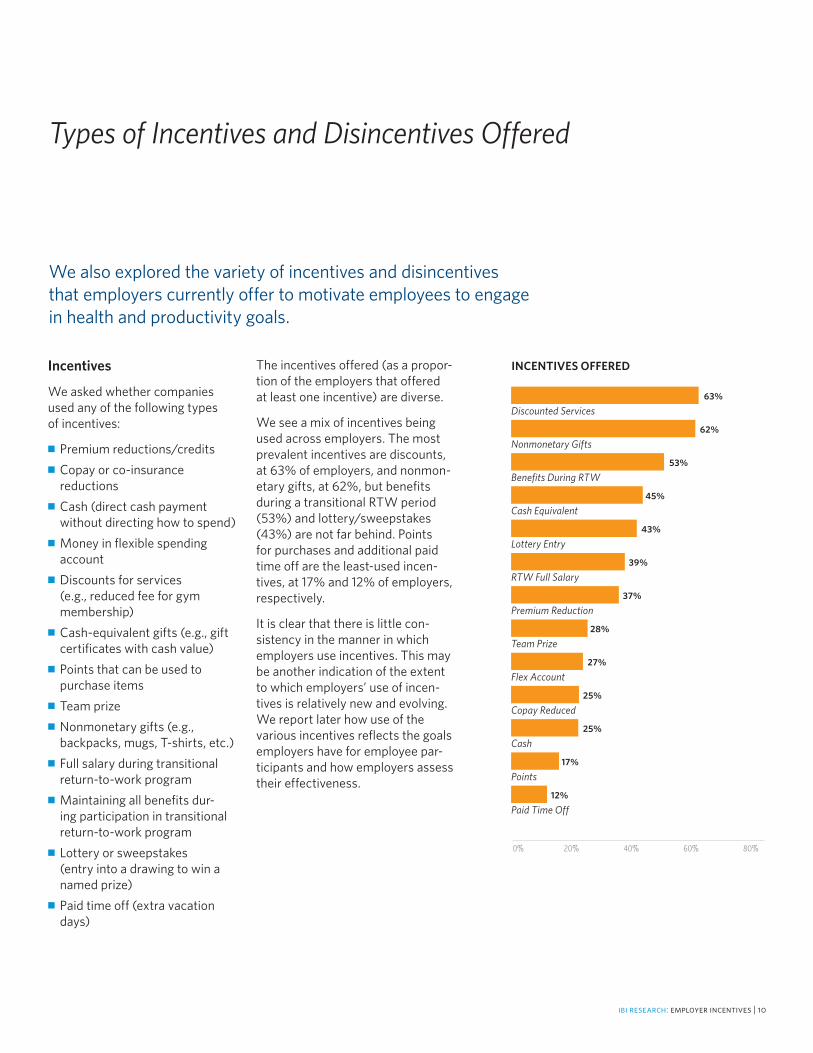
The incentives offered (as a propor-tion of the employers that offered at least one incentive) are diverse.
We see a mix of incentives being used across employers. The most prevalent incentives are discounts, at 63% of employers, and nonmon-etary gifts, at 62%, but benefits during a transitional RTW period (53%) and lottery/sweepstakes (43%) are not far behind. Points for purchases and additional paid time off are the least-used incen-tives, at 17% and 12% of employers, respectively.
It is clear that there is little con-sistency in the manner in which employers use incentives. This may be another indication of the extent to which employers’ use of incen-tives is relatively new and evolving. We report later how use of the various incentives reflects the goals employers have for employee par-ticipants and how employers assess their effectiveness.
Incentives
We asked whether companies used any of the following types of incentives:
■ Premium reductions/credits■ Copay or co-insurance
reductions■ Cash (direct cash payment
without directing how to spend)■ Money in flexible spending
account■ Discounts for services
(e.g., reduced fee for gym membership)
■ Cash-equivalent gifts (e.g., gift certificates with cash value)
■ Points that can be used to purchase items
■ Team prize■ Nonmonetary gifts (e.g.,
backpacks, mugs, T-shirts, etc.)■ Full salary during transitional
return-to-work program■ Maintaining all benefits dur-
ing participation in transitional return-to-work program
■ Lottery or sweepstakes (entry into a drawing to win a named prize)
■ Paid time off (extra vacation days)
We also explored the variety of incentives and disincentives that employers currently offer to motivate employees to engage in health and productivity goals.
Discounted Services
Nonmonetary Gifts
Benefits During RTW
Cash Equivalent
Lottery Entry
RTW Full Salary
Premium Reduction
Team Prize
Flex Account
Copay Reduced
Cash
Points
Paid Time Off
INCENTIVES OFFERED
63%
62%
53%
45%
43%
39%
37%
28%
27%
25%
25%
17%
12%
0% 20% 40% 60% 80%
ibi research: employer incentives | 10

ibi research: employer incentives | 11
Types of Incentives and Disincentives Offered
Disincentives
We also asked whether companies used any of the following types of disincentives:
■ Premium increases■ Copay or co-insurance increases■ Elimination or reduction
in benefits■ Salary penalties■ Job sanctions
Although we didn’t specifically define job sanctions in the survey itself, in addition to salary penalties already included as a separate type of disincentive, job sanctions may be defined to mean disciplinary actions, such as written and verbal warnings or negative performance reviews, demotion/nonpromotion, loss of service time or seniority, suspension and even termination.
The disincentives offered are shown as a proportion of employ-ers that mandated one or more disincentives.
Two disincentive types pre-dominate. Premium increases for employees who don’t participate in a health and productivity program are used by about two-thirds of employers that use disincentives, while copay increases are used by more than 40%. It must be noted that relatively few respon-dents include disincentives in their management of workforce health and productivity (only 19% of those that could respond), so even the top-ranked “premium increases” involve a relatively small proportion of the surveyed sample.
Disincentives most likely to be viewed by workers as the most draconian—that is, benefits reduction, salary penalties and
job sanctions—are less likely to be used. This fits in with our discus-sion of why disincentives them-selves may be used less in general.
Usage by Category
IBI categorized incentives and disin-centives by type to see if employers are more likely to favor some types over others. We grouped the 13 incentives by similarity of strategy into the following three categories:
Cash-based:■ Cash (direct cash payment
without directing how to spend)■ Money in flexible spending
account■ Discounts for services
(e.g., reduced fee for gym membership)
■ Cash-equivalent gifts (e.g., gift certificates with cash value)
Benefits-related:■ Premium reductions/credits ■ Copay or co-insurance
reductions ■ Full salary during transitional
RTW program■ Maintaining all benefits during
participation in transitional RTW program
■ Paid time off (extra vacation days)
Prizes/Gifts:■ Points that can be used to
purchase items■ Team prize■ Nonmonetary gifts (e.g.,
backpacks, mugs, T-shirts)■ Lottery or sweepstakes
(entry into a drawing to win a named prize)
80%
60%
40%
20%
0%Premium Increases
65%
DISINCENTIVES LEVIED
Copay Increases
43%
Benefits Reduc-
tion
31%
Salary Penalties
11%
Job Sanctions
11%
We also grouped the five disincen-tives into two categories, by similar strategies:
Benefits-related:■ Premium increases■ Copay or co-insurance increases■ Elimination or reduction
in benefits
Salary/Job:■ Salary penalties■ Job sanctions
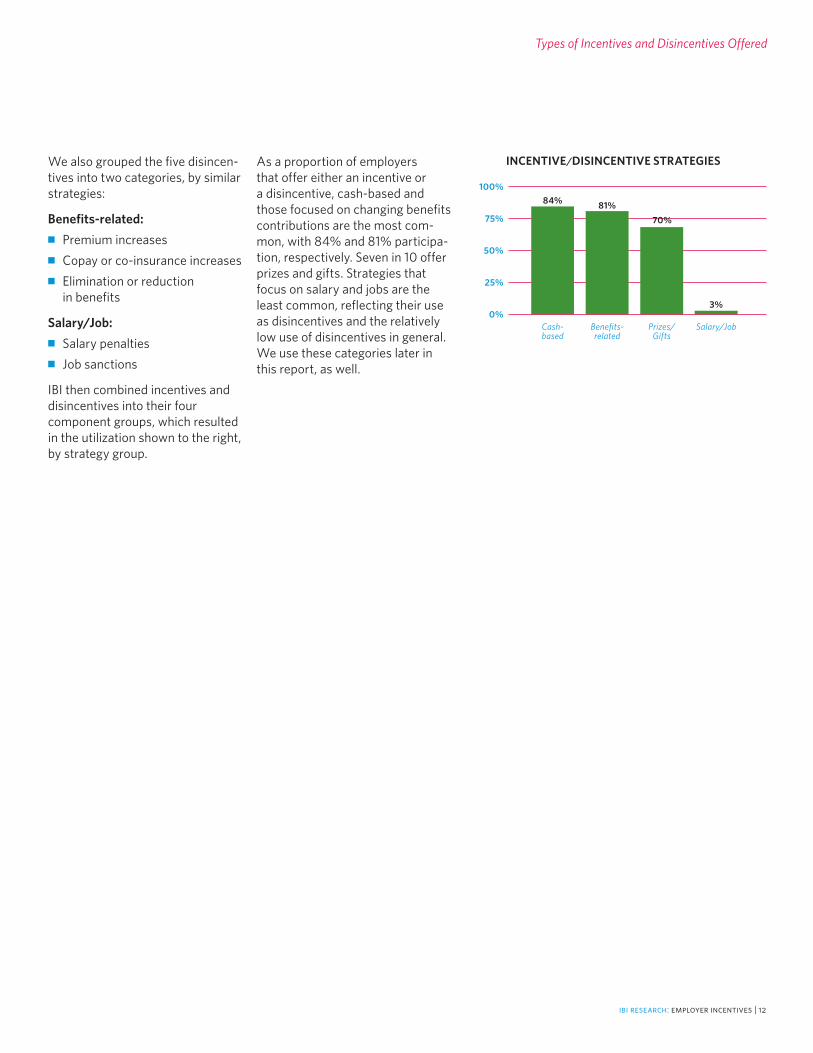
IBI then combined incentives and disincentives into their four component groups, which resulted in the utilization shown to the right, by strategy group.
Types of Incentives and Disincentives Offered
100%
75%
50%
25%
0%Cash-based
INCENTIVE/DISINCENTIVE STRATEGIES
84%
Benefits-related
81%
Prizes/Gifts
70%
Salary/Job
3%
ibi research: employer incentives | 12
As a proportion of employers that offer either an incentive or a disincentive, cash-based and those focused on changing benefits contributions are the most com-mon, with 84% and 81% participa-tion, respectively. Seven in 10 offer prizes and gifts. Strategies that focus on salary and jobs are the least common, reflecting their use as disincentives and the relatively low use of disincentives in general. We use these categories later in this report, as well.
ibi research: employer incentives | 13
Targets and Goals for Incentives and Disincentives
Incentives and disincentives don’t stand alone; they are used to achieve specific employer goals. We asked employers what employee results they are targeting through the incentives and disincentives they use. Employers were allowed to select more than one type of result for each incentive.
We viewed these results along a continuum: from participation to a health-behavior change, regard-less of the effect on health and productivity, to actual changes in outcomes:
■ Participation includes employee attendance or engagement in a health-related program of any type. The incentive is awarded directly for participation; for example, participation in an edu–cational program (e.g., attending a smoking-cessation class), completion of a health-related document (e.g., health risk appraisal), online activity (e.g., visiting a health-related Website), or participation in a return-to- work program (e.g., meeting with disability-related case manager).
■ Health-behavior Change includes changes in the health-related behavior of an employee. The incentive is awarded directly for the actual health-behavior change; for example, this could include engagement in less risky behav-ior (e.g., smoking less, exercising more) or participation in appro- priate health-related treatment (e.g., using more preventive health services).
■ Outcomes include measurable employee health-related outcomes or results. The incentive is awarded directly for the actual health-related result; for example, this could include tangible lab results (e.g., cholesterol levels) or biomet-ric results (e.g., weight loss).
This goal-related dynamic is one of the most illuminating segments of this research. Employers get the most for their incentives/ disincentives investment when such programs actually result in a changed outcome, such as weight loss, a change in choles-terol levels or less time off work. At the other end of the spectrum, participation is a plus and a neces-sary start to improved outcomes, but little might be gained from someone attending presentations on smoking cessation or nutrition if no change in behavior or outcome results despite “great” participation results.
There are a number of ways to quantify how the goals are applied to incentives and disincentives. For example, respondents cited a total of 1,540 different incen-tives and disincentives that they apply to encourage workforce health and productivity. Of those, outcomes were listed as a goal for 602 (39%), behavior change was a goal for 789 (51%) and participa-tion was a goal for 1,211 (79%). As
noted, respondents were permit-ted to choose as many of the three potential program goals as they believe apply.
Another way to quantify the extent to which outcomes are a goal of the incentives/disincentives programs is to take an employer-centric view of the goals. For employers that offer at least one incentives program, outcomes are listed as a program goal for 14% of the incen-tives reported, on average, by each employer. To help put this in per-spective, 38% of respondents with at least one incentives program said that outcome is never a goal, while 6% of respondents stated that 50% or more of their incen-tives are targeted on outcomes.
By this measure, employers target their disincentives on outcomes more frequently. On average, those employers offering at least one disincentives program target outcomes 20% of the time, and 12% of respondents say they target outcomes 50% or more of the time.
Finally, the best way to evaluate whether employers are willing to encourage outcomes is likely to be the extent to which each employer lists outcomes as a goal for at least one of the incentives and disincen-tives it maintains.

Targets and Goals
By this measure, participation and behavior changes still outweigh outcomes as goals.
More than three-quarters seek employee participation in the programs they offer. The percent-age reduces to 65% for behavior change. Half of all employers list outcomes as a goal for at least one of the incentives and/or disin-centives programs they have in place. We find here that half the employer respondents understand and value the ability to encourage better outcomes through incen-tives and disincentives, at least to some extent. And yet, as we see above, on average employers target only 14% and 20% of their incen-tives and disincentives programs, respectively, on outcomes.
It isn’t clear why employers appear to be putting fewer resources into program targets that, logically, they should prefer—that is, behavior change and better outcomes. We suspect that the reluctance has to do with concerns about the ability to measure behavior change and actual outcomes. Participation is certainly far easier to measure. We discuss this question more later.
For guidance, we looked at goals cut two different ways.
Goals by Groupings of Incentives
First we looked at goals by the way we grouped incentives and disin-centives into categories.
For the goals organized by these broader categories, we note several interesting results. There is a wide variety of incentives available, yet there appears to be little distinction or consensus about which types
of incentives best serve which goals. Within each category of participation, behavior change and outcomes, there is little difference whether employers use cash-based, benefits-related or prizes/gifts incentives.
Another way to say this is that there is no consensus about which types of incentives better serve each of the goals. For example, between 80% and 83% of employ-ers encourage participation through use of one of the three major cat-egories of incentives. For behavior change, the range is 68% to 70%. The most diversity is shown for employers trying to encourage out-comes. Comparing benefits-related incentives to cash-based for an out-comes goal, employers appear to significantly favor benefits-related incentives, with prizes and gifts in the middle.
This general lack of differentiation tracks with the earlier hypothesis that incentives use is relatively new. Perhaps they need more experience to better refine their use of the right incentive to achieve the appropriate goal. Another hypoth-esis is that they aren’t measuring results, so they haven’t refined the application of incentives programs by desired goal.
The other observation from this comparison is that the use of incen-tives, by category, diminishes here too, as employers’ goals move from participation to behavior change to outcomes. Cash-based benefits fall off the most and benefits-related the least. Employers focus on par-ticipation instead of outcomes with their incentives groups even while maintaining a broad range of incen-tive types for those that use them.
100%
75%
50%
25%
0%Participation
INCENTIVES/DISINCENTIVES PROGRAM GOALS FOR EMPLOYEES
77%
Behavior Change
65%
Outcomes
50%
100%
75%
50%
25%
0%Participation
GOALS BY INCENTIVE TYPE
82%
Behavior Change
Outcomes
80% 83%
Cash-based
Benefits-related
Prizes/gifts
68% 70% 70%
50%57% 54%
ibi research: employer incentives | 14
Targets and Goals
Goals by Groupings of Disincentives
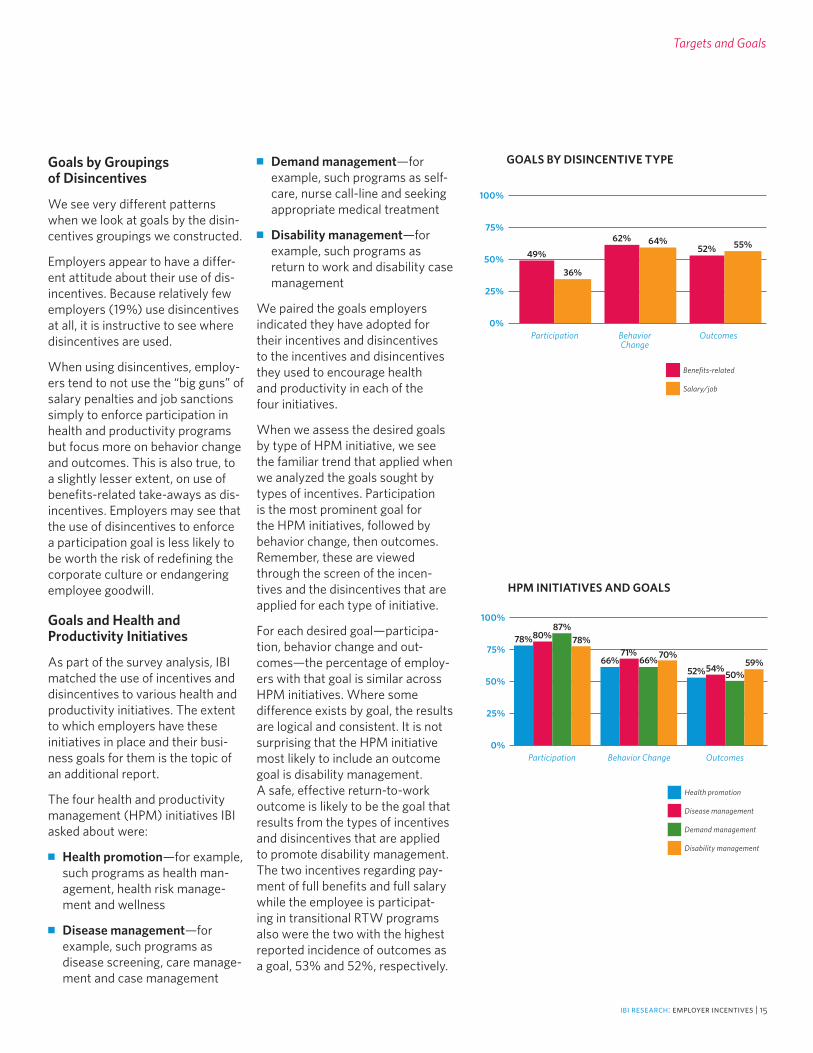
We see very different patterns when we look at goals by the disin-centives groupings we constructed.
Employers appear to have a differ-ent attitude about their use of dis-incentives. Because relatively few employers (19%) use disincentives at all, it is instructive to see where disincentives are used.
When using disincentives, employ-ers tend to not use the “big guns” of salary penalties and job sanctions simply to enforce participation in health and productivity programs but focus more on behavior change and outcomes. This is also true, to a slightly lesser extent, on use of benefits-related take-aways as dis-incentives. Employers may see that the use of disincentives to enforce a participation goal is less likely to be worth the risk of redefining the corporate culture or endangering employee goodwill.
Goals and Health and Productivity Initiatives
As part of the survey analysis, IBI matched the use of incentives and disincentives to various health and productivity initiatives. The extent to which employers have these initiatives in place and their busi-ness goals for them is the topic of an additional report.
The four health and productivity management (HPM) initiatives IBI asked about were:
■ Health promotion—for example, such programs as health man-agement, health risk manage-ment and wellness
■ Disease management—for example, such programs as disease screening, care manage-ment and case management
■ Demand management—for example, such programs as self-care, nurse call-line and seeking appropriate medical treatment
■ Disability management—for example, such programs as return to work and disability case management
We paired the goals employers indicated they have adopted for their incentives and disincentives to the incentives and disincentives they used to encourage health and productivity in each of the four initiatives.
When we assess the desired goals by type of HPM initiative, we see the familiar trend that applied when we analyzed the goals sought by types of incentives. Participation is the most prominent goal for the HPM initiatives, followed by behavior change, then outcomes. Remember, these are viewed through the screen of the incen-tives and the disincentives that are applied for each type of initiative.
For each desired goal—participa-tion, behavior change and out-comes—the percentage of employ-ers with that goal is similar across HPM initiatives. Where some difference exists by goal, the results are logical and consistent. It is not surprising that the HPM initiative most likely to include an outcome goal is disability management. A safe, effective return-to-work outcome is likely to be the goal that results from the types of incentives and disincentives that are applied to promote disability management. The two incentives regarding pay-ment of full benefits and full salary while the employee is participat-ing in transitional RTW programs also were the two with the highest reported incidence of outcomes as a goal, 53% and 52%, respectively.
ibi research: employer incentives | 15
100%
75%
50%
25%
0%Participation
GOALS BY DISINCENTIVE TYPE
49%
Behavior Change
Outcomes
36%
Benefits-related
Salary/job
62% 64%52% 55%
100%
75%
50%
25%
0%Participation
HPM INITIATIVES AND GOALS
78%
Behavior Change Outcomes
80%87%
Health promotion
Disease management
Demand management
Disability management
78%
66%71%
66%70%
52%54%50%
59%
As to the goal of participation, demand management has a significantly higher participation goal than the other three HPM initiatives. Because the goal for demand management is likely to be employee engagement in health coaching and medical treatment, participation is a sensible goal by which success can be measured.
Why Not Focus on Outcomes?
One might wonder if it is rational to focus attention on inducing employees to participate in a health and productivity program and, to a lesser extent, to encourage behav-ior change if there isn’t equal focus on a change in outcomes.
In probing the various goals and other issues around incentives and disincentives, we also conducted 25 expert interviews to add context to the survey results. In those sur-veys, we found two insights into the issue of outcomes as a goal.
First, we found that these employ-ers still are not certain about the types of outcomes that might be most useful to track and reward. This confusion apparently is less of a problem for disability manage-ment, where return to work is an outcome worth measuring but the likely outcomes for other interven-tions are less obvious.
In addition, employers said that they are uncertain about the best ways to measure outcomes. Perhaps if employers first defined the appropriate outcomes to seek, it would make the measurement issue an easier one with which to deal. For example, if a reduc-tion in health risks is an outcome that employers seek from health promotion initiatives, there are many health risk assessments that are available. By the same token, if employers determine that they seek to improve health-related productivity in their workforces, there now are self-report tools available to assess such improve-ment, such as HPQ-Select, which IBI developed in partnership with the Midwest Business Group on Health and Ronald Kessler, Ph.D., of Harvard Medical School. A variety of self-report tools are offered by other organizations as well.11
Uncertainty about what outcomes to measure and how to measure them may be symptomatic of the newness of an incentives/disin-centives approach, about which we have seen other evidence. As employers mature in their pro-grams, their focus can be expected to tighten.
The major focus on participation also may come because the results are relatively easy to measure. Did the employee fill out a health risk assessment? Did he or she attend a smoking-cessation clinic? Did he or she consult an online health coach? Behavior change and out-comes may be viewed as harder to measure and quantify.
Targets and Goals
Corporate culture and a desire to promote employee satisfaction may be driving emphasis toward participation. Simply “showing up” is relatively inoffensive as a goal and is unlikely to spur a negative reaction. Similarly, in mid- December 2006, the Departments of Labor, Treasury, and Health and Human Services jointly issued final regulations concerning HIPAA’s nondiscrimination and wellness program rules.12 The wellness rules apply only when obtaining a health plan–related reward depends on meeting (or not meeting) a health-related standard (i.e., an outcome). If a reward is conditioned only on participation, the wellness regula-tions don’t apply. These survey results from 2007 may reflect a desire by employers to avoid the requirements of the new regula-tions (or any uncertainty in applying them) by offering par-ticipation programs.
11 Mattke, Balakrishnan, Bergano and Newberry. “A Review of Methods to Measure Health-Related Productivity Loss,” American Journal of Managed Care. 13: 211-217. April 2007.12 December 13, 2006, 71 Federal Register 75014.
ibi research: employer incentives | 16
ibi research: employer incentives | 17
Effectiveness of Incentives and Disincentives
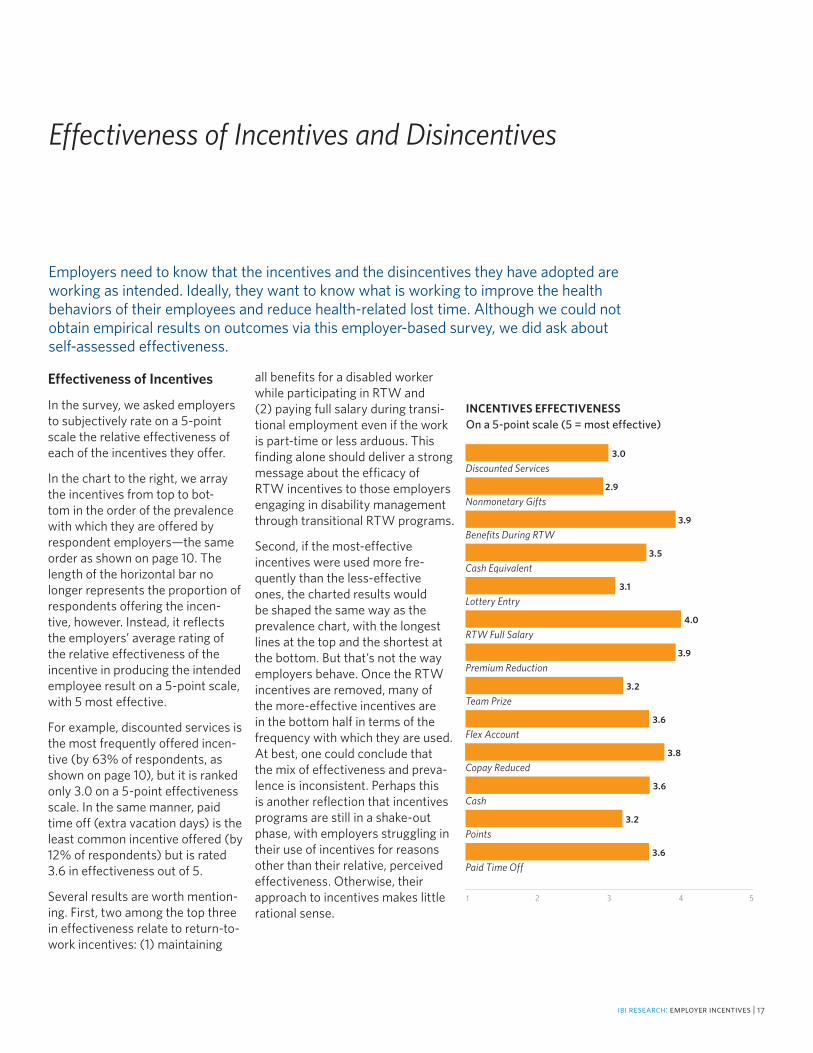
Employers need to know that the incentives and the disincentives they have adopted are working as intended. Ideally, they want to know what is working to improve the health behaviors of their employees and reduce health-related lost time. Although we could not obtain empirical results on outcomes via this employer-based survey, we did ask about self-assessed effectiveness.
Effectiveness of Incentives
In the survey, we asked employers to subjectively rate on a 5-point scale the relative effectiveness of each of the incentives they offer.
In the chart to the right, we array the incentives from top to bot-tom in the order of the prevalence with which they are offered by respondent employers—the same order as shown on page 10. The length of the horizontal bar no longer represents the proportion of respondents offering the incen-tive, however. Instead, it reflects the employers’ average rating of the relative effectiveness of the incentive in producing the intended employee result on a 5-point scale, with 5 most effective.
For example, discounted services is the most frequently offered incen-tive (by 63% of respondents, as shown on page 10), but it is ranked only 3.0 on a 5-point effectiveness scale. In the same manner, paid time off (extra vacation days) is the least common incentive offered (by 12% of respondents) but is rated 3.6 in effectiveness out of 5.
Several results are worth mention-ing. First, two among the top three in effectiveness relate to return-to-work incentives: (1) maintaining
all benefits for a disabled worker while participating in RTW and (2) paying full salary during transi-tional employment even if the work is part-time or less arduous. This finding alone should deliver a strong message about the efficacy of RTW incentives to those employers engaging in disability management through transitional RTW programs.
Second, if the most-effective incentives were used more fre-quently than the less-effective ones, the charted results would be shaped the same way as the prevalence chart, with the longest lines at the top and the shortest at the bottom. But that’s not the way employers behave. Once the RTW incentives are removed, many of the more-effective incentives are in the bottom half in terms of the frequency with which they are used. At best, one could conclude that the mix of effectiveness and preva-lence is inconsistent. Perhaps this is another reflection that incentives programs are still in a shake-out phase, with employers struggling in their use of incentives for reasons other than their relative, perceived effectiveness. Otherwise, their approach to incentives makes little rational sense.
Discounted Services
Nonmonetary Gifts
Benefits During RTW
Cash Equivalent
Lottery Entry
RTW Full Salary
Premium Reduction
Team Prize
Flex Account
Copay Reduced
Cash
Points
Paid Time Off
INCENTIVES EFFECTIVENESSOn a 5-point scale (5 = most effective)
3.0
2.9
3.9
3.5
3.1
4.0
3.9
3.2
3.6
3.8
3.6
3.2
3.6
1 2 3 4 5

Effectiveness of Disincentives
Turning to the effectiveness of disincentives, the lessons are less clear.
The message is more muddled because with only one exception the effectiveness of disincentives is viewed as pretty much the same: middling effectiveness on average. The exception—the effectiveness of job sanctions as a disincentive—appears to repeat the pattern we saw with regard to incentives. Here, the most-effective disincentive is the least used.
There may be a subtle difference here, however. Although job sanc-tions are thought to be effective (and among of the most effec-tive incentives and disincentives overall), they may be used less frequently because of the very power of the sanctions in disrupting seniority, relative compensation, benefits entitlement and other, normal perquisites of employ-ment. Remember, these sanctions are being levied not because of safety violations or dishonesty but because of a failure to cooperate with workforce health and produc-tivity promotion. It may be that the sanction is viewed as too draconian by management and workers alike.
Incentive/Disincentive Effectiveness by Category
We show effectiveness by the strategic groups we constructed for incentives and disincentives earlier in this report. For this purpose, we left benefits-related incentives and benefits-related disincentives separate.
This cut at the effectiveness results—with the most-effective group at the top and the least effective at the bottom—gives us additional insights. Benefits-related incentives, as a group, are deemed most effective by respondents, while the effectiveness of benefits-related disincentives are among the least effective as a group. At least in this stage of development, employers appear to believe that benefits-related incentives are doing a better job of promoting health and productivity among the workforce than are benefits take-aways.
Effectiveness of Incentives and Disincentives
Premium Increases
Copay Increases
Reduced Benefits
Salary Penalty
Job Sanctions
DISINCENTIVES EFFECTIVENESSOn a 5-point scale (5 = most effective)
3.2
3.3
3.0
3.1
3.9
1 2 3 4 5
Benefits-related Incentives
Salary/Job Sanctions Disincentives
Cash-based Incentives
Benefits-related Disincentives
Prizes/Gifts Incentives
INCENTIVES/DISINCENTIVES EFFECTIVENESSBY CATEGORYOn a 5-point scale (5 = most effective)
3.8
3.5
3.4
3.2
3.1
1 2 3 4 5
ibi research: employer incentives | 18

ibi research: employer incentives | 19
Contribution or Penalty Amounts
Employers show particular interest in the dollar amount of the investment or penalty asso-ciated with the incentives and the disincentives they offer. IBI compared the level of employer payment (in the form of premiums, copays and co-insurance, cash and flex-account contribu-tions) for incentives with the penalties employers impose for the disincentives they use.
In the chart to the right, one is struck by the similarity in the proportion of employers that invest and penalize each amount in each of the monetary categories. The only real difference is that a larger share of employers spend $100 to $200 on incentives compared with those that spend the same amount in disincentive penalties for this financial category.
One also is struck by the declin-ing employer proportions as levels increase, at least until the $400+ level is reached. Clearly, a reason-ably large share of employers are willing to invest significantly in incentives or to penalize employees heavily with disincentives.
Amount by Incentive/ Disincentive Type
Analysis also shows that employ-ers appear to put more at risk for disincentives than they do for incentives. Premium adjustments of more than $400 per participant per year are more frequent as an increased premium disincentive than a decreased premium incen-tive (24% versus 18%, respectively, over $400) and are more frequent as an increased copay disincentive than a decreased copay incentive (29% versus 24%, respectively, over $400).
Of the incentives and the disin-centives included in the question, the one with the highest propor-tion over $400 was for the salary penalty disincentive, where the pro-portion penalizing more than $400 was 43% of respondents.
It is interesting that the relative amount at risk for disincentives, at the high end, for the three disincentives assessed (premium increases, copay increases and salary penalties) doesn’t result in an assessment of higher effective-ness. In fact, incentives repre-sented by premium decreases and copay decreases tended to be relatively more moderate and were rated much higher in effec-tiveness overall.
Less than $100
$100–$200
$201–$300
$301–$400
$400+
0% 10% 20% 30%
HOW MUCH INVESTMENT/PENALTY?Per participant per year
Incentives
Disincentives
27%29%
28%21%
19%18%
6%8%
21%24%

What to Improve?
As a final question, we asked, “In your organization’s current state, would you do anything about your incentive-/disincentive-based approach to make it more effective?” Respondents were allowed to select any that apply.
The chart to the right shows the top-four change strategies selected by employers.
Nearly three-quarters said they would improve their communica-tion strategy to boost participa-tion, believing, apparently, that employees don’t understand or value sufficiently the programs that are available to them. The need to improve a communication strategy is frequently mentioned in IBI case studies as an area for improvement when new programs are estab-lished. This is likely to be the case here, with a relatively new program
in need of better explanation. A recent empirical study demon-strated the importance of commu-nication frequency and modality to improve participation rates in their incentive-based programs.13
Nearly half said they would reward a different set of activities, show-ing that many don’t believe the activities they are encouraging are having the desired effect.
13 Taitel, Haufle, Heck, Loeppke and Fetterolf. “Incentives and Other Factors Associated with Employee Participation in Health Risk Assess-ments,” JOEM. 50(8). August 2008.
The improvement questions were as follows:
1. Nothing; our approach is working.
2. Nothing; corporate culture will not support additional change.
3. Not sure; need more information.
4. Increase dollar value of incentives.
5. Keep dollar value of incentives the same.
6. Decrease dollar value of incentives.
7. Change the types of activities that are rewarded.
8. Reward participation in multiple activities, not just a single activity.
9. Improve communication strategy to boost participation.
10. Impose higher financial penalties.
11. Other.
80%
60%
40%
20%
0%Improve
Communi-cation
MAKING IMPROVEMENTSTop-four change strategies
72%
Reward Different Activities
47%
Increase Dollar Value
42%
Multiple Activities
41%
ibi research: employer incentives | 20
What to Improve?
ibi research: employer incentives | 21
A little more than 40% said they would increase the dollar value of their incentive-based programs. The amount they have chosen cur-rently is not sufficient to motivate the desired behavior. This contrasts with the fewer than 12% who said they would impose higher financial penalties as part of their disincen-tives approach. Finally, about 40% also said they would reward partici-pation in multiple activities, not just a single activity. This shows that employers understand the “interac-tion effect” of multiple approaches.
Each of these top-four improve-ments is likely an indication that employers are experimenting with several aspects of their incentives and disincentives programs. Very few employers—only 8%—indi-cated that their approach was working and they would not change anything. On the whole, the types and the combinations of activities to which the programs are applied are being questioned as is the amount of the investment or pen-alty involved. As these programs change, the communication tech-niques and strategies become even more important to assure employ-ees that health and productivity is a corporate goal, potentially critical to the future profitability of the company as well as to the health and happiness of workers.
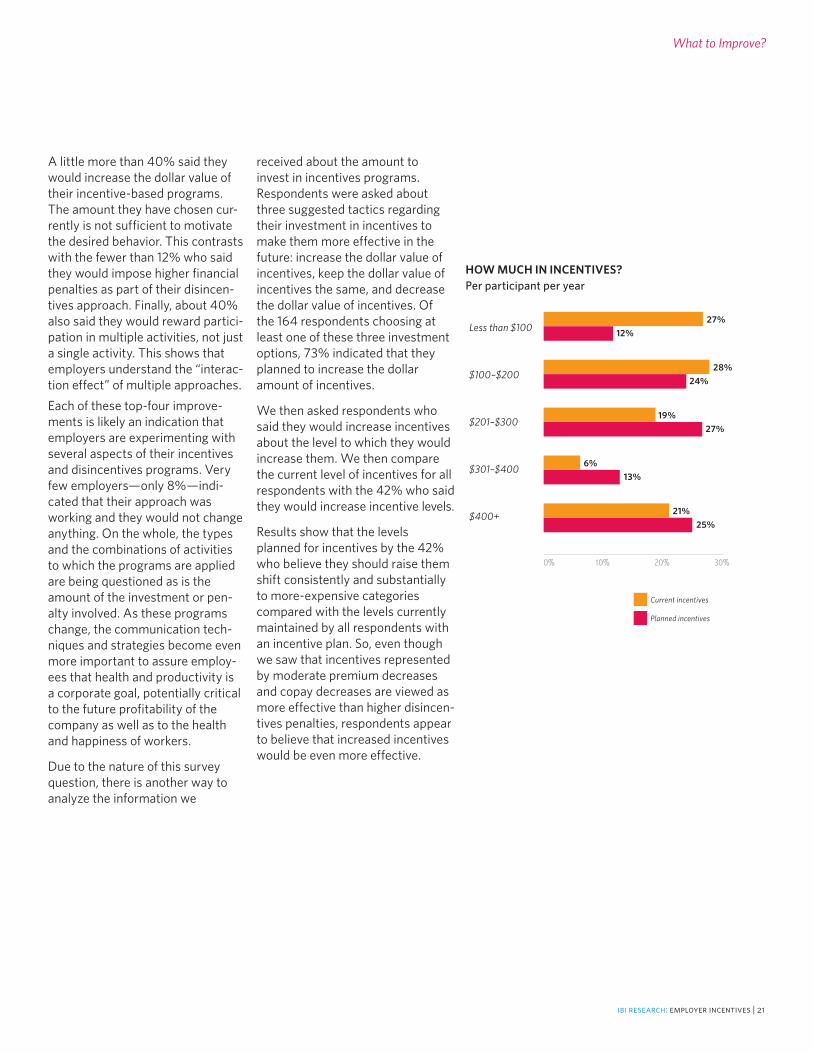
Due to the nature of this survey question, there is another way to analyze the information we
received about the amount to invest in incentives programs. Respondents were asked about three suggested tactics regarding their investment in incentives to make them more effective in the future: increase the dollar value of incentives, keep the dollar value of incentives the same, and decrease the dollar value of incentives. Of the 164 respondents choosing at least one of these three investment options, 73% indicated that they planned to increase the dollar amount of incentives.
We then asked respondents who said they would increase incentives about the level to which they would increase them. We then compare the current level of incentives for all respondents with the 42% who said they would increase incentive levels.
Results show that the levels planned for incentives by the 42% who believe they should raise them shift consistently and substantially to more-expensive categories compared with the levels currently maintained by all respondents with an incentive plan. So, even though we saw that incentives represented by moderate premium decreases and copay decreases are viewed as more effective than higher disincen-tives penalties, respondents appear to believe that increased incentives would be even more effective.
Less than $100
$100–$200
$201–$300
$301–$400
$400+
0% 10% 20% 30%
HOW MUCH IN INCENTIVES?Per participant per year
Current incentives
Planned incentives
27%12%
28%24%
19%27%
6%13%
21%25%

Conclusion
Employer-based strategies to encourage employees to improve their health and productivity are relatively common across employer segments by size and industry.14 The major difference in behavior among employers is their willingness to offer incentives rather than disincentives.
Aside from corporate culture, most of the reasons cited for an absence of incentives or disincentives programs can be remedied through education about the need to bring employees to health and productiv-ity, the competitive downside of failing to do so, and the potential savings and value that can come from investing in workforce health and productivity. Developing a supportive corporate culture will require more effort, and the survey results show us that such an effort needs to include a more effective communication strategy.
Much evidence from the survey points to incentives and disincen-tives as a relatively new phenom-enon. As with most new, dynamic programs, there still is much fine-tuning needed. Employers appear confused about how to offer the most-effective programs and how to target incentives and disincen-tives toward the goals they need to maximize the health and productiv-ity of their workforce.
This report provides a baseline for employer experience related to incentives and disincentives to promote health and productivity. Experience with current initiatives programs, enhanced communica-tion with employees about the importance of improved health and productivity, and careful measure-ment of results should help improve employer decision-making about the incentives and the disincen-tives they use. As evidence grows regarding the payoff for employers and their employees in health and productivity investments, IBI will continue to publish those develop-ments and provide tools to employ-ers that seek improvement.
14 Two-thirds of Large Employers Now Offering Incentives to Improve Employees’ Health. “Man-agement Barometer.” PricewaterhouseCoopers. April 2006.
ibi research: employer incentives | 22
Appendix
Organizations RepresentedFor this survey, we developed an opportunity sample based on IBI’s mem-ber lists and the clients and the members of the following organizations:
■ National Business Coalition on Health
■ Pacific Business Group on Health
■ Los Angeles Business Coalition on Health
■ Maine Health Management Coalition
■ Midwest Business Group on Health
■ Nevada Health Care Coalition
■ Employer Health Care Alliance
■ Savannah Business Group
■ Memphis Business Group on Health
■ Mid-America Coalition on Health Care
■ Colorado Business Group on Health
■ Indiana Employers Quality Health Alliance
■ Pittsburgh Business Group on Health
■ Oregon Coalition of Health Care Purchasers
■ American Association of Occupational Health Nurses
■ Alere, formerly Matria Healthcare
We appreciate these partners’ assistance in this particular survey effort and their ongoing support in connecting employers with effective health and productivity improvement strategies.
The Survey Harris Interactive, an independent national market research firm best known for the Harris Poll, conducted the Web-based survey during the summer of 2007. The respondents consist of 500 employers represent-ing approximately 5 million employees. More detail on the workforce size, industry, workforce demographics and other characteristics are provided on the following page. Survey definitions and detailed analytic results are available from the authors.
ibi research: employer incentives | 23
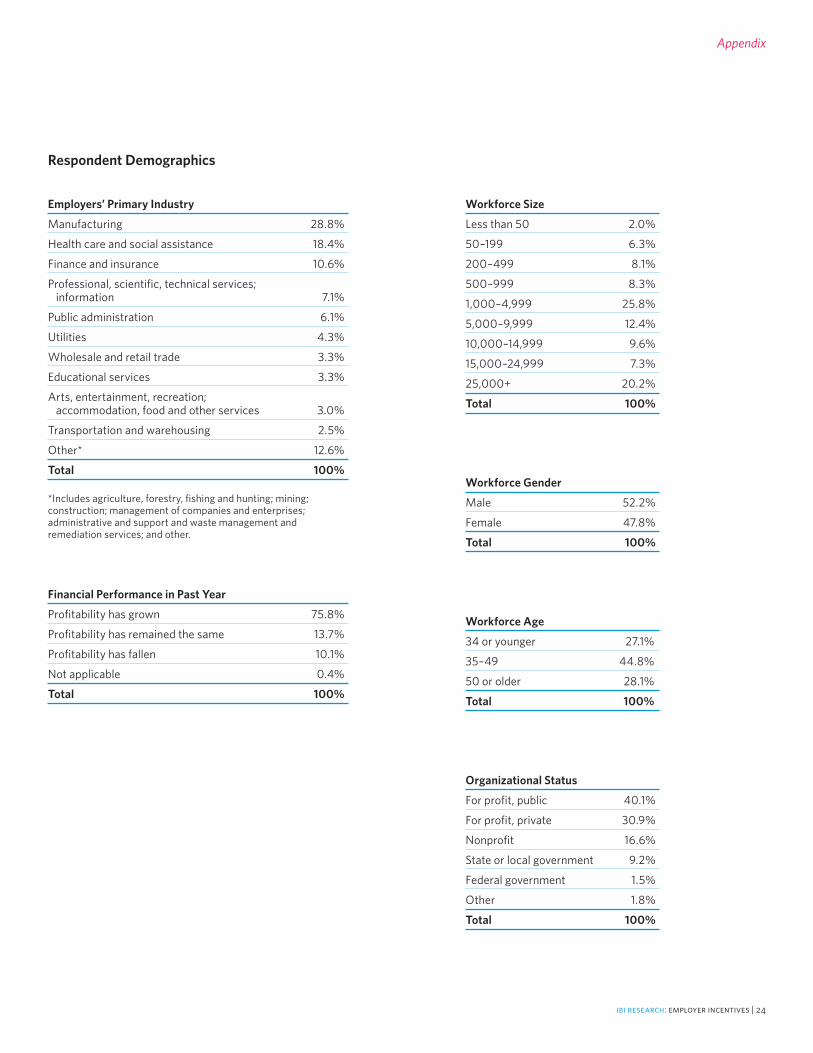
Employers’ Primary Industry
Manufacturing 28.8%
Health care and social assistance 18.4%
Finance and insurance 10.6%
Professional, scientific, technical services; information 7.1%
Public administration 6.1%
Utilities 4.3%
Wholesale and retail trade 3.3%
Educational services 3.3%
Arts, entertainment, recreation; accommodation, food and other services 3.0%
Transportation and warehousing 2.5%
Other* 12.6%
Total 100%
*Includes agriculture, forestry, fishing and hunting; mining; construction; management of companies and enterprises; administrative and support and waste management and remediation services; and other.
Workforce Size
Less than 50 2.0%
50–199 6.3%
200–499 8.1%
500–999 8.3%
1,000–4,999 25.8%
5,000–9,999 12.4%
10,000–14,999 9.6%
15,000–24,999 7.3%
25,000+ 20.2%
Total 100%
Workforce Gender
Male 52.2%
Female 47.8%
Total 100%
Workforce Age
34 or younger 27.1%
35–49 44.8%
50 or older 28.1%
Total 100%
Organizational Status
For profit, public 40.1%
For profit, private 30.9%
Nonprofit 16.6%
State or local government 9.2%
Federal government 1.5%
Other 1.8%
Total 100%
Financial Performance in Past Year
Profitability has grown 75.8%
Profitability has remained the same 13.7%
Profitability has fallen 10.1%
Not applicable 0.4%
Total 100%
Respondent Demographics
Appendix
ibi research: employer incentives | 24
The key findings from IBI’s incentives survey uncovered many challenges for employers in implementing a program of incentives and disincentives to promote workforce health and productivity. To help employers understand how best to respond, IBI invited experts from its member companies to offer employers advice about the challenges, disconnects and obstacles identified in the study.
ibi research: employer incentives | 25
Employer Action Items
■ Stick with your goals over time—consistency is vital. Change only when goals are met and exceeded, then move to other high-value goals.
■ Use IBI’s four health and productiv-ity program categories to organize and coordinate your incentives: health promotion, disease manage-ment, demand management and disability management. Look at each program type and ask, “Now what should we do in this slot that is consistent with and complementary to what we are doing in the other three?” This way you really can’t go far off the rails—it can be that straightforward.
15 <www.ibiweb.org/do/PublicAccess? documentId=785>
IBI Finding #1
Employers appear to use a shotgun approach in developing incentives programs. The incentives they offer aren’t related systematically to employers’ goals.
Expert Tips:
■ Focus your incentives programs where they will do the most good. Review your existing data on what medical conditions affect your total costs of ill health (or develop work-force data using such employee self-report tools as IBI’s HPQ-Select15).As part of this process, listen to what employees value. If, for example, your workers resist weight or alcohol abuse management, seek to manage something less threaten-ing but still with a high impact, like fatigue or sleep disorders.
■ Incentives usually are poorly inte-grated. Integrate your incentives to achieve the best overall workforce results, decrease the management/administrative burden on you and your suppliers and identify broader outcomes to justify the expense.
■ It is important for you to integrate incentives with plan design, consumer information and com-munication initiatives. Based on one MSB member’s experience, financial barriers accounted for only 25% of self-reported causes of nonadherence.
■ Multiply the effects of your incen-tives and health and productivity initiatives through participant peer support and periodic feedback. For example, let employee teams compete for results, such as weight loss, smoking cessation and miles walked or jogged, to generate peer support. In addition, provide con-stant feedback and encouragement by prominently posting results and the “speed” at which they are being achieved (such as graphic “ther-mometer readings”).
■ Don’t offer an incentives smorgas-bord. Not all incentives are equal, but most work better when they fit your culture and goals. A shotgun approach may distract employees and waste time and effort reaching an unintended goal that is mean-ingless to your corporate health.
Actions for American Business Today: Expert Tips
Employer Action Items
IBI Finding #2
Employers target participation as their most frequent incen-tives goal, outcomes much less so. Yet posi-tive outcomes would best serve employers’ bottom-line targets.
■ Lay out a multiyear strategy of positive incentives: Reward partici-pation in the first year; transition to a particular outcome in year two; then reward multiple outcomes in the third year. Market the approach to employees at the outset. Explain the gradual progression of activities required to earn the reward over successive years. Include certain standard incentives programs (e.g., smoking cessation) and vary others over different years to keep the focus on encouraging a variety of behavior changes.
■ Before implementing any new incentives or disincentives, identify measurable goals for participation, behavior change and outcomes. Obtain agreement from your vendor on the definition of each metric and the vendor’s ability to track and report. Set both near-term and longer-term goals up front to move the programs from employee participation to outcomes. Ask health plans (a significant source of incentives programs) to provide outcomes-based incentives options to help offset the expense of the incentives.
■ Emphasize incentives with longer-lasting visibility to your employ-ees (e.g., cash may lose its effect over time and be viewed as an entitlement). “Instant gratification” incentives may increase participa-tion, but the incentive’s impact may quickly be forgotten and not sustain the employee through the continuum from participation to behavior change to outcomes.
Expert Tips:
■ When introducing incentives/ disincentives, it might make sense to focus on employee participa-tion; it’s easy to measure, is less of a culture challenge and has fewer regulatory restrictions. After a few years of communicating and educat-ing workers about the importance of health, be more aggressive and target outcomes.
■ If you have behavior change or out-come goals that can’t be measured, reassess whether to continue such programs.
ibi research: employer incentives | 26
ibi research: employer incentives | 27
Employer Action Items
IBI Finding #4
Employers often don’t view the incentives and disincentives they offer as the most effective. Yet, they are unwilling to mandate effective disincentives.
■ If your corporate culture is in a lower state of readiness for change, consider as an initial strategy a simple, understandable program design with a lower-dollar-value incentive as an initial strategy. Based on results, build incentive value and complexity over time.
■ As with everything, an effective communication strategy is critical for a successful incentives pro-gram. It is much easier and more effective to introduce a consistent communication plan built around a few important goals. Define two or three measurable, high-value goals, (for example, reduce the average companywide body mass index, lower the companywide percentage of smokers and increase the number of employees in active, regular exercise programs). Set the goals by quarter and publicize the results.
■ Review all material that your outside incentives managers send to your employees to be sure it reinforces your corporate strategy and fits your culture.
■ For now, you might consider using disincentives to target unpopu-lar and costly behaviors such as smoking or for obtaining health risk information.
■ An “ineffective” incentive may reflect a failure of your offered health and productivity program rather than the incentive itself. Employees will be at different stages of receptivity to behavior change. Don’t do what many employers do, that is, treating all employees the same or focusing only on the first stage (awareness/commitment—e.g., take a health risk assessment) and neglecting the other stages.
■ You can learn much about incen-tives and disincentives for health and productivity by reviewing the experience your company may already have in offering safety incentives. Talk to your risk manager and workers’ compensa-tion administrator about their experiences with various incentives programs and their relative effectiveness.
Expert Tips:
■ Depending on your corporate culture, you may be right in delay-ing the use of disincentives until you can justify them by measur-able benefits against the risk. It is unlikely, however, that the use of disincentives will become more common than incentives anytime in the future. Use only the three or four types of incentives best for you unless there is a specific and compelling reason to use less effec-tive types—or disincentives.
Expert Tips:
■ Any incentives program and the initiative it supports must be seen as part of your corporate culture of health for it to be recognized as a serious and permanent part of your organization. Too often a health and productivity program may be per-ceived as a Benefits Department initiative simply aimed at saving health plan costs.
■ Suggestions for reinforcing a corpo-rate culture of health include:
> Top-down communication support, with senior executives putting out consistent, repeated messages about the importance of health
> Creation of a brand around your program to build employee recognition, ease communication and create a sense of belonging
> Public, visible participation of senior executives and super-visors in the same program in which your other employees are being asked to engage
> Showing broad support and sponsorship for nonwork activities and family programs that support health, such as run/walks or community health and fitness programs
■ Either make sure that what you offer fits your corporate style, image and communication or consciously adjust your culture to match your health and productivity goals.
IBI Finding #3
Corporate culture is critical to a successful incentives program. Incentives and disincen-tives that drift too far from the culture of the company and its work-force are unlikely to meet the employer’s goals.
Employer Action Items
IBI Finding #5
Employers invest substantial sums in incentives and disincentives programs.
■ Based on one MSB member’s expe-rience, the monetary value of the incentives/disincentives has more impact than the type of incentive/disincentive offered. This gives you the opportunity to engage employ-ees in the design of the program and to select incentive types that match their unique preference.
■ To justify the amount invested in incentives, it is vital that you broadly and effectively measure the economic ROI and other areas of impact. Hold your vendor part-ners accountable for results across your benefits programs and not just within the silo in which the vendor operates.
■ Encourage the establishment of a standard set of agreed-upon out-comes measures and use them as much as possible.
Expert Tips:
■ The same incentive value will be more effective if your company has a strong culture of health and an effective communication program than if it doesn’t.
■ When designing incentives/disin-centives programs, be careful to balance the incentive value with the effort needed to achieve the target. Additional value is needed for additional effort.
ibi research: employer incentives | 29

The Integrated Benefits Institute (IBI) provides employers and their supplier partners with resources to prove the business value of health. As a pioneer, leader and nonprofit supplier of health and productivity research, measurement and benchmarking, IBI is the trusted source for benefits performance analysis, practical solutions, and forums for information and education. IBI’s programs, resources and expert networks advance understanding about the link between—and the impact of—health-related productivity on corporate America’s bottom line.
For more than a decade, IBI has been in the forefront, leading businesses from concept to reality in integrating health, absence and disability management benefits as an investment in a productive workforce. IBI’s independent, cutting-edge approach and innovations consistently provide added value to a prestigious roster of employers, from leading corporations to small companies as well as their benefits management business partners.
IBI is committed to and invested in ground-breaking analysis of health, productivity, disability and absence issues as they cut across traditional health-related benefits, as well as expanding and enhancing its proven suite of measurement tools. Tackling the latest business challenges with state-of-the-art research, insights and thought leadership, IBI provides companies with robust and actionable integrated health and productivity benefits strategies. In close collaboration with frontline experts working on today’s critical business issues, IBI helps employers blaze a new trail both to superior benefits management in alignment with company objectives and to proving the business value of their health investment.
For more information about IBI’s programs and membership, go to ibiweb.org.