Embed Size (px)
Citation preview

LONGITUDINAL EMPLOYER - HOUSEHOLD DYNAMICS
TECHNICAL PAPERNO. TP-2005-01
Employer-Provided Benefit Plans, Workforce Composition andFirm Outcomes
Date : January 2005Prepared by : Anja Decressin, Julia Lane, Kristin McCue, Martha StinsonContact : U.S. Census Bureau, LEHD Program
FB 2138-34700 Silver Hill Rd.Suitland, MD 20233 USA
This document reports the results of research and analysis undertaken by the U.S. Census Bureau staff. It has undergone a CensusBureau review more limited in scope than that given to official Census Bureau publications. [This document is released to informinterested parties of ongoing research and to encourage discussion of work in progress.] This research is a part of the U.S. CensusBureau’s Longitudinal Employer-Household Dynamics Program (LEHD), which is partially supported by the National ScienceFoundation Grant SES-9978093 to Cornell University (Cornell Institute for Social and Economic Research), the National Instituteon Aging Grant 5 R01 AG018854-02, and the Alfred P. Sloan Foundation. The views expressed herein are attributable only to theauthor(s) and do not represent the views of the U.S. Census Bureau, its program sponsors or data providers. Some or all of thedata used in this paper are confidential data from the LEHD Program. The U.S. Census Bureau is preparing to support externalresearchers’ use of these data; please contact U.S. Census Bureau, LEHD Program, Demographic Surveys Division, FOB 3, Room2138, 4700 Silver Hill Rd., Suitland, MD 20233, USA.
Employer-Provided Benefit Plans, Workforce Composition and Firm Outcomes*
January 2005 Anja Decressin** Cornell University and U.S. Census Bureau Julia Lane National Science Foundation and U.S. Census Bureau Kristin McCue U.S. Census Bureau Martha Stinson U.S. Census Bureau ________________________________ * The authors wish to acknowledge the substantial contributions of LEHD Staff, in particular Tomeka Hill, Paul Lengermann, Kevin McKinney, and Kristin Sandusky, and wish to thank John Abowd, Dan Beller, Dan Black, Keenan Dworak-Fisher, Nick Greenia, Ron Jarmin, Javier Miranda, Joe Piacentini and seminar participants at the LEHD State Workshop 2003, the CES seminar, the U.S. Department of Labor Research Conference 2003, and the NBER-CRIW Pre-Conference 2004 for their comments. This document reports the results of research and analysis undertaken by U.S. Census Bureau staff. It has undergone a Census Bureau review more limited in scope than that given to official Census Bureau publications. This document is released to inform interested parties of ongoing research and to encourage discussion of work in progress. The views expressed herein are attributable only to the authors and do not represent the views of the Census Bureau, its program sponsors or data providers. This research uses confidential data from the Census Bureau’s Longitudinal Employer-Household Dynamics Program (LEHD), which is partially supported by the National Science Foundation Grant SES-9978093 to Cornell University (Cornell Institute for Social and Economic Research), the National Institute on Aging, and the Alfred P. Sloan Foundation. Integration of the Form 5500 data has also received support from the Employee Benefits Security Administration of the Department of Labor. The Census Bureau is preparing to support external researchers’ use of these data; please consult http://lehd.dsd.census.gov. ** Corresponding author: [email protected] U.S. Census Bureau Washington, DC 20233 (301) 763-6447

Abstract
What do firms gain by offering benefits? Economists have proposed two payoffs: (i) benefits may be a more cost-effective form of compensation than wages for employees facing high marginal tax rates, and (ii) benefits may attract a more stable, skilled workforce. Both should improve firm outcomes, but we have little evidence on this matter. This paper exploits a rich new dataset to examine how firm productivity and survival are related to benefit offering, and finds that benefit-offering firms have higher productivity and higher survival rates. Differences in firm and workforce characteristics explain some but not all of the differences in outcomes.
2

I. Introduction
Why do firms offer benefits to their employees? Answering this question has become
increasingly important both as the costs to employers of providing such benefits soar and as the
coverage of employees drops. Economists have stressed two payoffs to firms: (i) compensation
in the form of benefits may be more cost-effective than in the form of wages for employees who
face high marginal tax rates, and for large firms who can pool risk across employees and buy
group insurance, and (ii) a compensation package that includes benefits may attract a more
stable, skilled workforce. Inasmuch as both of these lead to a more productive workforce, they
should lead to improved firm outcomes. However it is important for assessing the implications
of policies affecting benefit provisions to understand how benefit provision affects the worker-
employer matching process and whether benefits have any independent effect on firm outcomes
or if they work solely by attracting high quality workers.
Disentangling the effect of benefit offerings is empirically difficult. Highly productive
workers are likely to be higher paid, as well as more stable and skilled, making it
econometrically challenging to separate out the effect of earnings and benefits on worker
productivity and turnover. And the firm-level empirical evidence necessary to answer how and
why firms differ in their benefits offerings –combined with information on workforce
characteristics -- is limited. This paper uses a new dataset to examine differences in workforce
characteristics and compensation between firms that offer benefits and those that do not. We are
able to check whether the data are consistent with the theory that different policies attract
different types of workers and we can examine the relationship between wages and benefits
holding worker quality constant. We then examine firm outcomes to see the extent to which a
firm’s success is related to benefit offering. In doing so, we examine whether the workforce
1

characteristics of benefit-offering firms largely explain differences in outcomes, or whether
benefits have a direct relationship to outcomes as well.
Our new dataset, which combines administrative data on benefit plans from IRS Form
5500 with integrated employer-employee data for over one million U.S. businesses and their
workers, has a number of key advantages. It enables us to examine the characteristics of firms
that offer benefits versus those that do not. It also permits us to examine differences in
workforce characteristics, turnover, and compensation between firms that offer benefits and
those that do not. Because of the firm level nature of the dataset, we can also examine the
relationship between the firm’s decision to offer benefits and firm outcomes such as productivity
and survival. And the ample sample size enables us to examine different industries separately –
since firms in different industries, with different production strategies, and different workforce
needs, will choose different benefit strategies.
The paper begins by briefly describing the literature that informs our analysis. The next
section describes the construction and unique characteristics of the dataset. This is followed by
an investigation of the relationship between benefits provision and firm characteristics,
workforce composition and turnover, and then by estimation of the relationship between benefit
provision and two firm outcomes—survival and productivity. The paper concludes with a
summary of our findings and a discussion of possible extensions.
II. Background
Although there is a vast literature on earnings and employment determination, there is a
much smaller body of knowledge about the determinants of the provision of benefits. Yet
understanding this component of compensation is important. On the firm side, in March 2004,
2

about 29% of compensation costs for employers in the public sector are accounted for by the cost
of benefits1 – having risen from 27.4% in March 2001. And, on the worker side, employers are
the main source of health insurance for workers under 65 (Morrisey, 2002), while more than half
of all workers participate in employer provided pension plans.2 In this section we review the
relevant theoretical and empirical literature.
A Why and how do Firms Utilize Benefits to Influence Workforce Composition?
There are several theoretical reasons for firms to offer benefits to their workforce. As
Black (1996) points out, a very important reason is that U.S. tax policy eliminates or defers most
taxes on pensions, life, and health insurance. Firms will, however, differ in their costs of
providing non-wage compensation, both because of economies of scale in benefit provision or
differing access to particular types of benefits plans.
Firms that offer different benefit/wage packages will end up with different workforces –
although theories differ as to why this is so. In hedonic wage models, for example, workers who
face a continuum of different compensation packages given by the envelope of firms’ varying
wage/benefit isoprofit lines, as in the standard textbook by Ehrenberg and Smith (1996, p. 247),
will sort themselves into different types of firms. Variation in workers’ willingness to trade off
wages against benefits leads to sorting of workers into firms on the basis of fringe benefit
offerings. Thus, in this model, sorting matches workers with their preferred compensation
package and minimizes employers’ costs of employing labor.
1 http://www.bls.gov/news.release/pdf/ecec.pdf 2 Employee Benefit Research Institute “Employment-Based Retirement Plan Participation and IRA Participation of Wage and Salary Workers by Income and Retirement Plan Status, 1998” http://www.ebri.org/pdfs/irainfo.pdf (July 5, 2005)
3
By contrast, dual labor market theory suggests there are two sectors: one with rationed
‘good’ jobs that pay well and have good working conditions, including fringe benefits; and a
second with ‘bad’ jobs having low pay and few benefits (Bulow and Summers, 1986; Dickens
and Lang, 1985). Efficiency wage models also generate an equilibrium in which workers with
the same productive characteristics would have jobs with different levels of compensation.
Understanding which of these reasons is the correct one is important – as Miller (2004)
points out in his excellent review of the literature, if the former case is correct, a mandate to
employers to provide health or pension coverage to otherwise uncovered workers would result in
those workers paying a large fraction of the cost through lower wages. While the notion that
workers pay for their benefits through reduced wages underlies much of the literature, empirical
work has often found a positive association between wages and benefits (holding constant
measured worker characteristics).3 We will compare wages at firms that offer benefits to wages
at firms that do not while controlling for workforce characteristics in order to test the theory that
workers trade wages for benefits.
B. How do Benefits Influence Turnover?
A long literature has documented that both pensions and health insurance are associated
with lower turnover. For pensions, economists have found a negative relationship between
pensions and quit rates for both defined benefit (DB) and defined contribution (DC) plans.4 In
the case of DB plans, implicit contract theory has been the primary framework used to interpret
this pattern: a loss of pension wealth penalizes workers who break their implicit contract by
3 Currie and Madrian (1999) review the literature on wage/health insurance trade offs. Ippolito (1994) summarizes the literature on compensating differentials for pensions. 4 See, for example, the review in Gustman, Mitchell, and Steinmeier (1994).
4
leaving prior to retirement. This compensation structure leads to self-selection so that firms
offering pensions end up with a workforce made up of stayers.
Ippolito (2002) offers an alternative explanation. One problem for implicit contract
theory has been the finding that quit rates are low for firms offering DC plans as well as those
offering DB plans, despite the fact that DC plans impose much smaller quitting costs (Gustman
and Steinmeier, 1993, 1995; Even and Macpherson, 1996; Ippolito, 2002). Ippolito argues that
quit rates are low because pensions in general attract savers, and that those who save at a higher
rate also have lower quit propensities. His 2002 paper expands on earlier work (Ippolito, 1997)
that argues that having a low discount rate makes both saving and staying more attractive, so
pensions are one method of attracting those with low discount rates who may also have higher
productivity. He presents evidence that those with characteristics that might be correlated with a
low discount rate are more likely to have a pension, and are also more likely to have high
performance ratings.
An alternative explanation for low quit rates under pension plans is that firms with
pensions may also pay higher wages than firms without, and that the difference in wages is what
accounts for lower turnover (Gustman and Steinmeier, 1995; Even and Macpherson, 2001).
Gustman and Steinmeier (1995) point out that wage differences would help explain some other
puzzles as well—why the reduction in turnover associated with pensions is largest for young
workers, for whom the associated pension losses are small; and why the reduction appears to
occur primarily through fewer layoffs rather than through fewer quits.
Thus an important question is whether benefits are associated with a workforce with
more productive characteristics as well as lower turnover. In the empirical work that follows, we
5
address this by examining the relationship between benefit offers, wages and the skill
distribution of a firm’s workforce, while controlling for turnover.
C. What is the impact on firm outcomes?
If benefits play an important role in firms’ compensation strategies, there ought to be
measurable effects on firm outcomes such as productivity, firm growth, and survival. Such
effects may come about indirectly through changes in the recruitment and retention of labor. But
benefits may also affect productivity more directly by altering employees’ incentives to invest in
firm-specific knowledge or by reducing turnover and training costs (Even and Macpherson,
2001). There is little existing empirical evidence on the relationship between benefits offering
and productivity. One exception is work by Dorsey, Cornwell, and Macpherson (1998) using
Compustat data to estimate effects of DB plans on productivity using a production function
framework. They find evidence of higher labor productivity in firms with DB plans, but the
evidence on overall productivity effects is mixed.
Our empirical work adds to the scant evidence here by examining the relationship
between benefit offers, firm survival, and labor productivity. Our dataset has a number of key
advantages here. It enables us to directly examine the characteristics of a large sample of firms,
including those that are not publicly traded. We also have very rich data on the distribution of
employee characteristics and compensation that allow us to construct detailed controls for
workforce composition. The following section describes the construction of our database.
6

III. Data
We combine data from several sources to construct a very rich database. It consists of
business microdata on whether the business provided benefits, detailed benefit provisions,
workforce composition, turnover, the distribution of worker earnings, and labor productivity.
Much of this data is also longitudinal, allowing us to measure firm survival and to use detailed
controls for worker quality.
A. Dataset Construction
The database combines information from five sources:
• Firm reports on benefit plans offered to employees (the Internal Revenue
Service/Department of Labor Form 5500 file);
• The Census Bureau’s Business Register (BR);
• Unemployment Insurance (UI) wage record data from seven states;
• The Census Numident file; and
• The Economic Census.
Benefit information comes from the Form 5500 file that contains annual reports on
employee benefit plans that the sponsor (usually the employer) is responsible for filing. These
filings are required under ERISA for most types of tax-preferred benefits, with some exemptions
for small health plans, and are publicly available. In the results presented here we use data on
plans that end in 1997, drawing from the 1996 and 1997 data files.
The Form 5500 collects information about employer-provided pensions (defined benefit
and various types of defined contribution plans), ‘welfare’ plans (health, life, supplemental
unemployment, and disability insurance plans) and ‘fringe benefit’ plans (cafeteria or flexible
7
benefit plans and educational assistance plans).5 In addition to variables describing plan
features, the data also include name, address, and a federal Employer Identification Number
(EIN) for the plan sponsor. EINs are also used in a wide variety of other employer tax filings,
including those underlying the Census Bureau’s business list.
Figure 1 describes how the dataset is constructed. The 5500 file is first integrated with
Census’s Business Register using sponsor EINs. The BR is a list of all private establishments
with paid employment that is constructed from a variety of administrative and survey sources,
but its backbone is quarterly employment tax filings that include EINs. 6 Census uses the
quinquennial economic censuses and the annual Company Organization Survey in construction
the BR to break out different business locations that may be filed under a single EIN. Many
large firms file using more than one EIN, so these sources are also used, in combination with
administrative data, to identify different EINs that may be affiliated through parent-subsidiary
relationships.
5 See appendix Table A1 for a listing of the benefit plan types and the associated frequencies among 1997 plans in the 5500 files. 6 The BR was historically known as the Standard Statistical Establishment List or SSEL. An establishment is defined as a single physical location where business is conducted or where services or industrial operations are performed.
8
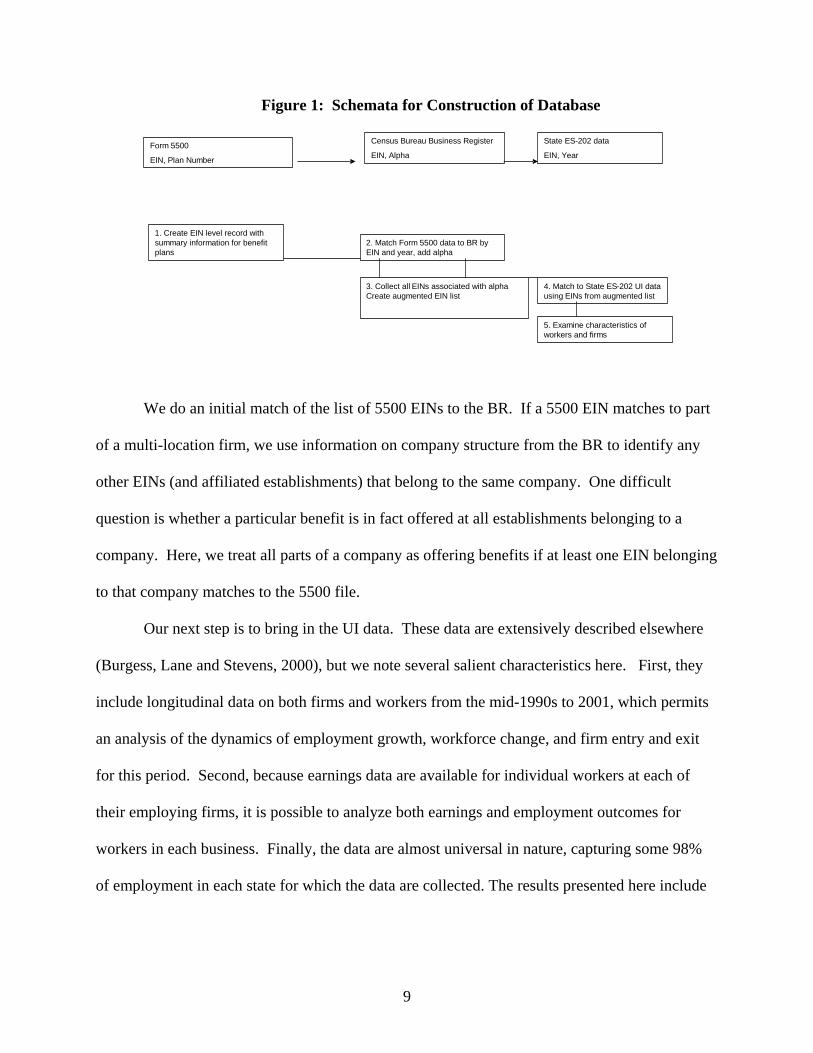
Figure 1: Schemata for Construction of Database
Form 5500 EIN, Plan Number
Census Bureau Business Register
EIN, Alpha
State ES - 202 data EIN, Year
1. Create EIN level record with summary information for benefit plans 2. Match Form 5500 data to BR by
EIN and year, add alpha
3. Collect all EINs associated with alphaCreate augmented EIN list
4. Match to State ES - 202 UI data using EINs from augmented list
5. Examine characteristics of workers and firms
We do an initial match of the list of 5500 EINs to the BR. If a 5500 EIN matches to part
of a multi-location firm, we use information on company structure from the BR to identify any
other EINs (and affiliated establishments) that belong to the same company. One difficult
question is whether a particular benefit is in fact offered at all establishments belonging to a
company. Here, we treat all parts of a company as offering benefits if at least one EIN belonging
to that company matches to the 5500 file.
Our next step is to bring in the UI data. These data are extensively described elsewhere
(Burgess, Lane and Stevens, 2000), but we note several salient characteristics here. First, they
include longitudinal data on both firms and workers from the mid-1990s to 2001, which permits
an analysis of the dynamics of employment growth, workforce change, and firm entry and exit
for this period. Second, because earnings data are available for individual workers at each of
their employing firms, it is possible to analyze both earnings and employment outcomes for
workers in each business. Finally, the data are almost universal in nature, capturing some 98%
of employment in each state for which the data are collected. The results presented here include
9

data for seven states (California, Illinois, Florida, Minnesota, Maryland, North Carolina and
Texas).
Although the UI wage record data are very rich in terms of sample size and coverage,
they lack demographic information on workers. Limited demographic information is provided
by matching the UI records with internal administrative records (the Census Numident file) that
have information on date of birth, place of birth, race and sex for all workers. About 96 percent
of the records in each state’s UI wage data can be matched to this source.7
In addition, LEHD researchers (see Abowd, Lengermann, and McKinney, 2002,
henceforth ALM) have estimated fixed effects for individual firms and workers based on the
following wage equation:
(1) ln (wijt) = xitβ + θi + ψ
j(i,t) + εijt
where j(i,t) indexes the firm j for which worker i works at time t. Ln (wijt) represents the log of
full-time earnings, so the fixed effects are in terms of log earnings differences. For each worker
i, this decomposition provides a measure of the fixed, portable component of their skill (2i), and
for each firm j, it provides a measure of the fixed premium (or discount) that the firm pays after
accounting for worker skills (ψj(i,t)).
In our empirical results we use the following as a measure of general human capital:
(2) hit = xitβ + θi
where xit consists of race, gender, and quarters of work experience. As described in ALM, a
seven-state distribution of hit was created and individual workers were classified as low-skill or
high-skill depending on their location in this distribution. Summary level statistics for firms
7 See Staff of the LEHD Program (2002) for further discussion.
10

were created by calculating the percentage of workers at each firm that belonged to each quartile
of the overall human-capital distribution.
Finally, we bring in measures of labor productivity based on data from the 1997
Economic Census (EC). We measure labor productivity as the logarithm of sales per employee
deviated from the 2-digit industry mean. For multi-unit firms, we aggregate establishment-level
data from the EC to the state-EIN-2 digit SIC level before matching to the 5500/UI data. For
each multi-unit firm we define a primary SIC by aggregating payroll across establishments
within a state that have the same 2 digit SIC code, and then taking the SIC code associated with
the largest aggregated payroll.
B. Data Coverage Issues – 5500/Business Register Match
In the results that follow, we use the presence of a matching record in the 5500 file as an
indicator that a firm offers benefits and then use additional information from the file to determine
what sorts of benefits are offered. Whether these are reasonably accurate measures depends first
on the filing requirements for the Form 5500—do all plans in fact appear in that file?—and
secondly on our success in matching employers to the file if the plan they offer is in fact in it.
Filing requirements differ somewhat for pensions and other types of plans (welfare or
fringe benefit plans). For pensions, only church plans and certain types of plans for small
employers and the self-employed are exempt from the requirement to file.8 Pension plans with
fewer than 100 participants are generally required to file, but are required to provide less
8 Simplified Employee Pension (SEP) plans are exempt, as are Savings Incentive Match Plans for Employees (SIMPLE) if they take the form of an IRA (but not SIMPLE 401(k) plans). Both plans can be used only by employers with at most 100 eligible employees. SEP plans do not allow for employee contributions, and employer contributions must be a fixed percentage of pay up to a maximum.
11

information than larger plans. Small welfare and fringe plans with fewer than 100 participants
are not required to file if they are either unfunded (that is, the employer pays the costs out of
general funds) and/or fully insured through an insurance provider (for example a Blue
Cross/Blue Shield company). Hence small non-pension plans are only required to file if they are
self-insured, and since self-insurance rates are fairly low among small health insurance plans,9
most small health plans are probably not included in the 5500 file. Because we focus here on
benefits in general, the coverage gap is more narrowly for small health plans offered by
employers who do not offer pensions.
For most plans, employer and sponsor are one and the same. In these cases, Form 5500
provides the employer EIN and integration with the BR is straightforward. However, plans that
involve multiple employers present more challenges. For example, Taft-Hartley plans are
sponsored by trade unions—generally in occupations where employers have few employees and
workers often change employer without changing occupation, such as electricians or truck
drivers. Typically union labor contracts for workers covered by these plans would require an
employer to pay a certain amount per hour into the plan, and workers would have some ability to
maintain the same coverage while between jobs, as well as from one job to the next. These plans
must file a Form 5500, but the EIN associated with such a plan belongs to the trade union rather
than to any particular employer. Taft-Hartley plans are used with some frequency in
construction, trucking, garment manufacturing, and grocery stores (Weinstein and Wiatrowski,
1999). While we know something about which industries are most affected, we cannot identify
9 In 1997 among firms with fewer than 100 employees, 14.7% of establishments that offered health insurance self-insured at least one plan. (1997 Employer-Sponsored Health Insurance Data. Private-Sector Data by Firm Size, Industry Group, Ownership, Age of Firm, and Other Characteristics. July 2002. Agency for Healthcare Research and Quality, Rockville, MD. http://www.meps.ahrq.gov/mepsdata/ic/1997/index197.htm)
12

which employers are involved with our current resources. The challenge here is to develop a
method to identify participating employers, a task we are still working on. However, we can
identify these types of plans in the 5500 file using codes that indicate entity type for the plan
sponsor.
Table 1 Form 5500 Sponsor Entity Type
Plan entity code Frequency Percent Participants
Single-employer plan (A) 931,942 86.9% 117,475,092Plan of controlled group of corporations or common control employers (B) 82,014 7.7% 114,822,479Multiemployer plan (C) 4,787 0.5% 13,409,018Multiple-employer-collectively bargained plan (D) 2,765 0.3% 3,355,663Multiple-employer plan, other, (E) 6,930 0.7% 10,261,465Group insurance arrangement (of welfare plans), (F) 24,165 2.3% 12,821,720Missing (M or blank) 19,417 1.8% ---
Total 1,072,020 100.0% 272,145,437
Table 1 gives the distribution of entity codes for plans ending in 1997. We include
summed participation numbers by entity code as well to give some idea of the importance of
these coverage problems.10 However, a single entity can have multiple plans with overlapping
participation (e.g. health and pension, or both a defined benefit and a 401(k) plan), so double
counting is an issue. Plans with entity codes of C and D would include Taft-Hartley plans, so we
drop those plans in what follows.11 Based on published tabulations, Taft-Hartley plans account
10 There are 267,077 plan records that do not have participation numbers, 77% of which are ‘Fringe benefit’ plans for which participation is not asked. 11 We do end up with some firms that match to plans with those codes because they match to other plans as well.
13
for approximately 9 percent of active pension plan enrollment for 1997.12 ‘Group insurance
arrangements’ present a similar problem in that these plans appear on the 5500 file, but the EIN
would link to the sponsoring organization (e.g. a trade association) rather than to the employers
involved.
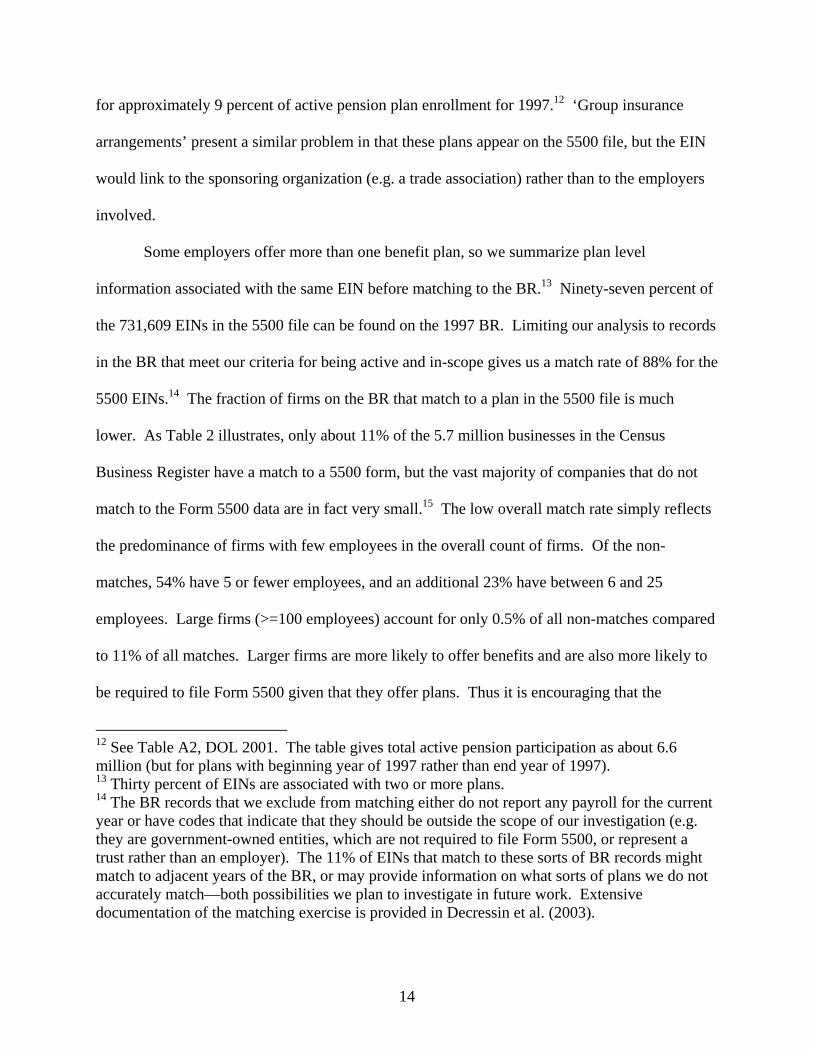
Some employers offer more than one benefit plan, so we summarize plan level
information associated with the same EIN before matching to the BR.13 Ninety-seven percent of
the 731,609 EINs in the 5500 file can be found on the 1997 BR. Limiting our analysis to records
in the BR that meet our criteria for being active and in-scope gives us a match rate of 88% for the
5500 EINs.14 The fraction of firms on the BR that match to a plan in the 5500 file is much
lower. As Table 2 illustrates, only about 11% of the 5.7 million businesses in the Census
Business Register have a match to a 5500 form, but the vast majority of companies that do not
match to the Form 5500 data are in fact very small.15 The low overall match rate simply reflects
the predominance of firms with few employees in the overall count of firms. Of the non-
matches, 54% have 5 or fewer employees, and an additional 23% have between 6 and 25
employees. Large firms (>=100 employees) account for only 0.5% of all non-matches compared
to 11% of all matches. Larger firms are more likely to offer benefits and are also more likely to
be required to file Form 5500 given that they offer plans. Thus it is encouraging that the
12 See Table A2, DOL 2001. The table gives total active pension participation as about 6.6 million (but for plans with beginning year of 1997 rather than end year of 1997). 13 Thirty percent of EINs are associated with two or more plans. 14 The BR records that we exclude from matching either do not report any payroll for the current year or have codes that indicate that they should be outside the scope of our investigation (e.g. they are government-owned entities, which are not required to file Form 5500, or represent a trust rather than an employer). The 11% of EINs that match to these sorts of BR records might match to adjacent years of the BR, or may provide information on what sorts of plans we do not accurately match—both possibilities we plan to investigate in future work. Extensive documentation of the matching exercise is provided in Decressin et al. (2003).
14
majority of large firms in the Business Register can be matched to a Form 5500 filing. Because
of filing exemptions and difficulties in matching, we expect coverage to be incomplete for small
firms and in industries with large numbers of Taft-Hartley plans. For this reason, in some of
what follows we present results for only manufacturing or wholesale (industries with little Taft-
Hartley coverage) or only for firms with at least 100 employees.
Table 2 Business Register Match Rates
Single Unit Firms Multi-Unit Firms All Firms Number of employees Number Match rate Number Match rate Number Match rate Missing or 0 16 955,116 1.5% 2,878 15.9% 957,994 1.5% 1 – 5 2,920,703 4.6% 10,593 16.3% 2,931,296 4.6% 6 – 50 1,541,347 19.6% 106,287 42.0% 1,647,634 21.1% 51 - 100 80,890 49.3% 31,042 65.3% 111,932 53.7% 101 - 250 35,040 61.0% 26,723 74.2% 61,763 66.7% 251 - 750 8,346 65.4% 14,957 82.7% 23,303 76.5% 751 + 1,778 73.1% 9,089 90.5% 10,867 87.7%
Total 5,543,220 9.4% 201,569 53.3% 5,744,789 10.9%
If we weight these match rates by employment, firms that match to the 5500 file employ
about 66% of all workers (69 million out of the 107 million in the 1997 workforce). Among
multi-units the match rate is even higher: 89% of workers are employed by matching firms,
compared with 35% for single-unit firms.
15 Tables A2, A3, and A4 in the Appendix show match rates weighted by employment, match rates by industry, and match rates by firm age. 16 Employment data on the BR come primarily from filings of IRS Form 941, which is used to report quarterly withholding of payroll and income taxes. Businesses are also asked to report employment on these forms, but the employment data are not as complete as the payroll data. We include only firms with positive payroll in the table (and the match), but some of these firms do not report any employment. This could be because the employment question asks about a particular week in the quarter and the firm had no employees on the payroll that week, or it may be that firms neglected to report employment, which is not directly tied to the tax liability.
15
Table 3 gives the distribution of type of plans matched among firms that match to at least
one plan. A very large share of firms with some sort of matched benefit offer a pension plan,
regardless of size. This probably reflects the fact that coverage of benefits by Form 5500 filings
is most complete for pensions. The most notable size effect is for health plans, for which the
percent offering a health plan is substantially larger for firms with greater than 100 employees.
This appears to reflect in part the exemption from filing for health plans with fewer than 100
enrollees.
Table 3 Types of Plans Found for Matched Employers, by Firm Size Number of employees Pension Health Other fringe 1 – 50 87% 2% 24% 51 – 100 85% 7% 52% 101 – 250 86% 28% 55% 251 – 750 88% 57% 59% 750 + 92% 80% 72% Total 87% 7% 30%
Comparing benefit coverage rates implied by our matched data to national survey
estimates suggests that we do quite well in matching pension coverage but that we understate
health coverage by even more than we would have expected. In our data, 61 percent of
employees work for businesses that offer pension benefits, while 34 percent work for businesses
that offer health benefits. Survey data from 1999 indicate that 48 percent of all employees
participate in a retirement plan.17 This figure excludes employees who have not met minimum
length of service requirements or who have opted out of making any required employee
17 It is difficult to put together a comparable total coverage number for pension benefits for 1997 for a couple of reasons. Prior to 1999, the BLS survey that collected data for benefits estimates (the Employee Benefit Survey) surveyed small and medium/large employers in alternating years.
16

contribution, and so would be expected to be somewhat below our estimate, which implicitly
includes them.
In contrast, a 1997 survey estimated that 86 percent of employees work for
establishments that offer health benefits—more than twice our figure.18 We expect to understate
health coverage somewhat given that certain small health plans are not required to file, but the
difference seems too large for that to be the only problem. At the same time, we seem to find too
much coverage under plans classified by sponsors as ‘Fringe benefit’ plans on the Form 5500.
This should include only Section 125 cafeteria plans (flexible benefit, reimbursement, and
premium conversion plans) and non-job-related education benefit plans (under Section 127 of the
tax code). We find that 36 percent of employees work for firms offering plans classified in this
way, while 1999 survey estimates imply that 28 percent of employees have access to Section 125
plans and only 10 percent have access to non-work related educational assistance (and
presumably there is considerable overlap in those types of benefits). Because we think that some
health insurance plans may appear in the 5500 files as ‘Fringe benefit’ plans, we focus our
estimates on the more general question of whether an employer offers some form of fringe
benefits, rather than a particular type of benefit plan.
C. Sample Characteristics
While we match the 5500 data to Census’s Business Register as a whole, most of our
empirical work is based on the subset of those data for which we also have LEHD data. Before
proceeding with our results, we briefly describe the differences in samples. One difference
Also, estimates are published separately for full-time and part-time employees. The 1999 figures cited for pensions and other fringe benefits are from www.bls.gov/ncs/ebs/sp/ebnr0006.pdf. 18 See www.meps.ahrq.gov/MEPSDATA/ic/1997/Tables_I/TIB2.pdf.
17
between the overall 5500/BR sample and that used for our results is simply that we have data for
seven states rather than 51. Thus we have data for parts of firms that operate across multiple
states, and no data for firms that operate only in other states. As explained in ALM, human-
capital summary statistics are only created for firms with at least 5 employees, due to the
difficulty of applying kernel density estimation techniques for calculating distributions to firms
of very small sizes. Our regressions all make use of these wage decompositions, so we further
restrict our sample to firms having at least 5 employees. In addition, we do some of our
productivity analyses on the subset of firms that also appear in the Annual Sample of
Manufacturing (ASM) from which we derive measures of capital intensity.
Table 4 gives sample statistics for each of these samples. Clearly the most dramatic
difference across samples is in the fraction of small firms. There is also a concomitant increase
in the fraction offering benefits and in the firm component of wages.
Table 4 Characteristics of Alternative Samples
Data required
Sample characteristics 5500/BR 5500/BR and HC estimates
5500/BR/HC and ASM
Sample size 5,744,789 396,582 10,536 Firm size: <5 employees 62.5% --- ---
5-99 employees 35.8% 92.1% 58.4% 100-999 employees 1.6% 7.3% 37.2% 1000+ employees 0.1% 0.6% 4.4%
Offer benefits 10.9% 34.5% 66.4% Relative labor productivity --- .037 .323 Mean firm effect R --- -.109 .081 Churning rate --- 32.2% 21.9
18

The last row gives mean churning rates, which measure the rate of accessions and separations
that occur at a firm over one quarter, above and beyond those needed to allow for the firm’s net
growth or shrinkage over that period.19
IV. Results
Recall that our goal in this paper is to better understand the relationship between a firm’s
decision to offer benefits and firm outcomes, and to investigate whether that relationship occurs
mostly through benefits’ effects on workforce composition. In doing so, we assume that a match
to the 5500 file is a reasonably accurate indicator that a firm offers employees benefits.20 We
begin by briefly comparing the characteristics of firms that offer benefits with those that do not.
That is followed by an examination of the relationship between wages and benefits and
workforce characteristics, and finally our direct results on benefits and firm outcomes.
A. What Kind of Firms Offer Benefits?
Our comparisons of matched and non-matched data from the combined 5500/BR file
basically confirm results found in the previous literature: a) Larger firms (both those with more
employees and those with more establishments) are more likely to offer benefits (as shown
19 The formula used is (|A+S| - |E-B|) / ((B+E)/2), where A=accessions, S=separations, B=employment at the beginning of the quarter, and E=employment at the end of the quarter. 20 We know that this benefits measure includes some measurement error, and have documented in section III that the primary error is to misidentify some small firms that do not offer a pension plan as not offering any benefits when in fact they offer a health plan but are not required to file a Form 5500. Where we simply present differences in means, the misclassification should bias the estimated differences towards zero. It likely biases our regression estimates as well, but the direction of the biases are less clear because the misclassifications is clearly correlated with size and likely correlated with other explanatory variables as well. We think it unlikely that this measurement error is the primary driver of our findings, and so we think they remain interesting as indicators of the relationship of interest even if the size of effects may be less clear.
19

earlier in Table 2). b) There is substantial inter-industry variation in rates of benefit offering,
with manufacturing and wholesale trade having the highest rates, and agriculture, retail trade and
construction having the lowest (see Table A3). An unsurprising but less established result is that
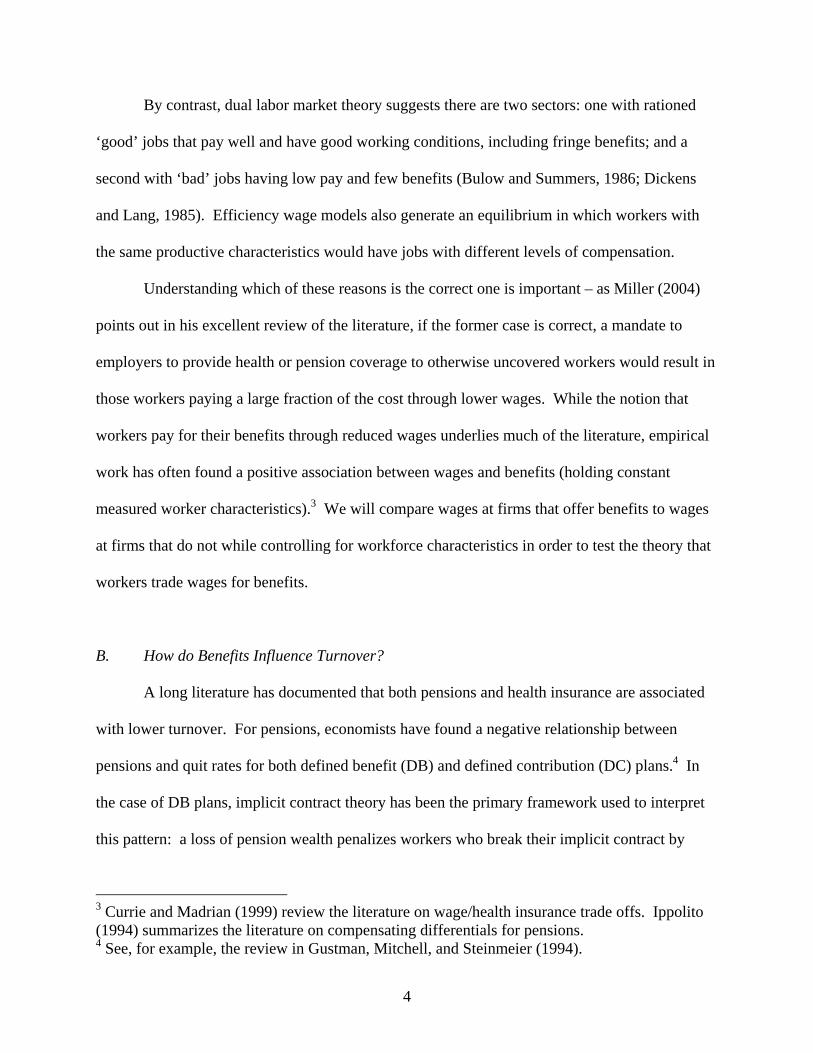
older firms are more likely to offer benefits (see Table A4). Firm age and size are correlated, but
Figure 2 illustrates that the age effect is not simply a function of firm size: within firm size
categories, older firms are still more likely to offer benefits. Regression results (not reported
here) confirm that firm size, industry, and age all influence the likelihood of offering benefits,
though the largest effects are attributed to size.
Figure 2: Benefit Coverage by Age and Size of Firm
0%
10%
20%
30%
40%
50%
60%
70%
80%
90%
< 5 years old 5 to <10 years 10 to <15 years 15 to <20 years
Age of Firm
% o
f Cat
egor
y O
ffer
ing
Ben
efits
1 - 5 employees6-100 employees100+ employees
20

B. What is the Relationship between Benefits and Pay?
Bringing in the LEHD State UI/ES-202 data in addition to the 5500/Business Register
data allows us to examine the relationship between benefits, pay, and workforce composition in
some detail, which we do in Tables 5-8.21 As shown in the first row of Table 5 below, average
earnings at benefit offering firms are almost twice those in non-benefit offering firms. Prior
work has established that at least some of this is due to having a more skilled workforce.
Because the ALM wage decomposition includes firm as well as individual worker effects, we
have direct estimates of the component of wages paid by a firm that is due to firm-specific
characteristics (ΨJ(i,t)) after accounting for all fixed worker characteristics.
Table 5 Benefits and Pay
Averages across firms Benefit Providing
Firms Non-Benefit-
Providing Firms
Average earnings per worker $8,719 $4,598
Firm wage effect ΨJ(i,t) 0.063 -0.20
The second row of Table 5 shows that benefit providing firms in fact pay more on
average even after accounting for the composition of their workforces. The firm fixed effect
shows that the premium paid by benefit providing firms is about .06 log points, compared with
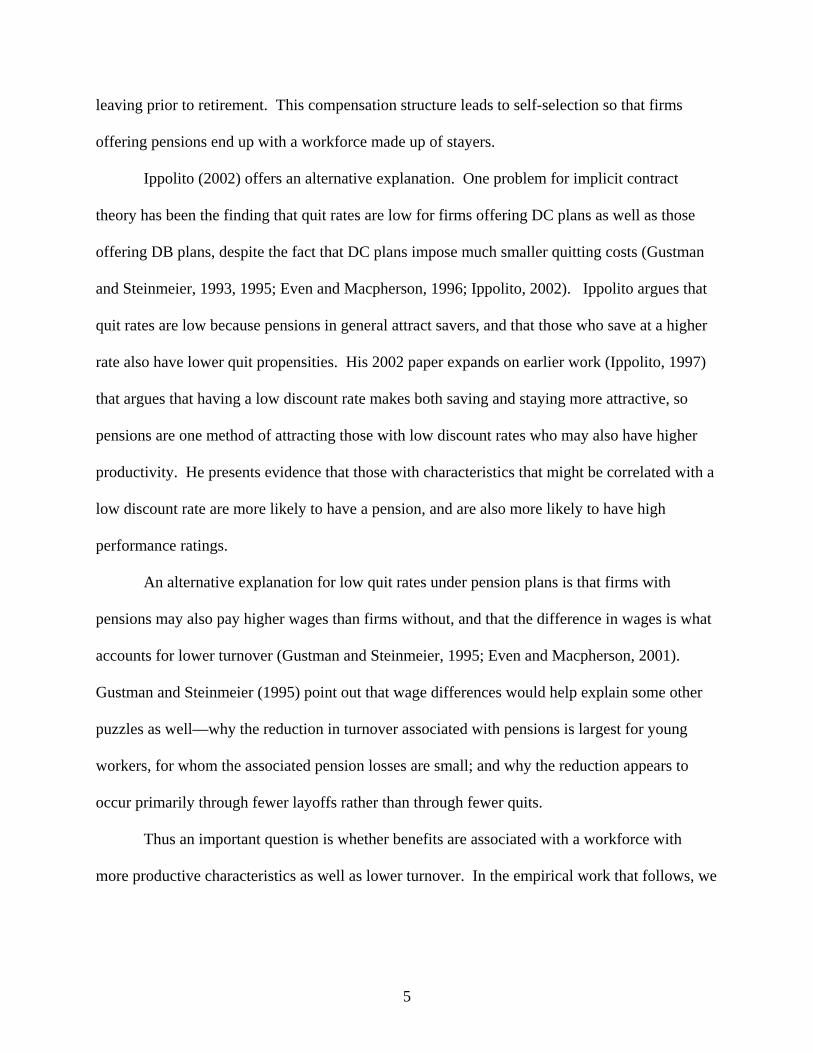
-.20 points for non-benefit providing firms—a difference of about 25 percent. Figure 3 graphs
the distribution of firm fixed effects by benefit status for a more homogeneous group of firms:
large manufacturers. Clearly, the distribution of wage premia for benefit providing firms is
substantially to the right of that for non-benefit providing firms. That is, even after accounting
for fixed individual heterogeneity, firms that provide benefits also tend to pay higher wages.
21 Appendix Table A5 gives some additional sample statistics by benefit status.
21
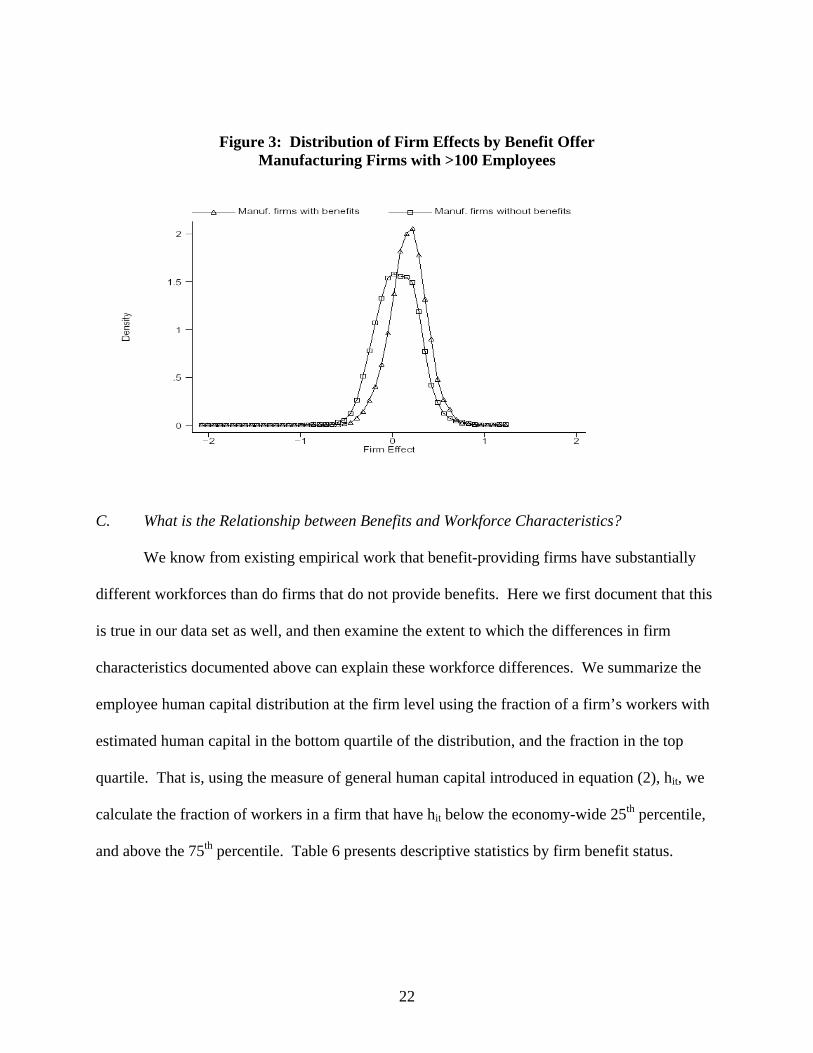
Figure 3: Distribution of Firm Effects by Benefit Offer Manufacturing Firms with >100 Employees
C. What is the Relationship between Benefits and Workforce Characteristics?
We know from existing empirical work that benefit-providing firms have substantially
different workforces than do firms that do not provide benefits. Here we first document that this
is true in our data set as well, and then examine the extent to which the differences in firm
characteristics documented above can explain these workforce differences. We summarize the
employee human capital distribution at the firm level using the fraction of a firm’s workers with
estimated human capital in the bottom quartile of the distribution, and the fraction in the top
quartile. That is, using the measure of general human capital introduced in equation (2), hit, we
calculate the fraction of workers in a firm that have hit below the economy-wide 25th percentile,
and above the 75th percentile. Table 6 presents descriptive statistics by firm benefit status.
22

Table 6 Workforce Characteristics by Benefit Offer
Benefit-Providing
Firms Non-Benefit-
Providing Firms Worker characteristics % in top quartile of human capital distribution 31.5% 21.3% % in bottom quartile of human capital distribution 20.8% 31.7% % female 47.2% 48.1% % foreign-born 13.4% 18.5% % white 75.8% 68.7% % prime age (25-55) 75.7% 68.5% Churning rate 22.4% 37.3% Notes: These measures exclude firms with <5 employees.
Clearly firms that offer benefits on average employ fewer low skill workers and more
high skill workers. Interestingly, the mean fraction of workers in the middle part of the
distribution (25th-75th percentiles) is quite similar for the two groups—48% versus 47%—though
this may mask differences within that broad range. Another striking difference is that firms that
offer benefits have much lower rates of labor churning. Workforce turnover, above that needed
to accommodate growth or shrinkage of the firm, averages 22 percent for benefit-providing
firms, compared to 37 percent for those not providing benefits.
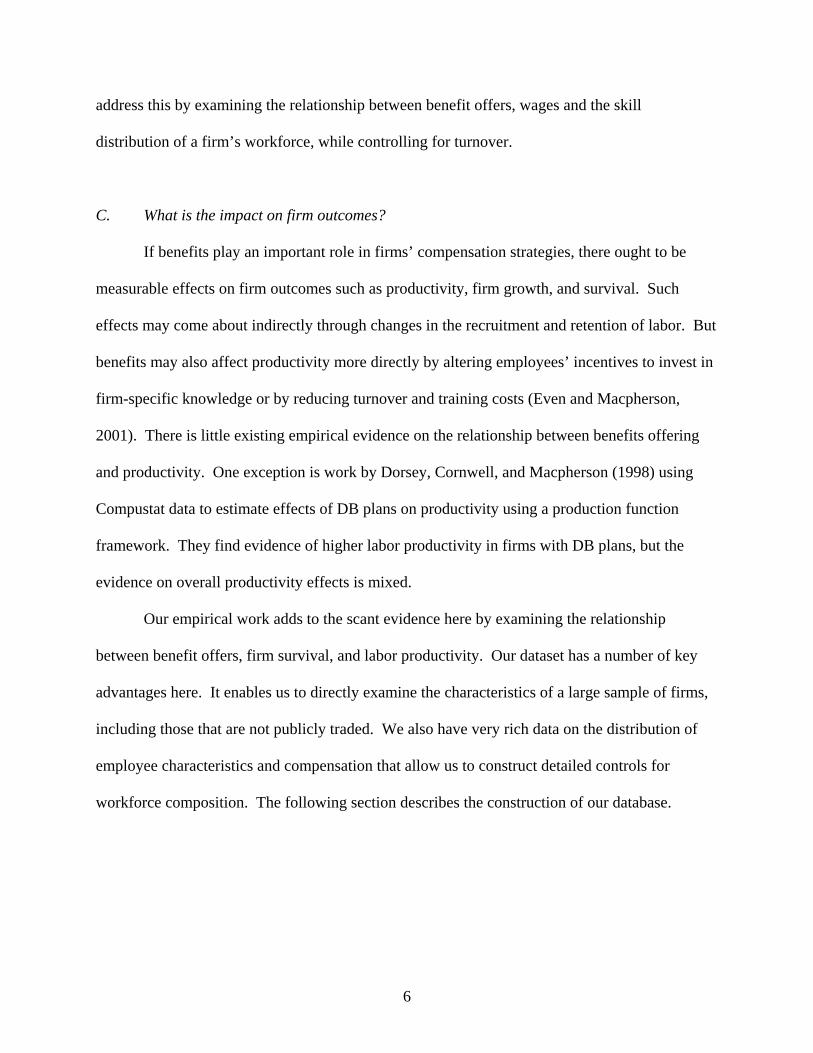
Figure 4 gives more detail on the variation in employment at the low end of the human
capital distribution, looking at a narrower sample of large manufacturing firms for which we are
likely to have a quite complete measure of benefits. A comparison of the two density plots
makes even clearer that benefit providing firms employ relatively few workers at the low-skill
end of the distribution – few have more than 25% of the workforce that is low skill.
23
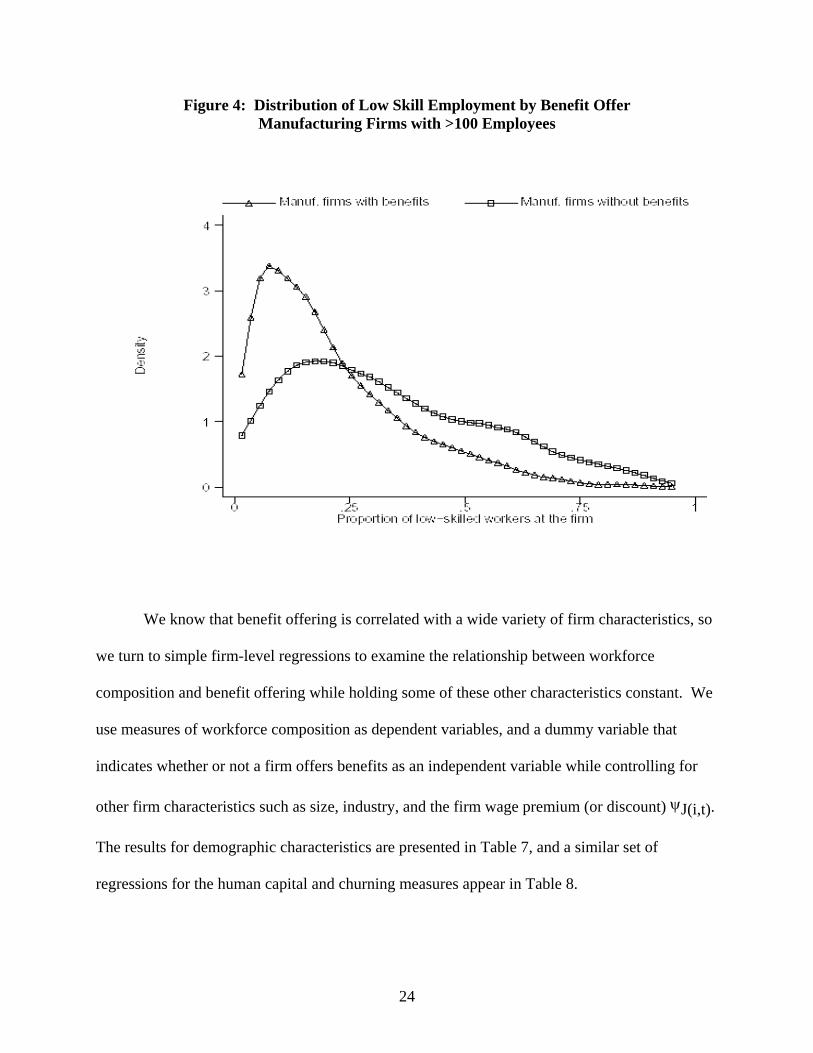
Figure 4: Distribution of Low Skill Employment by Benefit Offer Manufacturing Firms with >100 Employees
We know that benefit offering is correlated with a wide variety of firm characteristics, so
we turn to simple firm-level regressions to examine the relationship between workforce
composition and benefit offering while holding some of these other characteristics constant. We
use measures of workforce composition as dependent variables, and a dummy variable that
indicates whether or not a firm offers benefits as an independent variable while controlling for
other firm characteristics such as size, industry, and the firm wage premium (or discount) ψJ(i,t).
The results for demographic characteristics are presented in Table 7, and a similar set of
regressions for the human capital and churning measures appear in Table 8.
24

The regression results generally confirm the differences in means reported in Table 6.
Firms that offer benefits have significantly more white workers and more prime-age workers, but
fewer foreign-born workers. The overall differences in race and immigrant status are similar in
size to the regression-adjusted mean differences. However, prime age workers work for firms
that pay more in general and also work in industries that are more likely to offer benefits, so the
adjusted difference is smaller than the overall difference for this measure. While there is little
difference in mean percent female in Table 6, the regression results show that women are slightly
more likely to work for benefit-offering firms after adjusting for other firm characteristics.
Women tend to work for firms that pay lower wages to all of their workers, but given their level
of pay, are more likely to offer benefits.
Table 8 confirms the mean differences in skill levels associated with benefit offering.
The sample means show a 10 percent difference in employment of those in the top quartile of the
human capital distribution; using regression to adjust for differences in firm characteristics
results in about an 8 percent difference. Similarly, the difference in employment of workers in
the bottom quartile of the skill distribution changes only slightly after adjusting for industry, size,
and the firm wage effect. The overall mean difference in churning rates is partially accounted
for by differences in firm pay, dropping the mean difference from about .15 to .09.
25
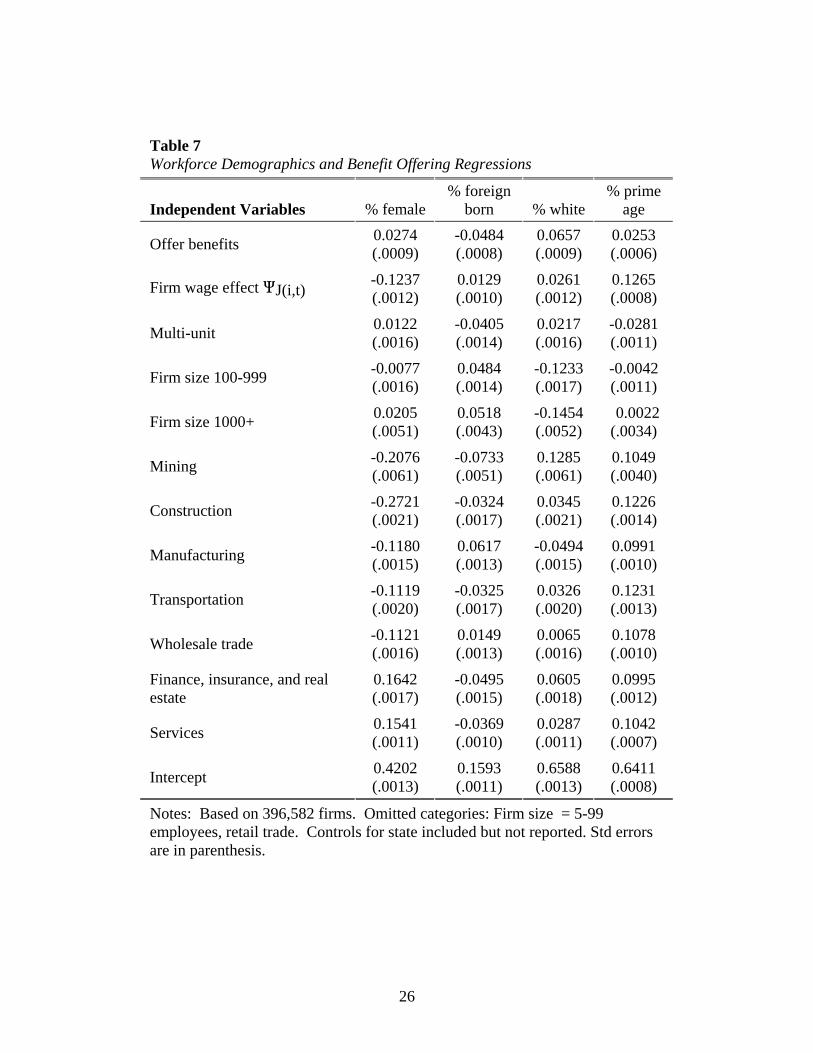
Table 7 Workforce Demographics and Benefit Offering Regressions
Independent Variables % female % foreign
born % white % prime
age
Offer benefits 0.0274 (.0009)
-0.0484 (.0008)
0.0657 (.0009)
0.0253 (.0006)
Firm wage effect QJ(i,t) -0.1237 (.0012)
0.0129 (.0010)
0.0261 (.0012)
0.1265 (.0008)
Multi-unit 0.0122 (.0016)
-0.0405 (.0014)
0.0217 (.0016)
-0.0281 (.0011)
Firm size 100-999 -0.0077 (.0016)
0.0484 (.0014)
-0.1233 (.0017)
-0.0042 (.0011)
Firm size 1000+ 0.0205 (.0051)
0.0518 (.0043)
-0.1454 (.0052)
0.0022 (.0034)
Mining -0.2076 (.0061)
-0.0733 (.0051)
0.1285 (.0061)
0.1049 (.0040)
Construction -0.2721 (.0021)
-0.0324 (.0017)
0.0345 (.0021)
0.1226 (.0014)
Manufacturing -0.1180 (.0015)
0.0617 (.0013)
-0.0494 (.0015)
0.0991 (.0010)
Transportation -0.1119 (.0020)
-0.0325 (.0017)
0.0326 (.0020)
0.1231 (.0013)
Wholesale trade -0.1121 (.0016)
0.0149 (.0013)
0.0065 (.0016)
0.1078 (.0010)
Finance, insurance, and real estate
0.1642 (.0017)
-0.0495 (.0015)
0.0605 (.0018)
0.0995 (.0012)
Services 0.1541 (.0011)
-0.0369 (.0010)
0.0287 (.0011)
0.1042 (.0007)
Intercept 0.4202 (.0013)
0.1593 (.0011)
0.6588 (.0013)
0.6411 (.0008)
Notes: Based on 396,582 firms. Omitted categories: Firm size = 5-99 employees, retail trade. Controls for state included but not reported. Std errors are in parenthesis.
26
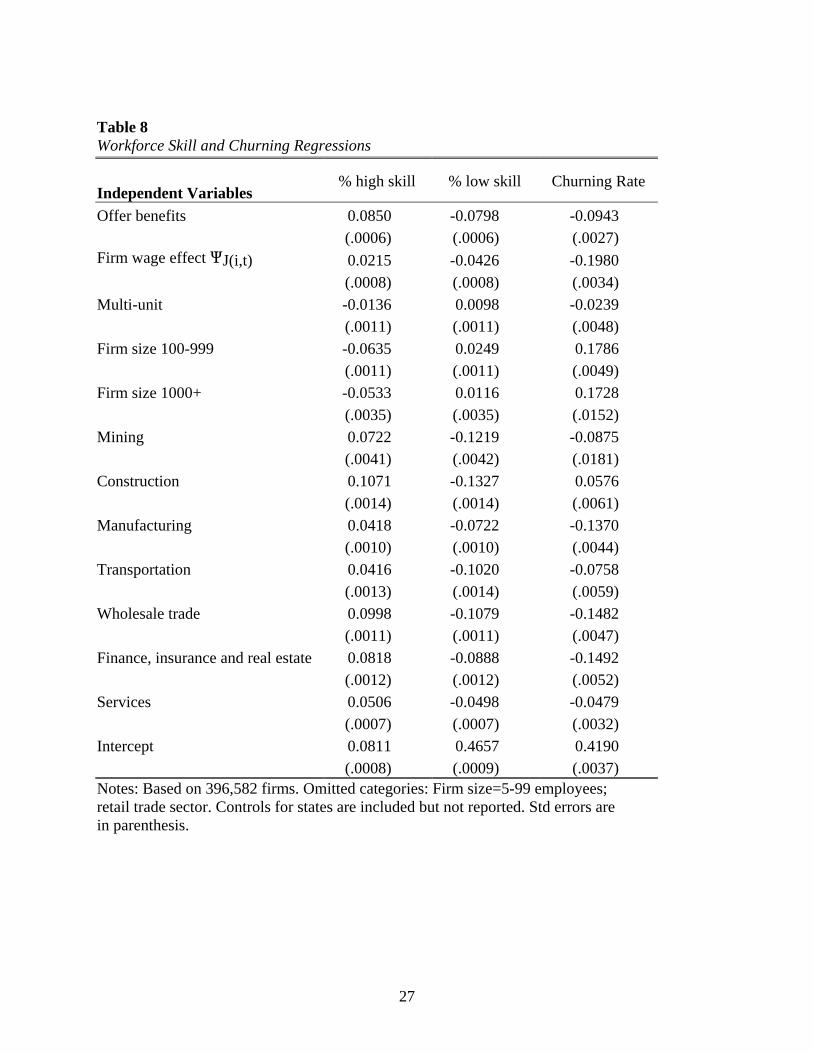
Table 8 Workforce Skill and Churning Regressions
Independent Variables % high skill % low skill Churning Rate
Offer benefits 0.0850 -0.0798 -0.0943 (.0006) (.0006) (.0027) Firm wage effect QJ(i,t) 0.0215 -0.0426 -0.1980 (.0008) (.0008) (.0034) Multi-unit -0.0136 0.0098 -0.0239 (.0011) (.0011) (.0048) Firm size 100-999 -0.0635 0.0249 0.1786 (.0011) (.0011) (.0049) Firm size 1000+ -0.0533 0.0116 0.1728 (.0035) (.0035) (.0152) Mining 0.0722 -0.1219 -0.0875 (.0041) (.0042) (.0181) Construction 0.1071 -0.1327 0.0576 (.0014) (.0014) (.0061) Manufacturing 0.0418 -0.0722 -0.1370 (.0010) (.0010) (.0044) Transportation 0.0416 -0.1020 -0.0758 (.0013) (.0014) (.0059) Wholesale trade 0.0998 -0.1079 -0.1482 (.0011) (.0011) (.0047) Finance, insurance and real estate 0.0818 -0.0888 -0.1492 (.0012) (.0012) (.0052) Services 0.0506 -0.0498 -0.0479 (.0007) (.0007) (.0032) Intercept 0.0811 0.4657 0.4190 (.0008) (.0009) (.0037) Notes: Based on 396,582 firms. Omitted categories: Firm size=5-99 employees; retail trade sector. Controls for states are included but not reported. Std errors are in parenthesis.
27
D. How are Benefits Related to Firm Outcomes?
What are the consequences for firms of offering benefits, given that providing benefits
has substantial effects on workforce composition, quality, and turnover? We examine two firm
outcomes, productivity and firm survival, to see if we find evidence that offering benefits is
associated with better firm outcomes. Because benefits are clearly not costless and do not appear
to be offset by reduced wages, we expect to find a positive association between benefits and
productivity. Productivity differences could, in turn, result in longer firm survival but do not
guarantee it.
1. Productivity
Table 9 presents our results on the relationship between productivity and benefits offers.
The dependent variable is the log of labor productivity deviated from a 2-digit industry specific
mean. The unit of observation is generally a firm/state record; that is, a multi-unit firm that
operates in several of the states for which we have data will have more than one record. Some of
the variables included are defined for the firm as a whole (whether or not benefits are offered,
firm size, multi-unit status, and firm age), while the others are generally measured within state.22
Our primary interest is in the coefficient on the benefits indicator, which is positive and
22 The level of aggregation is important only for multi-unit firms that have diverse operations within a state. Because of the computational resources needed to estimate the wage decomposition, our decisions about how to handle aggregation issues are in part driven by the availability of estimates originally generated for other projects. The labor productivity and capital measures are calculated at a state/EIN/2-digit SIC level, and then a single 2-digit SIC record is selected (if more than one exists) by taking the record with the highest payroll. The demographic and churning variables were handled similarly, except that the original measures were calculated at a state/EIN/1-digit SIC level. The human capital and firm effect variables are calculated at the state/EIN/2 digit SIC level. For these measures we use the observation with the highest employment because payroll is not available in these files.
28
significant in each of our specifications.23 Because the dependent variable is a log difference, the
coefficient on this variable in column 1 indicates that the productivity of firms that offer benefits
is on average .374 log points (or roughly 40%) higher than that of non-benefit-offering firms
with similar characteristics.
In column 2, we add controls for the firm’s distribution of worker human capital. The
first human capital variable gives the percent of the workforce with a worker fixed-effect in the
bottom quartile of the distribution; the second gives the percent in the top quartile.24 Both of
these variables have large, significant coefficients of the expected sign—productivity rises with
the fraction of workers in the more skilled parts of the distribution. Including these controls
reduces the benefits coefficient by about .07 log points, indicating that about a fifth of the
association between pay and benefits found in the first column is explained by this fairly simple
characterization of worker human capital. Note that we also include controls for average worker
demographics in each specification. The coefficients on gender, race and worker age are all of
the expected sign except in a few cases in which the coefficients are insignificant.25 The
coefficient on the percent foreign born is somewhat surprisingly large and positive in the overall
sample, but large and negative in manufacturing.
23 We recognize that there is substantial endogeneity in several of the right hand variables we use. The results are to be interpreted simply as establishing correlations rather than causality. 24 Note that in this specification, the omitted category is essentially the middle two quartiles of the distribution. 25 In all columns we control for differences in productivity associated with industry, firm size, firm age and state but do not report the coefficients. The firm size indicators that we include (100<=employment<=999, and employment>=1000, with omitted category 5-99) have insignificant coefficients in the overall specification, but are positive, significant, and increasing with size in the manufacturing subsample. Firms that are more than 5 years old have about 5 percent higher productivity in the overall sample, and about 10-15 percent higher productivity in manufacturing, but there differences between age groups among those older than 5 are generally not significant.
29
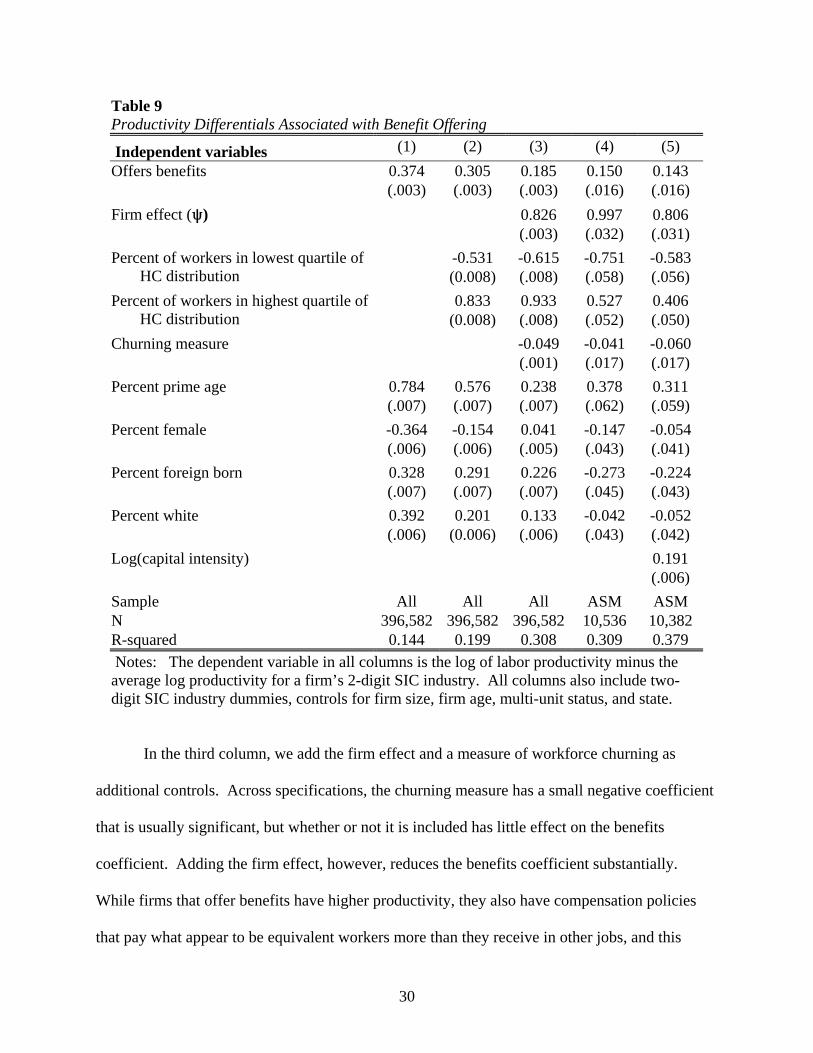
Table 9 Productivity Differentials Associated with Benefit Offering
Independent variables (1) (2) (3) (4) (5) Offers benefits 0.374 0.305 0.185 0.150 0.143 (.003) (.003) (.003) (.016) (.016) Firm effect (R) 0.826 0.997 0.806 (.003) (.032) (.031)
-0.531 -0.615 -0.751 -0.583 Percent of workers in lowest quartile of HC distribution (0.008) (.008) (.058) (.056)
0.833 0.933 0.527 0.406 Percent of workers in highest quartile of HC distribution (0.008) (.008) (.052) (.050)
Churning measure -0.049 -0.041 -0.060 (.001) (.017) (.017) Percent prime age 0.784 0.576 0.238 0.378 0.311 (.007) (.007) (.007) (.062) (.059) Percent female -0.364 -0.154 0.041 -0.147 -0.054 (.006) (.006) (.005) (.043) (.041) Percent foreign born 0.328 0.291 0.226 -0.273 -0.224 (.007) (.007) (.007) (.045) (.043) Percent white 0.392 0.201 0.133 -0.042 -0.052 (.006) (0.006) (.006) (.043) (.042) Log(capital intensity) 0.191 (.006) Sample All All All ASM ASM N 396,582 396,582 396,582 10,536 10,382 R-squared 0.144 0.199 0.308 0.309 0.379 Notes: The dependent variable in all columns is the log of labor productivity minus the average log productivity for a firm’s 2-digit SIC industry. All columns also include two-digit SIC industry dummies, controls for firm size, firm age, multi-unit status, and state.
In the third column, we add the firm effect and a measure of workforce churning as
additional controls. Across specifications, the churning measure has a small negative coefficient
that is usually significant, but whether or not it is included has little effect on the benefits
coefficient. Adding the firm effect, however, reduces the benefits coefficient substantially.
While firms that offer benefits have higher productivity, they also have compensation policies
that pay what appear to be equivalent workers more than they receive in other jobs, and this
30

component of pay has a very strong positive relationship to productivity, even when controlling
for workforce composition.26
The fourth and fifth columns present results for the subset of our overall sample that is
included in the 1997 Annual Survey of Manufactures. This sub sample is of interest because we
can construct measures of capital that are not available outside manufacturing.27 Column 4
includes the same controls as column 3—it is included to illustrate changes in coefficients that
are simply a result of the change in sample. The benefits coefficient tends to be somewhat
smaller in manufacturing, but in general the results do not look radically different. Adding our
measure of capital—the log of capital per worker, based on the book value of capital divided by
employment—has only a small effect on the benefits coefficient. Interestingly, it does reduce the
size of the coefficients on the human capital and firm effect variables, so greater capital intensity
does appear to account for some of the positive association found between worker skill and
productivity.
2. Firm Survival
The second firm outcome that we examine is firm survival. Do firms that currently offer
benefits have higher future survival rates, conditioning on other observable characteristics?
Addressing this requires exploiting the longitudinal data we have on firms for 1997 to 2001. A
26 The order in which we introduce the human capital and firm effect controls has little impact on the portion of the reduction in the benefits coefficient that we attribute to the different controls. 27 We can construct capital measures for a larger sample of manufacturing firms by also including those that are in the 1997 Economic Census of Manufacturing (CM) but not in the ASM. This adds a lot of smaller firms, as small establishments are sampled for the ASM while large establishments are included with certainty. The ASM sample is asked more detailed capital questions, and imputation is used for some components of capital in the sample added by including non-ASM cases. We have run the same sets of regressions for both manufacturing
31
firm is measured as having failed if it stops filing the UI records that underlie our human capital
estimates. We use a Cox proportional hazard model to estimate the probability of a firm failing
in the years after 1997, conditional on surviving until 1997, and include a dummy variable for
having offered benefits in 1997 to examine this relationship.28 In addition to benefits, we also
include controls for firm age as of 1997, industry, multi-unit status, firm size, and the fraction of
the workforce in the bottom and top quartile of the human capital distribution.
We present estimates for two different samples in Table 10. In the first three columns,
we estimate the model for all businesses, while in the last three we restrict our sample to firms
with at least 100 employees. Recall that for some types of benefits (primarily health plans)
sponsors are not required to file a Form 5500 if the plan has fewer than 100 enrollees, and thus
we measure benefits coverage less accurately for smaller firms, which are excluded in these
columns.
The second and third specifications for each sample differ from the first in that we add
first the firm effect (R) and then labor productivity to the initial specification. In all
specifications, we find a significant negative relationship between the provision of benefits and
the likelihood of post-1997 firm failure. Unsurprisingly, firm age also has a large and
consistently negative association with the likelihood of failure. Once age is controlled for, we
actually find a slightly positive effect of firm size on failure, though it becomes insignificant
when we drop small firms from our sample.
samples, and while the coefficients are somewhat different, the general conclusions we draw are not. 28 The Cox proportional hazard method controls for left truncation/delayed entry (firms being observed in 1997, but that were already in business before) by adjusting the log-likelihood function. Only the period of observation, 1997 and onward, is used in calculating the log-likelihood function.
32

Table 10 Hazard Estimates of the Relationship between Firm Death and Benefit Offering
Sample restrictions All Firms Firms with 100+ Employees
Independent variables (1) (2) (3) (4) (5) (6)
Benefit -0.248** -0.237** -0.201** -0.201** -0.224** -0.204** (.010) (.010) (.010) (.040) (.041) (.041)
100-999 Employees 0.090** 0.088** 0.065** (.018) (.018) (.018)
1000+ Employees 0.180** 0.178** 0.162* 0.032 0.032 0.033 (.067) (.067) (.068) (.070) (.070) (.070)
Multi-unit firm -0.062** -0.062** -0.059** -0.014 -0.011 0.003 (.017) (.017) (.017) (.036) (.036) (.036)
Firm age 5-<10 -0.423** -0.424** -0.422** -0.302** -0.298** -0.291** (.016) (.016) (.016) (.073) (.073) (.073)
Firm age 10-<15 -0.769** -0.770** -0.772** -0.320** -0.312** -0.307** (.023) (.023) (.023) (.083) (.083) (.083)
Firm age 15-<20 -1.164** -1.164** -1.174** -0.749** -0.741** -0.733** (.026) (.026) (.027) (.082) (.082) (.083)
Firm age 20+ -1.467** -1.468** -1.479** -0.956** -0.946** -0.939** (.025) (.025) (.025) (.072) (.072) (.072)
0.217** 0.210** 0.084** 0.098 0.338* 0.191 % in lowest HC quartile (.025) (.025) (.025) (.142) (.152) (.154)
-0.693** -0.693** -0.513** 0.172 0.131 0.239 % in highest HC quartile (.030) (.030) (.031) (.164) (.164) (.164)
Firm effect -0.064** 0.102** 0.290** 0.484** (.011) (.012) (.075) (.082)
Labor productivity -0.240** -0.177** (.008) (.026)
Number of obs (EIN-years) 377,469 377,469 377,469 23,955 23,955 23,955 Number of failures 66,838 66,838 66,838 3,937 3,937 3,937 Notes: Omitted categories are the smallest firm category (1-4 Employees for columns 1-3, 100-999 employees for columns 4-6) and the youngest firms (0-<5 years old in 1997). Regressions also include state and one digit SIC dummies. Std errors are in parenthesis. **P-value<.01; *P-value<.05
33

The human capital measures do not have such consistent effects. In the overall sample,
firms with more skilled workers generally have higher survival rates, though adding productivity
as a control reduces the size somewhat. However, in the sample with only larger firms, the
effects are generally not significant.
The firm effect, which captures firm pay differentials, is of particular interest. It has a
significant negative coefficient in the overall sample when productivity is not included, but has a
strong positive effect for all other specifications in which it is included. Interestingly, the
difference in the sign of that coefficient between columns 2 and 5 suggests that it is only among
small firms that those with higher average pay are more likely to survive. For both samples,
controlling for labor productivity results in a large positive coefficient on the firm effect:
holding productivity and workforce characteristics constant, higher average pay is associated
with higher rates of failure. Reassuringly, labor productivity has a strong negative effect on the
probability of failure.
E. Summary of Results
These results are, by and large, consistent with the literature in the findings that
firms that offer benefits are larger, older, and more likely to be in particularly types of industries
than firms that do not offer benefits. In addition, firms that offer benefits are more likely to have
white, male, older, and more stable workers – again consistent with the literature.
A major contribution of this section, however, is the finding that firms that offer higher
wages are also more likely to offer benefits – even controlling for workforce characteristics and
firm characteristics. In addition, firms that offer benefits are more likely to survive than firms
that do not – even after controlling for workforce and firm characteristics.
34

V. Summary We began by describing our match between the Form 5500 data and the Census Bureau’s
Business Register. Both our knowledge of the filing requirements for the Form 5500 and our
match statistics suggest that there are some problems with coverage of health insurance plans,
but that coverage of pension plans is good. Given that we have reasonable coverage from the
5500/BR matched data, we then bring in detailed measures of workforce composition based on a
further link to integrated employer-employee data coming primarily from unemployment
insurance records. We use this combined database to address three questions:
1. What are the differences between firms that provide benefits and firms that don’t, in both firm characteristics and compensation policies?
2. What is the relationship between workforce characteristics and benefits, holding constant firm characteristics and the firm’s wage premium?
3. What is the relationship between the provision of benefits, labor productivity, and subsequent firm survival?
Our first set of results confirmed findings from earlier work – firms that provide benefits
tend to be larger, older, and are more likely to be in manufacturing and wholesale trade.
However, we also found that firms that offered benefits paid their employees more than those
same employees would earn with the average non-benefit-offering firm—so workers appeared to
earn both higher wages and better benefits than did observationally equivalent workers who
worked for non-benefit offering firms. This is consistent with dual labor market or efficiency
wage models. However if firms that pay workers more do so because some firm-specific factor
makes them more productive in that match, one would expect that to show up in both wage and
benefits compensation, which could also explain this finding and is consistent with the positive
relationship we find between firm pay and productivity. We used new measures to confirm other
35

evidence that firms that offer benefits are better able to attract higher skilled, prime-age workers
and have lower turnover (after controlling for size and industry).
In our analysis of productivity differences across firms, we do find that both benefits and
the firm-specific component of pay are positively related to productivity. In looking at firm
outcomes, we also find that firms that offer benefits are less likely to fail–even after controlling
for all other observable characteristics–than are firms that do not offer benefits. Many
interpretations could be put on this. One is that of endogeneity—firms that are more likely to die
(either due to current financial problems, or perhaps because they are an inherently more risky
business) are less likely to offer benefits. This could either be as a way to cut down on current
costs, or because workers value benefits less when the risk of future default is higher.29 Another
possibility is that not enough firm-level controls were included.
29 87% of all firms that offer benefits offer at least one pension plan.
36

REFERENCES Abowd, John M., Paul A. Lengermann, Kevin L. McKinney. 2002. “The Measurement of
Human Capital in the U.S. Economy.” LEHD Technical Paper No. TP-2002-09, U.S. Census Bureau.
Abowd, John M., John Haltiwanger, Ron Jarmin, Julia Lane, Paul Lengermann, Kristin McCue,
Kevin McKinney, Kristin Sandusky. 2002. “The Relationship between Human Capital, Productivity, and Market Value: Building up from Micro Evidence.” LEHD Technical Paper No. TP-2002-14, U.S. Census Bureau.
Black, Dan 2000 “Family Health Benefits and Worker Turnover” in Employee Benefits And
Labor Markets In Canada And The United States William T Alpert; Stephen A Woodbury, eds, Kalamazoo, Mich. : W.E. Upjohn Institute for Employment Research
Bulow, Jeremy I. and Lawrence H. Summers. 1986. “A Theory of Dual Labor Markets with
Application to Industrial Policy, Discrimination, and Keynesian Unemployment.” Journal of Labor Economics, 4(3, part 1):376-414.
Burgess, Simon, Julia Lane, and David Stevens. 2000. “Job Flows, Worker Flows and Churning.”
Journal of Labor Economics, 18(3):473-502. Currie, Janet and Brigitte C. Madrian. 1999. “Health, Health Insurance, and the Labor Market.”
In Handbook of Labor Economics, Volume 3, O. Ashenfelter and D. Card, eds. Elsevier Science.
Decressin, Anja, Kristin McCue, and Martha Stinson. 2003. Describing the Form 5500-
Business Register Match. Technical Paper TP-2003-05, LEHD, U.S. Census Bureau. Dickens, William T. and Kevin Lang. 1985. “A Test of Dual Labor Market Theory.” American
Economic Review, 75(4): 792-805. Dorsey, Stuart, Christopher Cornwell, and David Macpherson. 1998. Pensions and Productivity.
W.E.Upjohn Institute. Ehrenberg, Ronald and Robert Smith. 1996, 6th edition. Modern Labor Economics: Theory and
Public Policy. Reading, MA: Addison-Wesley. Even, William E. and David A. Macpherson. 1996. “Employer Size and Labor Turnover: The
Role of Pensions.” Industrial and Labor Relations Review 49(4):707-728. Even, William E. and David A. Macpherson. 2001. “Benefits and Productivity.” Pension
Research Council Working Paper 2001-16. Even, William E. and David A. Macpherson. 2003. “Determinants and Effects of Employer
Matching Contributions in 401(k) Plans.” Mimeo. Florida State University.
37
Gustman, Alan L., Olivia S. Mitchell, and Thomas L. Steinmeier. 1994. “The Role of Pensions
in the Labor Market: A Survey of the Literature.” Industrial and Labor Relations Review 47(3):417-438.
Gustman, Alan L. and Thomas L. Steinmeier. 1993. “Pension Portability and Labor Mobility: Evidence from the SIPP.” Journal of Public Economics 50(2): 299-323.
Gustman, Alan L. and Thomas L. Steinmeier. 1995. Pension Incentives and Job Mobility.
Kalamazoo, Michigan: Upjohn Institute for Employment Research. Ippolito, Richard A. 1994. “Pensions and Indenture Premia.” Journal of Human Resources,
29(3): 795-812. Ippolito, Richard A. 1997. Pension plans and employee performance: Evidence, analysis and
policy. Chicago: University of Chicago Press. Ippolito, Richard A. 2002. “Stayers as ‘Workers’ and ‘Savers’: Toward Reconciling the
Pension-Quit Literature.” Journal of Human Resources, 37(2): 275-308. Miller, Richard D. 2004 “Estimating the Compensating Differential for Employer-Provided
Health Insurance” International Journal of Health Care Finance and Economics, 4, 27–41
Staff of the LEHD Program (2002). The Longitudinal Employer-Household Dynamics Program:
Employment Dynamics Estimates Project versions 2.2 and 2.3. Technical Paper TP-2002-05-rev1, LEHD, U.S. Census Bureau.
U.S. Department of Labor, Pension and Welfare Benefits Administration. Abstract of 1997
Form 5500 Annual Reports. Private Pension Plan Bulletin No. 10, Winter 2001, Washington, DC.
Weinstein, Harriet and William J. Wiatrowski. 1999. “Multiemployer Pension Plans.”
Compensation and Working Conditions, Spring 1999: 19-23.
38
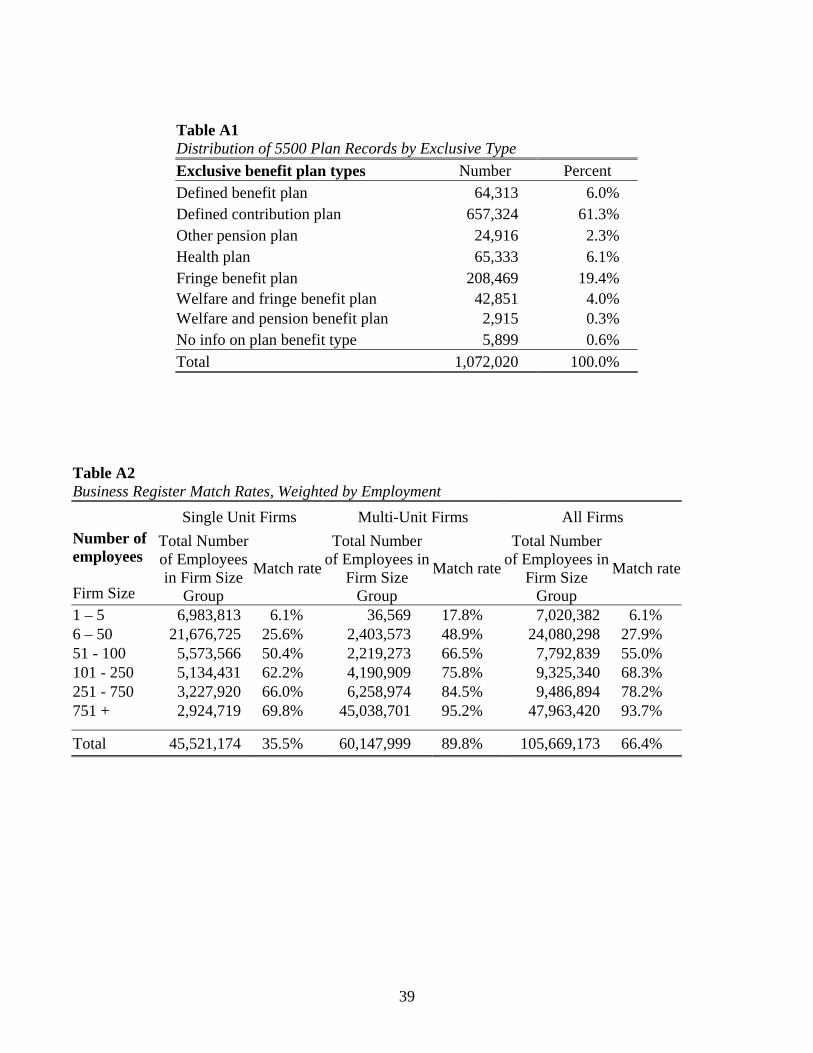
Table A1
Distribution of 5500 Plan Records by Exclusive Type Exclusive benefit plan types Number Percent Defined benefit plan 64,313 6.0% Defined contribution plan 657,324 61.3% Other pension plan 24,916 2.3% Health plan 65,333 6.1% Fringe benefit plan 208,469 19.4% Welfare and fringe benefit plan 42,851 4.0% Welfare and pension benefit plan 2,915 0.3% No info on plan benefit type 5,899 0.6% Total 1,072,020 100.0%
Table A2Business Register Match Rates, Weighted by Employment
Single Unit Firms Multi-Unit Firms All Firms Number of employees Firm Size
Total Number of Employees in Firm Size
Group
Match rate
Total Number of Employees in
Firm Size Group
Match rate
Total Number of Employees in
Firm Size Group
Match rate
1 – 5 6,983,813 6.1% 36,569 17.8% 7,020,382 6.1% 6 – 50 21,676,725 25.6% 2,403,573 48.9% 24,080,298 27.9% 51 - 100 5,573,566 50.4% 2,219,273 66.5% 7,792,839 55.0% 101 - 250 5,134,431 62.2% 4,190,909 75.8% 9,325,340 68.3% 251 - 750 3,227,920 66.0% 6,258,974 84.5% 9,486,894 78.2% 751 + 2,924,719 69.8% 45,038,701 95.2% 47,963,420 93.7%
Total 45,521,174 35.5% 60,147,999 89.8% 105,669,173 66.4%
39

40
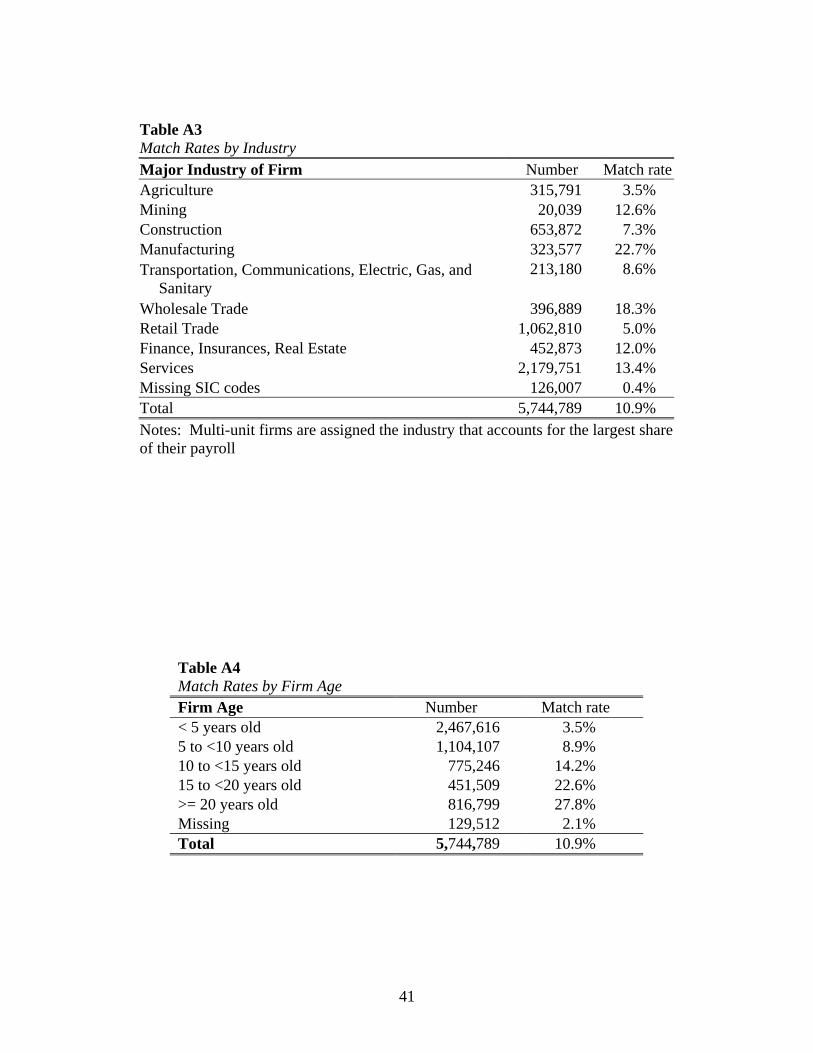
Table A3 Match Rates by Industry Major Industry of Firm Number Match rateAgriculture 315,791 3.5% Mining 20,039 12.6% Construction 653,872 7.3% Manufacturing 323,577 22.7% Transportation, Communications, Electric, Gas, and
Sanitary 213,180 8.6%
Wholesale Trade 396,889 18.3% Retail Trade 1,062,810 5.0% Finance, Insurances, Real Estate 452,873 12.0% Services 2,179,751 13.4% Missing SIC codes 126,007 0.4% Total 5,744,789 10.9% Notes: Multi-unit firms are assigned the industry that accounts for the largest share of their payroll
Table A4 Match Rates by Firm Age Firm Age Number Match rate < 5 years old 2,467,616 3.5% 5 to <10 years old 1,104,107 8.9% 10 to <15 years old 775,246 14.2% 15 to <20 years old 451,509 22.6% >= 20 years old 816,799 27.8% Missing 129,512 2.1% Total 5,744,789 10.9%
41
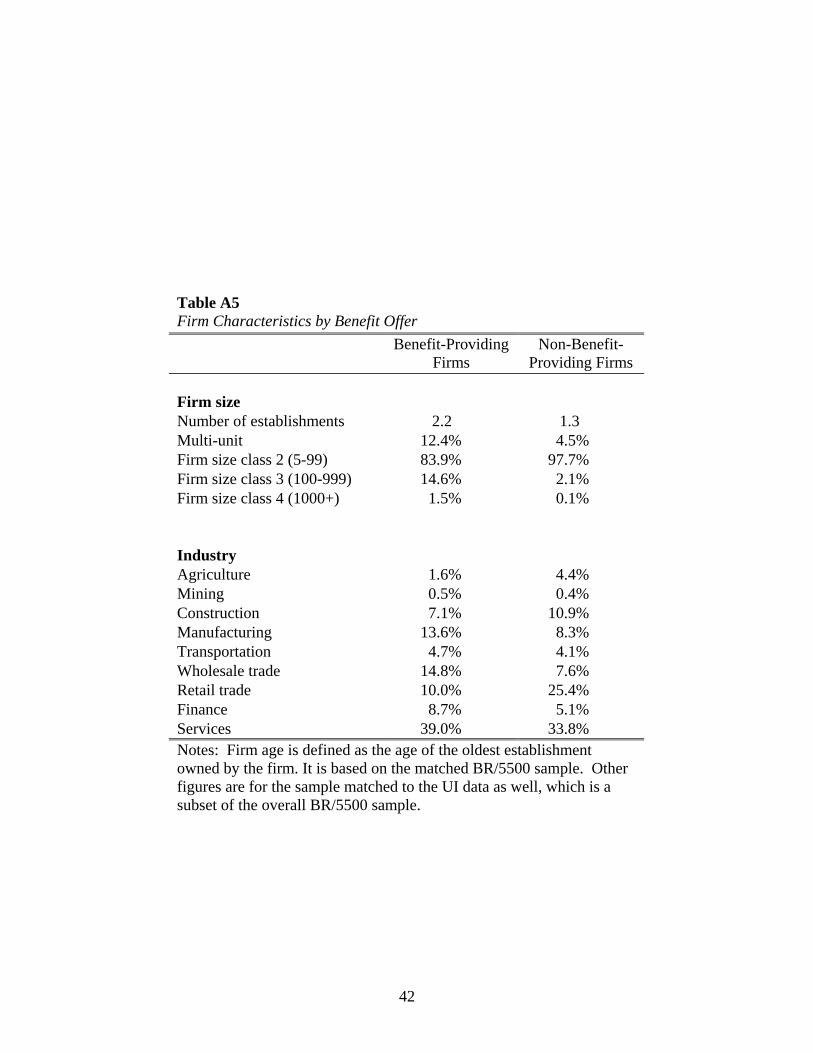
Table A5 Firm Characteristics by Benefit Offer
Benefit-Providing
Firms Non-Benefit-
Providing Firms Firm size Number of establishments 2.2 1.3 Multi-unit 12.4% 4.5% Firm size class 2 (5-99) 83.9% 97.7% Firm size class 3 (100-999) 14.6% 2.1% Firm size class 4 (1000+) 1.5% 0.1% Industry Agriculture 1.6% 4.4% Mining 0.5% 0.4% Construction 7.1% 10.9% Manufacturing 13.6% 8.3% Transportation 4.7% 4.1% Wholesale trade 14.8% 7.6% Retail trade 10.0% 25.4% Finance 8.7% 5.1% Services 39.0% 33.8% Notes: Firm age is defined as the age of the oldest establishment owned by the firm. It is based on the matched BR/5500 sample. Other figures are for the sample matched to the UI data as well, which is a subset of the overall BR/5500 sample.
42