Embed Size (px)
Citation preview

Emergence of the U.S. as World Leader
Lecture by Robert M. CoenEmeritus Professor of Economics
Northwestern University
Alumnae Continuing EducationNovember 2, 2010
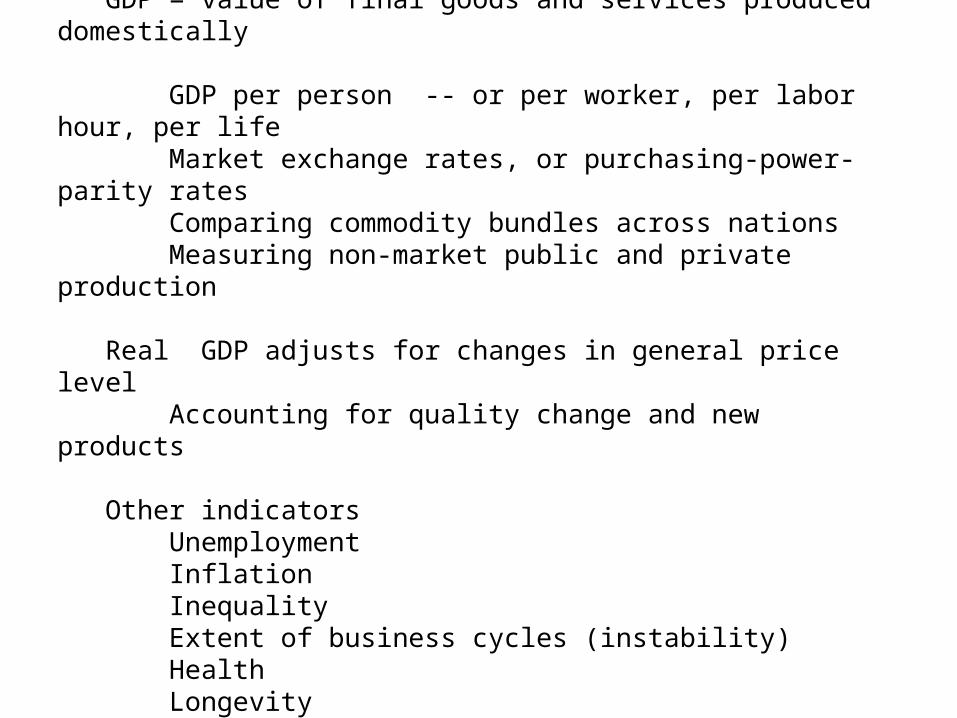
Measuring economic performance
GDP = value of final goods and services produced domestically GDP per person -- or per worker, per labor hour, per life Market exchange rates, or purchasing-power-parity rates Comparing commodity bundles across nations Measuring non-market public and private production
Real GDP adjusts for changes in general price level Accounting for quality change and new products
Other indicators Unemployment Inflation Inequality Extent of business cycles (instability) Health Longevity Environment Freedom
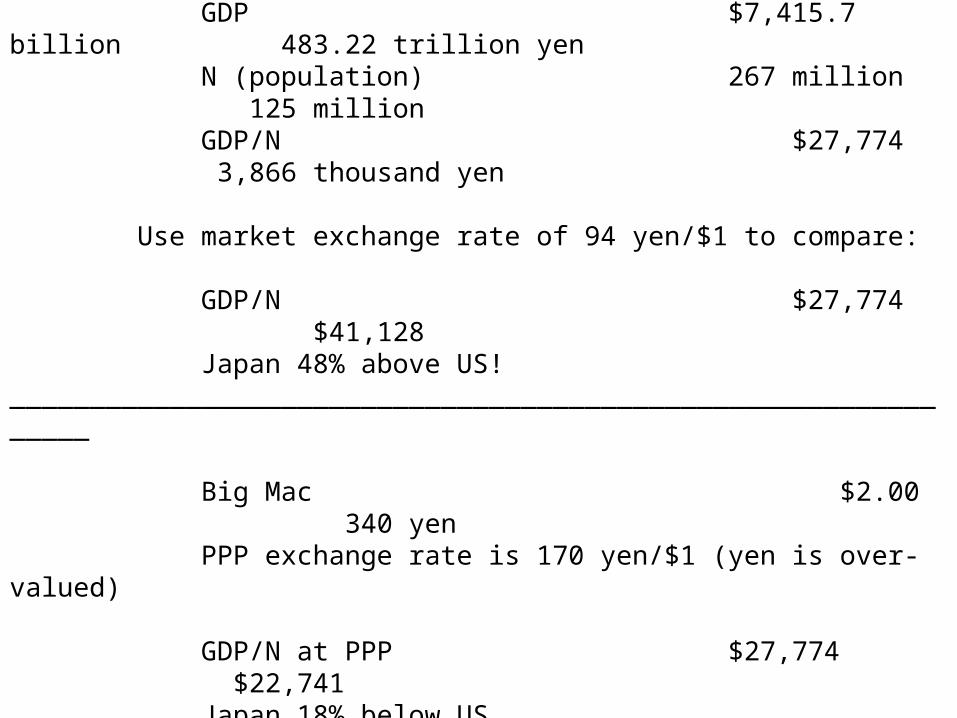
Data for 1995 United States Japan
GDP $7,415.7 billion 483.22 trillion yen N (population) 267 million 125 million GDP/N $27,774 3,866 thousand yen
Use market exchange rate of 94 yen/$1 to compare:
GDP/N $27,774 $41,128 Japan 48% above US!_______________________________________________________________
Big Mac $2.00 340 yen PPP exchange rate is 170 yen/$1 (yen is over-valued)
GDP/N at PPP $27,774 $22,741 Japan 18% below US
Real GDP/N in Big Macs 13,887 11,371

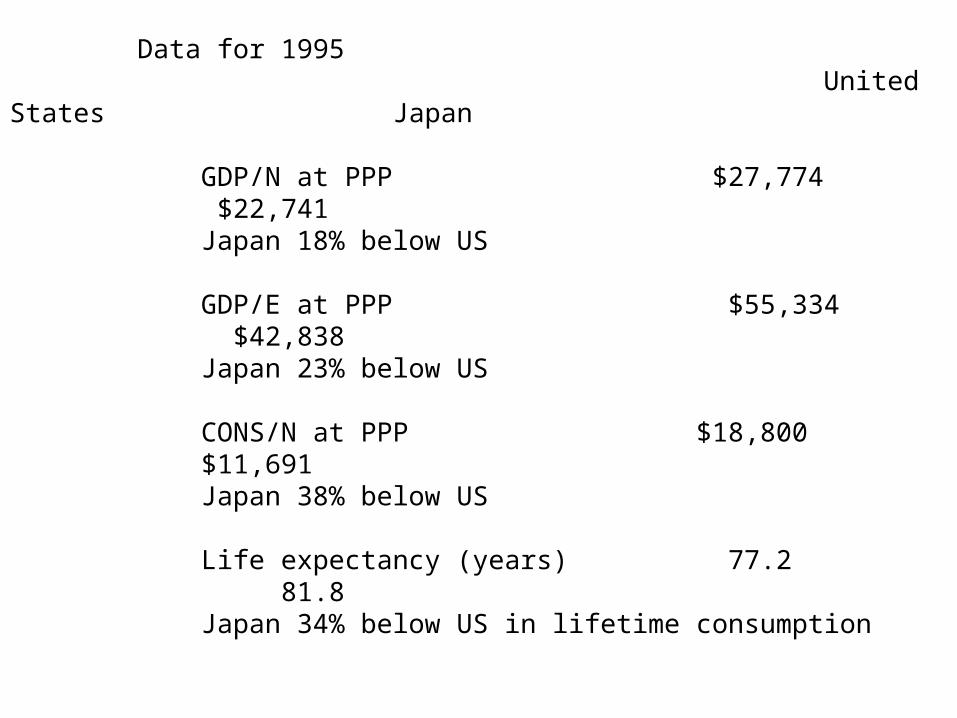
Data for 1995 United States Japan
GDP/N at PPP $27,774 $22,741 Japan 18% below US
GDP/E at PPP $55,334 $42,838 Japan 23% below US
CONS/N at PPP $18,800 $11,691 Japan 38% below US
Life expectancy (years) 77.2 81.8 Japan 34% below US in lifetime consumption

Measuring economic performance
GDP = value of final goods and services produced domestically GDP per person -- or per worker, per labor hour, per life Market exchange rates, or purchasing-power-parity rates Comparing commodity bundles across nations Measuring non-market public and private production
Real GDP adjusts for changes in general price level Accounting for quality change and new products
Other indicators Unemployment Inflation Inequality Extent of business cycles (instability) Health Longevity Environment Freedom
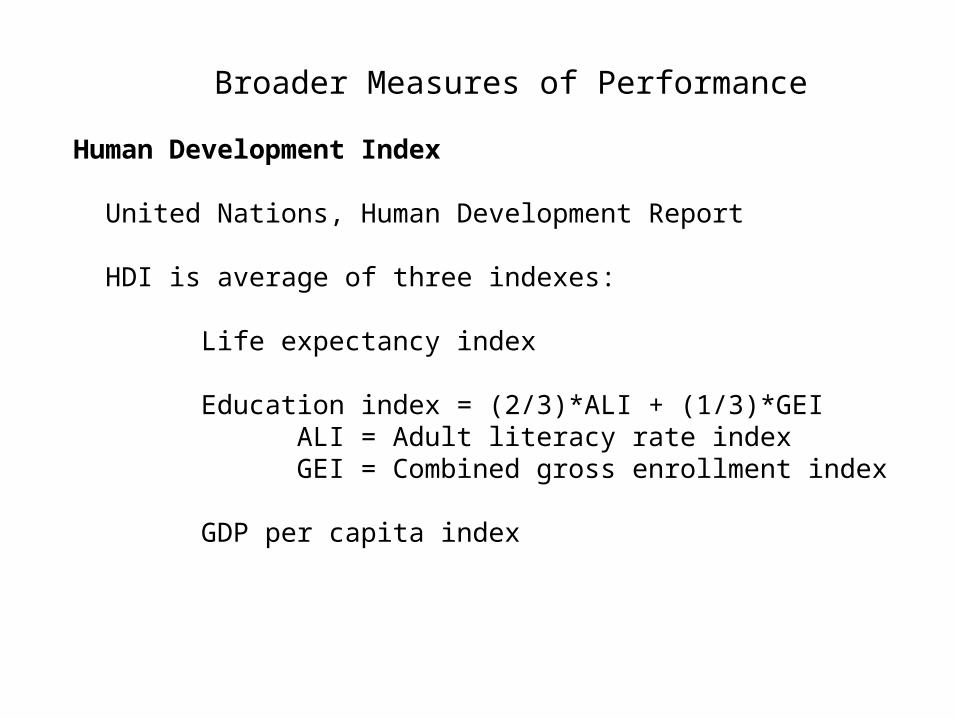
Broader Measures of Performance
Human Development Index
United Nations, Human Development Report
HDI is average of three indexes:
Life expectancy index
Education index = (2/3)*ALI + (1/3)*GEIALI = Adult literacy rate indexGEI = Combined gross enrollment index
GDP per capita index

Broader Measures of Performance
Gallop World Poll
Asks people about satisfaction with personal life and nation
On a scale of 0-10, from worst to best possible life for you:Where do you feel you stand?Where did you stand 5 years ago?Where do you expect to stand 5 years from now?
Same questions for country rather than for selfOptimism = outlook for 5 years hence – present
See Nestor Gandelman and Ruben Hernandez-Murillo,“The Impact of Inflation and Unemployment on Subjective
Personal and Country Evaluations”Federal Reserve Bank of St. Louis Review, May/June 2009
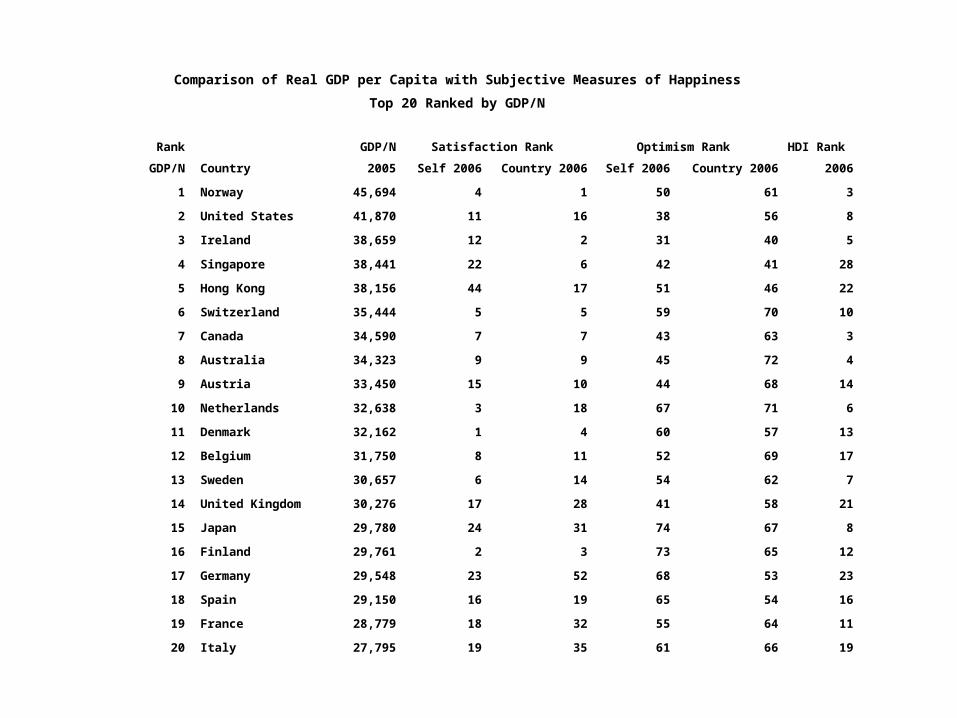
Comparison of Real GDP per Capita with Subjective Measures of Happiness
Top 20 Ranked by GDP/N
Rank GDP/N Satisfaction Rank Optimism Rank HDI Rank
GDP/N Country 2005 Self 2006 Country 2006 Self 2006 Country 2006 2006
1 Norway 45,694 4 1 50 61 3
2 United States 41,870 11 16 38 56 8
3 Ireland 38,659 12 2 31 40 5
4 Singapore 38,441 22 6 42 41 28
5 Hong Kong 38,156 44 17 51 46 22
6 Switzerland 35,444 5 5 59 70 10
7 Canada 34,590 7 7 43 63 3
8 Australia 34,323 9 9 45 72 4
9 Austria 33,450 15 10 44 68 14
10 Netherlands 32,638 3 18 67 71 6
11 Denmark 32,162 1 4 60 57 13
12 Belgium 31,750 8 11 52 69 17
13 Sweden 30,657 6 14 54 62 7
14 United Kingdom 30,276 17 28 41 58 21
15 Japan 29,780 24 31 74 67 8
16 Finland 29,761 2 3 73 65 12
17 Germany 29,548 23 52 68 53 23
18 Spain 29,150 16 19 65 54 16
19 France 28,779 18 32 55 64 11
20 Italy 27,795 19 35 61 66 19
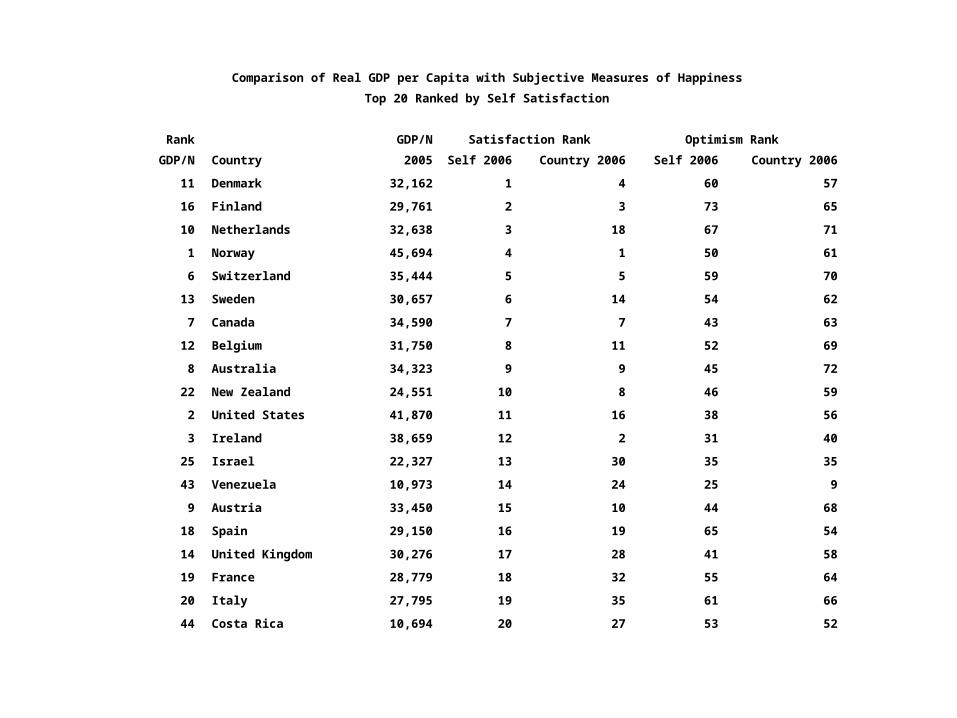
Comparison of Real GDP per Capita with Subjective Measures of Happiness
Top 20 Ranked by Self Satisfaction
Rank GDP/N Satisfaction Rank Optimism Rank
GDP/N Country 2005 Self 2006 Country 2006 Self 2006 Country 2006
11 Denmark 32,162 1 4 60 57
16 Finland 29,761 2 3 73 65
10 Netherlands 32,638 3 18 67 71
1 Norway 45,694 4 1 50 61
6 Switzerland 35,444 5 5 59 70
13 Sweden 30,657 6 14 54 62
7 Canada 34,590 7 7 43 63
12 Belgium 31,750 8 11 52 69
8 Australia 34,323 9 9 45 72
22 New Zealand 24,551 10 8 46 59
2 United States 41,870 11 16 38 56
3 Ireland 38,659 12 2 31 40
25 Israel 22,327 13 30 35 35
43 Venezuela 10,973 14 24 25 9
9 Austria 33,450 15 10 44 68
18 Spain 29,150 16 19 65 54
14 United Kingdom 30,276 17 28 41 58
19 France 28,779 18 32 55 64
20 Italy 27,795 19 35 61 66
44 Costa Rica 10,694 20 27 53 52
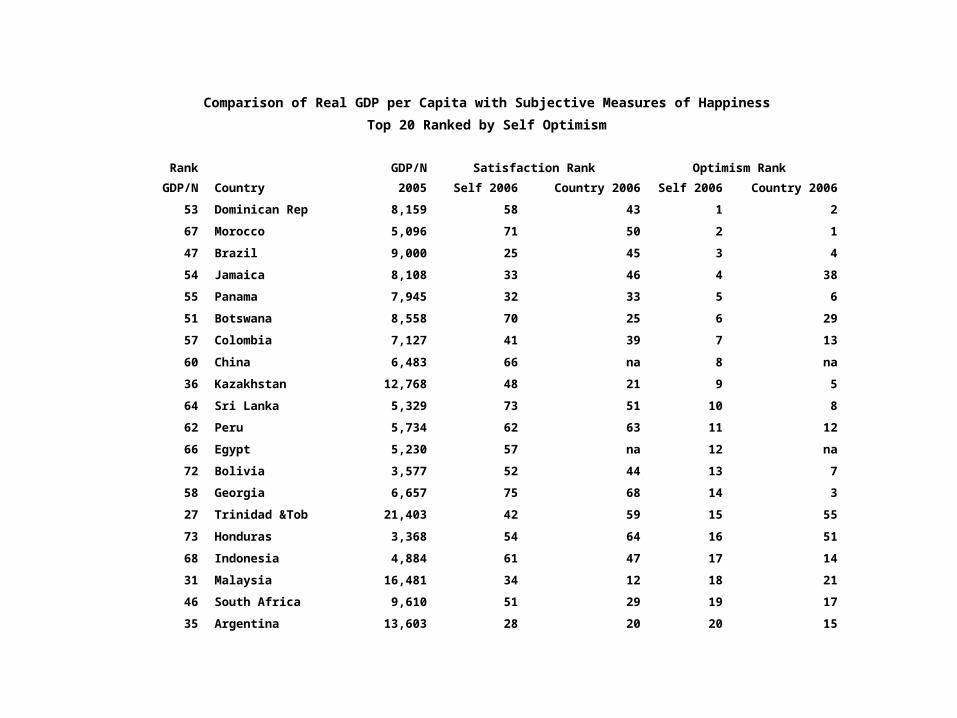
Comparison of Real GDP per Capita with Subjective Measures of Happiness
Top 20 Ranked by Self Optimism
Rank GDP/N Satisfaction Rank Optimism Rank
GDP/N Country 2005 Self 2006 Country 2006 Self 2006 Country 2006
53 Dominican Rep 8,159 58 43 1 2
67 Morocco 5,096 71 50 2 1
47 Brazil 9,000 25 45 3 4
54 Jamaica 8,108 33 46 4 38
55 Panama 7,945 32 33 5 6
51 Botswana 8,558 70 25 6 29
57 Colombia 7,127 41 39 7 13
60 China 6,483 66 na 8 na
36 Kazakhstan 12,768 48 21 9 5
64 Sri Lanka 5,329 73 51 10 8
62 Peru 5,734 62 63 11 12
66 Egypt 5,230 57 na 12 na
72 Bolivia 3,577 52 44 13 7
58 Georgia 6,657 75 68 14 3
27 Trinidad &Tob 21,403 42 59 15 55
73 Honduras 3,368 54 64 16 51
68 Indonesia 4,884 61 47 17 14
31 Malaysia 16,481 34 12 18 21
46 South Africa 9,610 51 29 19 17
35 Argentina 13,603 28 20 20 15
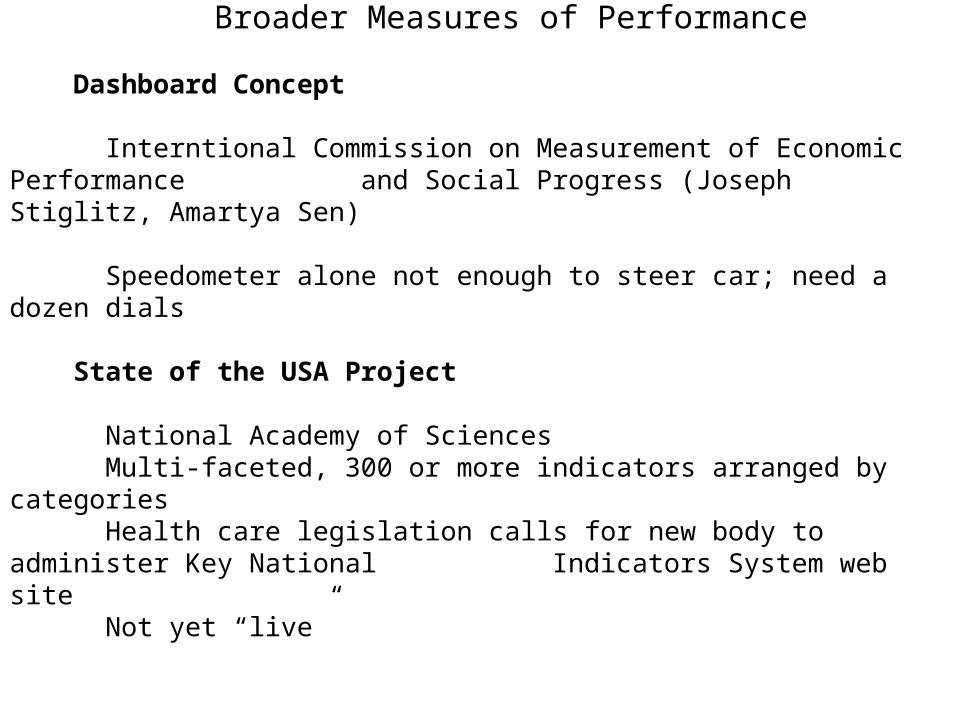
Broader Measures of Performance
Dashboard Concept
Interntional Commission on Measurement of Economic Performance and Social Progress (Joseph Stiglitz, Amartya Sen)
Speedometer alone not enough to steer car; need a dozen dials
State of the USA Project
National Academy of SciencesMulti-faceted, 300 or more indicators arranged by categoriesHealth care legislation calls for new body to administer Key National Indicators System web siteNot yet “live”
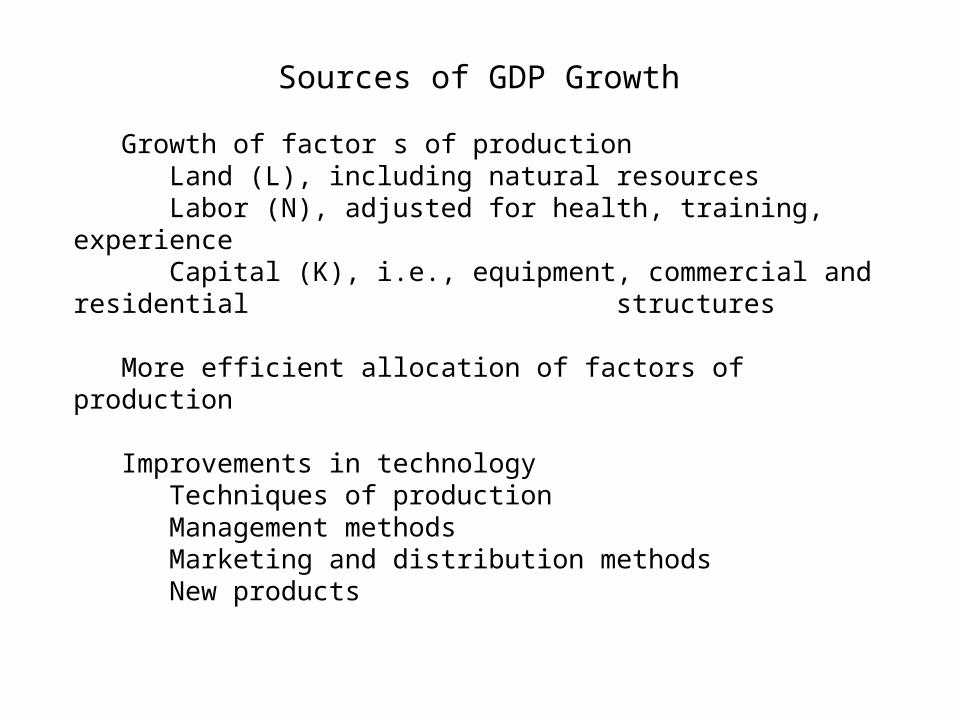
Sources of GDP Growth
Growth of factor s of productionLand (L), including natural resourcesLabor (N), adjusted for health, training, experienceCapital (K), i.e., equipment, commercial and residential structures
More efficient allocation of factors of production
Improvements in technology Techniques of productionManagement methodsMarketing and distribution methodsNew products
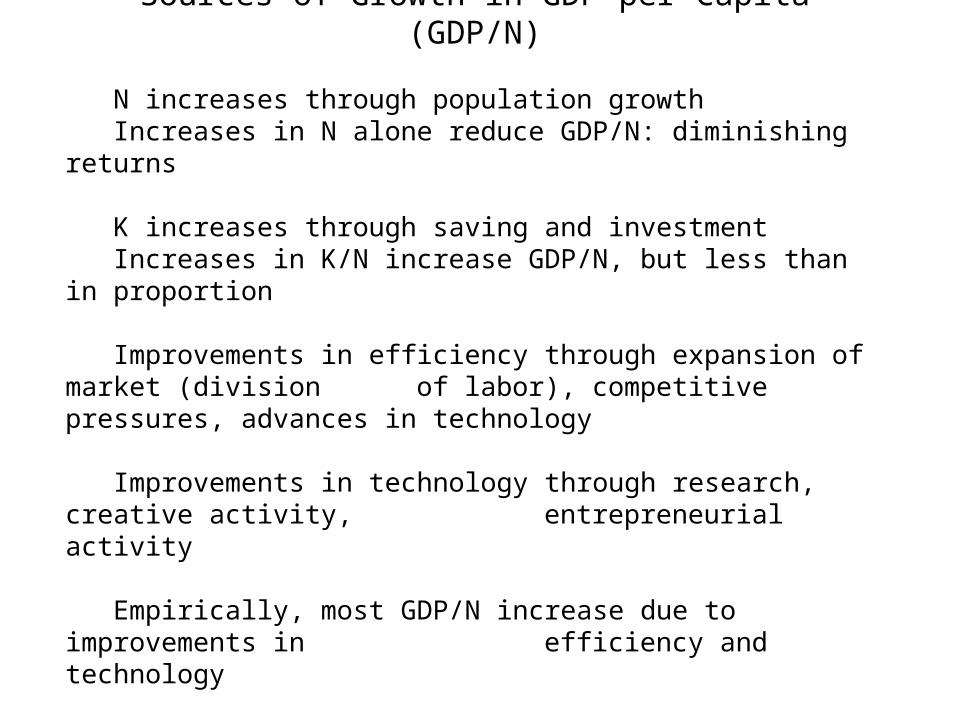
Sources of Growth in GDP per Capita (GDP/N)
N increases through population growthIncreases in N alone reduce GDP/N: diminishing returns
K increases through saving and investmentIncreases in K/N increase GDP/N, but less than in proportion
Improvements in efficiency through expansion of market (division of labor), competitive pressures, advances in technology
Improvements in technology through research, creative activity, entrepreneurial activity
Empirically, most GDP/N increase due to improvements in efficiency and technology
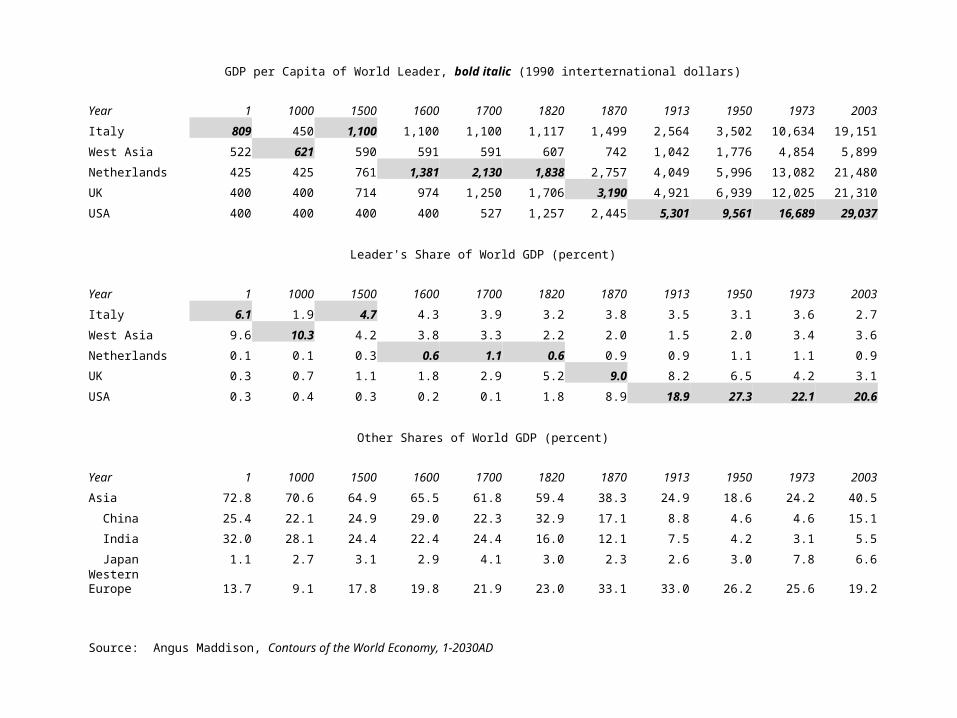
GDP per Capita of World Leader, bold italic (1990 interternational dollars)
Year 1 1000 1500 1600 1700 1820 1870 1913 1950 1973 2003
Italy 809 450 1,100 1,100 1,100 1,117 1,499 2,564 3,502 10,634 19,151
West Asia 522 621 590 591 591 607 742 1,042 1,776 4,854 5,899
Netherlands 425 425 761 1,381 2,130 1,838 2,757 4,049 5,996 13,082 21,480
UK 400 400 714 974 1,250 1,706 3,190 4,921 6,939 12,025 21,310
USA 400 400 400 400 527 1,257 2,445 5,301 9,561 16,689 29,037
Leader's Share of World GDP (percent)
Year 1 1000 1500 1600 1700 1820 1870 1913 1950 1973 2003
Italy 6.1 1.9 4.7 4.3 3.9 3.2 3.8 3.5 3.1 3.6 2.7
West Asia 9.6 10.3 4.2 3.8 3.3 2.2 2.0 1.5 2.0 3.4 3.6
Netherlands 0.1 0.1 0.3 0.6 1.1 0.6 0.9 0.9 1.1 1.1 0.9
UK 0.3 0.7 1.1 1.8 2.9 5.2 9.0 8.2 6.5 4.2 3.1
USA 0.3 0.4 0.3 0.2 0.1 1.8 8.9 18.9 27.3 22.1 20.6
Other Shares of World GDP (percent)
Year 1 1000 1500 1600 1700 1820 1870 1913 1950 1973 2003
Asia 72.8 70.6 64.9 65.5 61.8 59.4 38.3 24.9 18.6 24.2 40.5
China 25.4 22.1 24.9 29.0 22.3 32.9 17.1 8.8 4.6 4.6 15.1
India 32.0 28.1 24.4 22.4 24.4 16.0 12.1 7.5 4.2 3.1 5.5
Japan 1.1 2.7 3.1 2.9 4.1 3.0 2.3 2.6 3.0 7.8 6.6
Western Europe 13.7 9.1 17.8 19.8 21.9 23.0 33.1 33.0 26.2 25.6 19.2
Source: Angus Maddison, Contours of the World Economy, 1-2030AD
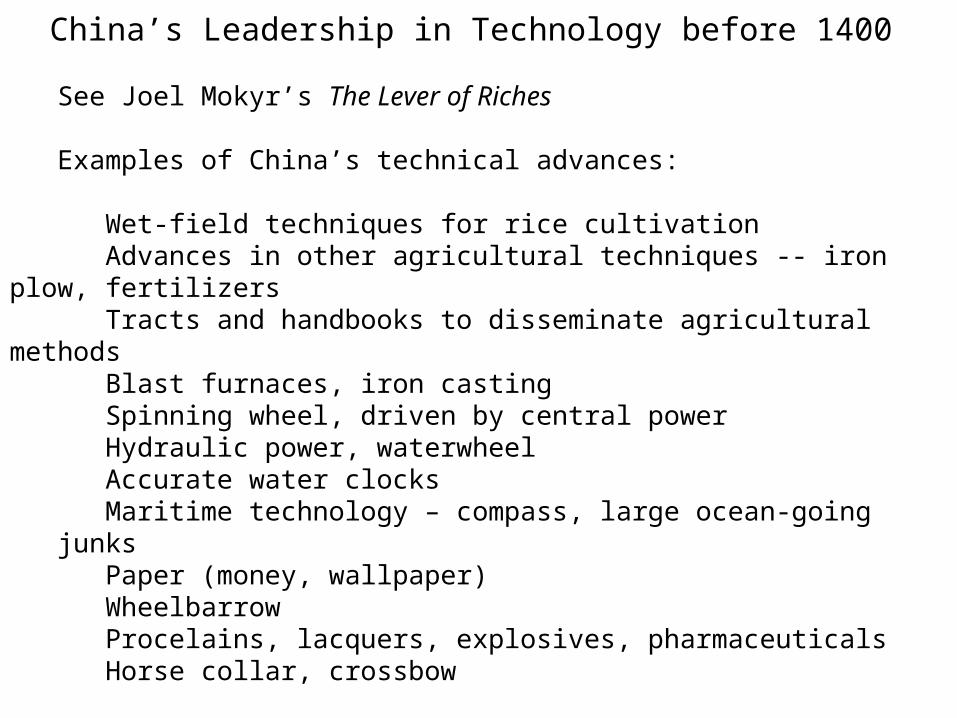
China’s Leadership in Technology before 1400
See Joel Mokyr’s The Lever of Riches
Examples of China’s technical advances:
Wet-field techniques for rice cultivationAdvances in other agricultural techniques -- iron plow, fertilizersTracts and handbooks to disseminate agricultural methodsBlast furnaces, iron castingSpinning wheel, driven by central powerHydraulic power, waterwheelAccurate water clocksMaritime technology – compass, large ocean-going junksPaper (money, wallpaper)WheelbarrowProcelains, lacquers, explosives, pharmaceuticalsHorse collar, crossbow
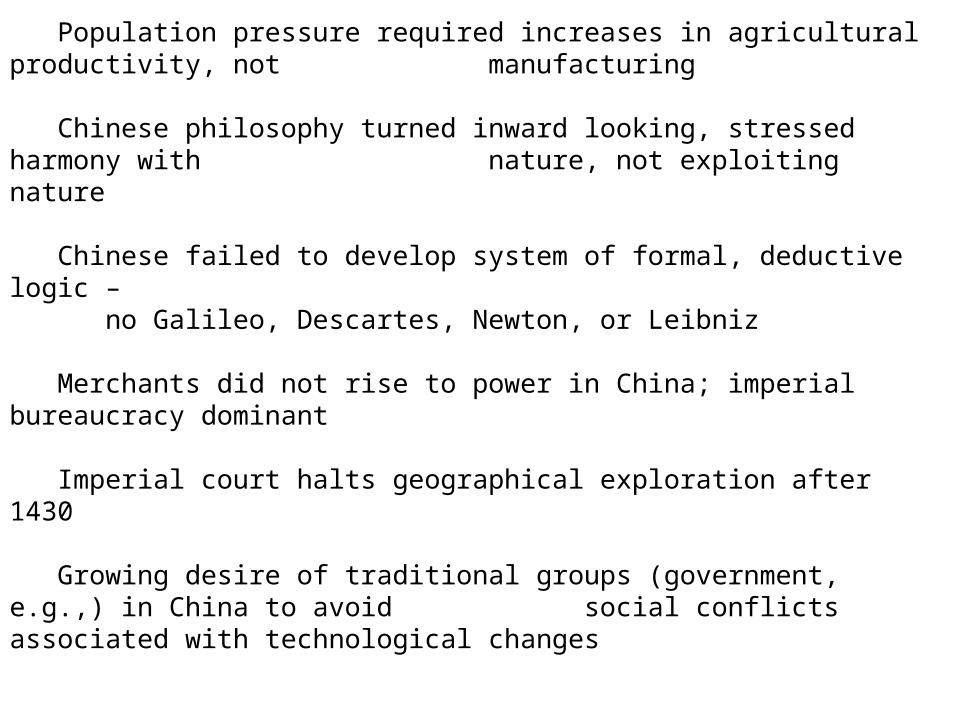
Why Did China Fail to Become Europe?
Population pressure required increases in agricultural productivity, not manufacturing
Chinese philosophy turned inward looking, stressed harmony with nature, not exploiting nature
Chinese failed to develop system of formal, deductive logic –no Galileo, Descartes, Newton, or Leibniz
Merchants did not rise to power in China; imperial bureaucracy dominant
Imperial court halts geographical exploration after 1430
Growing desire of traditional groups (government, e.g.,) in China to avoid social conflicts associated with technological changes
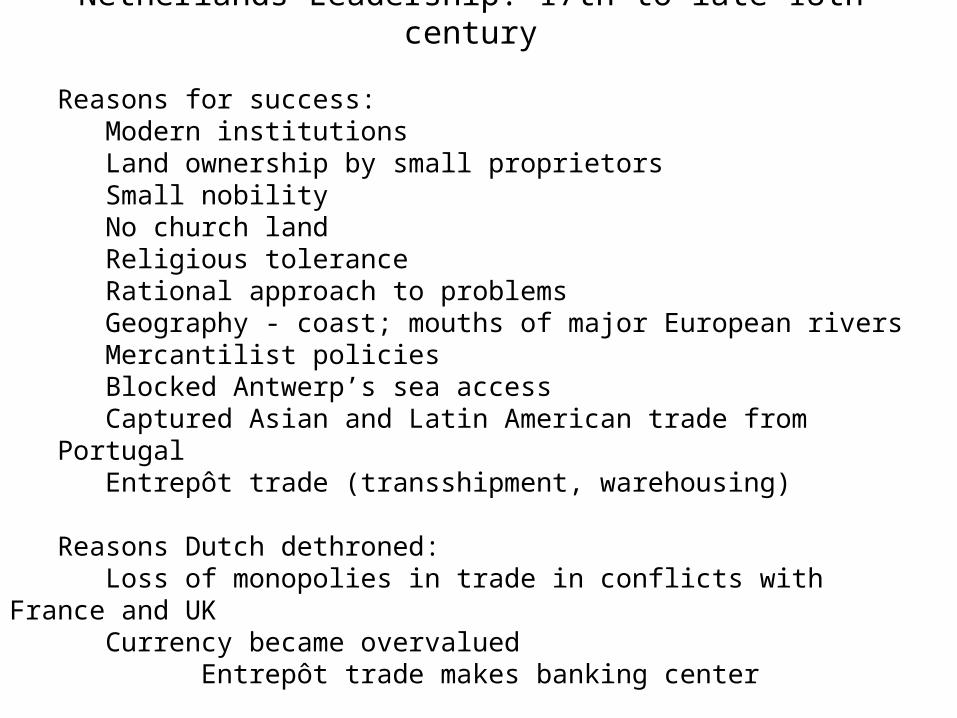
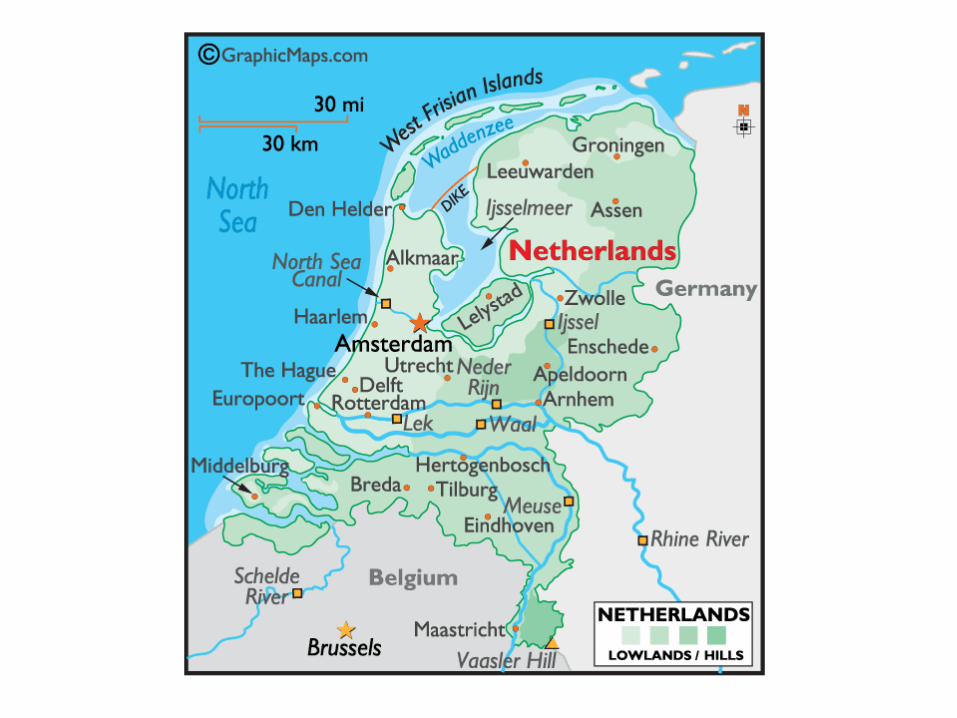
Netherlands Leadership: 17th to late 18th century
Reasons for success:Modern institutionsLand ownership by small proprietorsSmall nobilityNo church landReligious toleranceRational approach to problemsGeography - coast; mouths of major European riversMercantilist policiesBlocked Antwerp’s sea accessCaptured Asian and Latin American trade from PortugalEntrepôt trade (transshipment, warehousing)
Reasons Dutch dethroned:Loss of monopolies in trade in conflicts with France and UKCurrency became overvalued
Entrepôt trade makes banking center
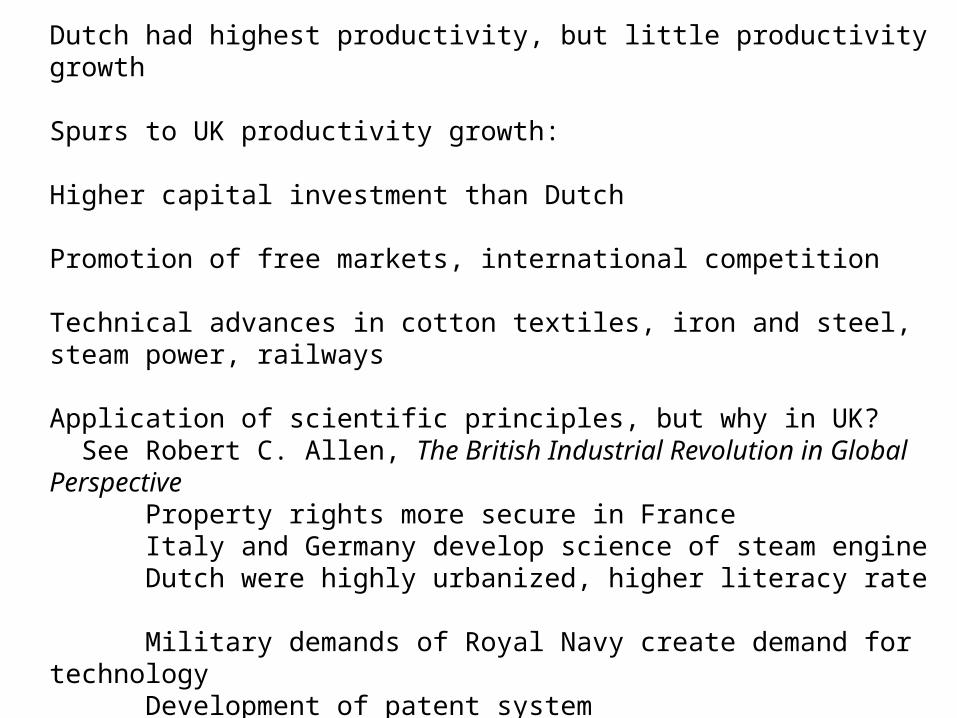
United Kingdom: Late 18th to late 19th century
Dutch had highest productivity, but little productivity growth
Spurs to UK productivity growth:
Higher capital investment than Dutch
Promotion of free markets, international competition
Technical advances in cotton textiles, iron and steel, steam power, railways
Application of scientific principles, but why in UK? See Robert C. Allen, The British Industrial Revolution in Global Perspective
Property rights more secure in FranceItaly and Germany develop science of steam engineDutch were highly urbanized, higher literacy rate
Military demands of Royal Navy create demand for technologyDevelopment of patent systemHigh wages, cheap coal, consumer society
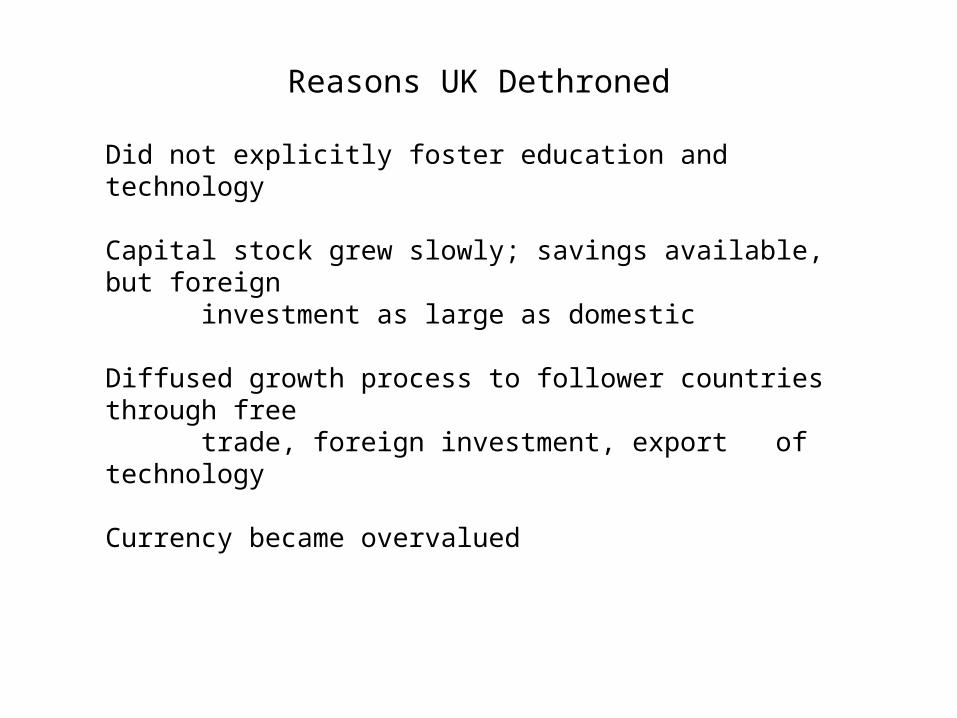
Reasons UK Dethroned
Did not explicitly foster education and technology
Capital stock grew slowly; savings available, but foreigninvestment as large as domestic
Diffused growth process to follower countries through freetrade, foreign investment, exportof technology
Currency became overvalued
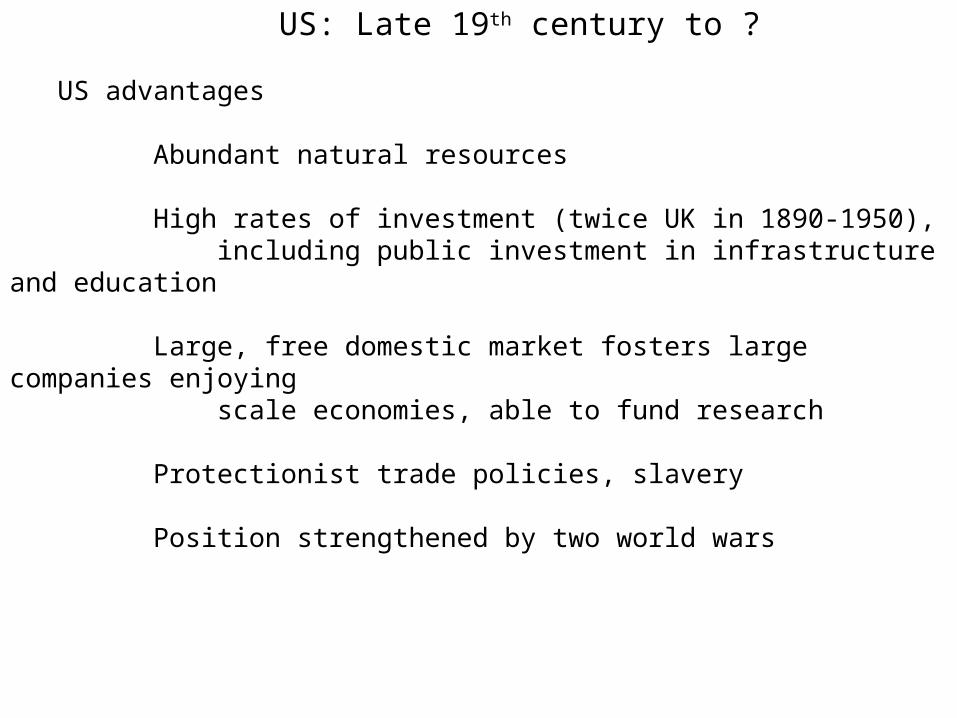
US: Late 19th century to ?
US advantages
Abundant natural resources
High rates of investment (twice UK in 1890-1950), including public investment in infrastructure and education
Large, free domestic market fosters large companies enjoying scale economies, able to fund research
Protectionist trade policies, slavery
Position strengthened by two world wars
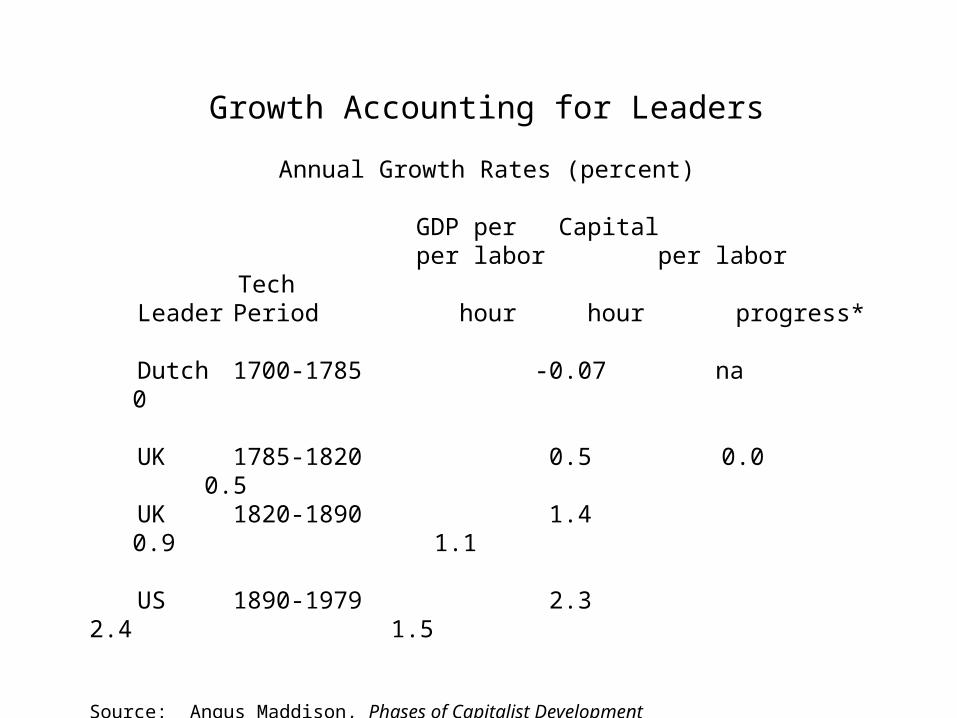
Growth Accounting for Leaders
Annual Growth Rates (percent)
GDP per Capital per labor per labor Tech
Leader Period hour hour progress*
Dutch 1700-1785 -0.07 na 0
UK 1785-1820 0.5 0.0 0.5UK 1820-1890 1.4 0.9 1.1
US 1890-1979 2.3 2.4 1.5
Source: Angus Maddison, Phases of Capitalist Development* Author’s estimate assuming 1 percent increase in capital per labor hour increases GDP per labor hour by 0.33 percent.