Embed Size (px)
Citation preview

Can the US Continue as World Leader
Lecture by Robert M CoenEmeritus Professor of Economics
Northwestern University
Alumnae Continuing EducationNovember 9 2010
United Kingdom Late 18th to late 19th century
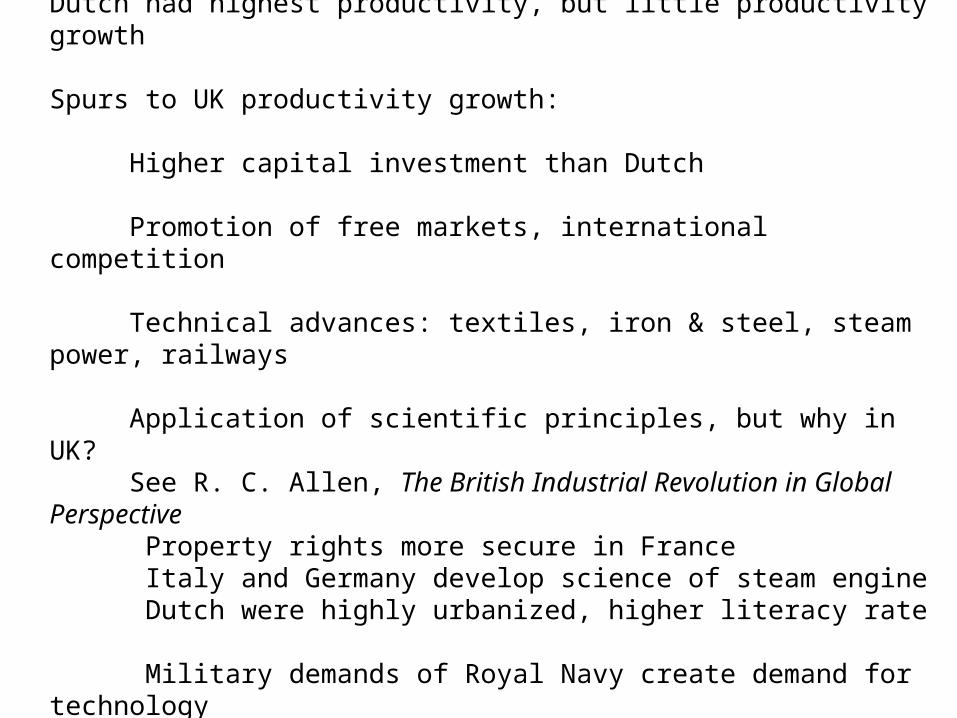
Dutch had highest productivity but little productivity growth
Spurs to UK productivity growth
Higher capital investment than Dutch
Promotion of free markets international competition
Technical advances textiles iron amp steel steam power railways
Application of scientific principles but why in UK See R C Allen The British Industrial Revolution in Global Perspective
Property rights more secure in FranceItaly and Germany develop science of steam engineDutch were highly urbanized higher literacy rate
Military demands of Royal Navy create demand for technologyDevelopment of patent systemHigh wages cheap coal consumer society
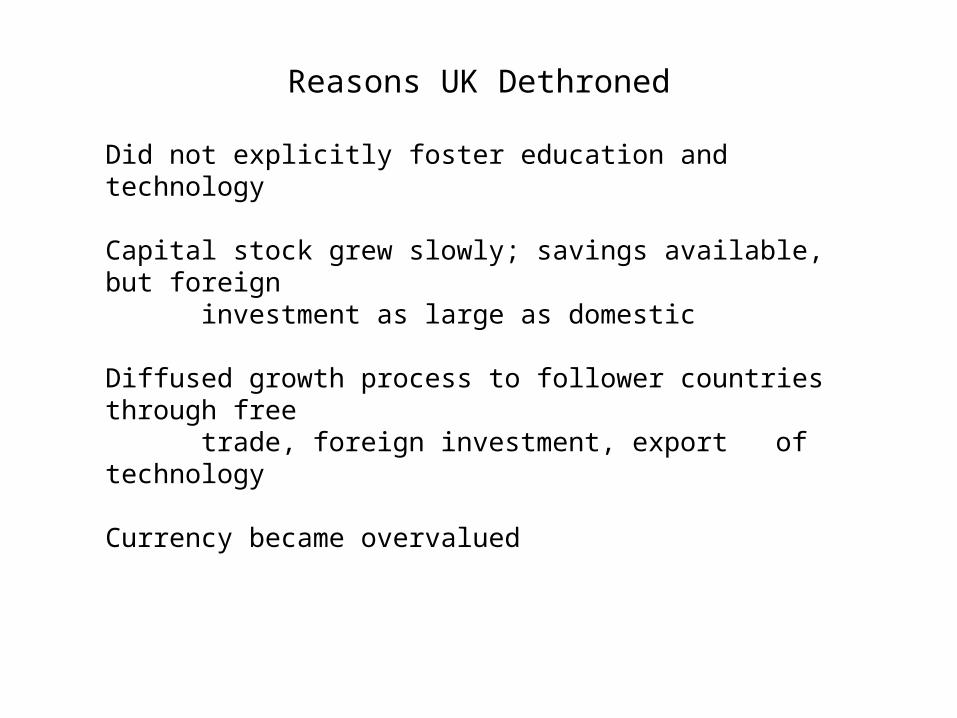
Reasons UK Dethroned
Did not explicitly foster education and technology
Capital stock grew slowly savings available but foreigninvestment as large as domestic
Diffused growth process to follower countries through freetrade foreign investment exportof technology
Currency became overvalued
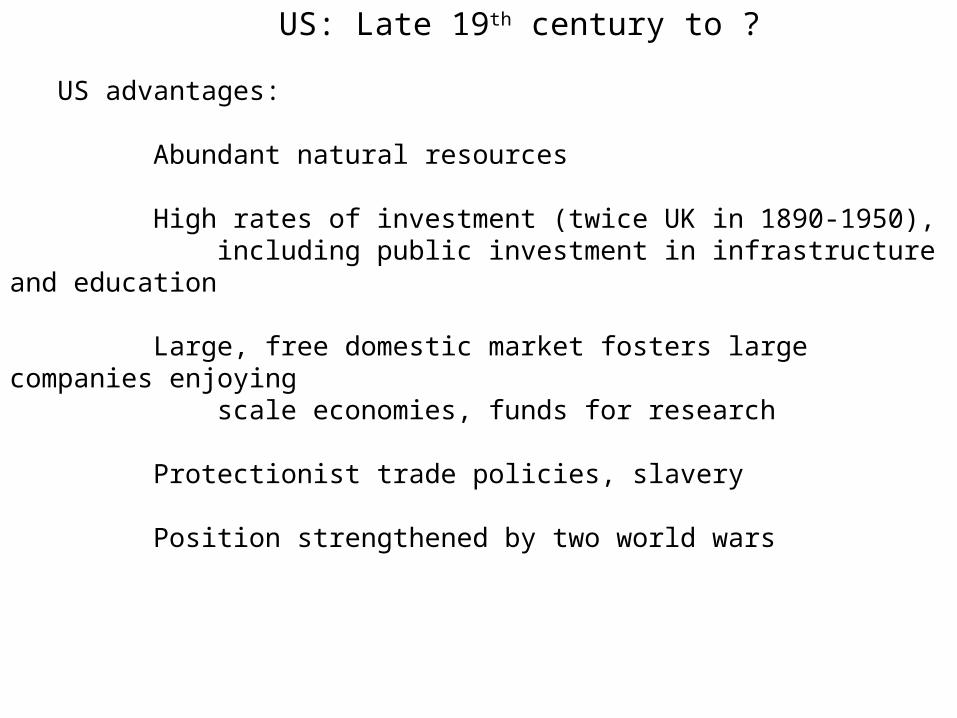
US Late 19th century to
US advantages
Abundant natural resources
High rates of investment (twice UK in 1890-1950) including public investment in infrastructure and education
Large free domestic market fosters large companies enjoying scale economies funds for research
Protectionist trade policies slavery
Position strengthened by two world wars
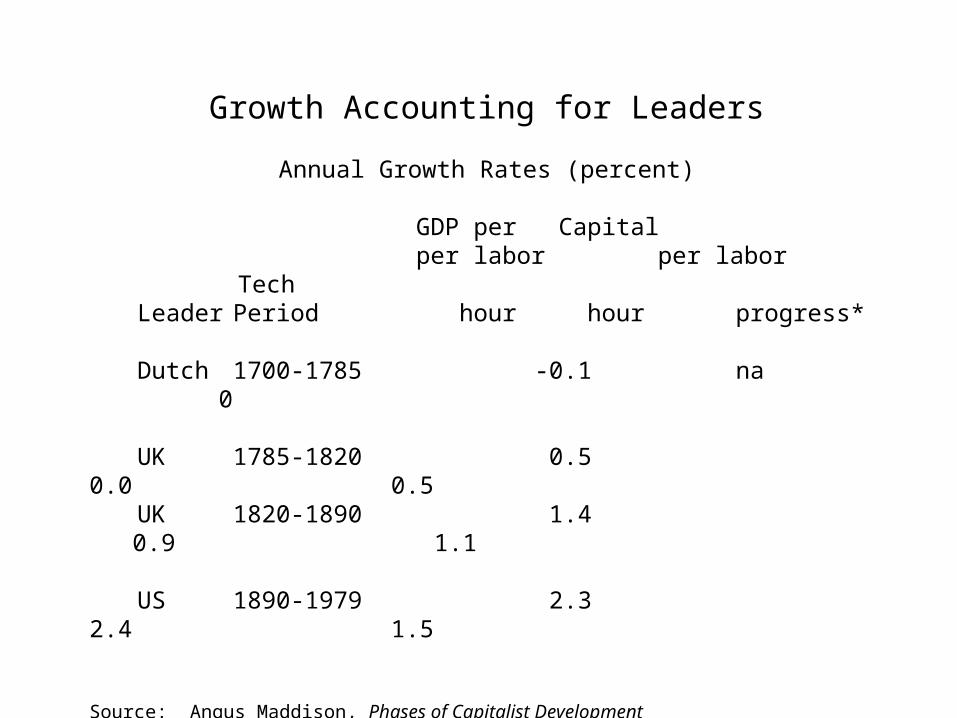
Growth Accounting for Leaders
Annual Growth Rates (percent)
GDP per Capital per labor per labor Tech
Leader Period hour hour progress
Dutch 1700-1785 -01 na 0
UK 1785-1820 05 00 05UK 1820-1890 14 09 11
US 1890-1979 23 24 15
Source Angus Maddison Phases of Capitalist Development Authorrsquos estimate assuming 1 percent increase in capital per labor hour increases GDP per labor hour by 033 percent
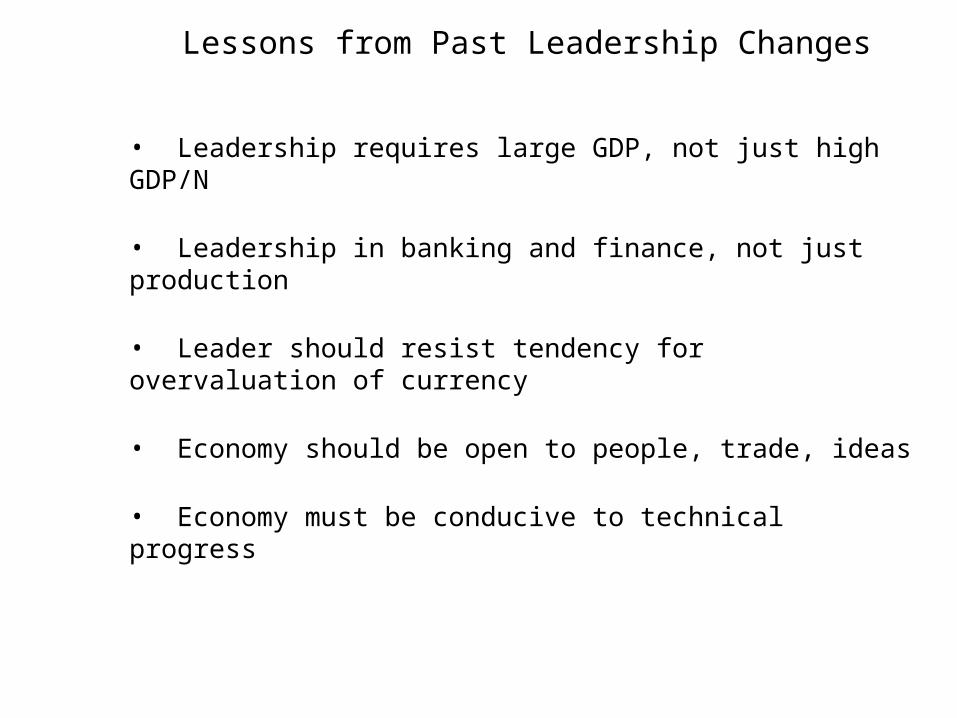
Lessons from Past Leadership Changes
bull Leadership requires large GDP not just high GDPN
bull Leadership in banking and finance not just production
bull Leader should resist tendency for overvaluation of currency
bull Economy should be open to people trade ideas
bull Economy must be conducive to technical progress
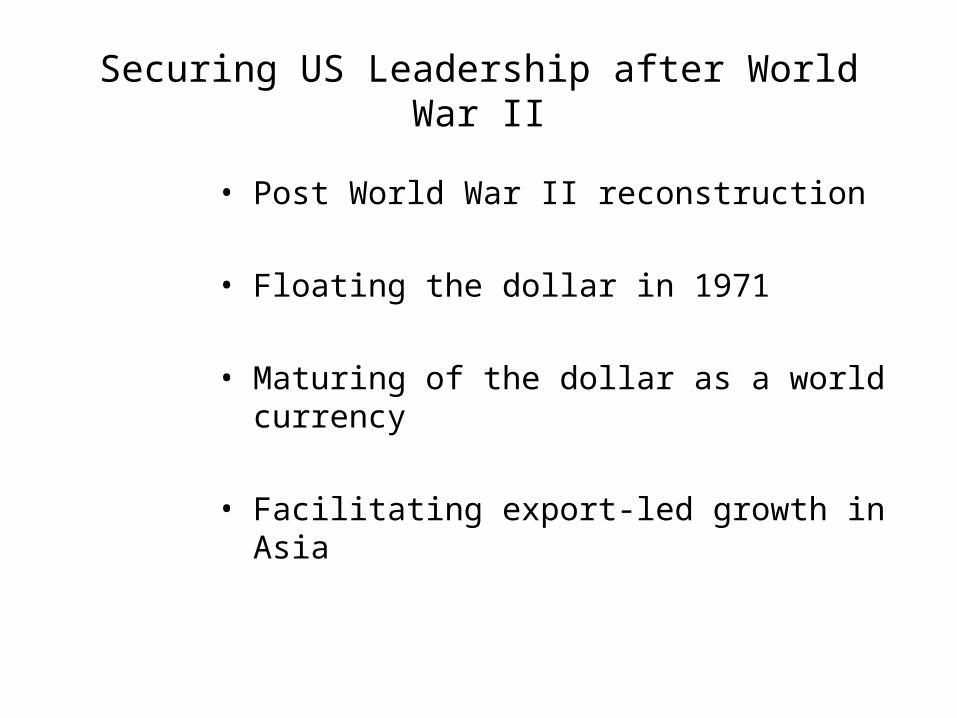
Securing US Leadership after World War II
bull Post World War II reconstruction
bull Floating the dollar in 1971
bull Maturing of the dollar as a world currency
bull Facilitating export-led growth in Asia
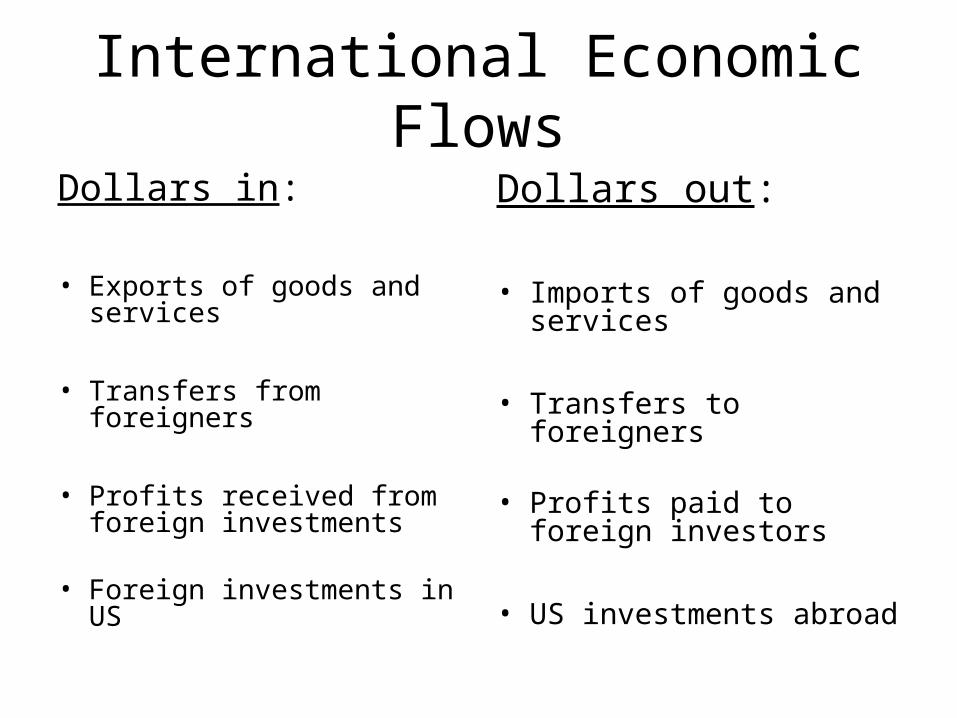
International Economic Flows
Dollars in
bull Exports of goods and services
bull Transfers from foreigners
bull Profits received from foreign investments
bull Foreign investments in US
Dollars out
bull Imports of goods and services
bull Transfers to foreigners
bull Profits paid to foreign investors
bull US investments abroad
-8
-6
-4
-2
0
2
4
6
50 55 60 65 70 75 80 85 90 95 00 05
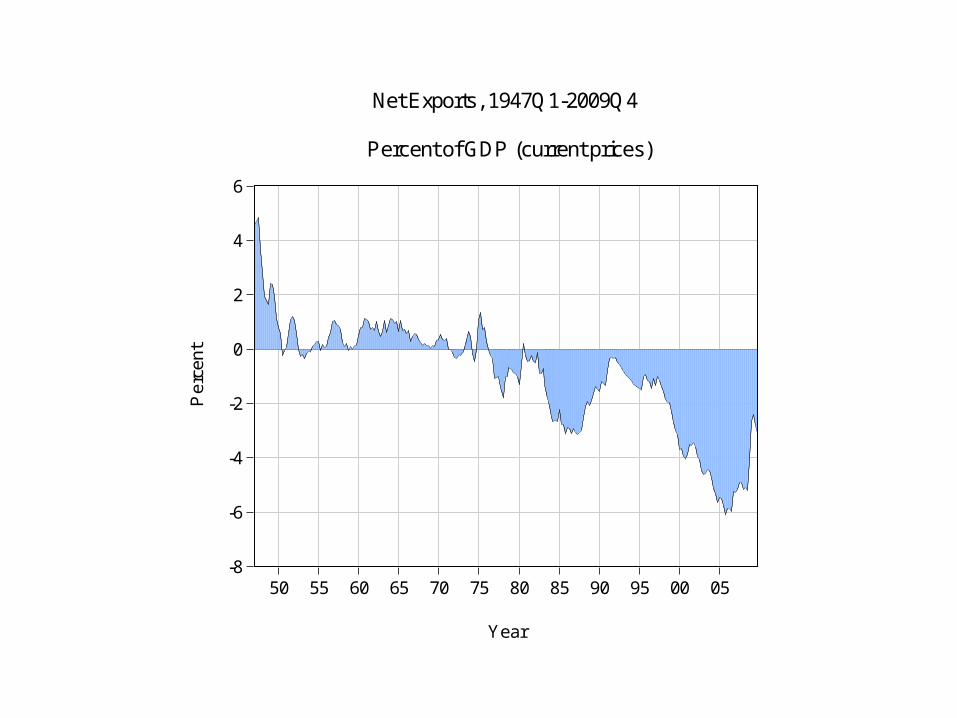
Net Exports 1947Q1-2009Q4
Percent of GDP (current prices)
Per
cent
Year
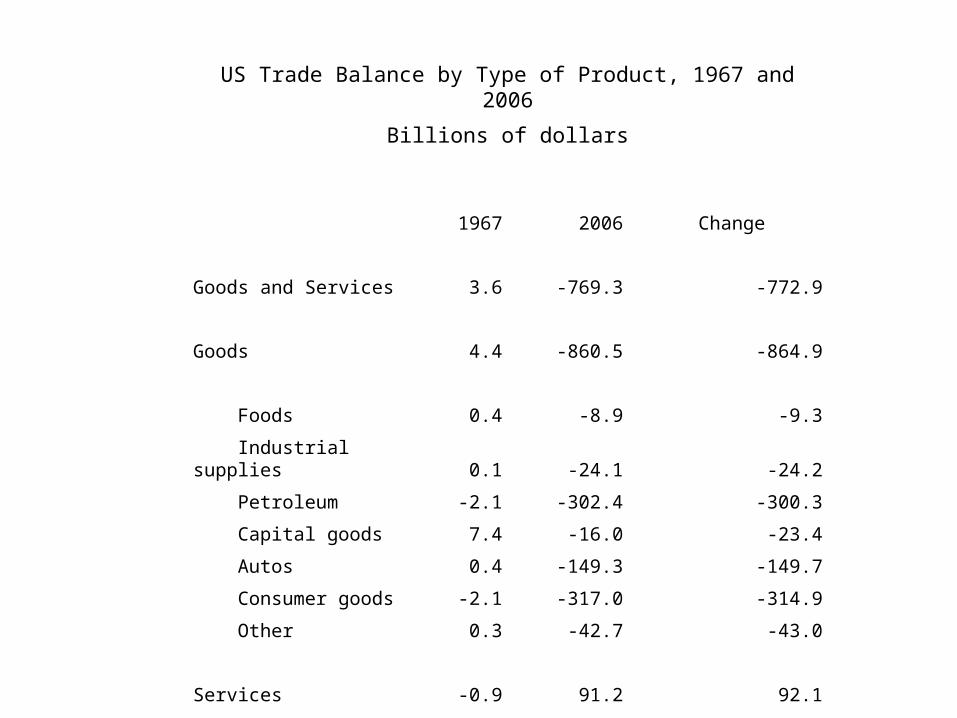
US Trade Balance by Type of Product 1967 and 2006
Billions of dollars
1967 2006 Change
Goods and Services 36 -7693 -7729
Goods 44 -8605 -8649
Foods 04 -89 -93
Industrial supplies 01 -241 -242
Petroleum -21 -3024 -3003
Capital goods 74 -160 -234
Autos 04 -1493 -1497
Consumer goods -21 -3170 -3149
Other 03 -427 -430
Services -09 912 921
Why Trust in the Dollar
bull A large open economy to run payments deficits large enough to meet world currency needs
bull An independent responsible central bank -- the Federal Reserve
bull A large efficient commercial banking systembull Large deep and open capital marketsbull Relatively stable pricesbull A convertible currencybull A relatively stable exchange rate with other major
currenciesbull A track record demonstrating these characteristics
Challengers to US Leadership Past and Future
bull USSR (Russia)
bull Japan
bull European Union
bull Emerging Asia
Soviet EmpireRed states Communist governmentsOrange states Leaning communist
Real GDP per capita dollars
Ten highest in 2007
Country 1950 1970 1980 1990 2000 2007
Luxembourg 14945 22906 27359 43658 63392 77783
Austria 5573 14843 20902 26023 31574 36032
Netherlands 8840 17387 21030 24619 31927 34392
Denmark 8571 16223 19055 23939 30468 34292
Belgium 7529 14894 20327 24559 29692 33798
Sweden 9252 17003 19629 23454 27174 32962
Finland 5674 13266 17845 22794 26402 32486
United Kingdom 8859 13990 16681 21742 27032 32181
Spain 3527 11561 14742 19112 24945 31446
Germany 15364 20000 24599 29051 31306
EU average 6362 12478 16375 19594 23557 27275
Euro zone average 5374 13975 18441 22361 26814 29975
US 12990 19749 24537 30994 39241 42887
Real GDP billion of dollars
Ten largest in 2007
Country 1950 1970 1980 1990 2000 2007
Germany 1195 1566 1953 2388 2580
United Kingdom 444 778 939 1250 1609 1956
France 275 769 1086 1376 1670 1887
Italy 225 723 1038 1315 1567 1676
Spain 99 392 553 752 998 1272
Netherlands 89 227 297 368 508 570
Poland 184 290 274 419 558
Belgium 65 144 200 245 305 351
Sweden 65 137 163 202 242 298
Greece 106 163 172 219 297
EU total 1387 5169 7120 9212 11498 13469
Euro zone total 842 3830 5308 6860 8516 9685
US 1978 4050 5588 7753 11072 12921
Real GDP per capita dollars
Country 1950 1970 1980 1990 2000 2007
Singapore 6314 13399 21430 35424 44619
Hong Kong 8062 15605 25918 32550 43121
Japan 2636 13856 18820 26385 28341 30585
Taiwan 3123 6657 12432 21512 27005
Korea 3058 5468 11908 18597 23850
Thailand 1252 1921 2988 55197 7058 9406
China 796 1133 1929 4414 7868
Indonesia 1236 2205 3217 4151 5186
Philippines 1481 2621 3536 3386 3955 4791
India 807 1233 1429 2002 2687 3826
Weighted average 1164 1905 2565 4823 5374 7584
US 12990 19749 24537 30994 39241 42887
Real GDP billions of dollars
Country 1950 1970 1980 1990 2000 2007
China 653 1116 2215 5601 10401
India 299 683 979 1678 2698 4323
Japan 221 1446 2198 3259 3592 3898
Indonesia 151 332 585 888 1217
Korea 99 208 510 871 1151
Taiwan 45 117 252 476 616
Thailand 25 71 140 3047 437 612
Philippines 31 101 180 220 321 451
Hong Kong 32 79 147 217 301
Singapore 13 32 65 143 203
Total 576 3294 5382 11979 15243 23173
US 1978 4050 5588 7753 11072 12921
Indicators of International Trade and Finance
Foreign
Current exchange
Trade account reserves
balance balance + gold
$billion of GDP $billion
Asia
China 1829 49 2422
Hong Kong -411 83 256
India -1231 -17 275
Indonesia 214 12 66
Japan 868 33 1024
Korea 435 32 270
Malaysia 354 147 96
Singapore 259 184 188
Taiwan 139 93 353
Thailand 127 56 138
Europe
Austria -49 19 18
Denmark 145 34 77
France -672 -20 133
Germany 2082 52 181
Greece -420 -58 5
Netherlands 510 62 40
Russia 1498 43 439
Sweden 82 65 47
Switzerland 198 110 135
UK -1408 -18 67
US -6214 -33 131
Indicators of Scientific and Engineering Activity
China India Japan Korea US Germany
Researchers in RampD 2006 927 111 5568 4187 4663 3392
Techinicians in RampD 2006 86 580 587 1200
Science amp engineering students 43 25 21 32 19 47
RampD exp of GDP 2007 1 1 3 3 3 3
High-tech exports of manuf exports 2007 30 5 19 33 29 14
Scientific amp technical journal articles 2007 59714 18194 52896 18467 209695 44408
Patent applications - residents 2005 93485 4521 367960 122188 207867 48367
Patent applications - non-residents2005 80155 67696 38979 187957 12685
Trademark applications 2005 659148 85669 136050 123064 264510 80091
Personal computers per 1000 2000 159 45 3152 2379 5852 3360
per million people 2000 data for India
of tertiary level students 1987-1997 latest year available
United Kingdom Late 18th to late 19th century
Dutch had highest productivity but little productivity growth
Spurs to UK productivity growth
Higher capital investment than Dutch
Promotion of free markets international competition
Technical advances textiles iron amp steel steam power railways
Application of scientific principles but why in UK See R C Allen The British Industrial Revolution in Global Perspective
Property rights more secure in FranceItaly and Germany develop science of steam engineDutch were highly urbanized higher literacy rate
Military demands of Royal Navy create demand for technologyDevelopment of patent systemHigh wages cheap coal consumer society
Reasons UK Dethroned
Did not explicitly foster education and technology
Capital stock grew slowly savings available but foreigninvestment as large as domestic
Diffused growth process to follower countries through freetrade foreign investment exportof technology
Currency became overvalued
US Late 19th century to
US advantages
Abundant natural resources
High rates of investment (twice UK in 1890-1950) including public investment in infrastructure and education
Large free domestic market fosters large companies enjoying scale economies funds for research
Protectionist trade policies slavery
Position strengthened by two world wars
Growth Accounting for Leaders
Annual Growth Rates (percent)
GDP per Capital per labor per labor Tech
Leader Period hour hour progress
Dutch 1700-1785 -01 na 0
UK 1785-1820 05 00 05UK 1820-1890 14 09 11
US 1890-1979 23 24 15
Source Angus Maddison Phases of Capitalist Development Authorrsquos estimate assuming 1 percent increase in capital per labor hour increases GDP per labor hour by 033 percent
Lessons from Past Leadership Changes
bull Leadership requires large GDP not just high GDPN
bull Leadership in banking and finance not just production
bull Leader should resist tendency for overvaluation of currency
bull Economy should be open to people trade ideas
bull Economy must be conducive to technical progress
Securing US Leadership after World War II
bull Post World War II reconstruction
bull Floating the dollar in 1971
bull Maturing of the dollar as a world currency
bull Facilitating export-led growth in Asia
International Economic Flows
Dollars in
bull Exports of goods and services
bull Transfers from foreigners
bull Profits received from foreign investments
bull Foreign investments in US
Dollars out
bull Imports of goods and services
bull Transfers to foreigners
bull Profits paid to foreign investors
bull US investments abroad
-8
-6
-4
-2
0
2
4
6
50 55 60 65 70 75 80 85 90 95 00 05
Net Exports 1947Q1-2009Q4
Percent of GDP (current prices)
Per
cent
Year
US Trade Balance by Type of Product 1967 and 2006
Billions of dollars
1967 2006 Change
Goods and Services 36 -7693 -7729
Goods 44 -8605 -8649
Foods 04 -89 -93
Industrial supplies 01 -241 -242
Petroleum -21 -3024 -3003
Capital goods 74 -160 -234
Autos 04 -1493 -1497
Consumer goods -21 -3170 -3149
Other 03 -427 -430
Services -09 912 921
Why Trust in the Dollar
bull A large open economy to run payments deficits large enough to meet world currency needs
bull An independent responsible central bank -- the Federal Reserve
bull A large efficient commercial banking systembull Large deep and open capital marketsbull Relatively stable pricesbull A convertible currencybull A relatively stable exchange rate with other major
currenciesbull A track record demonstrating these characteristics
Challengers to US Leadership Past and Future
bull USSR (Russia)
bull Japan
bull European Union
bull Emerging Asia
Soviet EmpireRed states Communist governmentsOrange states Leaning communist
Real GDP per capita dollars
Ten highest in 2007
Country 1950 1970 1980 1990 2000 2007
Luxembourg 14945 22906 27359 43658 63392 77783
Austria 5573 14843 20902 26023 31574 36032
Netherlands 8840 17387 21030 24619 31927 34392
Denmark 8571 16223 19055 23939 30468 34292
Belgium 7529 14894 20327 24559 29692 33798
Sweden 9252 17003 19629 23454 27174 32962
Finland 5674 13266 17845 22794 26402 32486
United Kingdom 8859 13990 16681 21742 27032 32181
Spain 3527 11561 14742 19112 24945 31446
Germany 15364 20000 24599 29051 31306
EU average 6362 12478 16375 19594 23557 27275
Euro zone average 5374 13975 18441 22361 26814 29975
US 12990 19749 24537 30994 39241 42887
Real GDP billion of dollars
Ten largest in 2007
Country 1950 1970 1980 1990 2000 2007
Germany 1195 1566 1953 2388 2580
United Kingdom 444 778 939 1250 1609 1956
France 275 769 1086 1376 1670 1887
Italy 225 723 1038 1315 1567 1676
Spain 99 392 553 752 998 1272
Netherlands 89 227 297 368 508 570
Poland 184 290 274 419 558
Belgium 65 144 200 245 305 351
Sweden 65 137 163 202 242 298
Greece 106 163 172 219 297
EU total 1387 5169 7120 9212 11498 13469
Euro zone total 842 3830 5308 6860 8516 9685
US 1978 4050 5588 7753 11072 12921
Real GDP per capita dollars
Country 1950 1970 1980 1990 2000 2007
Singapore 6314 13399 21430 35424 44619
Hong Kong 8062 15605 25918 32550 43121
Japan 2636 13856 18820 26385 28341 30585
Taiwan 3123 6657 12432 21512 27005
Korea 3058 5468 11908 18597 23850
Thailand 1252 1921 2988 55197 7058 9406
China 796 1133 1929 4414 7868
Indonesia 1236 2205 3217 4151 5186
Philippines 1481 2621 3536 3386 3955 4791
India 807 1233 1429 2002 2687 3826
Weighted average 1164 1905 2565 4823 5374 7584
US 12990 19749 24537 30994 39241 42887
Real GDP billions of dollars
Country 1950 1970 1980 1990 2000 2007
China 653 1116 2215 5601 10401
India 299 683 979 1678 2698 4323
Japan 221 1446 2198 3259 3592 3898
Indonesia 151 332 585 888 1217
Korea 99 208 510 871 1151
Taiwan 45 117 252 476 616
Thailand 25 71 140 3047 437 612
Philippines 31 101 180 220 321 451
Hong Kong 32 79 147 217 301
Singapore 13 32 65 143 203
Total 576 3294 5382 11979 15243 23173
US 1978 4050 5588 7753 11072 12921
Indicators of International Trade and Finance
Foreign
Current exchange
Trade account reserves
balance balance + gold
$billion of GDP $billion
Asia
China 1829 49 2422
Hong Kong -411 83 256
India -1231 -17 275
Indonesia 214 12 66
Japan 868 33 1024
Korea 435 32 270
Malaysia 354 147 96
Singapore 259 184 188
Taiwan 139 93 353
Thailand 127 56 138
Europe
Austria -49 19 18
Denmark 145 34 77
France -672 -20 133
Germany 2082 52 181
Greece -420 -58 5
Netherlands 510 62 40
Russia 1498 43 439
Sweden 82 65 47
Switzerland 198 110 135
UK -1408 -18 67
US -6214 -33 131
Indicators of Scientific and Engineering Activity
China India Japan Korea US Germany
Researchers in RampD 2006 927 111 5568 4187 4663 3392
Techinicians in RampD 2006 86 580 587 1200
Science amp engineering students 43 25 21 32 19 47
RampD exp of GDP 2007 1 1 3 3 3 3
High-tech exports of manuf exports 2007 30 5 19 33 29 14
Scientific amp technical journal articles 2007 59714 18194 52896 18467 209695 44408
Patent applications - residents 2005 93485 4521 367960 122188 207867 48367
Patent applications - non-residents2005 80155 67696 38979 187957 12685
Trademark applications 2005 659148 85669 136050 123064 264510 80091
Personal computers per 1000 2000 159 45 3152 2379 5852 3360
per million people 2000 data for India
of tertiary level students 1987-1997 latest year available
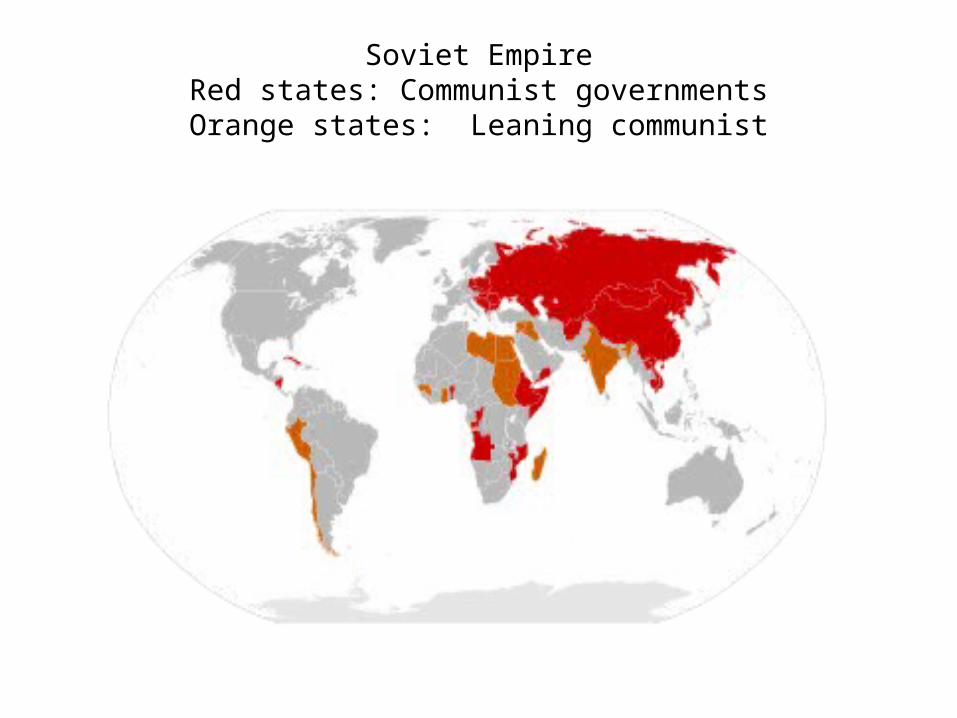
Real GDP per capita dollars
Ten highest in 2007
Country 1950 1970 1980 1990 2000 2007
Luxembourg 14945 22906 27359 43658 63392 77783
Austria 5573 14843 20902 26023 31574 36032
Netherlands 8840 17387 21030 24619 31927 34392
Denmark 8571 16223 19055 23939 30468 34292
Belgium 7529 14894 20327 24559 29692 33798
Sweden 9252 17003 19629 23454 27174 32962
Finland 5674 13266 17845 22794 26402 32486
United Kingdom 8859 13990 16681 21742 27032 32181
Spain 3527 11561 14742 19112 24945 31446
Germany 15364 20000 24599 29051 31306
EU average 6362 12478 16375 19594 23557 27275
Euro zone average 5374 13975 18441 22361 26814 29975
US 12990 19749 24537 30994 39241 42887
Real GDP billion of dollars
Ten largest in 2007
Country 1950 1970 1980 1990 2000 2007
Germany 1195 1566 1953 2388 2580
United Kingdom 444 778 939 1250 1609 1956
France 275 769 1086 1376 1670 1887
Italy 225 723 1038 1315 1567 1676
Spain 99 392 553 752 998 1272
Netherlands 89 227 297 368 508 570
Poland 184 290 274 419 558
Belgium 65 144 200 245 305 351
Sweden 65 137 163 202 242 298
Greece 106 163 172 219 297
EU total 1387 5169 7120 9212 11498 13469
Euro zone total 842 3830 5308 6860 8516 9685
US 1978 4050 5588 7753 11072 12921
Real GDP per capita dollars
Country 1950 1970 1980 1990 2000 2007
Singapore 6314 13399 21430 35424 44619
Hong Kong 8062 15605 25918 32550 43121
Japan 2636 13856 18820 26385 28341 30585
Taiwan 3123 6657 12432 21512 27005
Korea 3058 5468 11908 18597 23850
Thailand 1252 1921 2988 55197 7058 9406
China 796 1133 1929 4414 7868
Indonesia 1236 2205 3217 4151 5186
Philippines 1481 2621 3536 3386 3955 4791
India 807 1233 1429 2002 2687 3826
Weighted average 1164 1905 2565 4823 5374 7584
US 12990 19749 24537 30994 39241 42887
Real GDP billions of dollars
Country 1950 1970 1980 1990 2000 2007
China 653 1116 2215 5601 10401
India 299 683 979 1678 2698 4323
Japan 221 1446 2198 3259 3592 3898
Indonesia 151 332 585 888 1217
Korea 99 208 510 871 1151
Taiwan 45 117 252 476 616
Thailand 25 71 140 3047 437 612
Philippines 31 101 180 220 321 451
Hong Kong 32 79 147 217 301
Singapore 13 32 65 143 203
Total 576 3294 5382 11979 15243 23173
US 1978 4050 5588 7753 11072 12921
Indicators of International Trade and Finance
Foreign
Current exchange
Trade account reserves
balance balance + gold
$billion of GDP $billion
Asia
China 1829 49 2422
Hong Kong -411 83 256
India -1231 -17 275
Indonesia 214 12 66
Japan 868 33 1024
Korea 435 32 270
Malaysia 354 147 96
Singapore 259 184 188
Taiwan 139 93 353
Thailand 127 56 138
Europe
Austria -49 19 18
Denmark 145 34 77
France -672 -20 133
Germany 2082 52 181
Greece -420 -58 5
Netherlands 510 62 40
Russia 1498 43 439
Sweden 82 65 47
Switzerland 198 110 135
UK -1408 -18 67
US -6214 -33 131
Indicators of Scientific and Engineering Activity
China India Japan Korea US Germany
Researchers in RampD 2006 927 111 5568 4187 4663 3392
Techinicians in RampD 2006 86 580 587 1200
Science amp engineering students 43 25 21 32 19 47
RampD exp of GDP 2007 1 1 3 3 3 3
High-tech exports of manuf exports 2007 30 5 19 33 29 14
Scientific amp technical journal articles 2007 59714 18194 52896 18467 209695 44408
Patent applications - residents 2005 93485 4521 367960 122188 207867 48367
Patent applications - non-residents2005 80155 67696 38979 187957 12685
Trademark applications 2005 659148 85669 136050 123064 264510 80091
Personal computers per 1000 2000 159 45 3152 2379 5852 3360
per million people 2000 data for India
of tertiary level students 1987-1997 latest year available
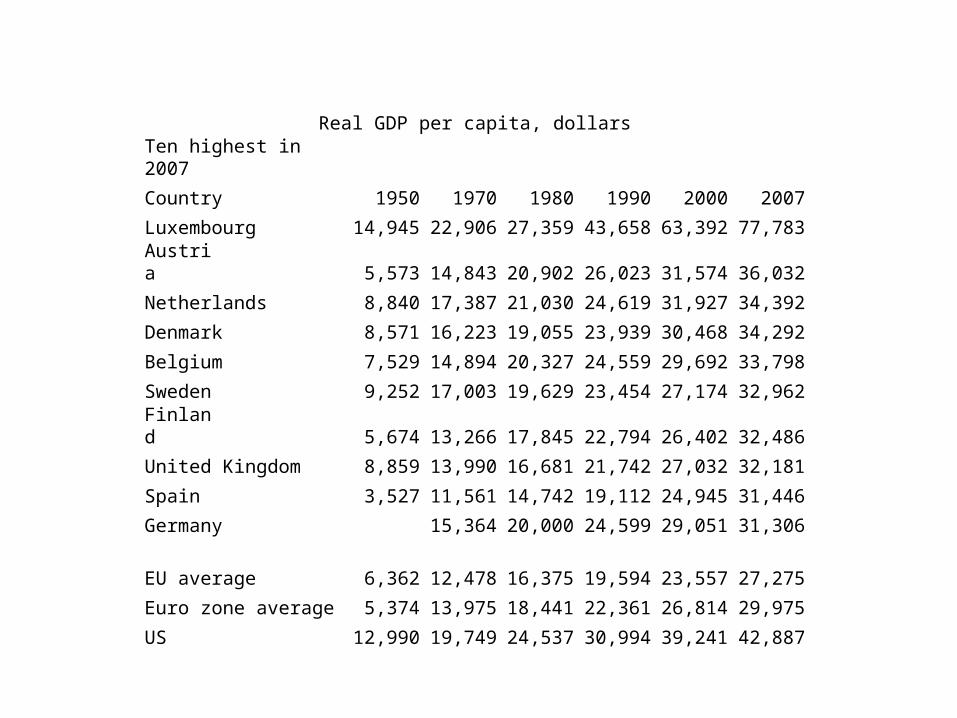
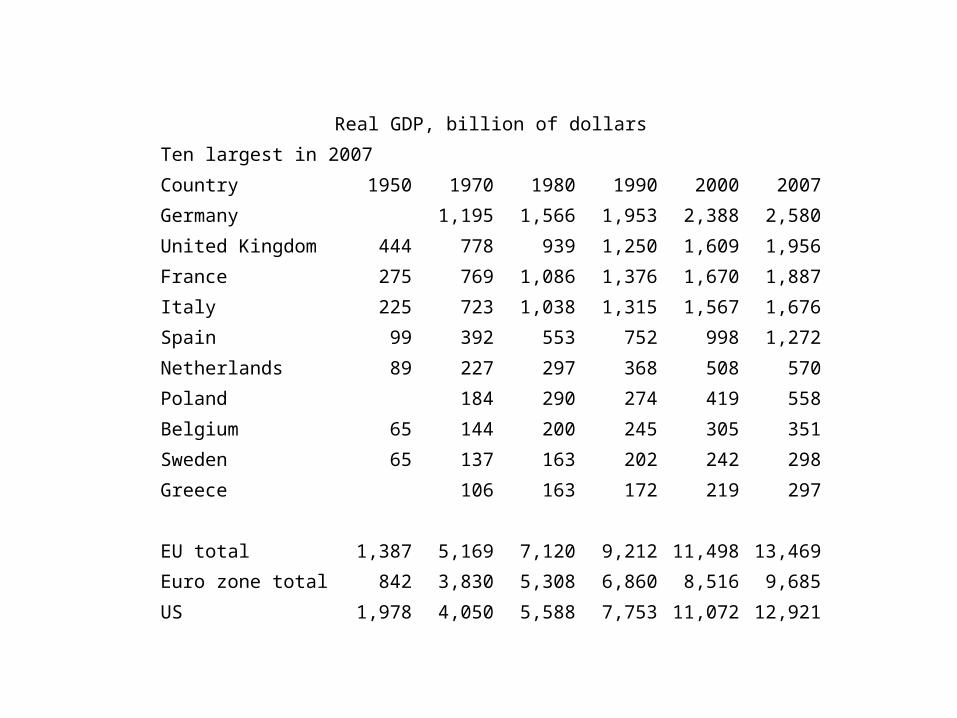
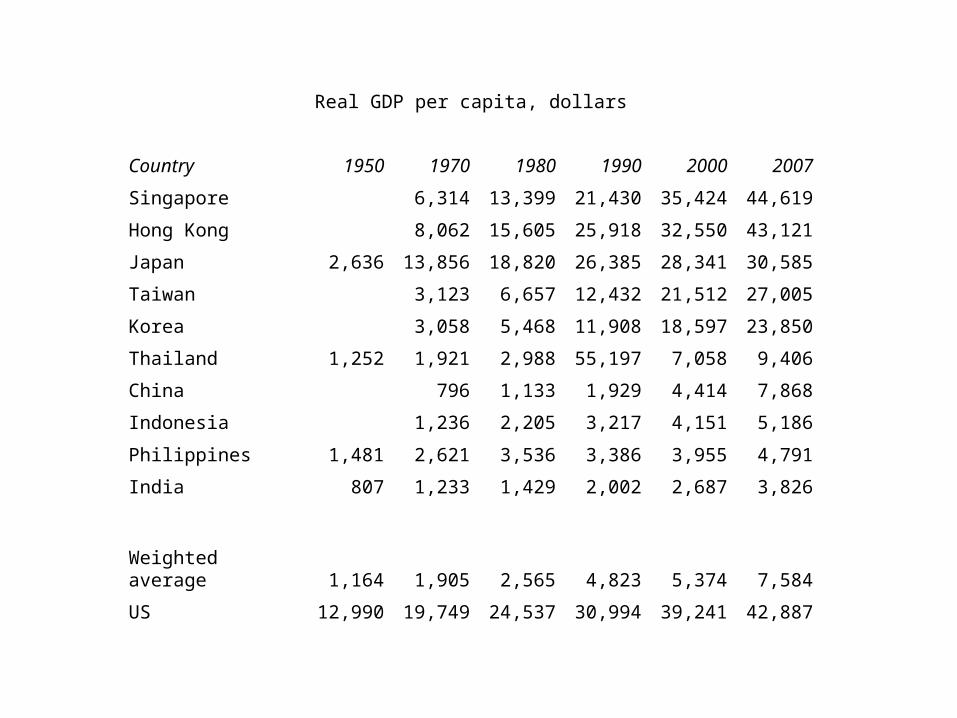
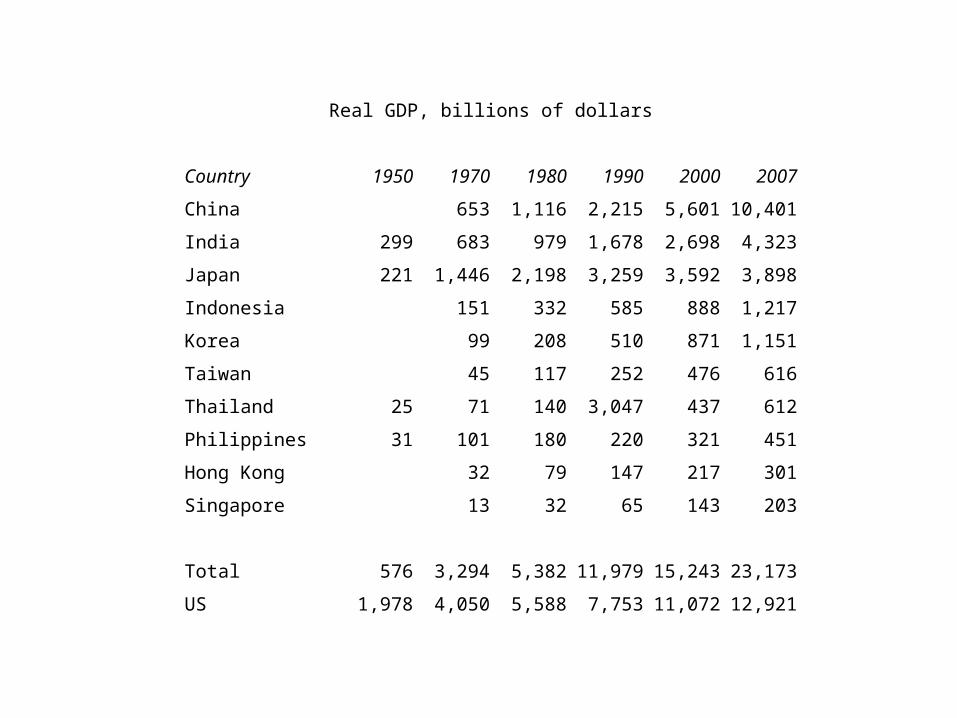
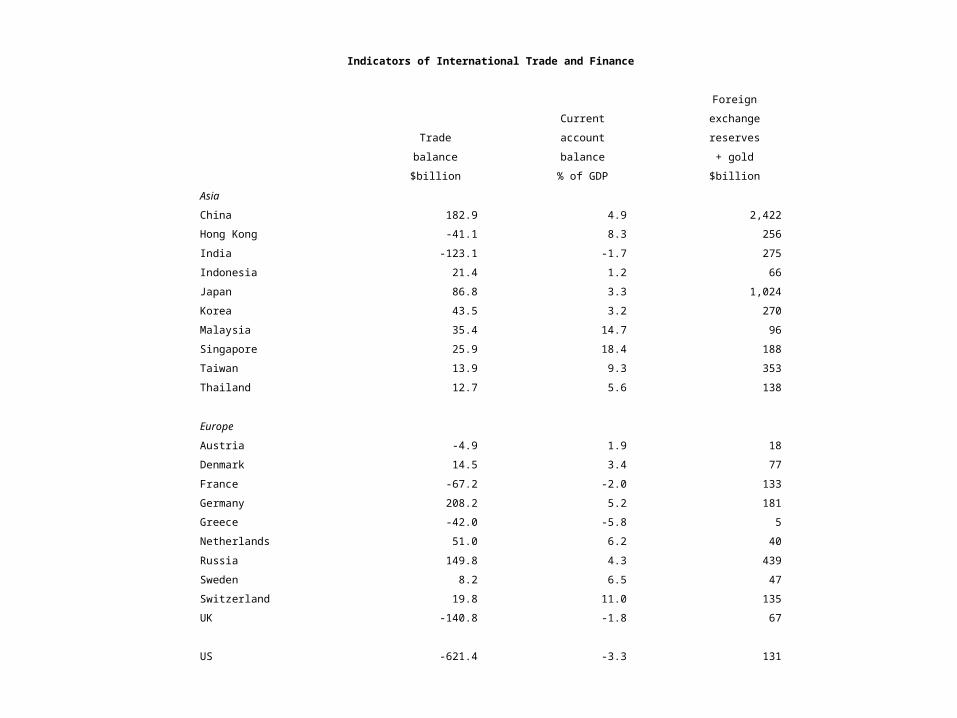