Embed Size (px)
Citation preview
Committee on the Global Financial System
CGFS Papers No 51
EME banking systems and regional financial integration Report submitted by a Study Group established by the Committee on the Global Financial System
The Group was chaired by Andrew Khoo, Monetary Authority of Singapore
March 2014
JEL Classification: F36, G15, G2

This publication is available on the BIS website (www.bis.org).
© Bank for International Settlements 2014. All rights reserved. Brief excerpts may be reproduced or translated provided the source is stated.
ISBN 92-9131-310-6 (print)
ISBN 92-9197-310-6 (online)
CGFS – EME banking systems and regional financial integration iii
Preface
Regional financial integration among emerging market economies (EMEs) is on the rise. Specifically, there are signs that banking groups headquartered in EMEs have started a process of expansion that will tend to increase their importance in regional financial systems; for example, by raising the intra-regional share of portfolio investment or of foreign bank ownership.
To better understand these developments, in November 2012, the Committee on the Global Financial System (CGFS) established a Study Group chaired by Andrew Khoo (Monetary Authority of Singapore) to develop a central bank perspective on the system-wide implications of current regional financial integration trends and to draw broad conclusions for policymakers.
This report presents the Group’s findings. It argues that, while regional bank expansion has the potential to affect the global financial system in a variety of ways, the still small overall footprint of regional banking groups suggests that current trends are unlikely to have significantly changed the risk profile of EME banking systems at this stage. Yet, broader effects are possible over time, as balance sheet capacity for further cross-border expansion exists and as business models of the larger, more systemically important EME bank affiliates have started to converge with those of similarly sized, more regionally focused advanced economy peers. With time, this may warrant policy responses in a number of areas, including efforts to improve regulatory environments and market infrastructures, and crisis prevention and resolution measures.
I hope that the report, and the metrics described therein, will prove to be an important input to ongoing discussions on cross-border supervisory arrangements as well as a valuable resource for researchers and market practitioners.
William C Dudley
Chairman, Committee on the Global Financial System President, Federal Reserve Bank of New York


CGFS – EME banking systems and regional financial integration v
Contents
Preface ........................................................................................................................................................ iii
Contents ...................................................................................................................................................... v
Executive summary ................................................................................................................................. 1
1. Introduction ....................................................................................................................................... 3
2. Trends and drivers ........................................................................................................................... 4
2.1 Progressive regionalisation of EME financial sectors .............................................. 4
2.2 EME bank expansion in the post-crisis period ........................................................ 10
2.3 EME cross-border expansion: drivers and differentiating factors .................... 14
2.4 Assessing the scope for stronger EME bank expansion ...................................... 18
3. Business models ............................................................................................................................. 19
3.1 Foreign EME bank balance sheet and performance metrics ............................. 20
3.2 Sources of heterogeneity ................................................................................................. 22
4. Implications for markets ............................................................................................................. 27
4.1 Impact on the provision of financial services ........................................................... 27
4.2 Possible risks to financial stability ................................................................................ 28
4.3 Risk management challenges for banks and markets .......................................... 30
5. Implications for policy ................................................................................................................. 32
5.1 Improving market infrastructure and regulatory environment ........................ 32
5.2 Crisis prevention and resolution ................................................................................... 35
References ................................................................................................................................................ 39
Annex 1 Study Group mandate ...................................................................................................... 43
Scope of work ................................................................................................................................ 43
Process .............................................................................................................................................. 44
Annex 2 Additional evidence on trends and drivers .............................................................. 45
Annex 3 EME bank affiliates’ business models: data set description and
further detail ......................................................................................................................... 52
Annex 4 Monitoring regionalisation trends ............................................................................... 54
Members of the Study Group ........................................................................................................... 55

CGFS – EME banking systems and regional financial integration 1
Executive summary
Regional emerging market economy (EME) financial integration is on the rise. There are signs that banking groups headquartered in EMEs (EME banks) have stepped up their expansion activity, which is expected to raise their importance in regional financial systems. While this has the potential to affect the global financial system in a variety of ways, the still small overall footprint of these banking groups suggests that current trends are unlikely to have significantly changed the risk profile of EME banking systems at this stage. Yet, broader effects are possible over time and may warrant policy responses in a number of areas. Specific findings include:
Progressive growth in international claims on EMEs. Various indicators suggest that EME banking sector internationalisation is increasing. For example, aggregate cross-border claims (which include loans, deposits, debt securities and other financial instruments) on economies in the three major EME regions have increased almost threefold in the past decade. Although cross-border claims dipped sharply in 2008, they have since surpassed pre-crisis levels.
Growing international role of EME banks in the post-crisis period, with a strong regional orientation. The international expansion of EME banks has gained momentum since the 2008–09 financial crisis. This is evident in all EME regions, but has gained particular traction in Southeast Asia, Central America, and the Commonwealth of Independent States. EME bank participation in syndicated lending markets has also grown in recent years, offsetting in part retrenchment by euro area institutions. Expansion strategies demonstrate a strong regional orientation, with cross-border merger and acquisition activity among EME banks, for example, predominantly taking place within the same region.
Heterogeneity in the scale and mode of banks’ cross-border expansion. There is considerable heterogeneity at the institutional and country level regarding the degree of EME bank international activity, and strategies for market penetration in other EMEs. In aggregate, EME bank foreign presence remains small relative to parent bank balance sheets and host country financial systems. Yet, there are notable exceptions, particularly in Southeast Asia, where EME banks facing more saturated banking markets have dedicated larger shares of their balance sheets to overseas lending. Expansion strategies also vary, with some banks pursuing largely organic expansions and others preferring strategic acquisitions. To some extent, this may be driven by underlying business models, with retail banking-focused operations favouring subsidiaries, and more centrally funded business lines tending to favour branches. In some countries, regulatory developments have also been a factor driving foreign banks to establish subsidiaries.
Drivers of current bank expansion are similar to past experience, but within a more competitive environment. Many of the drivers of current bank expansion in EME regions, such as reduced opportunities at home and pursuit of domestic clients, are similar to the drivers of past expansions into EMEs.
In the past, increased foreign bank participation benefited from extensive financial sector liberalisation, often in the wake of EME financial crises. Today, the conditions in many EME banking systems have changed significantly, with tighter regulatory environments and more competitive domestic banking sectors. On this basis, EME banks may be better positioned to capture significant market share in smaller frontier economies, where divestments or more limited activities by other financial institutions create opportunities for new players.
2 CGFS – EME banking systems and regional financial integration
Relatively traditional, but evolving, business models. While the business models of regionally expanding EME banks differ by region, ownership structure, and size of foreign operations, key metrics suggest a greater focus on retail banking and deposit funding activities than many of their advanced economy peers. Higher capitalisation ratios of EME banks, in turn, suggest scope for further cross-border expansion, implying that internationalisation trends may continue to be fairly sizeable at least for individual countries.
At the same time, the evolution of balance sheet metrics for EME bank foreign affiliates points to rising convergence with longer-established advanced economy peers. This is particularly true for larger, more systemically important EME bank affiliates, which increasingly resemble their similar-sized, more regionally focused advanced economy peers – likely due to recent acquisitions as well as post-crisis adjustments to business and funding models. These developments suggest that banks’ risk profiles are likely to further converge with time, as foreign affiliates of EME banks become increasingly active. Indeed, EME foreign affiliates have engaged in relatively aggressive new lending in EME markets since 2009. And, while much of this new activity is backed by deposit funding, there appear to be pockets of relatively greater reliance on interbank and market financing.
Costs and benefits. Many of the trade-offs currently faced by EMEs resemble, although in a new guise, the earlier experience of financial integration of EMEs with advanced economies. Potential benefits, such as allocative efficiency, better availability of specialised financial services (eg trade and project finance), market deepening and regional risk-sharing, will have to be traded off against potential costs. The flip side of diversification benefits, for example, is greater potential for spillovers at the institutional and system levels, particularly for EMEs where foreign bank operations account for a relatively large share of host system assets. This, in turn, raises new challenges in terms of the complexity and management of regional banks’ operations, and can strain existing market and supervisory infrastructures.
Policy implications. For policymakers, these findings imply scope for action in two broad areas: (i) improving regulatory environments and market infrastructures, and (ii) crisis prevention and resolution. In the former area, constraints on the ability of banks to better hedge their balance sheet risks can be eased by stepping up efforts to improve local market infrastructure (eg further developing local markets for bonds and related hedging instruments), while formulating explicit supervisory guidance to help improve banks’ risk management and stress testing frameworks (eg incorporating regional shocks into stress test scenarios). In addition, supervisors may need to enhance their efforts to monitor and address balance sheet mismatches, such as those arising from foreign currency funding, while balancing the costs and benefits of any associated regulatory measures (eg subsidiarisation or constraints on certain types of funding).
In the area of crisis prevention and resolution, in turn, steps can be taken to better address spillovers as well as strengthen existing safety nets. In both cases, regional efforts have a particular role to play, building on established frameworks, such as supervisory colleges or regional forums. This can be particularly challenging in countries where supervisors and other authorities are relatively tightly resourced or have limited experience with cross-border issues. As regards safety nets, despite their overall relatively small size, regional financial arrangements, when sufficiently developed, offer a number of possible advantages in terms of the provision of confidence-enhancing effects and in helping to address idiosyncratic and regional shocks – provided that effective conditionality arrangements can be put in place.
CGFS – EME banking systems and regional financial integration 3
1. Introduction
The past few years have seen strong growth in emerging market economies (EMEs), combined with strengthening trade linkages at both the regional and international levels. However, financial integration generally remains less advanced. While there are signs that key regional banking groups headquartered in EMEs, supported in part by regional financial cooperation arrangements, have started a process of international expansion that is likely to increase their footprint in regional banking and financial systems, these developments are still in their early stages.
These trends, if sustained and sufficiently broad-based, have the potential to affect the global financial system in a variety of ways. By triggering a stronger regional integration of financial markets, they can change the nature and importance of interlinkages across and within regions, alter capital flow patterns, and affect the susceptibility of regional economies to external shocks. More generally, structural changes in the balance of activities performed by regionally and globally active financial institutions may affect market functioning, particularly in times of stress, and financial stability.
Against this background, at its November 2012 meeting, the Committee on the Global Financial System (CGFS) decided to establish a Study Group, chaired by Andrew Khoo (Monetary Authority of Singapore), to explore issues related to international expansion trends among regionally focused banking groups in EME financial systems and their implications for markets and policy.1
This report documents the Group’s findings, which are based on data from the BIS international banking statistics (IBS) and various other public sources, reviews of the existing academic literature and case studies written up by Group members. The Group also reached out to the private sector and central banks from non-CGFS jurisdictions. Specifically, representatives of banks with a strong presence across Asia were invited to participate in one of the Group’s meetings in Singapore and Group members engaged in extensive bilateral interviews with banks headquartered or operating in their respective jurisdictions. The Group also benefited from discussions at a variety of central bank meetings.2 In addition, individual Group members reached out to selected central bank contacts on a bilateral basis.
The report is organised as follows. Section 2 documents current financial regionalisation trends and their drivers, corroborating earlier anecdotal evidence of a development towards greater financial integration within EME regions. Section 3 provides some preliminary analysis of the business models and financial performance of EME foreign affiliates as compared with advanced economy bank operations in EMEs. Sections 4 and 5, finally, highlight implications for markets and policy.
1 See Annex 1 for the Study Group’s mandate; a list of Group members is attached at the end of this
report. 2 These include the February 2013 Governors and CEOs meeting in Asia, the May 2013 meeting of
African Governors, the June 2013 meeting of Latin American and Caribbean Governors, the July 2013 workshop on cross-border financial linkages in Hong Kong, and the October 2013 EMEAP Monetary and Financial Stability Committee working-level meeting.
4 CGFS – EME banking systems and regional financial integration
2. Trends and drivers
Financial regionalisation – defined as the increasing regional integration of EME banking systems and financial markets – is progressing along a number of broad common trends. Despite some differences across regions and financial institutions, these trends largely corroborate previous anecdotal evidence of greater financial integration within EME regions, which may have systemic implications over time. However, given that these changes start from a low base in many cases, they are likely to only gradually change the risk profile of larger EME banking systems, providing policymakers with room to identify appropriate tools to monitor these developments and devise appropriate policy responses.
To set the scene for a discussion of these responses, this chapter identifies trends in EME financial regionalisation over the past decade, with a particular focus on the post-crisis period, leveraging BIS statistics on international bank claims, international bond issuance data, IMF statistics on portfolio flows, syndicated loan underwriting data, and changes in foreign ownership shares in EME banks.3 Given the predominance of bank financing in EMEs, a primary channel for EME financial integration has been through the cross-border expansion of EME banking activities. Thus, the analysis focuses particularly on common drivers of EME bank expansion, corroborating a strong regional orientation to EME bank growth to date. At the same time, structural factors, relative financial strength and competitive dynamics are likely to play an important role in defining the scope and nature of further EME financial integration, and how it evolves across countries and regions going forward.
2.1 Progressive regionalisation of EME financial sectors
Various indicators corroborate the view that EME financial integration, both regional and global, is on the rise. Recent trends in international bank claims on EME borrowers, international debt issuance by financial and non-financial EME corporates, and EME portfolio investment surveys all show strong growth in cross-border claims on EMEs combined with growing intraregional financing flows since the early 2000s. There are also signs of a substantial recovery in growth momentum following the financial crisis in many EMEs, particularly in Asia.
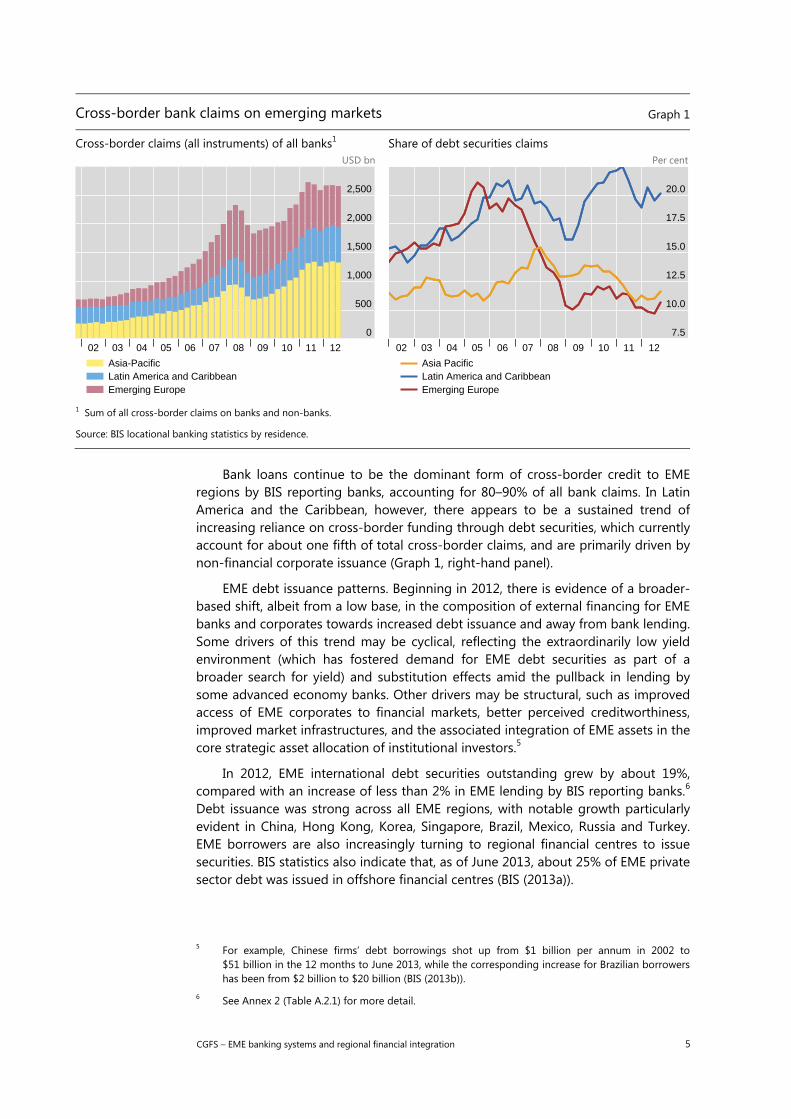
Cross-border bank credit growth. BIS locational banking statistics suggest that aggregate cross-border claims on economies in the Asia-Pacific, Latin America and Caribbean, and emerging European regions have increased almost threefold in the past decade (Graph 1, left-hand panel).4 Although cross-border claims on EMEs dipped sharply in 2008, they have since surpassed pre-crisis levels and, as of the end of 2012, stood at over $2.5 trillion. In terms of flows, the majority of the recent increase was accounted for by lending to China, Brazil and Russia, while approximately half of the stock of all cross-border claims on EMEs is on the Asia-Pacific region.
3 For the purposes of this report, emerging market economies are defined as including all countries
classified as “developing” for the purposes of the BIS statistics, as well as offshore centres, such as Hong Kong and Singapore, which are conduits for significant EME activity.
4 The BIS publishes data on cross-border bank claims based on information reported to national authorities by internationally active banks headquartered in most advanced economies and a small sample of EMEs. For more detail, see footnote 9 below and CGFS (2012a).
CGFS – EME banking systems and regional financial integration 5
Cross-border bank claims on emerging markets Graph 1
Cross-border claims (all instruments) of all banks1 USD bn
Share of debt securities claims Per cent
1 Sum of all cross-border claims on banks and non-banks.
Source: BIS locational banking statistics by residence.
Bank loans continue to be the dominant form of cross-border credit to EME regions by BIS reporting banks, accounting for 80–90% of all bank claims. In Latin America and the Caribbean, however, there appears to be a sustained trend of increasing reliance on cross-border funding through debt securities, which currently account for about one fifth of total cross-border claims, and are primarily driven by non-financial corporate issuance (Graph 1, right-hand panel).
EME debt issuance patterns. Beginning in 2012, there is evidence of a broader-based shift, albeit from a low base, in the composition of external financing for EME banks and corporates towards increased debt issuance and away from bank lending. Some drivers of this trend may be cyclical, reflecting the extraordinarily low yield environment (which has fostered demand for EME debt securities as part of a broader search for yield) and substitution effects amid the pullback in lending by some advanced economy banks. Other drivers may be structural, such as improved access of EME corporates to financial markets, better perceived creditworthiness, improved market infrastructures, and the associated integration of EME assets in the core strategic asset allocation of institutional investors.5
In 2012, EME international debt securities outstanding grew by about 19%, compared with an increase of less than 2% in EME lending by BIS reporting banks.6 Debt issuance was strong across all EME regions, with notable growth particularly evident in China, Hong Kong, Korea, Singapore, Brazil, Mexico, Russia and Turkey. EME borrowers are also increasingly turning to regional financial centres to issue securities. BIS statistics also indicate that, as of June 2013, about 25% of EME private sector debt was issued in offshore financial centres (BIS (2013a)).
5 For example, Chinese firms’ debt borrowings shot up from $1 billion per annum in 2002 to
$51 billion in the 12 months to June 2013, while the corresponding increase for Brazilian borrowers has been from $2 billion to $20 billion (BIS (2013b)).
6 See Annex 2 (Table A.2.1) for more detail.
0
500
1,000
1,500
2,000
2,500
02 03 04 05 06 07 08 09 10 11 12
Asia-PacificLatin America and CaribbeanEmerging Europe
7.5
10.0
12.5
15.0
17.5
20.0
02 03 04 05 06 07 08 09 10 11 12
Asia PacificLatin America and CaribbeanEmerging Europe
6 CGFS – EME banking systems and regional financial integration
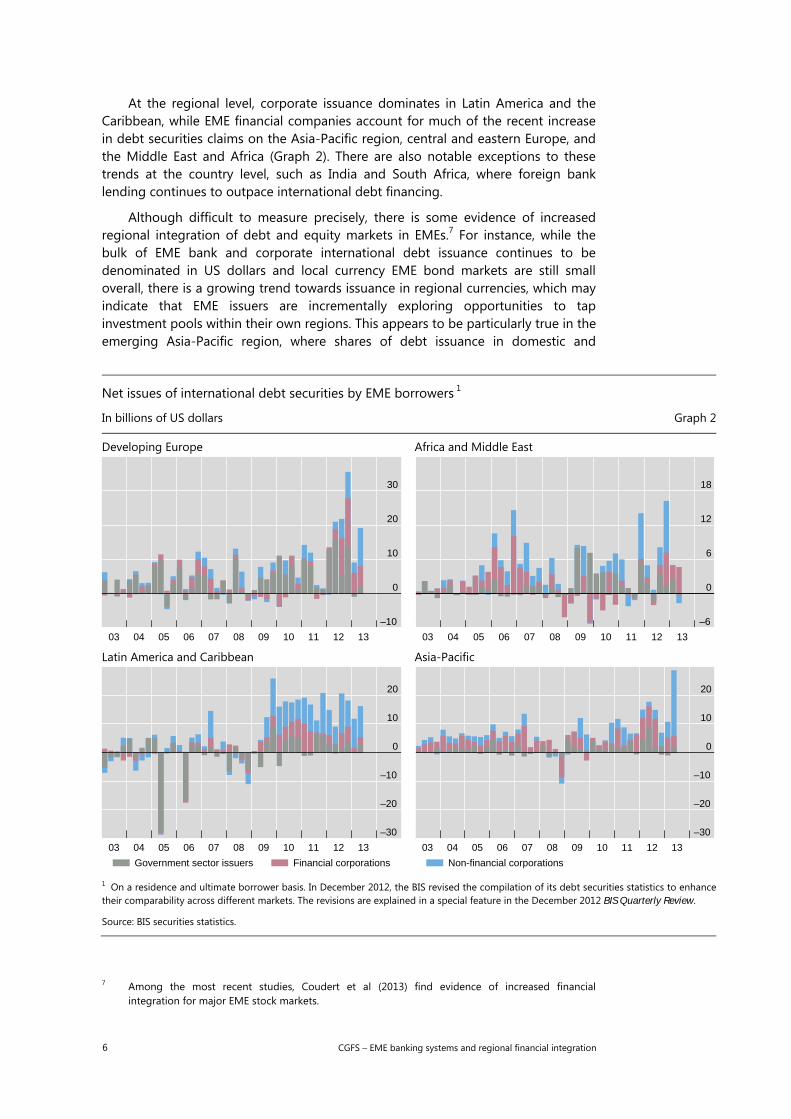
At the regional level, corporate issuance dominates in Latin America and the Caribbean, while EME financial companies account for much of the recent increase in debt securities claims on the Asia-Pacific region, central and eastern Europe, and the Middle East and Africa (Graph 2). There are also notable exceptions to these trends at the country level, such as India and South Africa, where foreign bank lending continues to outpace international debt financing.
Although difficult to measure precisely, there is some evidence of increased regional integration of debt and equity markets in EMEs.7 For instance, while the bulk of EME bank and corporate international debt issuance continues to be denominated in US dollars and local currency EME bond markets are still small overall, there is a growing trend towards issuance in regional currencies, which may indicate that EME issuers are incrementally exploring opportunities to tap investment pools within their own regions. This appears to be particularly true in the emerging Asia-Pacific region, where shares of debt issuance in domestic and
Net issues of international debt securities by EME borrowers 1
In billions of US dollars Graph 2
Developing Europe Africa and Middle East
Latin America and Caribbean Asia-Pacific
1 On a residence and ultimate borrower basis. In December 2012, the BIS revised the compilation of its debt securities statistics to enhance their comparability across different markets. The revisions are explained in a special feature in the December 2012 BIS Quarterly Review.
Source: BIS securities statistics.
7 Among the most recent studies, Coudert et al (2013) find evidence of increased financial
integration for major EME stock markets.
–10
0
10
20
30
03 04 05 06 07 08 09 10 11 12 13
–6
0
6
12
18
03 04 05 06 07 08 09 10 11 12 13
–30
–20
–10
0
10
20
03 04 05 06 07 08 09 10 11 12 13
Government sector issuers Financial corporations
–30
–20
–10
0
10
20
03 04 05 06 07 08 09 10 11 12 13
Non-financial corporations
CGFS – EME banking systems and regional financial integration 7
Local and regional currency shares of debt securities outstanding
International debt securities, amounts outstanding Graph 3
Emerging Europe1 Per cent USD bn
Emerging Asia-Pacific2 Per cent USD bn
Latin America3 Per cent USD bn
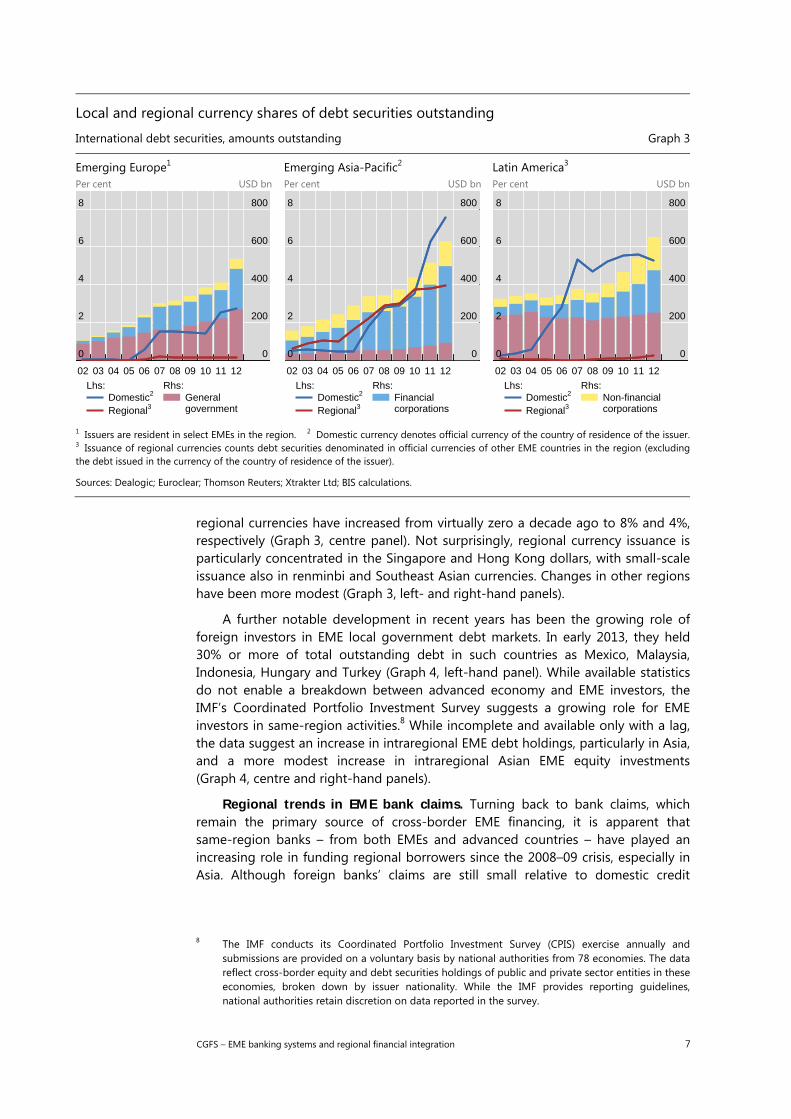
1 Issuers are resident in select EMEs in the region. 2 Domestic currency denotes official currency of the country of residence of the issuer.3 Issuance of regional currencies counts debt securities denominated in official currencies of other EME countries in the region (excluding the debt issued in the currency of the country of residence of the issuer).
Sources: Dealogic; Euroclear; Thomson Reuters; Xtrakter Ltd; BIS calculations.
regional currencies have increased from virtually zero a decade ago to 8% and 4%, respectively (Graph 3, centre panel). Not surprisingly, regional currency issuance is particularly concentrated in the Singapore and Hong Kong dollars, with small-scale issuance also in renminbi and Southeast Asian currencies. Changes in other regions have been more modest (Graph 3, left- and right-hand panels).
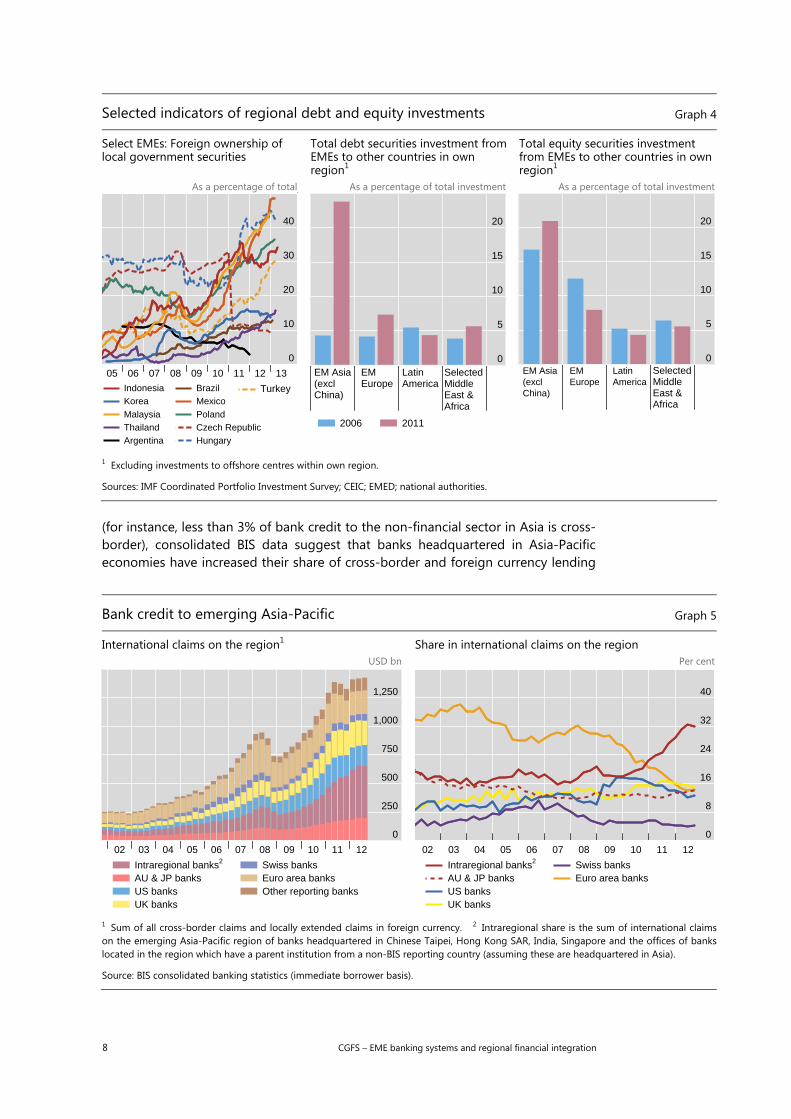
A further notable development in recent years has been the growing role of foreign investors in EME local government debt markets. In early 2013, they held 30% or more of total outstanding debt in such countries as Mexico, Malaysia, Indonesia, Hungary and Turkey (Graph 4, left-hand panel). While available statistics do not enable a breakdown between advanced economy and EME investors, the IMF’s Coordinated Portfolio Investment Survey suggests a growing role for EME investors in same-region activities.8 While incomplete and available only with a lag, the data suggest an increase in intraregional EME debt holdings, particularly in Asia, and a more modest increase in intraregional Asian EME equity investments (Graph 4, centre and right-hand panels).
Regional trends in EME bank claims. Turning back to bank claims, which remain the primary source of cross-border EME financing, it is apparent that same-region banks – from both EMEs and advanced countries – have played an increasing role in funding regional borrowers since the 2008–09 crisis, especially in Asia. Although foreign banks’ claims are still small relative to domestic credit
8 The IMF conducts its Coordinated Portfolio Investment Survey (CPIS) exercise annually and
submissions are provided on a voluntary basis by national authorities from 78 economies. The data reflect cross-border equity and debt securities holdings of public and private sector entities in these economies, broken down by issuer nationality. While the IMF provides reporting guidelines, national authorities retain discretion on data reported in the survey.
0
2
4
6
8
0
200
400
600
800
02 03 04 05 06 07 08 09 10 11 12
Domestic2
Regional3
Lhs:Generalgovernment
Rhs:
0
2
4
6
8
0
200
400
600
800
02 03 04 05 06 07 08 09 10 11 12
Domestic2
Regional3
Lhs:Financialcorporations
Rhs:
0
2
4
6
8
0
200
400
600
800
02 03 04 05 06 07 08 09 10 11 12
Domestic2
Regional3
Lhs:Non-financialcorporations
Rhs:
8 CGFS – EME banking systems and regional financial integration
Selected indicators of regional debt and equity investments Graph 4
Select EMEs: Foreign ownership of local government securities
As a percentage of total
Total debt securities investment from EMEs to other countries in own region1
As a percentage of total investment
Total equity securities investment from EMEs to other countries in own region1
As a percentage of total investment
1 Excluding investments to offshore centres within own region.
Sources: IMF Coordinated Portfolio Investment Survey; CEIC; EMED; national authorities.
(for instance, less than 3% of bank credit to the non-financial sector in Asia is cross-border), consolidated BIS data suggest that banks headquartered in Asia-Pacific economies have increased their share of cross-border and foreign currency lending
Bank credit to emerging Asia-Pacific Graph 5
International claims on the region1 USD bn
Share in international claims on the region Per cent
1 Sum of all cross-border claims and locally extended claims in foreign currency. 2 Intraregional share is the sum of international claims on the emerging Asia-Pacific region of banks headquartered in Chinese Taipei, Hong Kong SAR, India, Singapore and the offices of banks located in the region which have a parent institution from a non-BIS reporting country (assuming these are headquartered in Asia).
Source: BIS consolidated banking statistics (immediate borrower basis).
0
10
20
30
40
05 06 07 08 09 10 11 12 13
IndonesiaKoreaMalaysiaThailandArgentina
BrazilMexicoPolandCzech RepublicHungary
Turkey
0
5
10
15
20
EM Asia(exclChina)
EMEurope
LatinAmerica
Selected Middle East &Africa
2006 2011
0
5
10
15
20
EM Asia(exclChina)
EMEurope
LatinAmerica
Selected Middle East &Africa
0
250
500
750
1,000
1,250
02 03 04 05 06 07 08 09 10 11 12
Intraregional banks2
AU & JP banksUS banksUK banks
Swiss banksEuro area banksOther reporting banks
0
8
16
24
32
40
02 03 04 05 06 07 08 09 10 11 12
Intraregional banks2
AU & JP banksUS banksUK banks
Swiss banksEuro area banks
CGFS – EME banking systems and regional financial integration 9
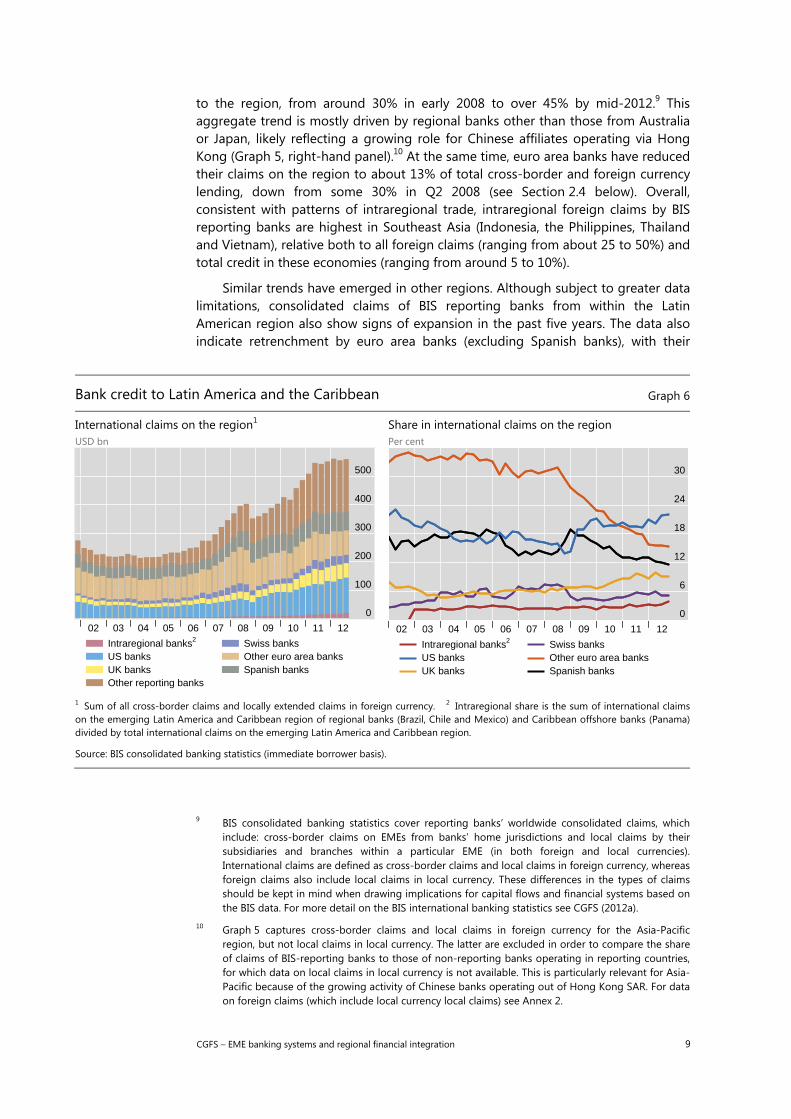
to the region, from around 30% in early 2008 to over 45% by mid-2012.9 This aggregate trend is mostly driven by regional banks other than those from Australia or Japan, likely reflecting a growing role for Chinese affiliates operating via Hong Kong (Graph 5, right-hand panel).10 At the same time, euro area banks have reduced their claims on the region to about 13% of total cross-border and foreign currency lending, down from some 30% in Q2 2008 (see Section 2.4 below). Overall, consistent with patterns of intraregional trade, intraregional foreign claims by BIS reporting banks are highest in Southeast Asia (Indonesia, the Philippines, Thailand and Vietnam), relative both to all foreign claims (ranging from about 25 to 50%) and total credit in these economies (ranging from around 5 to 10%).
Similar trends have emerged in other regions. Although subject to greater data limitations, consolidated claims of BIS reporting banks from within the Latin American region also show signs of expansion in the past five years. The data also indicate retrenchment by euro area banks (excluding Spanish banks), with their
Bank credit to Latin America and the Caribbean Graph 6
International claims on the region1 USD bn
Share in international claims on the region Per cent
1 Sum of all cross-border claims and locally extended claims in foreign currency. 2 Intraregional share is the sum of international claims on the emerging Latin America and Caribbean region of regional banks (Brazil, Chile and Mexico) and Caribbean offshore banks (Panama) divided by total international claims on the emerging Latin America and Caribbean region.
Source: BIS consolidated banking statistics (immediate borrower basis).
9 BIS consolidated banking statistics cover reporting banks’ worldwide consolidated claims, which
include: cross-border claims on EMEs from banks’ home jurisdictions and local claims by their subsidiaries and branches within a particular EME (in both foreign and local currencies). International claims are defined as cross-border claims and local claims in foreign currency, whereas foreign claims also include local claims in local currency. These differences in the types of claims should be kept in mind when drawing implications for capital flows and financial systems based on the BIS data. For more detail on the BIS international banking statistics see CGFS (2012a).
10 Graph 5 captures cross-border claims and local claims in foreign currency for the Asia-Pacific region, but not local claims in local currency. The latter are excluded in order to compare the share of claims of BIS-reporting banks to those of non-reporting banks operating in reporting countries, for which data on local claims in local currency is not available. This is particularly relevant for Asia-Pacific because of the growing activity of Chinese banks operating out of Hong Kong SAR. For data on foreign claims (which include local currency local claims) see Annex 2.
0
100
200
300
400
500
02 03 04 05 06 07 08 09 10 11 12
Intraregional banks2
US banksUK banksOther reporting banks
Swiss banksOther euro area banksSpanish banks
0
6
12
18
24
30
02 03 04 05 06 07 08 09 10 11 12
Intraregional banks2
US banksUK banks
Swiss banksOther euro area banksSpanish banks
10 CGFS – EME banking systems and regional financial integration
share of BIS total international claims falling from more than 30% before the crisis to less than 15% more recently (Graph 6, right-hand panel).11 This contrasts with broadly stable shares for banks from the United States and the United Kingdom.
Intraregional claims on Latin America and the Caribbean have gradually risen, although they still remain below 3%, according to BIS data.12 Similar patterns are apparent in syndicated loan data, where regional integration trends appear most pronounced in Asia-Pacific, among signs that regional banks and those from other advanced economies have picked up market share from euro area institutions (see Annex 2, Graph A.2.1).
2.2 EME bank expansion in the post-crisis period
The above metrics provide a useful perspective on aggregate trends in EME financial regionalisation, but do not fully capture the extent and nature of intra-EME financial activity, which continues to rely primarily on retail and commercial bank financing channels. A more comprehensive assessment can be gleaned from a granular look at EME bank expansion, including financial sector FDI activity.
The international activity of EME banks has gained momentum since 2008–09, reflecting in part their relative resilience to the crisis events. EME banks in many countries have strengthened their financial profiles and market capitalisation in the post-crisis period, supported by proactive policy responses, sound financial conditions and the quick return to strong economic growth. As a result, EME banks were well positioned to compete for business opportunities provided by strategic divestments by European (and, to a lesser extent, US) banks in EME regions. EME banks have also broadly pursued organic credit growth in their home markets, led in a number of jurisdictions by state-owned banks which engaged in more aggressive asset growth in the aftermath of the 2008–09 crisis.13 At the same time, banks operating in financial centres such as Hong Kong and Singapore have increased their intermediation role to the region (see Box 1).14 These trends led to shifts in market share between domestic and foreign banks. While there is significant variance by country, robust domestic bank credit growth and select foreign EME acquisitions have offset declining market shares for advanced economy banks in most EMEs in the post-crisis period (Graph 7, left-hand panel).
11 A substantial share of foreign bank claims in Latin America and the Caribbean, including those by
Spanish banks, is comprised of their subsidiaries’ local claims in local currencies, which are not reported in Graph 6 (for consistency with Graph 5). The inclusion of local claims in local currencies does not affect the conclusion that intraregional banks have become more active in the region. For data on foreign claims (which include local currency local claims) see Annex 2.
12 Since only a fraction of intra-EME claims are captured in the BIS international banking statistics, these estimated shares should be treated as a lower bound and provide only partial insight into EME financial integration trends in Latin America. Given the even thinner share of aggregate banking activity in emerging Europe and Africa captured by BIS reporting banks, the analogous breakdown for these regions is not reported.
13 See, for example, Čihák and Demirgüç-Kunt (2013). 14 For example, Asia’s share in non-financial sector borrowing from Singapore-based institutions
increased from 58% to 68% between 2008 and 2012. Banks operating in Hong Kong have also become more regionally focused, with emerging Asia accounting for 45% of total external claims and liabilities, compared to 39% in the pre-Lehman period.
CGFS – EME banking systems and regional financial integration 11
Box 1
Asian regional financial centres pre- and post-Lehman
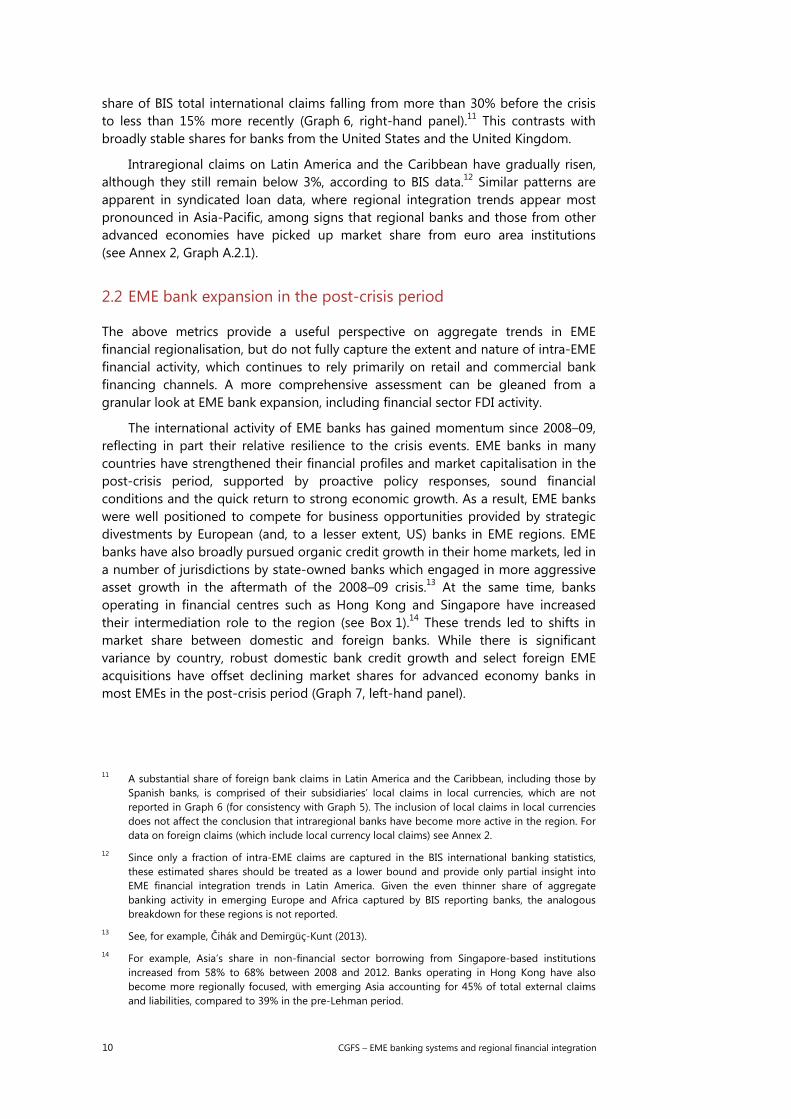
Banks in Singapore and Hong Kong provide important intermediation services for the Asian region, illustrating the supporting role played by financial centres as a conduit for financing to regional economies, especially among EMEs. Cross-border flows between the two financial centres and the rest of Asia, both emerging and developed, have increased since the global financial crisis, reflecting greater regional integration.
Net cross-border deposits – Singapore
In billions of Singapore dollars (SGD) Graph A
Pre-Lehman (June 2005–May 2008) Post-Lehman (June 2009–May 2012)
Numbers are based on average monthly net deposits. Source: Monetary Authority of Singapore.
Pre-Lehman, net inflows of funds from emerging Asia to Singapore were balanced by net outflows into developed Asia, Europe, and the Americas (Graph A). Post-Lehman, emerging Asia has become a net borrower, mostly due to the increase in claims by Singapore based banks on the region. Similarly, as financial intermediation between Hong Kong and emerging Asia close to doubled over the same period (Graph B), average monthly net claims of Hong Kong-based banks on the region rose from 196 to 761 billion HKD.
Net external liabilities vis-à-vis non-residents – Hong Kong SAR
In billions of Hong Kong dollars (HKD) Graph B
Pre-Lehman (June 2005–May 2008) Post-Lehman (June 2009–May 2012)
Numbers are based on net external liabilities vis-à-vis non-residents. Source: Hong Kong Monetary Authority.
Outflow to specific region
Europe86.2Developed Asia
15.9 Americas16.2
Others20.4
390.3
225.2
110.6135.5
216.1 302.3
73.689.8
49.2
28.8
Inflow from specific region
Singapore
Average monthly gross flows:
Emerging Asia165.1
Net borrower
Net lender
Developed Asia25.7 Americas
19.7
336.2
360.0
143.7117.9
271.5 237.4
109.689.9
58.8
39.6Singapore
Europe34.1
Others19.2
Emerging Asia23.8
Outflow to specific region
Europe1,166.7
Developed Asia310.8 Americas
276.3
Others15.7
1,397.0
1,593.4
445.0755.8
554.8 1,721.5
427.3 703.6
52.7
68.4
Inflow from specific region
Hong Kong SAR
Average monthly gross flows: Net borrower
Net lender
Emerging Asia 196.4
Europe603.0
Developed Asia251.6 Americas
112.7
Others 127.5
2,101.8
2,863.2
664.6916.2
1,047.4 1,650.3
745.0 857.8
70.7
198.2
Hong Kong SAR
EmergingAsia
761.4

12 CGFS – EME banking systems and regional financial integration
For the larger EMEs (such as Brazil, China, India and Russia), domestic EME banking institutions, many of which are state-owned, have engaged in robust loan growth in the post-crisis period and have gained market share relative to foreign banks. Strong lending by domestic banks has also contributed to a reduction in foreign bank market share in many smaller EMEs, and divestments by advanced economy banks have provided opportunities in some of these markets for cross-border EME acquisitions. As a result, EME banks now account for a greater share of foreign bank activity in select markets in Latin America, emerging Europe and Southeast Asia (Graph 7, right-hand panel).
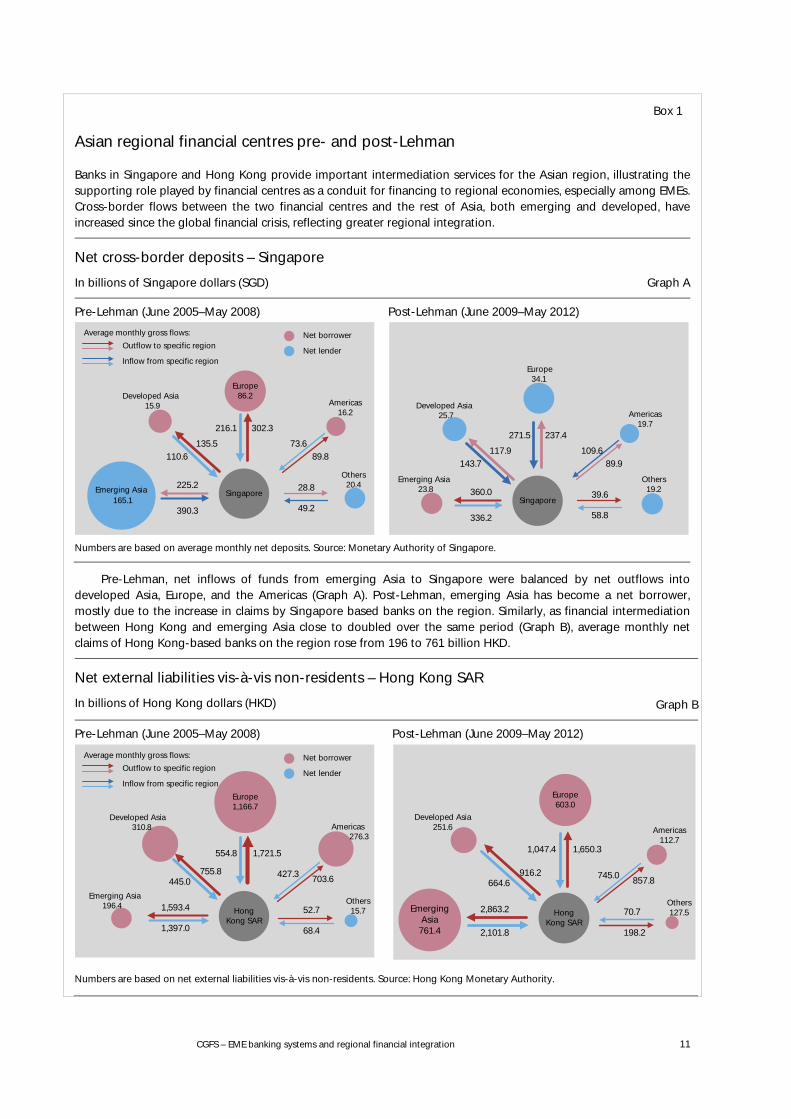
Despite their recent expansion, the aggregate international footprint of EME banks remains relatively small at the host system level. While a growing presence by EME banks has helped to offset retrenchment by banks headquartered in advanced economies, leaving foreign bank participation in EME financial sectors broadly stable post-crisis (Graph 8, left-hand panel), EME banks continue to represent a relatively small share of foreign bank and total system assets in most EMEs, especially among the larger economies (Graph 8, right-hand panel).
A stronger EME systemic presence is evident mainly in smaller EMEs, particularly in sub-Saharan Africa, Southeast Asia, Central America and the former Soviet republics of the Commonwealth of Independent States. For example, Colombian financial conglomerates acquired a number of advanced country bank assets in Central America in the post-crisis period and now account for more than 50% of banking system assets in El Salvador, and more than 20% in both Nicaragua and Honduras. In Africa, subsidiaries of South African banking groups now hold
Market shares among domestic, AE foreign and EM foreign banks
Change in banks’ share of system assets by ownership, type, 2008–12 (or latest available) Graph 7
All banks Per cent
Foreign banks Per cent
1 Estimations of assets based on aggregation of publicly available individual foreign bank financial data for each country. A bank is considered to be foreign if it is majority-owned and/or controlled by a foreign entity, and foreign nationality is assigned based uponlargest/controlling shareholder. 2 Data set on foreign bank presence may not be complete for China, Indonesia and Ukraine, although themajority of foreign bank operations are captured. 3 Data for Brazil reflect change from 2009 to latest (2012).
Sources: Bankscope; CEIC; EMED; bank financial statements; national authorities.
–30
–20
–10
0
10
20
30
Indi
aP
akis
tan
Chi
naIn
done
sia
Thai
land
Phi
lippi
nes
Arg
entin
aB
razi
lC
hile
Col
ombi
aP
eru
Mex
ico
Ven
ezue
la
Rus
sia
Turk
eyH
unga
ryK
azak
hsta
nU
krai
neB
ulga
riaC
roat
iaS
outh
Afri
ca
Emerging Asia Latin America Emerging Europe & Africa
AE foreignEM foreign
State-ownedPrivate domestic
–15
–10
–5
0
5
10
15
Indi
aP
akis
tan
Chi
naIn
done
sia
Thai
land
Phi
lippi
nes
Arg
entin
aB
razi
lC
hile
Col
ombi
aP
eru
Mex
ico
Ven
ezue
la
Rus
sia
Turk
eyH
unga
ryK
azak
hsta
nU
krai
neB
ulga
riaC
roat
iaS
outh
Afri
ca
Emerging Asia Latin America Emerging Europe & Africa
EM banksUS banksUK banks
W European banksJapanese, Australian orCanadian banks
CGFS – EME banking systems and regional financial integration 13
Total foreign and EME foreign bank ownership in EMEs1 Graph 8
Foreign-owned bank assets as share of total banking system assets
Per cent
EME foreign bank assets as a share of total banking system assets
Per cent
AR = Argentina; BG = Bulgaria; BR = Brazil; CL = Chile; CN = China; CO = Colombia; CR = Costa Rica; HR = Croatia; HU = Hungary; ID = Indonesia; IN = India; KH = Cambodia; KZ = Kazakhstan; MX = Mexico; NI = Nicaragua; PE = Peru; PH = Philippines; PK = Pakistan; RU = Russia; SV = El Salvador; TH = Thailand; TR = Turkey; UA = Ukraine; VE = Venezuela; ZA = South Africa. 1 Estimations based on aggregation of publicly available individual foreign bank financial data for each country. At least 90% of totalforeign banking assets are captured for most countries, but estimated EME bank asset share may be modestly understated. 2 Data set on EME foreign bank presence may be incomplete and represents the lower bound of EME foreign bank presence. Note that for Chinaapproximately 75% of foreign bank assets are estimated to be captured, although overall foreign bank assets represent only 2% of system assets. 3 Brazil data from 2009 to latest (2012).
Sources: Bankscope; CEIC; EMED; bank financial statements; national authorities.
over 80% of total bank assets in Swaziland, while the two largest foreign players in Burkina Faso are headquartered in Mali and Togo. Although such smaller, lower-income host countries tend to have riskier operating environments and weaker institutions, they may also offer strong growth opportunities for EME banks applying lessons learned from their own experiences during earlier stages of banking development (see, for example, van Horen (2007)).
Post-crisis competition from advanced country banks. Among banks from advanced countries, Australian, Canadian and Japanese institutions, which fared better than their US and European peers during the recent crisis, have increased their international profile in recent years, with a particular focus on EME markets within their respective regions, and on international trade and infrastructure financing.
Japanese banks, for example, had become the biggest suppliers of cross-border bank credit by Q1 2013 (BIS (2013a)). While much of this activity is concentrated in the Asia-Pacific region, they have also expanded activity in Latin America and financial centres in the Caribbean.15
In contrast, Australian banks’ expansion is mostly regional. As of December 2012, the claims of Australian-owned banks on the Asian region amounted to almost $95 billion (compared with $25 billion five years earlier), representing some 3% of their global consolidated assets. Most of these claims are on Singapore, Hong Kong and China, although strong growth in claims has been reported also to a
15 It is estimated that the increasing Japanese bank exposure to these regions can be attributed to
purchases, by their trust accounts, of investment funds domiciled in financial centres in the Caribbean..
0
20
40
60
80
PK KH ID2 TH PH IN CN2 SV MX NI PE CL AR CR COBR3 VE HR BG HUUA2 KZ ZA TR RU
Emerging Asia Latin America Emerging Europe & Africa
2008 Latest
0
15
30
45
60
KH PK ID2 PH TH IN CN2 SV NI CR AR PE CL CO BR3 MX VE KZ UA2 BG HR TR HU ZA RU
Emerging Asia Latin America Emerging Europe & Africa
14 CGFS – EME banking systems and regional financial integration
range of other countries, including the Philippines and Vietnam. A key motivation for the four major Australian banks’ expansion in Asia has been to facilitate the large and growing trade and investment flows with the region. As such, the majority of these claims have less than 12 months’ maturity, partly reflecting the provision of trade facilities, which typically have short tenors. Some Australian banks have also been expanding into regional retail banking, targeting segments such as affluent customers or those with links to Australia (see also Section 2.4 below).16
2.3 EME cross-border expansion: drivers and differentiating factors
Specific drivers of EME bank expansion into other EMEs vary considerably, but are broadly similar to drivers of prior international expansions by advanced country banks in the 1990s and 2000s. Key drivers include a motivation to assist their home country customers in international transactions, and to pursue new growth opportunities with higher profit margins and more favourable risk-adjusted returns as domestic markets become more saturated.17 Factors more specific to the current wave of EME bank expansion include cultural and linguistic ties, trade and economic cooperation policies, and national objectives (for state-owned banks). The confluence of all these factors has resulted in a strong regional orientation of EME banks’ current cross-border expansion.
Key drivers. By following their international retail and corporate customers abroad, banks can exploit informational advantages of long-term bank-client relationships. As intraregional and cross-EME trade flows rise, corporate customer demand for banking services in multiple markets is likely to support expansion of EME banks into other EMEs. Indeed, bilateral interviews with major domestic banks in Brazil, China, Hong Kong, India and Korea suggest that the provision of financial services to domestic firms abroad is a key expansion driver. The provision of services to migrants, especially in terms of retail banking, as revealed by the experience of Indian and Mexican banks, is another related factor.
Exposure to foreign markets with better growth prospects may also deliver diversification benefits and can enhance risk-adjusted returns. Interviews with major domestic banks in some EME countries suggest that earnings and risk diversification have been key drivers of their cross-border expansion to other EMEs since 2008–09. Limited growth opportunities in banks’ home markets, due to already significant market shares and/or high levels of credit penetration, can provide further impetus for cross-border expansion. Indeed, banks from both Korea and Singapore highlighted domestic market saturation as a major driver of their international expansion, and banks from other regions are known to face similar limitations.
Patterns of regional orientation. Geographical, cultural and institutional links between the home and the host country have been important factors driving cross-border expansion decisions by foreign banks in the past.18 For example, strong Korean bank presence in Kazakhstan and Middle East investment in Pakistan reflect historical migration patterns. Bank interviews also suggest that Indian banks target host markets with significant presence of emigrant communities, while Chinese banks note cultural and geographical proximity as major factors. There is also
16 See also RBA (2013). 17 See CGFS (2004) for more information. 18 See, for example, Berger et al (2004).
CGFS – EME banking systems and regional financial integration 15
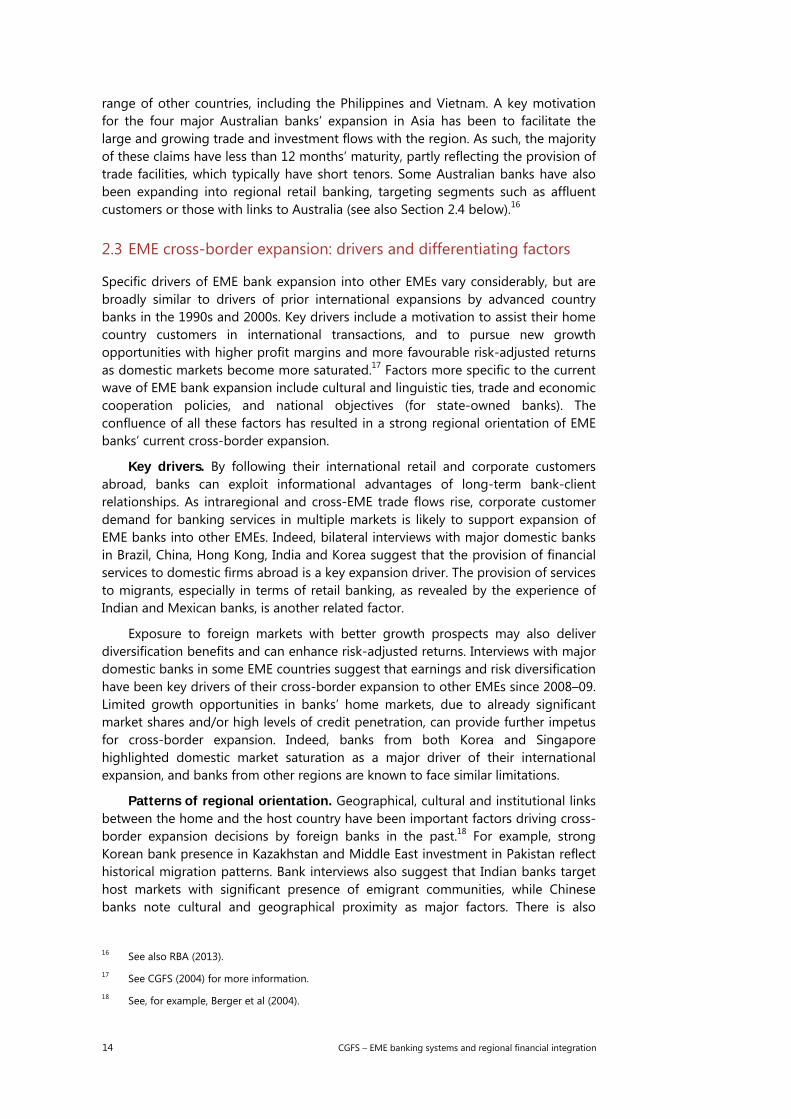
evidence that foreign banks tend to be more profitable when located in a country that is geographically close to their home country.19 In addition, trade and FDI flows tend to be regional. Therefore, it is not surprising that most EME banks demonstrate a strong regional orientation in their geographical expansion strategies – often more so than their advanced economy peers (Graph 9).
The regional concentration of EME banks is particularly evident in the Middle East and Africa, where more than 90% of all foreign EME banks are from within the region. In this context, agreements towards regional financial cooperation and the emergence of pan-regional banks have played a significant role in African financial integration, with pan-African banks accounting for almost a third of credit institutions and half of bank assets in the West African Economic and Monetary Union (WAEMU) by 2011, for instance. Similar patterns are evident in emerging Europe, where recent expansion by Russian banks has substantially increased the regional concentration of EME banks in the region, and in Latin America, although Argentina and Brazil have recently attracted a broader geographical range of EME interest, including from Asia, South Africa and the Middle East.
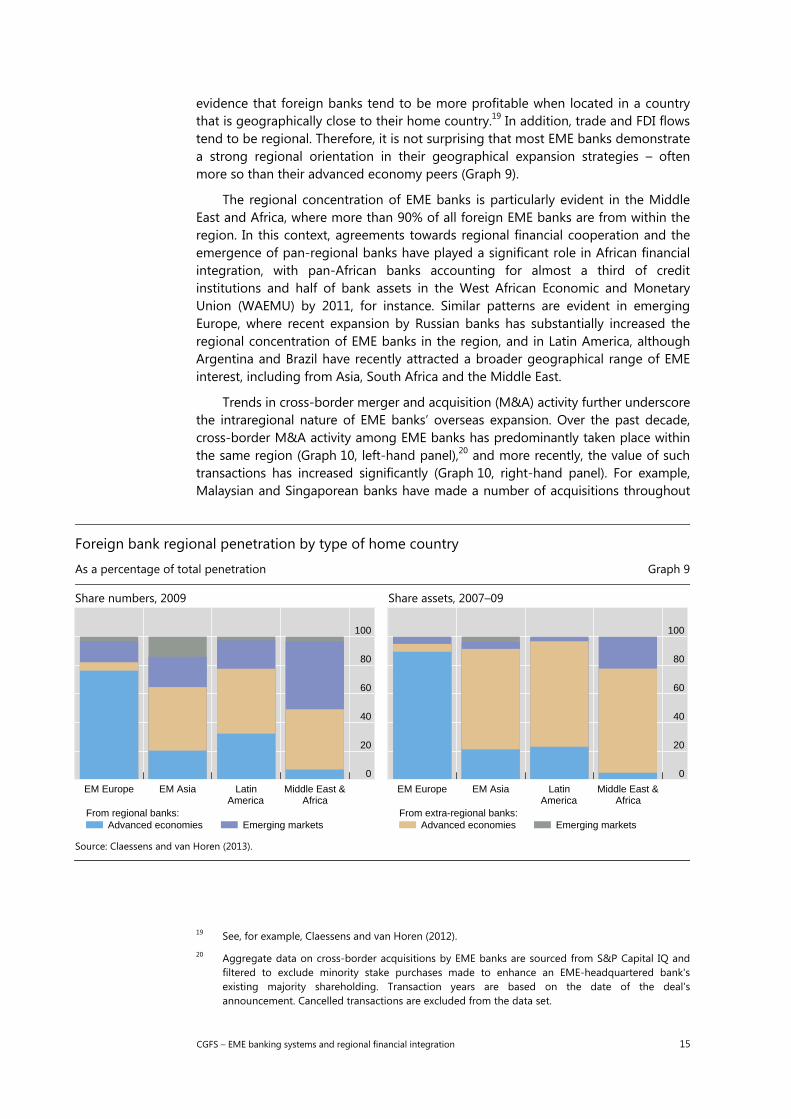
Trends in cross-border merger and acquisition (M&A) activity further underscore the intraregional nature of EME banks’ overseas expansion. Over the past decade, cross-border M&A activity among EME banks has predominantly taken place within the same region (Graph 10, left-hand panel),20 and more recently, the value of such transactions has increased significantly (Graph 10, right-hand panel). For example, Malaysian and Singaporean banks have made a number of acquisitions throughout
Foreign bank regional penetration by type of home country
As a percentage of total penetration Graph 9
Share numbers, 2009 Share assets, 2007–09
Source: Claessens and van Horen (2013).
19 See, for example, Claessens and van Horen (2012). 20 Aggregate data on cross-border acquisitions by EME banks are sourced from S&P Capital IQ and
filtered to exclude minority stake purchases made to enhance an EME-headquartered bank's existing majority shareholding. Transaction years are based on the date of the deal's announcement. Cancelled transactions are excluded from the data set.
0
20
40
60
80
100
EM Europe EM Asia Latin Middle East &America Africa
Advanced economiesFrom regional banks:
Emerging markets
0
20
40
60
80
100
EM Europe EM Asia Latin Middle East &America Africa
Advanced economiesFrom extra-regional banks:
Emerging markets
16 CGFS – EME banking systems and regional financial integration
EME banks: cross-border M&A by target’s headquarters region
Transactions closed or announced1 Graph 10
Number of transactions closed or announced (total of 245 deals)
Number of deals
Total value (based on 136 deals)
USD bn
1 Include majority stake purchases as well as minority stake purchases except where bank purchased shares to increase existing majoritystake.
Source: S&P Capital IQ.
Southeast Asia, while Colombian and Chilean financial institutions have been expanding in Central and South America (see Annex 2, Table A.2.2). In contrast, Chinese, Korean and Indian banks appear to demonstrate a more global orientation that reflects the international banking needs of their domestic corporate clients, trade finance and, in some cases, opportunities to provide services to emigrant communities (see Annex 2, Table A.2.3). Some banks have also indicated a preference to further develop their advanced country presence as they seek to become more integrated into international markets, as reflected in a rising presence of EME banks in major markets, such as the United States, and major financial centres, such as Chinese banks’ activities via Luxembourg.21
Heterogeneity in scope and scale of EME bank activities. The scope and scale of EME banks’ global expansion vary widely, although international activities generally remain small relative to banks’ balance sheets and the size of their target market (see Annex 2, Table A.2.4).22
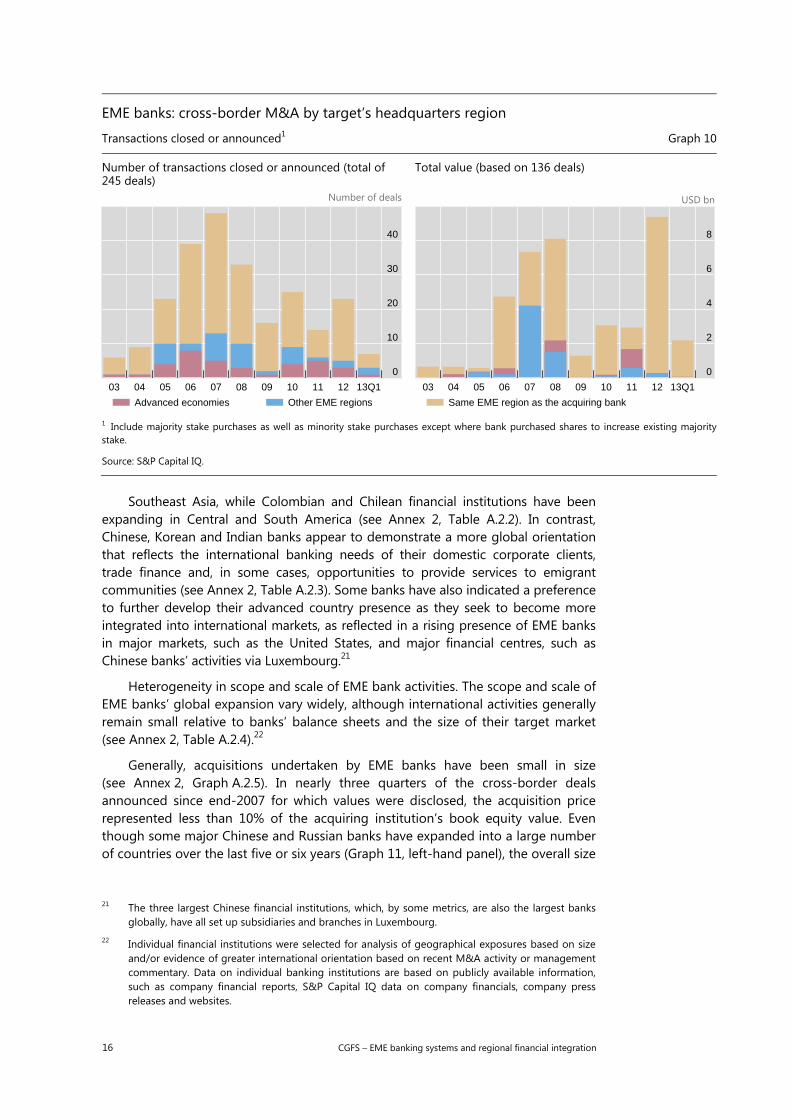
Generally, acquisitions undertaken by EME banks have been small in size (see Annex 2, Graph A.2.5). In nearly three quarters of the cross-border deals announced since end-2007 for which values were disclosed, the acquisition price represented less than 10% of the acquiring institution’s book equity value. Even though some major Chinese and Russian banks have expanded into a large number of countries over the last five or six years (Graph 11, left-hand panel), the overall size
21 The three largest Chinese financial institutions, which, by some metrics, are also the largest banks
globally, have all set up subsidiaries and branches in Luxembourg. 22 Individual financial institutions were selected for analysis of geographical exposures based on size
and/or evidence of greater international orientation based on recent M&A activity or management commentary. Data on individual banking institutions are based on publicly available information, such as company financial reports, S&P Capital IQ data on company financials, company press releases and websites.
0
10
20
30
40
03 04 05 06 07 08 09 10 11 12 13Q1
Advanced economies Other EME regions
0
2
4
6
8
03 04 05 06 07 08 09 10 11 12 13Q1
Same EME region as the acquiring bank
CGFS – EME banking systems and regional financial integration 17
of their overseas operations is relatively small at about 10% or less of their balance sheets (Graph 11, right-hand panel). For many other large EME banks (such as some major Brazilian, Indian and Korean lenders), the scale of foreign banking activities is also relatively contained as a share of assets and revenues. Malaysian and Singaporean banks, in contrast, have dedicated a larger share of their balance sheet to international expansion, with several larger acquisitions ranging from 10 to 40% of book equity. Recently, Colombian and Chilean lenders have also made some fairly sizeable acquisitions, each equivalent to over 40% of their book equity.
Variation in the mode of entry. The preferred mode of entry into regional and international markets over the past few years has also differed among large EME banks. Indian banks appear to have pursued a largely organic expansion strategy, while Brazilian and Chinese institutions have taken a selective approach to acquisitions.23 Other banks (for example, larger lenders from Russia, Malaysia and Colombia) have gained material market share in smaller economies within their regions via acquisitions.
Notably, regulatory push in many jurisdictions for foreign banks to operate through subsidiaries rather than branches has supported M&A trends. Another important factor relates to the primary purposes of cross-border expansion into a particular jurisdiction, whereby retail banking has favoured subsidiaries, whereas
23 In bilateral interviews, Indian banks indicated an intrinsic preference for a branch rather than a
subsidiary setup, citing cost-effectiveness of the former (see Section 3 for further discussion).
Global presence of internationally expanding EME banks1 Graph 11
Foreign countries where a bank has presence Number of countries
Overseas assets as a share of total assets Per cent
BZ = Brazil; CL = Colombia; CN = China; IN = India; KR = Korea; MY = Malaysia; QA = Qatar; RU = Russia; SA = South Africa;SG = Singapore
1 Numbers are best estimates based on publicly available information regarding countries in which bank has branches, subsidiaries, repoffices, JVs, or other presence. 2 Based on loan data. 3 Assets abroad exclude assets in Hong Kong. 4 Based on a subset ofassets. 5 Where data is available.
Sources: Company reports, Company financials, Capital IQ, press reports, and website.
0
10
20
30
CN
-1C
N-2
IN-1
KR
-1IN
-2S
G-1
SG
-2S
G-3
KR
-2M
Y-1
KR
-3M
Y-2
BZ-
1B
Z-2
CO
-1C
O-2
SA
-1R
U-1
RU
-2Q
A-1
Asia LATAM Other
As of end 2006Net number of additional countries since 2006
0
15
30
45
SG
-12
SG
-22
MY
-12
SG
-32
MY
-22
SA
-1IN
-1B
Z-1
QA
-1R
U-1
IN-2
BZ-
22
CN
-13
KR
-1R
U-2
4K
R-2
2K
R-3
2C
N-2
3
Total assets abroadWithin same region as bank’s headquarters5
Ovearseas assets:
18 CGFS – EME banking systems and regional financial integration
reliance on centralised funding models and wholesale deposits to fund more specialised business lines would favour expansion via branches.
2.4 Assessing the scope for stronger EME bank expansion
While the main drivers may be similar, the current phase of expansion by EME banks into other EMEs differs in important ways from prior periods of increased foreign bank participation in EMEs. During the 1990s and early 2000s, financial liberalisation in the wake of various EME financial crises, coupled with the poor performance of domestic competitors in several markets, created opportunities for advanced country banks to enter EMEs on a large scale and earn significant profit margins. Clear examples of these trends include Spanish bank expansion in Latin America as well as Austrian, French and Italian bank expansion into emerging Europe.
Box 2
Euro area banks’ exposures to emerging markets since the financial crisis
Despite the large drop in foreign claims of euro area banks (more than $1.5 trillion between Q2 and Q4 2011), most emerging markets do not seem to have been disproportionally affected by this deleveraging process, partly because euro area banks’ shares of domestic banking assets in many jurisdictions have been small to start with (for example, typically less than 10% in Asian countries). More importantly, euro area banks’ divestments appear to have been selective, reflecting a general reassessment of banks’ strategies with the aim of focusing only on those activities perceived to offer large value added in terms of business opportunities. In particular, euro area banks tended to scale back activities which were deemed as riskier, funded through more volatile sources, or simply perceived as non-core.
As such, there was a considerable heterogeneity in the process, depending on whether banks’ international business was conducted by subsidiaries, branches or cross-border lending, the centralised or decentralised nature of their funding models and currency denomination, the characteristics of their core banking businesses, and their market share and size of the host market. Coordination mechanisms, such as the Vienna I and II initiatives, may have been instrumental in supporting the regional activities of euro area banks, even though clear-cut evidence on the success of these measures is not available (see also Box 3).
For instance, BIS statistics indicate that Spanish banks actually increased their presence in Latin America, where operations via subsidiaries were funded with local deposits and focused primarily on retail banking. At the same time, the recapitalisation needs of Spanish banks’ head offices led to selected divestments from non-core activities (such as the pension fund business in Latin America), from countries where their market share was perceived as insufficient to reach economies of scale, or sales of shares in large subsidiaries, while still retaining majority stakes.
Austrian and Italian banks, in turn, have broadly maintained their presence in emerging Europe, as the region plays an important role in the risk and profit diversification for these banking groups, which have pursued “follow the customer” and retail bank business strategies. The selective divestments took place primarily in countries with greater political uncertainties or significant regulatory risk. In terms of business model, Austrian and Italian banks in eastern Europe seem to be pursuing a progressive shift towards a local funding model via subsidiaries and diminishing foreign currency lending to households and other unhedged borrowers. German banks, in contrast, sharply reduced their presence in eastern Europe as part of a strategy to focus on core activities. In this case, banks’ foreign presence had been based on a centralised funding model and the global financial crisis led to a major reassessment of the contribution of investment in the area to the diversification strategy of the banks. Therefore, several German banks developed downsizing or exit plans for this region, in some cases influenced by conditions set under EU Commission state aid proceedings, and initiated targeted expansion plans to countries that were seen to add more to diversify their international portfolio, such as Asian or the BRIC countries.
Recent trends in Asia also provide an illustration of the reassessment of the strategic nature of certain types of foreign activities. French banks, for example, reduced their exposures in Asia in the wake of US dollar funding pressures as well as reduced profitability due to the economic downturn. Meanwhile, Dutch banks’ exposures to emerging Asia fell by nearly half between 2008 and 2010, relating primarily to the takeover and restructuring of two large banking groups, even as exposures to core markets in emerging Europe increased.
CGFS – EME banking systems and regional financial integration 19
Current versus past conditions. Yet, conditions have changed substantially since the last wave of internationalisation in the late 1990s. In many EME banking systems, the balance sheet quality, risk management processes and operational capabilities of local banks have improved. As a result, competition from domestic banks for new entrants has become more intense, which may, in turn, drive down profitability for potential new foreign bank entrants. For instance, while retrenchment by advanced economy banks since 2008 has created opportunities for EME banks to gain organic market share in other EMEs (see Box 2), the size of these increases has been limited to at most 1% of system assets in many countries, reflecting intensified competition from domestic players.
The ability of EME banks to enter larger EMEs via significant acquisitions is also different, as acquiring institutions are unable to benefit from the same degree of financial liberalisation that facilitated the large-scale entry of foreign banks in past decades. Moreover, retrenchment by advanced economy banks to date has focused on minority stakes and non-core elements of their operations, while these banks have reaffirmed their commitment to the larger strategic markets, and indeed have increasingly looked to EME operations to drive profitability. In some cases, increasing foreign bank penetration may also prompt stricter regulation of foreign banks (evident to date in the form of branching limitations, additional capital requirements, and directed lending mandates).
Scope for stronger expansion. Even if overall EME bank market shares remain low so far, the magnitude of change relative to their starting conditions has been significant. Moreover, larger EME banks appear to have the balance sheet strength and resources to make larger-scale investments in foreign markets going forward. Whether they become more relevant regional EME players is likely to depend upon the balance of domestic versus international growth opportunities, and the relative performance and profitability of existing cross-border operations, which are analysed in more detail in Section 3 below.
For now, however, EME banks appear more likely to capture significant market share in smaller frontier economies, where divestments or more limited activities by other financial institutions create opportunities for EME banks. For example, the exit of major UK and US institutions from Central America since 2010 has given major Colombian banks control of an additional 14% of the region’s banking assets.24 Likewise, EME banks have incrementally increased their presence in smaller frontier markets within their regions, such as Vietnam and Cambodia for Asian institutions as well as Libya and Tunisia for major Middle East banks. While these countries may offer strong growth opportunities, they also tend to have riskier operating environments and weaker institutions, which raises a range of risk management and supervisory considerations (see Sections 4 and 5 below).
3. Business models
The trends in the international expansion of EME banks into other emerging markets described above (see Section 2) have a number of possible financial market and stability implications. These, in turn, will depend importantly on how the
24 Non-bank divestments by Dutch and Spanish banks (eg pension fund and insurance business lines),
in turn, have provided other financial sector market opportunities for EME banks.

20 CGFS – EME banking systems and regional financial integration
business models of newly expanding banks compare across individual institutions and relative to those of incumbent banks, including institutions headquartered in advanced economies. To shed some light on these differences in business models and their implications for banks’ risk profiles going forward, this section reviews a number of select metrics based on balance sheet and income statement data at the individual foreign affiliate level (see Annex 3 for a data set description).
A review of these metrics, such as the scale of deposit funding and lending activity as well as capitalisation levels – for a sample of nearly 270 branches and subsidiaries of 75 EME and advanced country banks operating in 28 EMEs in the post-crisis period (2008–12) – points to some broad similarities, especially among larger operations. Yet it also highlights important differences in how newly expanding foreign affiliates operate in EME markets. These differences are due to a range of factors, including: the size, scale and orientation of local operations; the length of time of presence in the host market; funding models and risk management approaches; parent ownership structure; regional versus international focus; and host country regulatory requirements.25
Overall, in their international operations, EME banks tend to maintain relatively high capital buffers, as well as exhibit a strong focus on local deposit capture and less reliance on market-based financing than their advanced economy peers. However, there are substantial differences among EME banks and, for some of the larger affiliates, gaps with advanced economy banks are narrowing. Many EME foreign affiliates have also engaged in relatively aggressive international expansion and new lending in EME markets since 2009. And, while much of this new activity is backed by deposit funding, there are also some instances where larger foreign affiliates of EME banks are beginning to exhibit a greater reliance on interbank and market financing than larger advanced economy bank affiliates. Also, while still healthy overall, capital buffers, as proxied by ratios of equity to total assets, appear to be declining in line with balance sheet growth, particularly for larger EME operations. Furthermore, many foreign affiliates of EME banks have yet to demonstrate solid profitability. More detailed findings are presented below.
3.1 Foreign EME bank balance sheet and performance metrics
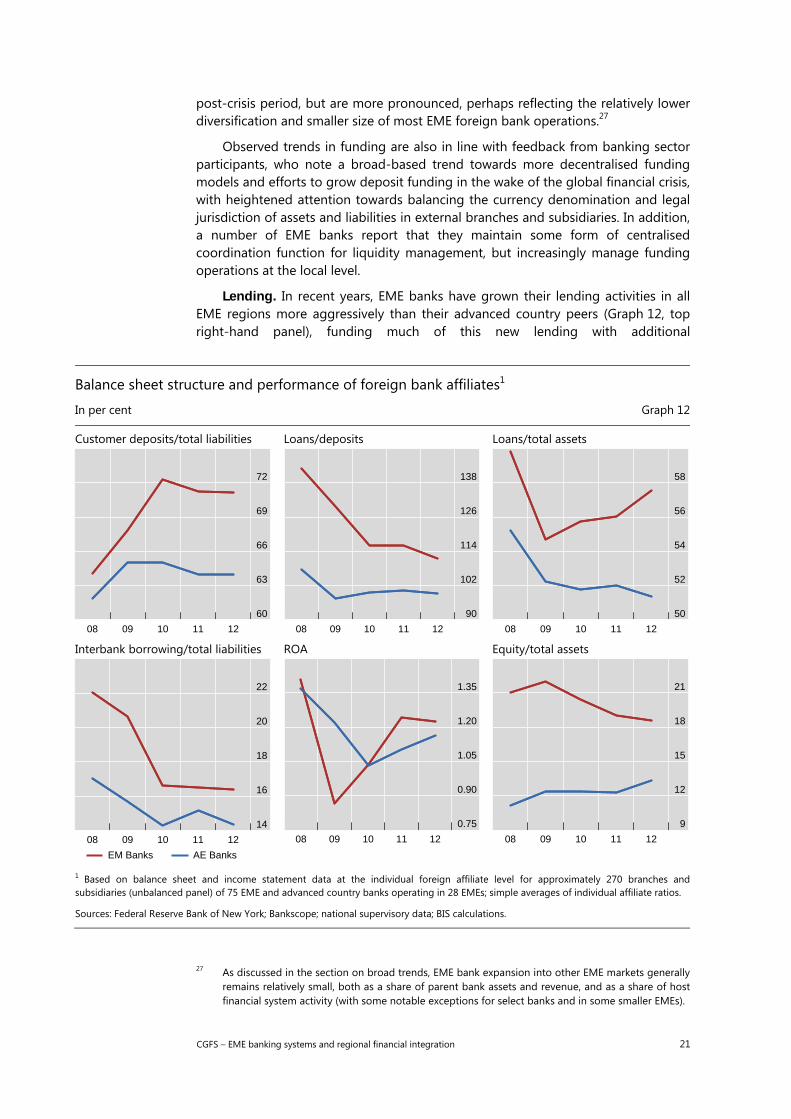
Funding. In aggregate, EME banks finance the majority of their foreign operations in other EMEs with deposit funding, the reliance on which has increased in the post-crisis years (Graph 12, top-left panel).26 Bank interviews also indicate that competition for deposits has recently intensified, as both EME and advanced economy banks are seeking more stable funding sources.
There is also evidence of a sharp narrowing of loan-to-deposit ratios from elevated levels, particularly in the years immediately following the crisis, reflecting both a reduction in lending as a share of balance sheet activity and an increase in the share of deposit funding (Graph 12, top centre panel). These trends are consistent with the experience of advanced country banks in EME markets in the
25 In interpreting these metrics, emphasis was placed on data through 2011, due to incomplete data
for some jurisdictions for 2012 owing to reporting and publication lags. 26 Due to data limitations, deposits are broadly defined as including all customer deposits, including
corporate deposits, and may in cases include government deposits.
CGFS – EME banking systems and regional financial integration 21
post-crisis period, but are more pronounced, perhaps reflecting the relatively lower diversification and smaller size of most EME foreign bank operations.27
Observed trends in funding are also in line with feedback from banking sector participants, who note a broad-based trend towards more decentralised funding models and efforts to grow deposit funding in the wake of the global financial crisis, with heightened attention towards balancing the currency denomination and legal jurisdiction of assets and liabilities in external branches and subsidiaries. In addition, a number of EME banks report that they maintain some form of centralised coordination function for liquidity management, but increasingly manage funding operations at the local level.
Lending. In recent years, EME banks have grown their lending activities in all EME regions more aggressively than their advanced country peers (Graph 12, top right-hand panel), funding much of this new lending with additional
Balance sheet structure and performance of foreign bank affiliates1
In per cent Graph 12
Customer deposits/total liabilities Loans/deposits Loans/total assets
Interbank borrowing/total liabilities ROA Equity/total assets
1 Based on balance sheet and income statement data at the individual foreign affiliate level for approximately 270 branches and subsidiaries (unbalanced panel) of 75 EME and advanced country banks operating in 28 EMEs; simple averages of individual affiliate ratios.
Sources: Federal Reserve Bank of New York; Bankscope; national supervisory data; BIS calculations.
27 As discussed in the section on broad trends, EME bank expansion into other EME markets generally
remains relatively small, both as a share of parent bank assets and revenue, and as a share of host financial system activity (with some notable exceptions for select banks and in some smaller EMEs).
60
63
66
69
72
08 09 10 11 12
90
102
114
126
138
08 09 10 11 12
50
52
54
56
58
08 09 10 11 12
14
16
18
20
22
08 09 10 11 12
EM Banks AE Banks
0.75
0.90
1.05
1.20
1.35
08 09 10 11 12
9
12
15
18
21
08 09 10 11 12
22 CGFS – EME banking systems and regional financial integration
customer deposits, while reducing somewhat their reliance on interbank borrowing (Graph 12, bottom left-hand panel). In Asia, this reflects stronger recent growth in lending since 2009 by some of the larger state-backed EME affiliates, whereas in Latin America and eastern Europe, private sector EME banks have also consistently increased the share of balance sheet resources dedicated to local lending during this time period.
Profitability. Both EME and advanced economy bank affiliates have significantly improved profitability metrics, as measured by returns on assets, compared with the weakness evident during the global financial crisis. Since 2011, EME banks have outperformed those from advanced economies (Graph 12, bottom centre panel), led primarily by larger EME affiliates in Latin America and emerging Europe, and potentially reflecting relatively recent entry and cost restructuring initiatives following M&A acquisitions. In contrast, larger EME affiliates in Asia appear to continue to underperform their advanced economy peers, with increased competition from domestic banks and expanding advanced economy banks from the same region (see Section 2).
Capitalisation levels. In aggregate, EME banks maintain strong capital adequacy ratios in their EME operations, although outperformance relative to advanced country peers is narrowing as EME bank affiliate capital ratios have moderately declined on the back of accelerating lending activity. Advanced economy banks, in turn, appear to have gradually built up higher local capital buffers (Graph 12, bottom right-hand panel). Capital ratios are particularly high for the smallest EME foreign affiliates, perhaps reflecting a need to meet minimum capital standards and, possibly, more recent establishment of de novo operations that are expected to grow going forward (Graph 13, bottom right-hand panel). This might suggest that capital buffers will tend to decline over time as EME banks increase the scope and scale of their international activities. But higher capital levels also suggest a heightened capacity to absorb potential losses in the nearer term.
3.2 Sources of heterogeneity
While the aggregate trends highlighted above generally hold true for the EME activity of foreign banks from both EMEs and advanced economies, there is substantial heterogeneity along a number of dimensions.
Size and scope of foreign operations. One example is notable differences in the orientation and funding profile of foreign affiliates in EME markets based upon the size and scope of their activities.
Large foreign affiliates. Specifically, larger and more systemically important foreign affiliates generally exhibit more similarity in trends than is evident in the aggregate data.28 These larger operations (from both EMEs and advanced countries) on average dedicate a majority of their balance sheet (60–70%) to lending activities, and primarily fund these activities with a growing share of deposit financing and declining reliance on interbank borrowings. They also demonstrate greater convergence in loan-to-deposit and equity ratios (Graph 13).
28 Given a high preponderance of international affiliates with minimal market share, the data have
been disaggregated to allow assessment of balance sheet and performance metrics more consistently across larger banking operations, defined as having 1% or greater asset share of host country banking systems.

CGFS – EME banking systems and regional financial integration 23
These similarities between larger foreign affiliates likely reflect an overall consistency in business line orientation (including, in many cases, a focus on retail banking operations), and the acquisitive mode of entry or expansion evidenced by many EME banks. More than 60% of the larger EME foreign affiliates in the sample have either recently entered or substantially increased their market share in host EME markets via M&A activity – including via the purchase of advanced country foreign bank affiliates. In addition, to the extent that larger foreign affiliates are more likely to be incorporated as a local subsidiary (rather than as a branch operation), they would be more likely to exhibit convergence towards higher reliance on deposit funding. This suggests some degree of harmonisation of risk profiles at the aggregate level between larger affiliates of EME and advanced economy banks in the post-crisis period.
Small foreign affiliates. Very small foreign affiliates operating in EME markets, most of which have entered on a de novo basis, show a markedly different profile than their larger peers, characterised by higher average reliance on non-deposit funding, including interbank and parent company borrowings. This results in outsize loan-to-deposit ratios and weaker profitability metrics relative to their larger peers,
Balance sheet structure and performance: by size of foreign operations1
In per cent Graph 13
Customer deposits/total liabilities Loans/deposits Loans/total assets
Interbank borrowing/total liabilities ROA Equity/total assets
1 Based on balance sheet and income statement data at the individual foreign affiliate level for approximately 270 branches andsubsidiaries (unbalanced panel) of 75 EME and advanced country banks operating in 28 EMEs; simple averages of individual affiliate ratios.
Sources: Federal Reserve Bank of New York; Bankscope; national supervisory data; BIS calculations.
49
56
63
70
77
08 09 10 11 12
80
100
120
140
160
08 09 10 11 12
35
42
49
56
63
08 09 10 11 12
5
10
15
20
25
08 09 10 11 12
EM large BanksEM small Banks
0.8
1.0
1.2
1.4
1.6
08 09 10 11 12
AE large BanksAE small Banks
8
12
16
20
24
08 09 10 11 12

24 CGFS – EME banking systems and regional financial integration
and large capital holdings as a share of assets (Graph 13). For some EME banks, this may reflect branch rather than subsidiary operations, where local regulations permit. It may also be reflective of the relatively recent entry of EME banks into EME markets, with higher capital levels potentially indicative of forward-looking growth opportunities.
Bank interviews suggest that decisions to commit capital to new subsidiary operations are taken when future revenue prospects can justify the upfront costs. In contrast, smaller affiliates of advanced country banks, which tend to have a longer standing presence in EME markets, are more likely to operate as branches focused on securities brokerage activities rather than local lending. This is consistent with a much smaller average share of their balance sheets committed to lending (40–45% over the five-year period) and lower loan-to-deposit ratios relative to similarly sized EME peers.
Ownership structure. Another key distinction between EME and advanced country bank international expansion is that many of the more internationally oriented EME banks are affiliated with their home country sovereigns – either
Variations in selected performance metrics by ownership and international scope1
In per cent Graph 14
Customer deposits/total liabilities Loans/deposits Loans/total assets
Interbank borrowing/total liabilities ROA Equity/total assets
1 Based on balance sheet and income statement data at the individual foreign affiliate level for approximately 270 branches andsubsidiaries (unbalanced panel) of 75 EME and advanced country banks operating in 28 EMEs; simple averages of individual affiliate ratios.
Sources: Federal Reserve Bank of New York; Bankscope; national supervisory data; BIS calculations.
56
60
64
68
72
08 09 10 11 12
80
100
120
140
160
08 09 10 11 12
40
46
52
58
64
08 09 10 11 12
12
15
18
21
24
08 09 10 11 12
EM private banksEM state-owned banks
0.4
0.7
1.0
1.3
1.6
08 09 10 11 12
AE regional banksAE global banks
10
15
20
25
30
08 09 10 11 12
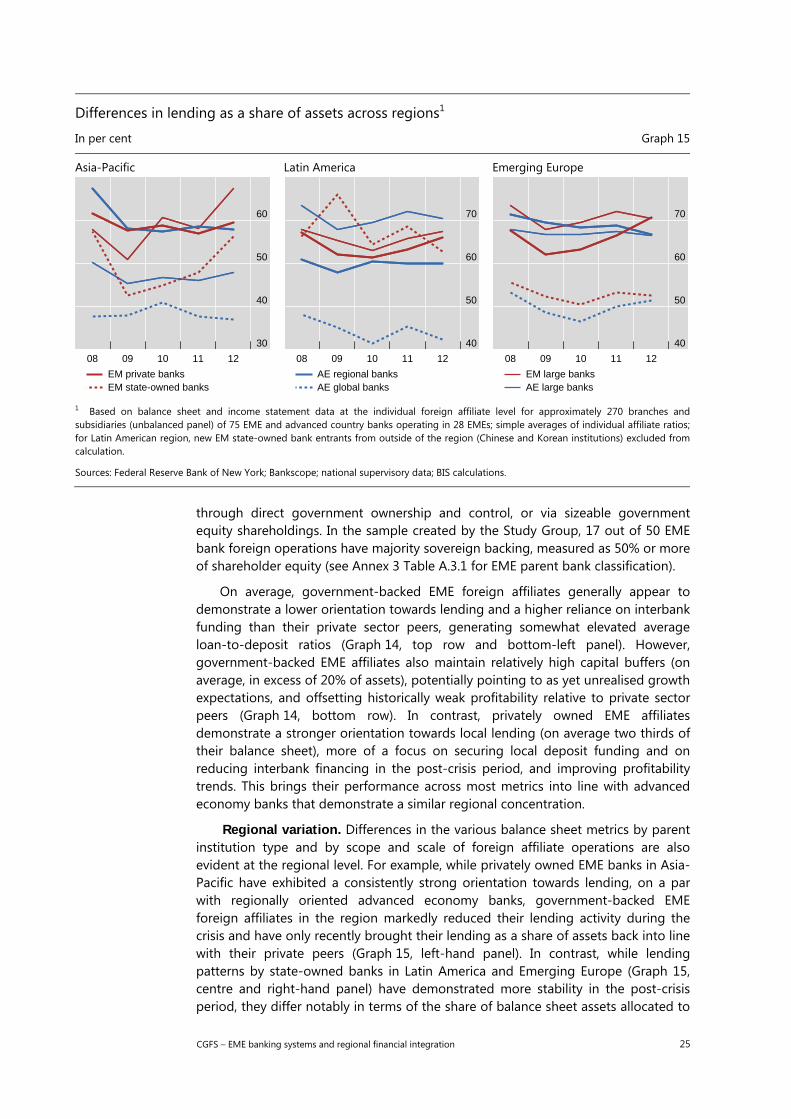
CGFS – EME banking systems and regional financial integration 25
Differences in lending as a share of assets across regions1
In per cent Graph 15
Asia-Pacific Latin America Emerging Europe
1 Based on balance sheet and income statement data at the individual foreign affiliate level for approximately 270 branches andsubsidiaries (unbalanced panel) of 75 EME and advanced country banks operating in 28 EMEs; simple averages of individual affiliate ratios; for Latin American region, new EM state-owned bank entrants from outside of the region (Chinese and Korean institutions) excluded fromcalculation.
Sources: Federal Reserve Bank of New York; Bankscope; national supervisory data; BIS calculations.
through direct government ownership and control, or via sizeable government equity shareholdings. In the sample created by the Study Group, 17 out of 50 EME bank foreign operations have majority sovereign backing, measured as 50% or more of shareholder equity (see Annex 3 Table A.3.1 for EME parent bank classification).
On average, government-backed EME foreign affiliates generally appear to demonstrate a lower orientation towards lending and a higher reliance on interbank funding than their private sector peers, generating somewhat elevated average loan-to-deposit ratios (Graph 14, top row and bottom-left panel). However, government-backed EME affiliates also maintain relatively high capital buffers (on average, in excess of 20% of assets), potentially pointing to as yet unrealised growth expectations, and offsetting historically weak profitability relative to private sector peers (Graph 14, bottom row). In contrast, privately owned EME affiliates demonstrate a stronger orientation towards local lending (on average two thirds of their balance sheet), more of a focus on securing local deposit funding and on reducing interbank financing in the post-crisis period, and improving profitability trends. This brings their performance across most metrics into line with advanced economy banks that demonstrate a similar regional concentration.
Regional variation. Differences in the various balance sheet metrics by parent institution type and by scope and scale of foreign affiliate operations are also evident at the regional level. For example, while privately owned EME banks in Asia-Pacific have exhibited a consistently strong orientation towards lending, on a par with regionally oriented advanced economy banks, government-backed EME foreign affiliates in the region markedly reduced their lending activity during the crisis and have only recently brought their lending as a share of assets back into line with their private peers (Graph 15, left-hand panel). In contrast, while lending patterns by state-owned banks in Latin America and Emerging Europe (Graph 15, centre and right-hand panel) have demonstrated more stability in the post-crisis period, they differ notably in terms of the share of balance sheet assets allocated to
30
40
50
60
08 09 10 11 12
EM private banksEM state-owned banks
40
50
60
70
08 09 10 11 12
AE regional banksAE global banks
40
50
60
70
08 09 10 11 12
EM large banksAE large banks
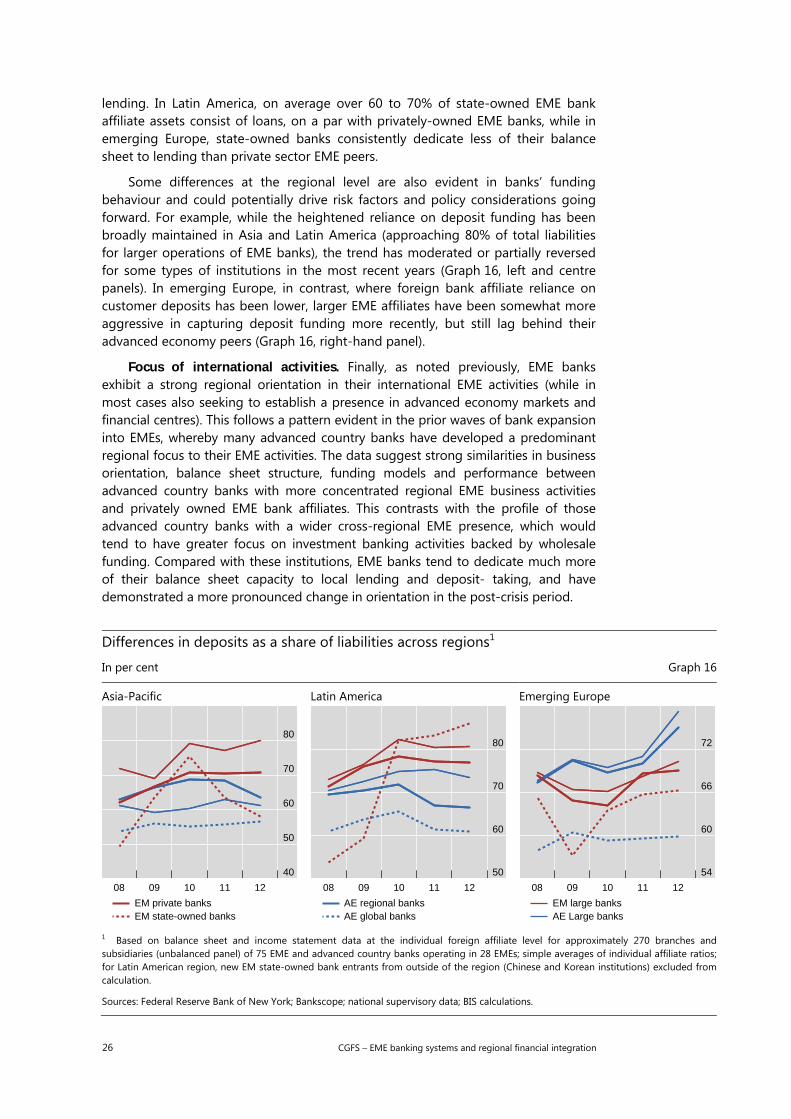
26 CGFS – EME banking systems and regional financial integration
lending. In Latin America, on average over 60 to 70% of state-owned EME bank affiliate assets consist of loans, on a par with privately-owned EME banks, while in emerging Europe, state-owned banks consistently dedicate less of their balance sheet to lending than private sector EME peers.
Some differences at the regional level are also evident in banks’ funding behaviour and could potentially drive risk factors and policy considerations going forward. For example, while the heightened reliance on deposit funding has been broadly maintained in Asia and Latin America (approaching 80% of total liabilities for larger operations of EME banks), the trend has moderated or partially reversed for some types of institutions in the most recent years (Graph 16, left and centre panels). In emerging Europe, in contrast, where foreign bank affiliate reliance on customer deposits has been lower, larger EME affiliates have been somewhat more aggressive in capturing deposit funding more recently, but still lag behind their advanced economy peers (Graph 16, right-hand panel).
Focus of international activities. Finally, as noted previously, EME banks exhibit a strong regional orientation in their international EME activities (while in most cases also seeking to establish a presence in advanced economy markets and financial centres). This follows a pattern evident in the prior waves of bank expansion into EMEs, whereby many advanced country banks have developed a predominant regional focus to their EME activities. The data suggest strong similarities in business orientation, balance sheet structure, funding models and performance between advanced country banks with more concentrated regional EME business activities and privately owned EME bank affiliates. This contrasts with the profile of those advanced country banks with a wider cross-regional EME presence, which would tend to have greater focus on investment banking activities backed by wholesale funding. Compared with these institutions, EME banks tend to dedicate much more of their balance sheet capacity to local lending and deposit- taking, and have demonstrated a more pronounced change in orientation in the post-crisis period.
Differences in deposits as a share of liabilities across regions1
In per cent Graph 16
Asia-Pacific Latin America Emerging Europe
1 Based on balance sheet and income statement data at the individual foreign affiliate level for approximately 270 branches andsubsidiaries (unbalanced panel) of 75 EME and advanced country banks operating in 28 EMEs; simple averages of individual affiliate ratios; for Latin American region, new EM state-owned bank entrants from outside of the region (Chinese and Korean institutions) excluded fromcalculation.
Sources: Federal Reserve Bank of New York; Bankscope; national supervisory data; BIS calculations.
40
50
60
70
80
08 09 10 11 12
EM private banksEM state-owned banks
50
60
70
80
08 09 10 11 12
AE regional banksAE global banks
54
60
66
72
08 09 10 11 12
EM large banksAE Large banks

CGFS – EME banking systems and regional financial integration 27
4. Implications for markets
The increasing internationalisation of EME banking systems and financial markets along the regional lines described in the previous sections entails benefits, but also potential hazards. Many of these resemble, although in a new guise, the earlier experience of financial integration of EMEs with advanced economy banks.29 Market participants, policymakers and supervisors can learn from this experience, to reap the benefits stemming from increased financial integration and avoid fuelling the kind of imbalances that have contributed to financial crises in the past.
4.1 Impact on the provision of financial services
Allocative efficiency and credit availability. In the current regional expansion, much like during earlier internationalisation episodes, the impact of foreign banks on the host country is likely to be markedly heterogeneous, according not only to the characteristics of banks expanding overseas and their scope and mode of operations in the host market, but also to differences in the home economies’ stage of development and the quality of institutions.30
Overall, the entrance of foreign banks will contribute to injecting new capital for lending in the host country, as well as enlarge the pool of available lenders. Domestic borrowers may overcome credit constraints arising from the limited lending capacity of incumbent institutions and even establish multiple lending relations with domestic and foreign banks (Allen et al (2011)). This will foster allocative efficiency in the host country, if lending practices become more dependent on formal credit standards and similar metrics, especially in economies where related party lending has been more widespread. Still, borrowers whose creditworthiness is harder to gauge for newly entering foreign banks, such as small and medium-sized enterprises, may find their credit curtailed unless domestic players expand their presence in this market segment.31
Specialised services and market deepening. As EME banks expand regionally abroad to service clients, they will tend to augment the provision of trade finance and cross-border corporate banking services, thereby intensifying the existing trade and investment links in the region, with mutual benefit for both host and home countries.32 Likewise, through the provision of market-making and similar services, they can contribute to deeper regional capital markets (including the availability of hedging instruments to help market participants better manage financial risk) and increase the availability of finance for trade and investment.
29 See CGFS (2004). 30 See, for example, Claessens and van Horen (2013). 31 “Cherry-picking” by foreign banks may be indicative of inadequate legal and accounting
infrastructure of the host country, rather than discrimination, a matter of concern for foreign and domestic banks as well as for the host authorities. See Detragiache et al (2006) and Mian (2006).
32 Global banks appear to account for only a fraction of the global supply of trade finance, with the bulk coming from local and regional banks. By some estimates, local banks (including foreign-owned subsidiaries) now often account for a majority of the bank financing in support of trade. See also CGFS (2014).
28 CGFS – EME banking systems and regional financial integration
Competition and business practices. Increased competition in the financial sector spurred by foreign entrants, when they have access to superior technologies or expertise in certain activities (eg in securities issuance and derivatives and foreign exchange operations), is known to help stimulate domestic banks to upgrade their business models, technical capabilities and risk management practices.33 Yet, in contrast to earlier episodes, starting conditions are different and many of the more straightforward benefits from market liberalisation and increased competition have already been reaped. As a result, the scope for further benefits may be greatest in less developed frontier markets, where foreign banks from other EMEs could bring expertise from home markets to bear in overcoming structural constraints. Foreign banks could also contribute to prodding host authorities to enact financial sector reforms, thereby helping to enhance the growth potential and efficiency of their host economies.
Diversification benefits. Another possible benefit, both for banks expanding abroad and for their home countries, is the gains from diversifying activities and risk. These gains are likely to be greater for home countries where expanding banks have been largely domestically focused, and therefore been subject to a relatively high degree of country-specific risk in their asset portfolios. Banks can potentially achieve such diversification benefits through greater cross-border exposures in their loan and securities portfolios, or by establishing a physical presence in foreign countries.
In practice, however, several factors may limit banks’ ability to achieve these benefits. First, since regulations on ownership and access of new banks are still under discussion in many jurisdictions (including rules concerning foreign banks’ mode of presence), regulatory developments are adding another dimension of uncertainty to banks’ regional expansion. Second, any dominance of incumbent banks in the host country’s banking sector may pose significant constraints (eg in terms of access to deposits). Third, to the extent that EME financial integration occurs among neighbouring countries, as described in the trends section above, gains from diversification may be harder to reap if countries’ business cycles – and economic shocks – are or become more closely correlated.34
4.2 Possible risks to financial stability
Risk-sharing versus risk concentration. Past experience suggests that a key trade-off determining the financial stability implications of increased regional integration involves its effects on regional risk-sharing and cross-border spillovers.
On the one hand, the entry of new foreign banks is likely to provide diversification benefits for the host country, which will facilitate international risk-
33 For example, Degryse et al (2013) provide evidence that rising competition reduces regional
banking system fragility, as measured by the likelihood of joint occurrences of extreme negative returns in banking system indices of countries in the region.
34 Empirical evidence suggests that past diversification gains of advanced economy banks with subsidiaries in emerging economies were indeed restrained by the regional pattern of bank expansion (see, for example, García-Herrero and Vázquez (2013)).
CGFS – EME banking systems and regional financial integration 29
sharing.35 For instance, domestic supply shocks can be absorbed more smoothly by foreign banks, if they can draw on parent bank funding.36 In addition, deeper integration into a network of domestic co-lenders and geographical proximity may contribute to more stable cross-border credit during crisis episodes that originate outside the host country.
On the other hand, foreign banks, including those from other EMEs, can be a conduit of instability through several channels. For instance, contagion may spread through direct exposures, such as when shocks adversely affecting the parent bank balance sheet spill over to the host country. As the parent bank tries to cut back host operations and transfers resources from its affiliates, it would threaten local financial systems with a sudden contraction in lending or other activities.37 In addition, financial instability may also spill over via asset prices or through the breakdown of interbank markets; it can also result from competitive pressures if attempts to build market share induce overly aggressive risk pricing.38 To the extent that said channels of contagion amplify each other, foreign bank funding shocks may end up being synchronised, implying that foreign bank presence can be a source of tail risk.39
Size of host economy and dependence on foreign banks. How large these costs and benefits are in practice, in turn, will depend largely on the size of the host economy and its dependence on foreign banks, as well as these banks’ mode of expansion and the business models adopted by their foreign affiliates. Since, up to now, EME bank expansion into regional markets remains relatively small, both as a share of parent assets and as a share of host financial systems, any such risks are unlikely to accumulate rapidly. Furthermore, since it is smaller EME banks that rely more on interbank and parent borrowing (see Section 3 above), their shock transmission capacity to host countries may be limited.
Yet, issues may still arise for individual host countries. This applies, in particular, if the host is both small and highly dependent on foreign banks headquartered in a single home jurisdiction, which could hence become systemically relevant from a host country perspective. As a result, concerns over possible risks from foreign bank participation would be particularly relevant for small frontier countries, such as Cambodia and Vietnam in Asia, or El Salvador, Honduras and Nicaragua in Central
35 See, for example, De Haas and van Horen (2013) for evidence of the potential financial stability
benefits of cross-border banking in the face of host country and global shocks, respectively. For a more general discussion of international risk sharing, see van Wincoop, (1999).
36 The empirical evidence on how foreign banks react to distress in an emerging country is still confined to the experience of advanced economy banks. See, for example, Crystal et al (2001) and De Haas and van Lelyveld (2010).
37 See Fender and McGuire (2010) for a conceptual framework. Peek and Rosengren (2000) and Bruno and Shin (2013) discuss historical examples.
38 See Allen and Gale (2000) for spillovers through balance sheet exposures, Brunnermeier et al (2009) for spillovers via asset prices, and Huang and Ratnovski (2011) for contagion effects arising from coordination failures.
39 Morgan et al (2004) present a model where multinational banks, by reallocating capital across borders, absorb local shocks or transmit foreign shocks. In their setup, bank integration is among the US states, and the effect on credit fluctuations is shown to depend also on the nature of the shock hitting the economy. Bacchetta and van Wincoop (2013) present an alternative model in which countries above a certain threshold of integration will become more susceptible to a synchronised panic, as happened during the 2008 global financial crisis.
30 CGFS – EME banking systems and regional financial integration
America. For example, Colombian banks account for over 50% of bank assets in El Salvador and more than 20% in Nicaragua and Honduras.
Patterns of bank expansion. The relationship between regional financial integration and financial stability in host and home countries will also be shaped by the organisational structure adopted by institutions in their expansion abroad. As noted above (see Section 3), privately owned EME banks, in particular, tend to display similar balance sheet structures, funding models and performance metrics when compared with their more regionally oriented advanced economy peers. This suggests that previous experience with the expansion of advanced economy banks can be a useful guide to understanding which dimensions of institutional and market organisation can affect the transmission of shocks into the host economy.
One important dimension is the degree of foreign and, in particular, cross-border credit extended. Historically, countries with a larger share of foreign claims extended through the local affiliates of foreign banks have enjoyed more stable foreign financing than those whose foreign credit was obtained cross-border, enhancing resilience to shocks.40 Similarly, high rates of dependence on foreign funding may provide incentives for excessive growth of foreign currency lending if the exchange rate regime or other factors tempt borrowers into neglecting currency risk.41 This, in turn, would expose the host economy to an additional source of vulnerability to the extent that the lending is to unhedged borrowers.42 The third dimension related to the mode of presence concerns branch versus subsidiary structures. A view that local lending by branches may be more volatile than lending by subsidiaries has led many EME policymakers to require greater self-sufficiency of local operations of foreign banks in their jurisdiction, which frequently includes better asset-liability matching by foreign bank operations, and sometimes entails full subsidiarisation (see Section 5).
4.3 Risk management challenges for banks and markets
International expansion of banks within EME regions raises a number of risk management challenges. Since legal, regulatory and cultural environments can be very heterogeneous even within regions, risk managers will need to take proper account of country-specific factors.
Risk management capacity. The risk management capacity of EME banks that have newly entered into international businesses or are rapidly expanding into new international business lines may be constrained in the short term (human resources,
40 See García-Herrero and Martínez Pería (2007) for pre-crisis experience, McCauley et al (2010) for
the 2008–09 crisis episode, and Cull and Martínez Pería (2010) for the contrasting crisis experience in Latin America, where affiliates (mainly Spanish) were predominantly locally funded, and western European banks in central and eastern Europe (CEE), where cross-border funding played a central role.
41 While fixed or managed exchange rate regimes are known to potentially inflate the incentives of borrowers to seek such loans, IMF (2013a) discusses how macroeconomic stability and credible monetary and exchange rate regimes in the CEE region appear to have contributed, albeit only marginally, to curbing demand.
42 This was the case in several central and eastern European countries during the 2000s. Foreign currency loans in CEE countries, which were originally introduced by affiliates of foreign banks, later became common also among domestic banks (Brown and De Haas (2010)). In some cases, a large foreign currency deposit base contributed to banks’ incentives to provide such loans.
CGFS – EME banking systems and regional financial integration 31
IT systems, familiarity with domestic rules and regulations, etc). Banks interviewed recognised that operating in multiple (and new) jurisdictions demands careful monitoring of the management of the balance sheet, because of the new dimensions that market, credit and liquidity risks may assume. In their expansion abroad, banks need to invest significant resources to establish local relationships in the host countries and develop sufficient local credit market analysis skills. Especially for smaller banks, ensuring that operations in both home and host countries remain subject to common standards is likely to be challenging. Smaller EME banks in the host country may also face difficulty obtaining non-bank deposits, particularly in the domestic currency.
Rollover and exchange rate risks. Managing foreign currency liquidity risks is among the biggest challenges for banks that rely on wholesale funding in foreign currencies, including US dollars. In this respect, since expanding EME banks may lack a track record in international funding markets, they may also be more vulnerable to a pullback in funding in times of market stress than their major global bank peers.43 Corporate clients, in turn, can build up significant foreign currency funding needs, which may add to rollover and exchange rate risks from both individual banks’ and systemic perspectives. In seeking to learn from the crisis experience, according to the Group’s interviews, banks place increased emphasis on their management of foreign currency liquidity risks, taking account of their own business models and unique features of individual financial markets of host countries. To enhance these efforts, supervisors should develop explicit guidance for the risk management functions of regionally expanding banks (see Section 5 below).
Limited depth of local markets. The lack of deep and liquid markets for hedging instruments can pose a significant challenge for the management of risks resulting from currency and maturity mismatch. During the recent financial crisis, dysfunctional cross-currency swap markets and substantial cuts in interbank credit lines emerged as a major risk factor for foreign banks’ local currency operations in some EMEs. One issue is that there is a tendency among EMEs for local currency liquidity to be unevenly distributed in favour of a small number of major domestic banks. While foreign banks are normally net borrowers in local interbank markets, transactions in money markets tend to be inactive, and their maturity structure is concentrated in the overnight tenor. Underdevelopment of collateralised funding markets (ie repos), partially due to the relative scarcity of high-quality assets in EMEs, further adds to the difficulties of local currency liquidity management.44 Market illiquidity and a narrow domestic investor base also hamper liquidity management in many EMEs in Latin America, emerging Europe and the Middle East and Africa.45
43 Indeed, Schnabl (2012), in a study of the consequences for Peruvian credit of the liquidity shock
after the Russian default, finds that domestic banks that borrowed internationally in wholesale markets were more affected than foreign banks active in Peru.
44 For more discussion, see EMEAP Central Banks (2010). 45 See FSB, IMF and World Bank (2011).
32 CGFS – EME banking systems and regional financial integration
5. Implications for policy
5.1 Improving market infrastructure and regulatory environment
Improving regulatory environments and market infrastructures may enable EMEs to reap maximum benefits from regional financial integration, while limiting associated costs. In this regard, there are several familiar policy considerations.
Improving local market infrastructures. Although many banks active in EMEs are competing intensely for stable local sources of funding (see Section 3 above), the availability of these funds is often constrained not only by the strong position of incumbent banks, but also by less developed local bond and derivatives markets as well as limited pools of institutional investor demand for long-dated local issuance. Central banks and other policymakers can help ease these constraints by stepping up their efforts to develop local bond markets and improve local market infrastructure, as needed.46 Further developing local bond markets as well as those for liquid and efficient currency hedging instruments (eg for EME currencies against US dollars), for example, would contribute to reducing risks resulting from currency and maturity mismatch.
Regional initiatives can be an important tool in this context, due to economies of scale and the ability to overcome constraints facing individual countries. One example is the Asian Bond Market Initiative (ABMI), which was launched in 2003 as part of the ASEAN+3 processes to promote regional local currency bond markets. The ABMI was recently enhanced by the establishment of a trust fund, the Credit Guarantee and Investment Facility (CGIF), which provides credit guarantees for local currency-denominated corporate bonds issued in the ASEAN+3 jurisdictions. Similarly, in the early 2000s, EMEAP (the Executives’ Meeting of East Asia and Pacific Central Banks) launched a bond fund targeting member countries’ sovereign and quasi-sovereign bonds in which member central banks collectively invest part of their foreign reserves. Both efforts are generally credited with having played a catalytic role in the recent expansion of bond markets in the Asian region.
Regulatory trade-offs. Given the risks arising from currency mismatches and the transmission of spillovers through parent bank-subsidiary relationships, a case can be made for promoting autonomy of funding of foreign affiliates. Such funding autonomy might be particularly compelling in the case of cross-border banking among EMEs, because frameworks of cross-border supervision and resolution tend to be less developed among EMEs than between EMEs and their advanced country peers. This has led a number of EME policymakers to require greater self-sufficiency of local operations of foreign banks in their jurisdictions. Although this practice (which sometimes entails full legal subsidiarisation) may be justified by systemic risk considerations, at least until more explicit frameworks for cross-border supervision and resolution have been agreed (see below), it comes at a cost.47 For instance,
46 The diagnostic framework jointly authored by the IMF, World Bank, EBRD and OECD would be
useful in this regard, to help policymakers to analyse the state and efficiency of local currency bond markets and provide a basis for designing a strategy for market deepening, taking into account country-specific circumstances. See IMF (2013c).
47 Still, according to IMF (2011) “given the diversity of business lines and the varying objectives and stages of financial development of different countries, there is no one obvious structure that is best
CGFS – EME banking systems and regional financial integration 33
subsidiarisation may hinder the movement of funds among affiliates within the same holding company, while at the same time raising the affiliate’s operational costs. In implementing subsidiarisation measures, any systemic risk benefits will thus have to be traded off against the risk of deterring foreign banks with a preference for branch-based expansion (eg because they are focused on corporate financing rather than retail banking) or those that seek to avoid the possibly high upfront capital costs required for subsidiarisation.
Another example for such regulatory policy trade-offs is requirements for banks to fulfil certain minimum criteria with regard to key balance sheet metrics, such as holding a minimum amount of local deposits (in the form of maximum lending/deposit ratios), as is already mandatory for banks operating in in some Latin American and Asia-Pacific countries. Such measures may not be feasible in host countries where the domestic deposit base is narrow, due to the effect of intensified competition for deposits on domestic banks’ profitability and possible longer-run implications for the stability of retail funding.
Supervisory coordination. With growing intraregional financial integration through banks' cross-border activities, it is increasingly important to ensure information-sharing and coordination of bank supervision between home and host authorities at the regional level. Such efforts will be particularly important for host jurisdictions where foreign banks have large, systemic presence. In such cases, the activities of these foreign banks would have implications for the host financial system as a whole, so information-sharing and coordination between macro- and
Box 3
Examples of supervisory home-host cooperation
Two prominent examples of cross-border cooperation, started at the height of the global financial crisis, involve emerging European economies. The first, within the Vienna Initiative (VI), was established in early 2009 in response to growing fears about a severe destabilisation of central, eastern and southern Europe (CESEE) in the wake of the withdrawal by multinational banks. The VI was a novel public-private sector platform to safeguard a continued commitment of parent banks to their subsidiaries. It involved, on the one hand, the key parent bank groups, mainly from western Europe; on the other, it brought together both host and home countries’ authorities and multilateral organisations (such as the IMF, European Bank for Reconstruction and Development (EBRD) and World Bank) which provided large-scale financial support. The VI was revived in 2012, as the Vienna Initiative 2, to further foster home and host authority coordination in support of stable cross-border banking, amid concerns over disorderly deleveraging by western European banks in the region and related fragmentation risks. So far, the deleveraging process has generally remained orderly, even though the contribution of the VI2 is hard to establish.
The second example of cross-border coordination is the Nordic-Baltic MoU on crisis management launched in 2010. This framework brings together ministries of finance, central banks and supervisory agencies from Sweden, Denmark, Finland, Norway, Iceland, Estonia, Latvia and Lithuania. It seeks to establish an effective regional supervision framework underpinned by various cooperation agreements, and the newly formed Nordic-Baltic Stability Group and Macroprudential Forum. Notably, it has focused so far on establishing a burden-sharing mechanism and a common database for financial groups, as well as on conducting cross-border crisis simulations. De Haas et al (2013) and Cetorelli and Goldberg (2011) provide empirical evidence on the stabilising impact of the Vienna Initiative in the CESEE region.
suited in all cases for cross border expansion – one size does not fit all when it comes to the choice of organizational structure”.
34 CGFS – EME banking systems and regional financial integration
microprudential authorities would also be important.48 This should begin in non-crisis times, including through the agreement of information-sharing protocols among supervisors and, more generally, through enhanced EME data reporting (such as participation in the BIS international banking statistics) and discussion of macroprudential considerations in supervisory colleges, crisis management groups (CMGs) and other country forums. Interactions could then intensify if and when instability arises. There are a number of recent cases of such cooperative efforts in the area of supervision and resolution of cross-border banks involving EMEs (see Box 3). Colleges of supervisors and CMGs also exist for individual financial institutions, while many regions have other bodies for supervisory cooperation at the country level (eg the Cross-Border Stability Groups in the European Union and a number of regional arrangements based on memoranda of understanding (MoUs) in Central American and Caribbean and some African countries).
In this context, much attention has been paid to cases where global systemically important financial institutions (G-SIFIs) headquartered in advanced economies have subsidiaries or branches in EMEs. In these cases, it is easy to imagine that decisions by the parent bank or home country authorities in response to an external shock can destabilise the financial system in the host country.
Conversely, however, conflicts could also arise if problems in a banks’ foreign EME operation (or actions by the host regulator to resolve these problems) adversely affect the parent bank. In the future, as EME banks’ size and scope of businesses in their respective regions expand, it is thus likely that home-host coordination between EMEs in the same region will gain in importance.49 Such home-host coordination among regional EMEs may be more challenging than cooperation of EMEs with advanced country authorities, especially for smaller EME countries, if supervisors are more tightly resourced or have less experience with cross-border issues. Another challenge is implementation lags, as foreign bank expansion may proceed more quickly than the time required to establish effective information-sharing and cooperation agreements among supervisors.
Risk management guidance. Given the practical risk management challenges faced by regionally expanding banks, supervisors in home and host jurisdictions need to enhance the efforts made at the individual institution level by developing explicit guidance and supervisory expectations for banks’ risk management frameworks. Specifically, banks should be encouraged to exercise close oversight of their overseas operations and adequately manage their risks, including through prudent management of their liquidity positions by currency and by diversifying funding sources and counterparties as much as possible. Capital market borrowers, in turn, need to be aware of potential rollover and exchange rate risks and, where possible, should use hedging tools and staggered refinancing profiles to limit exposure to market disruptions.
A key tool in providing such guidance can be supervisory stress tests. Given the scope for increasing regional spillovers, banks’ stress testing should involve a
48 See CGFS (2012b) and IMF (2013b) for guidance on arrangements to promote effective cooperation
between both macro- and microprudential policies. 49 Examples include Hungarian banks’ subsidiaries in Bulgaria and Montenegro, Colombian banks’
subsidiaries in El Salvador and Nicaragua, and South African banks in Namibia or Swaziland, which already account for a substantial share in financial assets of the respective host countries. See Impavido et al (2013) and Banco de la República (2013).
CGFS – EME banking systems and regional financial integration 35
scenario that incorporates assumptions about the regional transmission of shocks and possible regulatory responses to such spillovers. Stress tests, which are normally run at the group level using consolidated bank group data, typically do not incorporate the effects of regulatory differences across countries (eg from minimum total capital adequacy ratios, regulations on liquidity, and leverage) and assume free flow of capital and liquidity within the banking group. Hence, stress tests should envisage the impact of measures to limit the free flow of capital and liquidity, arising from possible attempts by regulators to ring-fence their domestic banking system (hampering cross-border banking groups’ ability to reallocate funds from subsidiaries with excess capital and/or liquidity to those in need of capital and/or liquidity; see, for example, Cerutti et al (2012)).
5.2 Crisis prevention and resolution
Addressing regional spillovers. One aspect of strengthening intraregional financial linkages is that they may increase the probability for idiosyncratic shocks, such as defaults of individual financial institutions, to trigger market disruptions in the entire region. Hence, the formulation of crisis prevention and management frameworks would become important. As a first step, adequate monitoring of systemic risks (see also Annex 4) and their mutual assessment in appropriate country forums should help to reduce the risk of such disruptions. This would add to current regulatory initiatives (such as Basel III for banks, higher solvency and liquidity requirements for insurers, reforms to over-the-counter (OTC) derivatives markets and work on recovery and resolution plans (RRPs) for systemically important financial institutions), which are aimed at improving the resilience of the global financial system through enhanced capital and liquidity cushions, collateralisation of financial exposures and improved procedures for an orderly wind-down of failed financial institutions.50
Once events such as the default of a financial institution occur, it is essential to swiftly assess their impact on national and regional financial markets and settlement systems, and to judge whether policy measures (possibly including bilaterally or multilaterally agreed actions) are necessary to prevent or minimise the spillover of shocks. In doing so, it would be desirable for central banks and regulators of a given home country to provide warnings and information on potential stress at institutions (or other sources of financial shocks) for the authorities in the relevant regional host countries, so that these have enough time and information to handle the situation. At the same time, assurances are likely to be needed that host supervisors do not take unilateral actions to protect stability (ring-fencing) to the detriment of financial groups’ health or systemic stability in other jurisdictions. Regular discussions in supervisory colleges, CMGs or multilateral frameworks would facilitate orderly ex ante planning and predictability of such measures.
Strengthening safety nets. Meanwhile, central banks – particularly those in EME regions – could consider contributing to strengthening existing safety nets against possible liquidity crises. While access to standing liquidity facilities in domestic currencies is within the purview of host country monetary authorities, measures for the provision of foreign currency liquidity require a more international
50 On potential unintended consequences of these initiatives for EMEs, see FSB, IMF and World Bank
(2012).
36 CGFS – EME banking systems and regional financial integration
approach. For example, part of the post-Lehman crisis response in 2008 was an ad hoc system of swap arrangements among major central banks, which allowed the on-distribution of foreign currency liquidity to banks with large rollover needs in US dollars and other major currencies. While this has led to calls for more permanent swap arrangements, risk management considerations and concerns over adverse incentives for bank risk-taking have meant that the most viable approach at the global level remains one based on constructive ambiguity paired with efforts to remove possible technical obstacles to the implementation of ad hoc swap lines.51 Indeed, one lesson of the post-Lehman experience is that, if deemed appropriate, such swap lines can be established promptly.
That said, more permanent solutions may be more easily accomplished at the regional level, where regional financial arrangements (RFAs) already exist and are being expanded. One example for such a regional response is the Chang Mai Initiative Multilateralisation (CMIM) Agreement, which serves to expand swap arrangements within the region (see Box 4).52 Despite their relatively early stage of
Box 4
The Chiang Mai Initiative Multilateralisation (CMIM) Agreement
The Chiang Mai Initiative Multilateralisation (CMIM) Agreement is a multilateral currency swap arrangement between the ministries of finance and central banks of the ASEAN+3 countries, including Hong Kong. The arrangement came into force on 24 March 2010 and allows participants to swap local currency funds with one another for US dollars, to address balance of payment and short-term liquidity difficulties in the region. The maximum amount of US dollars that a participant could obtain was determined by its contribution amount multiplied by a purchasing multiple, but 80% of this amount was contingent on the existence of an IMF lending programme (the “IMF-linked tranche”). Each drawing was for a period of 90 days, and could be rolled over a maximum of seven times.
In May 2012, it was agreed to enhance the CMIM by doubling its size from $120 billion to $240 billion and decreasing the portion contingent on the existence of an IMF lending programme (“IMF linked tranche”) to 70%. It was also agreed to adjust the length of the available maturities and supporting periods. From a maturity of 90 days and supporting period of two years, for the IMF-linked portion, the maturity was extended to one year with the possibility of two renewals, totalling up to three years overall. For the IMF delinked portion, in turn, the maturity was lengthened to six months with three renewals allowed, totalling up to two years. Drawings and renewals require a two thirds majority, based on a weighted voting system. In addition, a CMIM Precautionary Line was introduced to allow participants with strong economic fundamentals to draw funds, within the maximum swap amount set aside for that country, for either precautionary or resolution purposes. The use of both facilities (which have not yet been drawn) comes with certain preconditions, such as completion of a review of the economic and financial situation and no past events of default. The revised CMIM Agreement is currently undergoing members’ signing and legal processes.
The arrangement was developed from the Chiang Mai Initiative bilateral swap network established in the aftermath of the 1997–98 Asian financial crisis, and supplements existing international financial arrangements to mitigate external shocks. To facilitate surveillance, the ASEAN+3 Macroeconomic Research Office was established to monitor and analyse the regional economies and contribute to the CMIM decision-making process.
The total size of the original arrangement, as of March 2010, was $120 billion.
51 For a fuller discussion, see CGFS (2010a,b) and CGFS (2011). 52 Other RFAs include the European Stability Mechanism (ESM), and the much smaller Eurasian
Economic Community Anti Crisis Fund, Latin American Reserve Fund, and Arab Monetary Fund .
CGFS – EME banking systems and regional financial integration 37
development, RFAs offer a number of potential advantages, such as regional expertise and ex ante clarity, that can provide confidence-enhancing effects and help address idiosyncratic and (at least smaller-sized) regional shocks – provided that effective conditionality arrangements can be put in place. Along the same lines, efforts have been made bilaterally to broaden the use of cross-border collateral arrangements (CBCAs), which can be an effective shock mitigant in cases of dysfunction in individual local markets. CBCAs may be a particularly attractive policy option for EMEs, as they allow liquidity to be made available to foreign affiliates against a broader range of assets, aiding central bank responses in times of market stress.53
53 In emerging Asia, CBCAs have been established, for instance, between the Central Bank of Malaysia
and the Monetary Authority of Singapore, and between the Central Bank of Malaysia and the Bank of Thailand.

CGFS – EME banking systems and regional financial integration 39
References
Allen, F, T Beck, E Carletti, P Lane, D Schoenmaker and W Wagner (2011): “Cross-border banking in Europe: implications for financial stability and macroeconomic policies”, CEPR Report.
Allen, F and D Gale (2000): “Financial contagion“, Journal of Political Economy, vol 108, pp 1–33.
Bacchetta, P and E van Wincoop (2013): “The great recession: a self-fulfilling global panic”, NBER Working Papers, no 19062.
Banco de la República (Colombia) (2013): “Internationalization of Colombian banks: recent developments and challenges for supervision”, background paper for the BIS meeting of central bank Governors of Latin America and the Caribbean.
Bank for International Settlements (2013a): “Highlights of the BIS international statistics”, BIS Quarterly Review, September, pp 13–23.
——— (2013b): “Foreign exchange turnover in April 2013: preliminary global results”, Triennial Central Bank Survey.
Berger, A, C Buch, G DeLong, and R DeYoung (2004): “Exporting financial institutions management via foreign direct investment mergers and acquisitions“, Journal of International Money and Finance, vol 23, pp 333–66.
Brown, M and R De Haas (2010): “Foreign currency lending in emerging Europe: bank-level evidence”, EBRD Working Paper, no 122.
Brunnermeier, M, A Crockett, C Goodhart, A Persaud, and H Shin (2009): “The fundamental principles of financial regulation”, 11th Geneva Report on the World Economy, ICMB, Geneva, and CEPR, London.
Bruno, V and H Shin (2013): “Capital flows, cross-border banking and global liquidity”, NBER Working Papers, no 19038.
Cecchetti, S, I Fender and P McGuire (2011): “Toward a global risk map”, in European Central Bank (ed), Central Bank Statistics: What did the financial crisis change?, February, Frankfurt, pp 73–100.
Cerutti, E, S Claessens and P McGuire (2012): “Systemic risks in global banking: what can available data tell us and what more data are needed?”, BIS Working Papers, no 376.
Cetorelli, N and L Goldberg (2011): “Global banks and international shock transmission: evidence from the crisis”, IMF Economic Review, vol 59, no 1, pp 41–76.
Čihák, M and A Demirgüç-Kunt (2013): “Rethinking the state’s role in finance”, Policy Research Working Paper, World Bank, April.
Claessens, S and N van Horen (2012): “Being a foreigner among domestic banks”, Journal of Banking and Finance, vol 36, pp 1276–90.
——— (2013): “Impact of foreign banks”, DNB Working Papers, no 370.
Committee on the Global Financial System (2004): “Foreign direct investment in the financial sector of emerging market economies”, CGFS Publications, no 22.
——— (2010a): “The functioning and resilience of cross-border funding markets”, CGFS Publications, no 37.
40 CGFS – EME banking systems and regional financial integration
——— (2010b): “Funding patterns and liquidity management of internationally active banks”, CGFS Publications, no 39.
——— (2011): “Global liquidity – concept, measurement and policy implications”, CGFS Publications, no 45.
——— (2012a): “Improving the BIS international banking statistics”, CGFS Publications, no 47.
——— (2012b): “Operationalising the selection and application of macroprudential instruments”, CGFS Publications, no 48.
——— (2014): “Trade finance: developments and issues”, CGFS Publications, no 50.
Coudert, V, K Hervé and P Mabille (2013): “Internationalization versus regionalization in the emerging stock markets”, CEPII Working Papers, no 2013-08.
Crystal, J, B Dages and L Goldberg (2001): “Does foreign ownership contribute to sounder banks in emerging markets? The Latin American experience”, Federal Reserve Bank of New York, Staff Report, no 137.
Cull, R and M Martínez Pería (2010): “Foreign bank participation in developing countries: what do we know about the drivers and consequences of this phenomenon?”, World Bank Policy Research Working Paper Series, no 5398.
Degryse, H, M A Elahi and M F Penas (2013): “Determinants of Banking System Fragility: A Regional Perspective”, ECB Working Paper Series, no 1567.
De Haas, R, Y Korniyenko, E Loukoianova and A Pivovarsky (2012): “Foreign banks and the Vienna Initiative: turning sinners into saints?”, IMF Working Papers, WP/12/117.
De Haas, R and N van Horen (2013): “Running for the exit? International bank lending during a financial crisis”, Review of Financial Studies, vol 26, no 1, pp 244–85.
De Haas, R and I van Lelyveld (2010): “Internal capital markets and lending by multinational bank subsidiaries”, Journal of Financial Intermediation, vol 19, no 1, pp 1–25.
Detragiache, E, T Tressel and P Gupta (2006): “Foreign banks in poor countries: theory and evidence”, IMF Working Papers, WP/06/18.
Eichner, M, D Kohn and M Palumbo (2010): “Financial statistics for the United States and the crisis: what did they get right, what did they miss, and how should they change?”, Finance and Economics Discussion Series, no 2010–20, Washington DC.
Executives’ Meeting of East Asia-Pacific Central Banks (2010): “Liquidity management in EMEAP money markets: possible vulnerabilities and scope for cooperation”, special report from the EMEAP Working Group on Financial Markets.
Fender, I and P McGuire (2010): “Bank structure, funding risk and the transmission of shocks across countries: concepts and measurement”, BIS Quarterly Review, September, pp 63–79.
Financial Stability Board, International Monetary Fund and World Bank (2011): “Financial stability issues in emerging market and developing economies”, Report to the G20 Finance Ministers and Central Bank Governors.
CGFS – EME banking systems and regional financial integration 41
——— (2012): “Identifying the effects of regulatory reforms on emerging market and developing economies: a review of potential unintended consequences”, Report to the G20 Finance Ministers and Central Bank Governors.
García-Herrero, A and M Martínez Pería (2007): “The mix of international banks’ foreign claims: determinants and implications”, Journal of Banking and Finance, vol 31, no 6, pp 1613–31.
García-Herrero, A and F Vázquez (2013): “International diversification gains and home bias in banking”, Journal of Banking and Finance, vol 37, no 7, pp 2560–71.
Huang, R and L Ratnovski (2011): “The dark side of bank wholesale funding”, Journal of Financial Intermediation, vol 20, no 2, pp 248–63.
Impavido, G, H Rudolph and L Ruggerone (2013): “Bank funding in Central, Eastern and South Eastern Europe post Lehman: a ‘new normal’?”, IMF Working Papers, WP/13/148.
International Monetary Fund (2011): “Cross-cutting themes in advanced economies with emerging market banking links“, Mimeo, November.
——— (2013a): “Financing future growth: the evolving role of banking in CESEE“, World Economic and Financial Surveys.
——— (2013b): “Macroprudential and microprudential policies: toward cohabitation“ ,IMF Staff Discussion Notes, SDN 13/05, June.
——— (2013c): “Local currency bond markets – a diagnostic framework”, Prepared by a joint IMF, World Bank, EBRD, and OECD working group in consultation with regional development banks and the Bundesbank, July.
McCauley, R, P McGuire and G von Peter (2010): “The architecture of global banking: from international to multinational?”, BIS Quarterly Review, March, pp 25–37.
Mian, A (2006): “Distance constraints: the limits of foreign lending in poor economies”, Journal of Finance, vol 61, no 3, pp 1465–505.
Morgan, D, B Rime and P Strahan (2004): “Bank integration and state business cycles”, Quarterly Journal of Economics, vol 119, no 4, pp 1555–84.
Peek, J and E Rosengren (2000): “Collateral damage: effects of the Japanese bank crisis on real activity in the United States”, American Economic Review, vol 90, no 1, pp 30–45.
Reserve Bank of Australia (2013): “Box A: Australian Bank Activity in Asia”, Financial Stability Review, March.
Schnabl, P (2012): “The international transmission of bank liquidity shocks: evidence from emerging market”, Journal of Finance, vol 67, no 3, pp 897–932.
Schoenmaker, D and W Wagner (2013): “Cross-border banking in Europe and financial stability”, International Finance, vol 16, no 1, pp 1–22.
van Horen, N (2007): “Foreign banking in developing countries: origin matters”, Emerging Markets Review, vol 8, pp 81–105.
van Wincoop, E (1999): “How big are potential welfare gains from international risk-sharing?”, Journal of International Economics, vol 47, pp 109–35.
World Bank (2013): “Recent Developments in Local Currency Bond Markets”, Note for the G20 Finance Ministers and Central Bank Governors, October.

CGFS – EME banking systems and regional financial integration 43
Annex 1 Study Group mandate
Scope of work
To develop a central bank perspective on the system-wide implications of current regional financial integration trends involving EME banking systems and to draw broad conclusions for policymakers, the CGFS is establishing a Study Group on “EME banking systems and regional financial integration”. The Group will examine the drivers of ongoing changes in regional cross-linkages between EME financial markets and banking systems with a view to understanding whether there are any financial market or financial stability implications. The Group’s work will build on past efforts by the Committee, particularly in the context of foreign direct investment in the financial sector of emerging economies,54 and will seek to establish how these past assessments have changed in the light of recent developments.
As part of its work, the Group would seek to identify indicators and statistics that can help the Committee to track regional integration trends in EME financial systems over time. It would also aim to consider the implications of increased regionalisation for key specialised finance markets, such as trade and infrastructure finance.
Key questions to be addressed would include:
1. Establishing current developments and their drivers
Key developments: Is the current trend of regional financial integration among EMEs a broad-based or localised phenomenon? Which activities, markets and jurisdictions are particularly affected? What is the role of state-owned banks?
Main drivers: What are the main drivers of these changes (eg intra-EME trade, deleveraging)? How important are institutional arrangements (eg exchange rate and foreign trade regimes), the legal infrastructure, economic policies and regulatory approaches? What is the role played by the internationalisation strategies of regional corporates and of any constraints applying to the expansion of their activities?
Indicators and statistics: Can individual examples of regional integration and information from soft sources, such as market intelligence, be underpinned by actual data? What indicators and statistics can be used to track regionalisation trends over time? Are there any data gaps that would need to be addressed?
54 See CGFS (2004), “Foreign direct investment in the financial sector of emerging economies”, CGFS
Papers no 22 (Working Group report), and CGFS (2005), “Foreign direct investment in the financial sector – experiences in Asia, central and eastern Europe and Latin America”, CGFS Papers no 25 (summary of follow-up workshops).
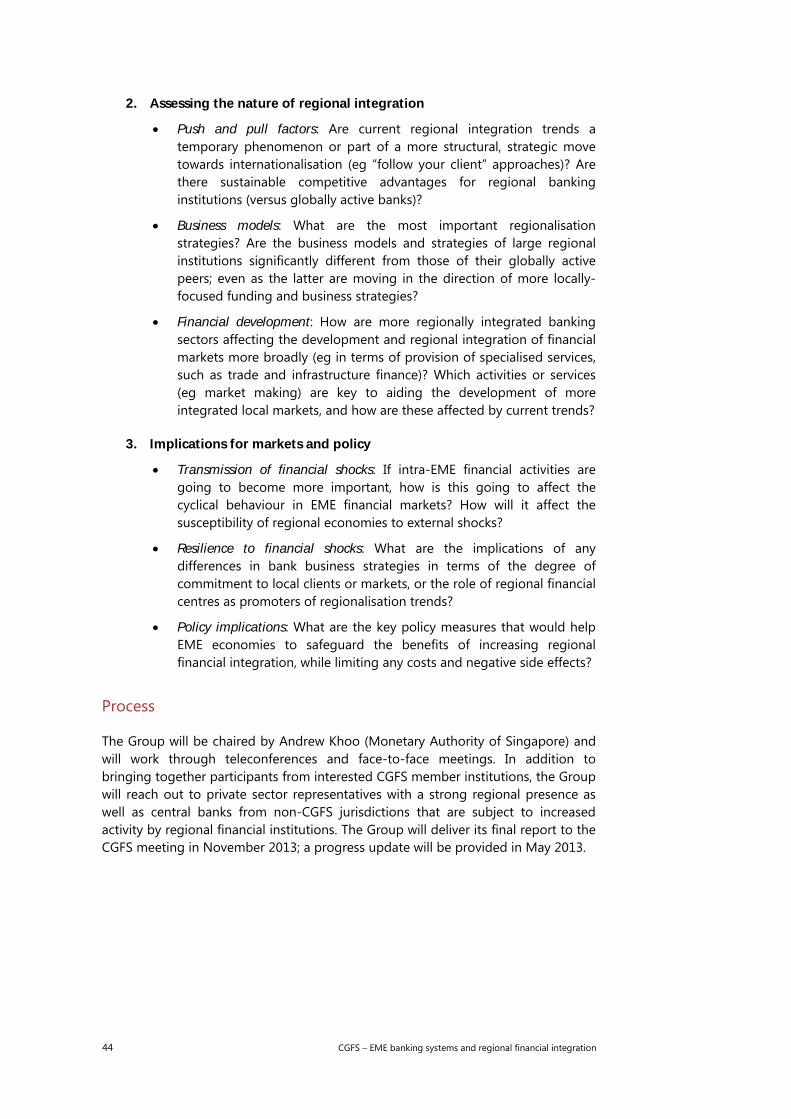
44 CGFS – EME banking systems and regional financial integration
2. Assessing the nature of regional integration
Push and pull factors: Are current regional integration trends a temporary phenomenon or part of a more structural, strategic move towards internationalisation (eg “follow your client” approaches)? Are there sustainable competitive advantages for regional banking institutions (versus globally active banks)?
Business models: What are the most important regionalisation strategies? Are the business models and strategies of large regional institutions significantly different from those of their globally active peers; even as the latter are moving in the direction of more locally-focused funding and business strategies?
Financial development: How are more regionally integrated banking sectors affecting the development and regional integration of financial markets more broadly (eg in terms of provision of specialised services, such as trade and infrastructure finance)? Which activities or services (eg market making) are key to aiding the development of more integrated local markets, and how are these affected by current trends?
3. Implications for markets and policy
Transmission of financial shocks: If intra-EME financial activities are going to become more important, how is this going to affect the cyclical behaviour in EME financial markets? How will it affect the susceptibility of regional economies to external shocks?
Resilience to financial shocks: What are the implications of any differences in bank business strategies in terms of the degree of commitment to local clients or markets, or the role of regional financial centres as promoters of regionalisation trends?
Policy implications: What are the key policy measures that would help EME economies to safeguard the benefits of increasing regional financial integration, while limiting any costs and negative side effects?
Process
The Group will be chaired by Andrew Khoo (Monetary Authority of Singapore) and will work through teleconferences and face-to-face meetings. In addition to bringing together participants from interested CGFS member institutions, the Group will reach out to private sector representatives with a strong regional presence as well as central banks from non-CGFS jurisdictions that are subject to increased activity by regional financial institutions. The Group will deliver its final report to the CGFS meeting in November 2013; a progress update will be provided in May 2013.
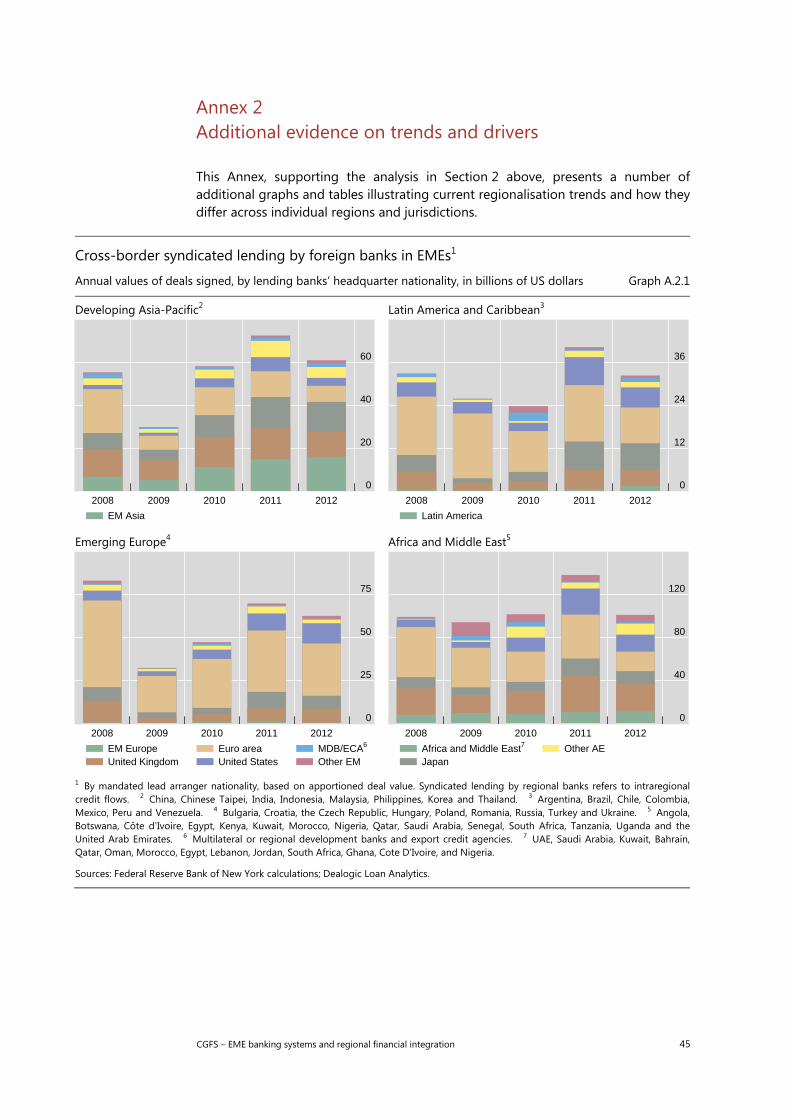
CGFS – EME banking systems and regional financial integration 45
Annex 2 Additional evidence on trends and drivers
This Annex, supporting the analysis in Section 2 above, presents a number of additional graphs and tables illustrating current regionalisation trends and how they differ across individual regions and jurisdictions.
Cross-border syndicated lending by foreign banks in EMEs1
Annual values of deals signed, by lending banks’ headquarter nationality, in billions of US dollars Graph A.2.1
Developing Asia-Pacific2 Latin America and Caribbean3
Emerging Europe4 Africa and Middle East5
1 By mandated lead arranger nationality, based on apportioned deal value. Syndicated lending by regional banks refers to intraregional credit flows. 2 China, Chinese Taipei, India, Indonesia, Malaysia, Philippines, Korea and Thailand. 3 Argentina, Brazil, Chile, Colombia, Mexico, Peru and Venezuela. 4 Bulgaria, Croatia, the Czech Republic, Hungary, Poland, Romania, Russia, Turkey and Ukraine. 5 Angola, Botswana, Côte d'Ivoire, Egypt, Kenya, Kuwait, Morocco, Nigeria, Qatar, Saudi Arabia, Senegal, South Africa, Tanzania, Uganda and theUnited Arab Emirates. 6 Multilateral or regional development banks and export credit agencies. 7 UAE, Saudi Arabia, Kuwait, Bahrain, Qatar, Oman, Morocco, Egypt, Lebanon, Jordan, South Africa, Ghana, Cote D’Ivoire, and Nigeria.
Sources: Federal Reserve Bank of New York calculations; Dealogic Loan Analytics.
0
20
40
60
2008 2009 2010 2011 2012
EM Asia
0
12
24
36
2008 2009 2010 2011 2012
Latin America
0
25
50
75
2008 2009 2010 2011 2012
EM EuropeUnited Kingdom
Euro areaUnited States
MDB/ECA6
Other EM
0
40
80
120
2008 2009 2010 2011 2012
Africa and Middle East7
JapanOther AE
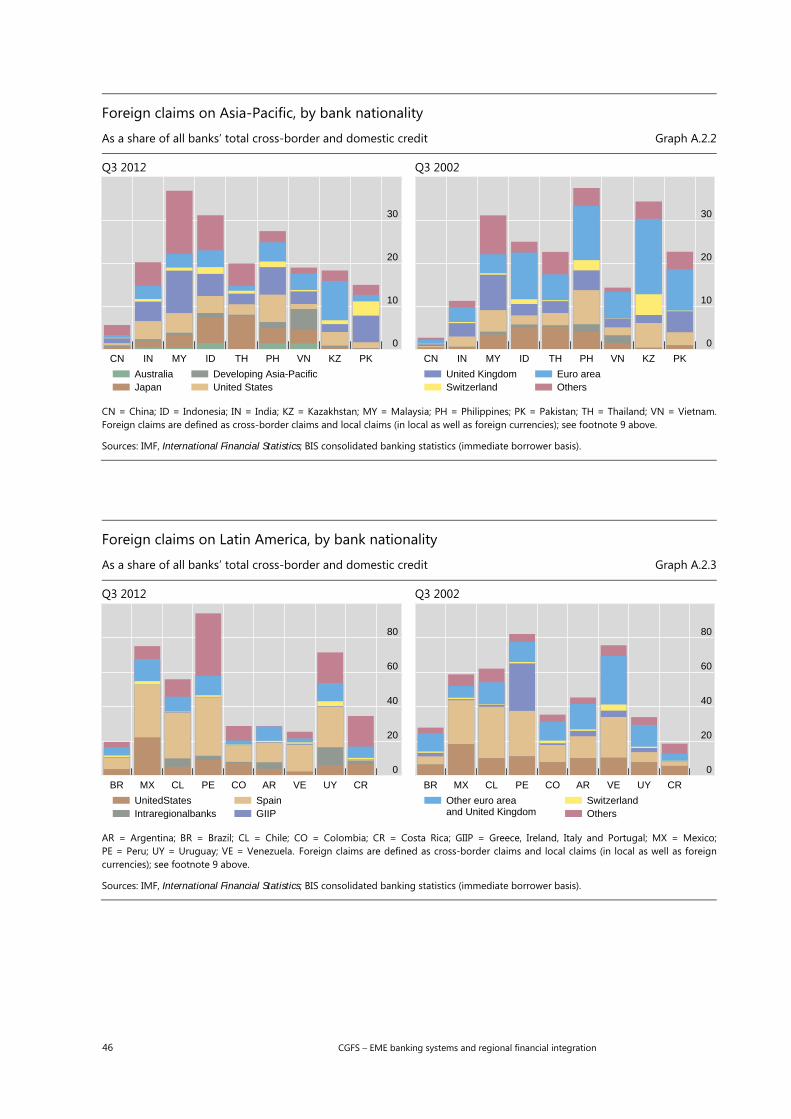
46 CGFS – EME banking systems and regional financial integration
Foreign claims on Asia-Pacific, by bank nationality
As a share of all banks’ total cross-border and domestic credit Graph A.2.2
Q3 2012 Q3 2002
CN = China; ID = Indonesia; IN = India; KZ = Kazakhstan; MY = Malaysia; PH = Philippines; PK = Pakistan; TH = Thailand; VN = Vietnam. Foreign claims are defined as cross-border claims and local claims (in local as well as foreign currencies); see footnote 9 above.
Sources: IMF, International Financial Statistics; BIS consolidated banking statistics (immediate borrower basis).
Foreign claims on Latin America, by bank nationality
As a share of all banks’ total cross-border and domestic credit Graph A.2.3
Q3 2012 Q3 2002
AR = Argentina; BR = Brazil; CL = Chile; CO = Colombia; CR = Costa Rica; GIIP = Greece, Ireland, Italy and Portugal; MX = Mexico; PE = Peru; UY = Uruguay; VE = Venezuela. Foreign claims are defined as cross-border claims and local claims (in local as well as foreign currencies); see footnote 9 above.
Sources: IMF, International Financial Statistics; BIS consolidated banking statistics (immediate borrower basis).
0
10
20
30
CN IN MY ID TH PH VN KZ PK
AustraliaJapan
Developing Asia-PacificUnited States
0
10
20
30
CN IN MY ID TH PH VN KZ PK
United KingdomSwitzerland
Euro areaOthers
0
20
40
60
80
BR MX CL PE CO AR VE UY CR
UnitedStatesIntraregionalbanks
SpainGIIP
0
20
40
60
80
BR MX CL PE CO AR VE UY CR
Other euro area and United Kingdom
SwitzerlandOthers
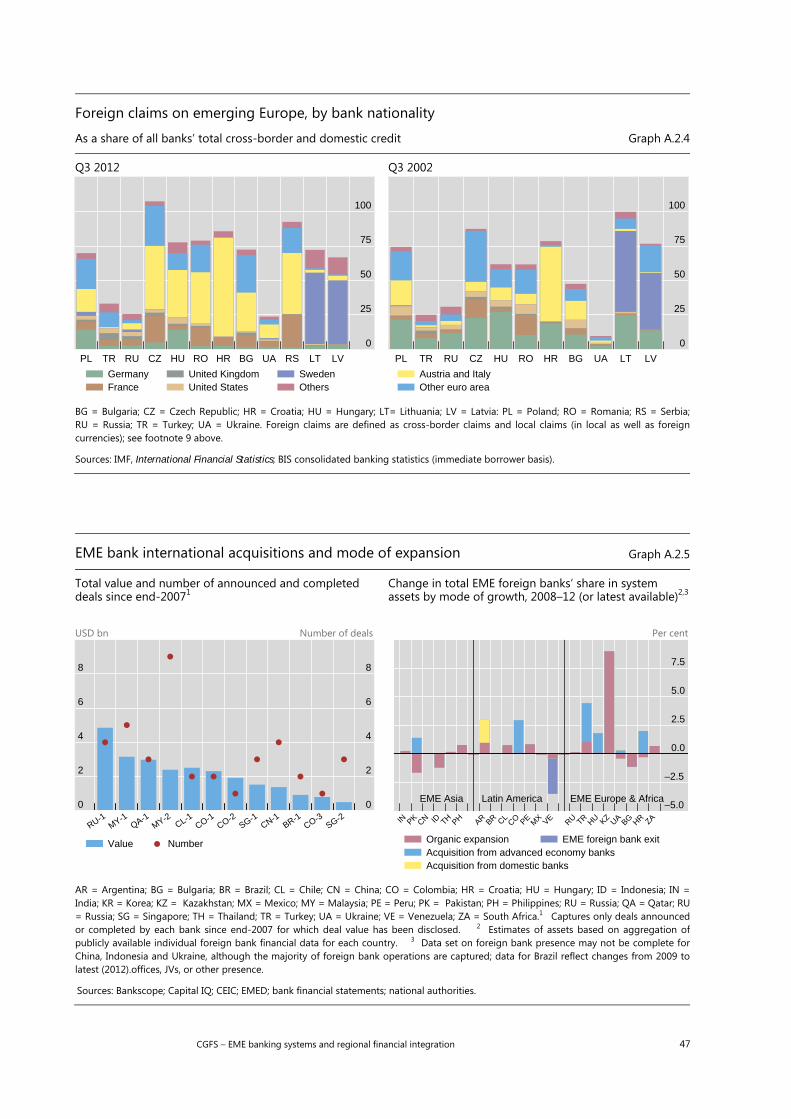
CGFS – EME banking systems and regional financial integration 47
Foreign claims on emerging Europe, by bank nationality
As a share of all banks’ total cross-border and domestic credit Graph A.2.4
Q3 2012 Q3 2002
BG = Bulgaria; CZ = Czech Republic; HR = Croatia; HU = Hungary; LT= Lithuania; LV = Latvia: PL = Poland; RO = Romania; RS = Serbia; RU = Russia; TR = Turkey; UA = Ukraine. Foreign claims are defined as cross-border claims and local claims (in local as well as foreign currencies); see footnote 9 above.
Sources: IMF, International Financial Statistics; BIS consolidated banking statistics (immediate borrower basis).
0
25
50
75
100
PL TR RU CZ HU RO HR BG UA RS LT LV
GermanyFrance
United KingdomUnited States
SwedenOthers
0
25
50
75
100
PL TR RU CZ HU RO HR BG UA LT LV
Austria and ItalyOther euro area
EME bank international acquisitions and mode of expansion Graph A.2.5
Total value and number of announced and completed deals since end-20071
USD bn Number of deals
Change in total EME foreign banks’ share in system assets by mode of growth, 2008–12 (or latest available)2,3
Per cent
AR = Argentina; BG = Bulgaria; BR = Brazil; CL = Chile; CN = China; CO = Colombia; HR = Croatia; HU = Hungary; ID = Indonesia; IN =India; KR = Korea; KZ = Kazakhstan; MX = Mexico; MY = Malaysia; PE = Peru; PK = Pakistan; PH = Philippines; RU = Russia; QA = Qatar; RU = Russia; SG = Singapore; TH = Thailand; TR = Turkey; UA = Ukraine; VE = Venezuela; ZA = South Africa.1 Captures only deals announced or completed by each bank since end-2007 for which deal value has been disclosed. 2 Estimates of assets based on aggregation of publicly available individual foreign bank financial data for each country. 3 Data set on foreign bank presence may not be complete for China, Indonesia and Ukraine, although the majority of foreign bank operations are captured; data for Brazil reflect changes from 2009 to latest (2012).offices, JVs, or other presence.
Sources: Bankscope; Capital IQ; CEIC; EMED; bank financial statements; national authorities.
0
2
4
6
8
0
2
4
6
8
RU-1MY-1
QA-1MY-2
CL-1CO-1
CO-2SG-1
CN-1BR-1
CO-3SG-2
Value Number
–5.0
–2.5
0.0
2.5
5.0
7.5
IN PK CN ID TH PH AR BR CLCO PEM
X VE RU TR HU KZ UA BG HR ZA
EME Asia Latin America EME Europe & Africa
Organic expansionAcquisition from advanced economy banksAcquisition from domestic banks
EME foreign bank exit
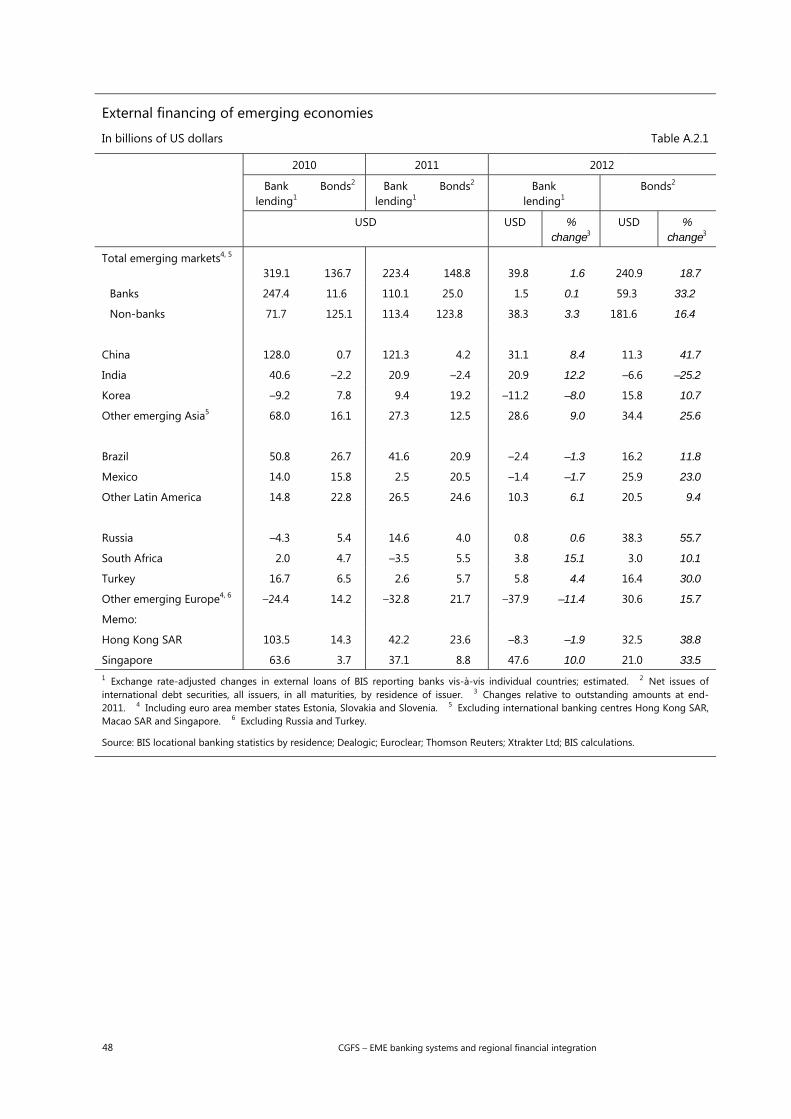
48 CGFS – EME banking systems and regional financial integration
External financing of emerging economies
In billions of US dollars Table A.2.1
2010 2011 2012
Bank lending1
Bonds2 Bank lending1
Bonds2 Bank lending1
Bonds2
USD USD % change3
USD % change3
Total emerging markets4, 5 319.1
136.7
223.4
148.8
39.8
1.6
240.9
18.7
Banks 247.4 11.6 110.1 25.0 1.5 0.1 59.3 33.2
Non-banks 71.7 125.1 113.4 123.8 38.3 3.3 181.6 16.4
China 128.0 0.7 121.3 4.2 31.1 8.4 11.3 41.7
India 40.6 –2.2 20.9 –2.4 20.9 12.2 –6.6 –25.2
Korea –9.2 7.8 9.4 19.2 –11.2 –8.0 15.8 10.7
Other emerging Asia5 68.0 16.1 27.3 12.5 28.6 9.0 34.4 25.6
Brazil 50.8 26.7 41.6 20.9 –2.4 –1.3 16.2 11.8
Mexico 14.0 15.8 2.5 20.5 –1.4 –1.7 25.9 23.0
Other Latin America 14.8 22.8 26.5 24.6 10.3 6.1 20.5 9.4
Russia –4.3 5.4 14.6 4.0 0.8 0.6 38.3 55.7
South Africa 2.0 4.7 –3.5 5.5 3.8 15.1 3.0 10.1
Turkey 16.7 6.5 2.6 5.7 5.8 4.4 16.4 30.0
Other emerging Europe4, 6 –24.4 14.2 –32.8 21.7 –37.9 –11.4 30.6 15.7
Memo:
Hong Kong SAR 103.5 14.3 42.2 23.6 –8.3 –1.9 32.5 38.8
Singapore 63.6 3.7 37.1 8.8 47.6 10.0 21.0 33.5 1 Exchange rate-adjusted changes in external loans of BIS reporting banks vis-à-vis individual countries; estimated. 2 Net issues of international debt securities, all issuers, in all maturities, by residence of issuer. 3 Changes relative to outstanding amounts at end-2011. 4 Including euro area member states Estonia, Slovakia and Slovenia. 5 Excluding international banking centres Hong Kong SAR, Macao SAR and Singapore. 6 Excluding Russia and Turkey.
Source: BIS locational banking statistics by residence; Dealogic; Euroclear; Thomson Reuters; Xtrakter Ltd; BIS calculations.
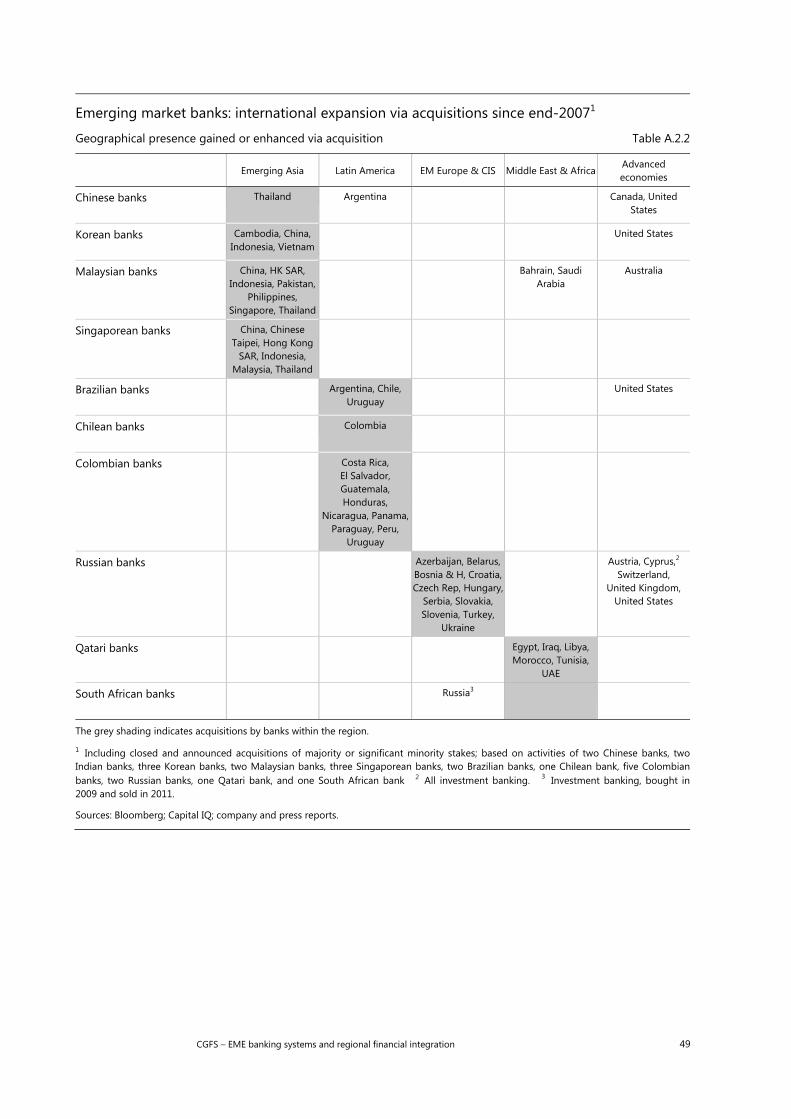
CGFS – EME banking systems and regional financial integration 49
Emerging market banks: international expansion via acquisitions since end-20071
Geographical presence gained or enhanced via acquisition Table A.2.2
Emerging Asia Latin America EM Europe & CIS Middle East & Africa Advanced economies
Chinese banks
Thailand Argentina Canada, United States
Korean banks
Cambodia, China, Indonesia, Vietnam
United States
Malaysian banks
China, HK SAR, Indonesia, Pakistan,
Philippines, Singapore, Thailand
Bahrain, Saudi Arabia
Australia
Singaporean banks
China, Chinese Taipei, Hong Kong
SAR, Indonesia, Malaysia, Thailand
Brazilian banks
Argentina, Chile, Uruguay
United States
Chilean banks
Colombia
Colombian banks
Costa Rica, El Salvador, Guatemala, Honduras,
Nicaragua, Panama, Paraguay, Peru,
Uruguay
Russian banks
Azerbaijan, Belarus, Bosnia & H, Croatia, Czech Rep, Hungary,
Serbia, Slovakia, Slovenia, Turkey,
Ukraine
Austria, Cyprus,2 Switzerland,
United Kingdom, United States
Qatari banks
Egypt, Iraq, Libya, Morocco, Tunisia,
UAE
South African banks
Russia3
The grey shading indicates acquisitions by banks within the region.
1 Including closed and announced acquisitions of majority or significant minority stakes; based on activities of two Chinese banks, two Indian banks, three Korean banks, two Malaysian banks, three Singaporean banks, two Brazilian banks, one Chilean bank, five Colombian banks, two Russian banks, one Qatari bank, and one South African bank 2 All investment banking. 3 Investment banking, bought in 2009 and sold in 2011.
Sources: Bloomberg; Capital IQ; company and press reports.
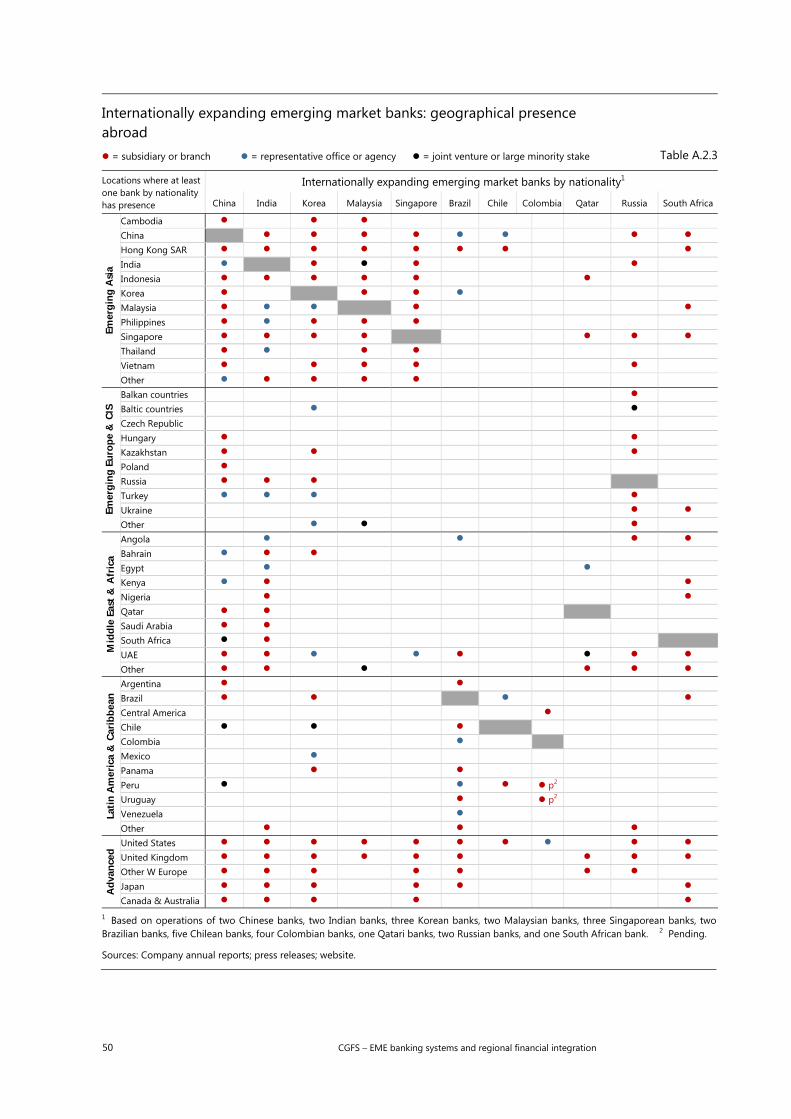
50 CGFS – EME banking systems and regional financial integration
Internationally expanding emerging market banks: geographical presence abroad = subsidiary or branch = representative office or agency = joint venture or large minority stake Table A.2.3
Locations where at least one bank by nationality has presence
Internationally expanding emerging market banks by nationality1
China India Korea Malaysia Singapore Brazil Chile Colombia Qatar Russia South Africa
Emer
ging
Asi
a
Cambodia China
Hong Kong SAR
India Indonesia Korea Malaysia
Philippines Singapore
Thailand Vietnam Other
Emer
ging
Eur
ope
& C
IS
Balkan countries Baltic countries Czech Republic Hungary Kazakhstan Poland Russia Turkey Ukraine
Other
Mid
dle
East
& A
fric
a
Angola
Bahrain Egypt Kenya
Nigeria
Qatar Saudi Arabia South Africa UAE
Other
Lati
n A
mer
ica
& C
arib
bean
Argentina Brazil
Central America Chile Colombia Mexico Panama Peru p2 Uruguay p2 Venezuela Other
Adv
ance
d
United States
United Kingdom
Other W Europe Japan
Canada & Australia
1 Based on operations of two Chinese banks, two Indian banks, three Korean banks, two Malaysian banks, three Singaporean banks, two Brazilian banks, five Chilean banks, four Colombian banks, one Qatari banks, two Russian banks, and one South African bank. 2 Pending.
Sources: Company annual reports; press releases; website.
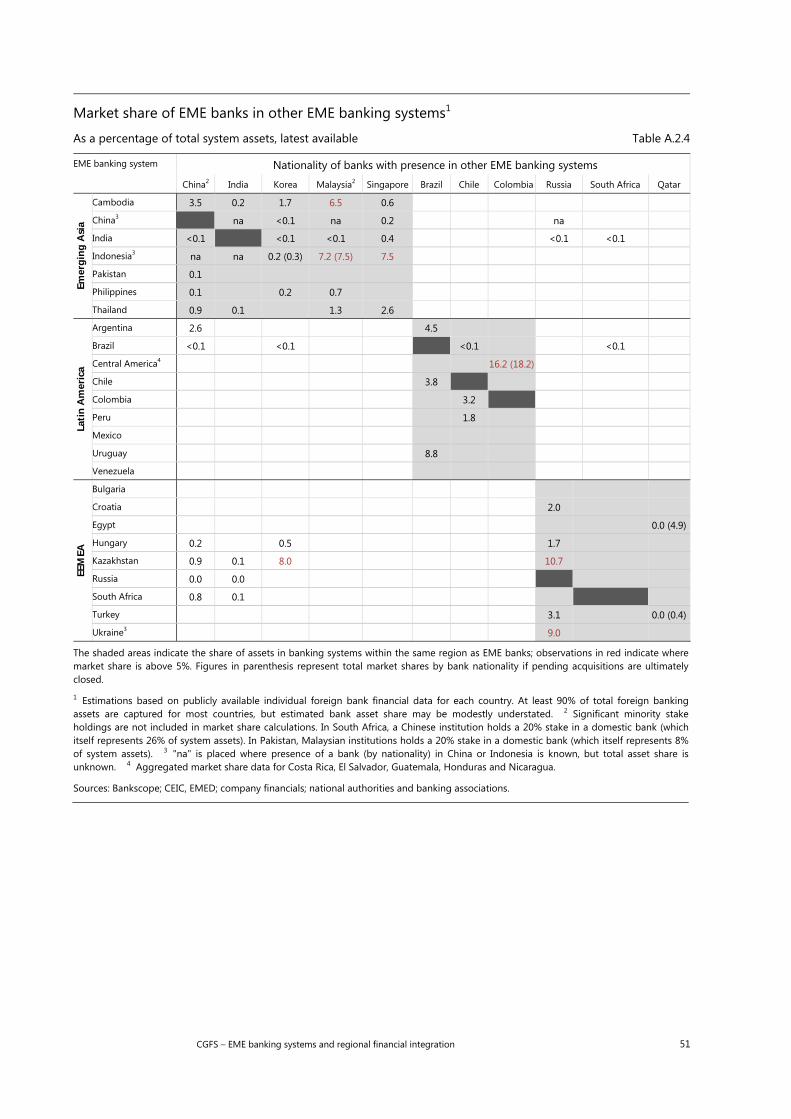
CGFS – EME banking systems and regional financial integration 51
Market share of EME banks in other EME banking systems1
As a percentage of total system assets, latest available Table A.2.4
EME banking system Nationality of banks with presence in other EME banking systems
China2 India Korea Malaysia2 Singapore Brazil Chile Colombia Russia South Africa Qatar
Emer
ging
Asi
a
Cambodia 3.5 0.2 1.7 6.5 0.6
China3 na <0.1 na 0.2 na
India <0.1 <0.1 <0.1 0.4 <0.1 <0.1
Indonesia3 na na 0.2 (0.3) 7.2 (7.5) 7.5
Pakistan 0.1
Philippines 0.1 0.2 0.7
Thailand 0.9 0.1 1.3 2.6
Lati
n A
mer
ica
Argentina 2.6 4.5
Brazil <0.1 <0.1 <0.1 <0.1
Central America4 16.2 (18.2)
Chile 3.8
Colombia 3.2
Peru 1.8
Mexico
Uruguay 8.8
Venezuela
EEM
EA
Bulgaria
Croatia 2.0
Egypt 0.0 (4.9)
Hungary 0.2 0.5 1.7
Kazakhstan 0.9 0.1 8.0 10.7
Russia 0.0 0.0
South Africa 0.8 0.1
Turkey 3.1 0.0 (0.4)
Ukraine3 9.0
The shaded areas indicate the share of assets in banking systems within the same region as EME banks; observations in red indicate where market share is above 5%. Figures in parenthesis represent total market shares by bank nationality if pending acquisitions are ultimatelyclosed.
1 Estimations based on publicly available individual foreign bank financial data for each country. At least 90% of total foreign bankingassets are captured for most countries, but estimated bank asset share may be modestly understated. 2 Significant minority stakeholdings are not included in market share calculations. In South Africa, a Chinese institution holds a 20% stake in a domestic bank (which itself represents 26% of system assets). In Pakistan, Malaysian institutions holds a 20% stake in a domestic bank (which itself represents 8% of system assets). 3 "na" is placed where presence of a bank (by nationality) in China or Indonesia is known, but total asset share isunknown. 4 Aggregated market share data for Costa Rica, El Salvador, Guatemala, Honduras and Nicaragua.
Sources: Bankscope; CEIC, EMED; company financials; national authorities and banking associations.
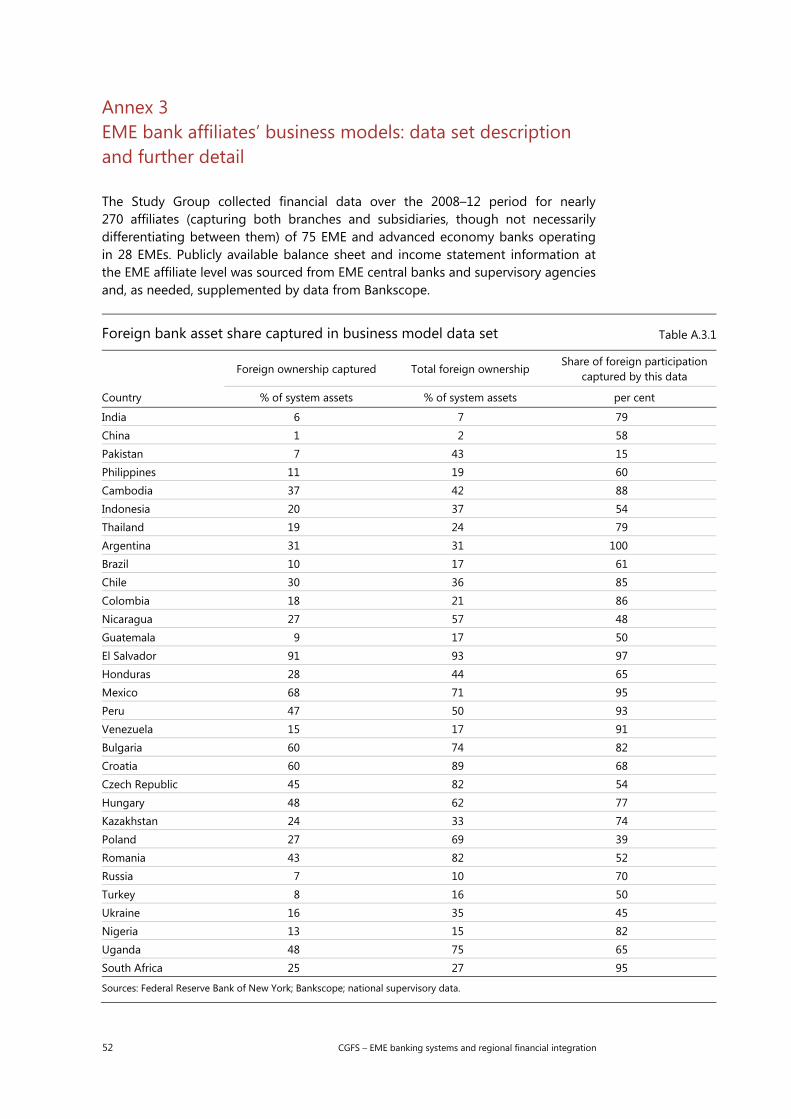
52 CGFS – EME banking systems and regional financial integration
Annex 3 EME bank affiliates’ business models: data set description and further detail
The Study Group collected financial data over the 2008–12 period for nearly 270 affiliates (capturing both branches and subsidiaries, though not necessarily differentiating between them) of 75 EME and advanced economy banks operating in 28 EMEs. Publicly available balance sheet and income statement information at the EME affiliate level was sourced from EME central banks and supervisory agencies and, as needed, supplemented by data from Bankscope.
Foreign bank asset share captured in business model data set Table A.3.1
Foreign ownership captured Total foreign ownership
Share of foreign participation captured by this data
Country % of system assets % of system assets per cent
India 6 7 79 China 1 2 58 Pakistan 7 43 15 Philippines 11 19 60 Cambodia 37 42 88 Indonesia 20 37 54 Thailand 19 24 79 Argentina 31 31 100 Brazil 10 17 61 Chile 30 36 85
Colombia 18 21 86 Nicaragua 27 57 48 Guatemala 9 17 50 El Salvador 91 93 97 Honduras 28 44 65 Mexico 68 71 95 Peru 47 50 93 Venezuela 15 17 91 Bulgaria 60 74 82 Croatia 60 89 68 Czech Republic 45 82 54
Hungary 48 62 77 Kazakhstan 24 33 74 Poland 27 69 39 Romania 43 82 52 Russia 7 10 70 Turkey 8 16 50 Ukraine 16 35 45 Nigeria 13 15 82 Uganda 48 75 65 South Africa 25 27 95
Sources: Federal Reserve Bank of New York; Bankscope; national supervisory data.

CGFS – EME banking systems and regional financial integration 53
The data set captures a representative share of foreign bank participation in the EMEs in the sample (Table A.3.1). It covers a broad set of metrics related to balance sheet composition, funding, capital adequacy and earnings performance. The analysis in Section 3 is primarily based on the comparisons of simple averages of these metrics across various dimensions, such as EME affiliate market share, ownership type, international orientation and regional focus. Prior to averaging, the data were treated for outliers using standard statistical techniques.
54 CGFS – EME banking systems and regional financial integration
Annex 4 Monitoring regionalisation trends
As part of its mandate (see Annex 1 above), the Study Group was asked to identify indicators and statistics that central banks and other policymakers could use to track current regionalisation trends over time and identify any data gaps that would need to be addressed to allow such tracking.
In thinking about a framework for the monitoring of regionalisation trends, one key takeaway from the findings outlined in the main body of this report is that there is a lot of publicly available information that can be used for this purpose, even though more in-depth assessments are likely to require more granular data, including at the individual institution level, and probably from supervisory sources. It is also the case that publicly available information is often dispersed, which makes it costly to assemble the necessary data and analyse it in a coherent fashion. This, and the slow-moving nature of many of the observed developments, argues for regular, but infrequent reviews. Finally, there is no single best indicator, supporting the need for a flexible approach.
A two-stage approach. This suggests that a two-stage approach could be taken by supervisors and other authorities to track current regionalisation trends.55 The first stage would track aggregate system-level developments, focusing on any major changes in the geographical and sectoral patterns of financial interlinkages in EME regions. It would be based on occasional reviews of high-level information on cross-border bank activity (eg from the BIS international banking statistics) and similar data tracking the international component in the provision of financial services (for example, issuance volumes and foreign ownership of EME debt). Where available, this would be complemented with firm-level information on specific developments, such as data on mergers and acquisitions and foreign branch assets, to assess the systemic importance of foreign players from the host EME perspective.
Specific examples include:
international debt markets: data on issuance, currency denomination, and foreign investors in EME debt markets (Graphs 3 and 4);
cross-border bank lending: shares in foreign bank claims on the region (Graphs 5 and 6); and
foreign ownership: data on foreign bank assets and cross-border acquisitions (Graphs 8 and 9).
The second stage would focus on any notable changes in business models and risk profiles of newly present or expanding financial institutions and could be triggered if the analysis of ongoing trends (stage 1) has raised any particular questions. It would be based on more granular information at the institutional level, drawing primarily on balance sheet metrics (including from supervisory sources, as available) and income statements to assess banks’ business and funding models. This could be done at the subsidiary as well as consolidated level, where the latter may require a degree of cooperation with foreign bank supervisors.
55 A similar framework is proposed in Cecchetti et al (2011) and Eichner et al (2010).
CGFS – EME banking systems and regional financial integration 55
Members of the Study Group
Chair, Monetary Authority of Singapore Andrew Khoo
Reserve Bank of Australia Grant Turner Chay Fisher (Alternate)
Central Bank of Brazil Renato Baldini
Bank of Canada Ramdane Djoudad
People’s Bank of China Lin Ran
European Central Bank Roland Beck
Bank of France Clement Bourgey Mathieu Gex (Alternate)
Deutsche Bundesbank Corinna Knobloch
Hong Kong Monetary Authority Cho-hoi Hui
Reserve Bank of India Gurumoorthy Mahalingam
Bank of Italy Giovanni Veronese
Bank of Japan Kenichirou Watanabe
Bank of Korea Sang Gyoo Yoon
Central Bank of Luxembourg Francisco Nadal De Simone
Bank of Mexico Julio Santaella Castell
Netherlands Bank Neeltje van Horen Jon Frost (Alternate)
Monetary Authority of Singapore San Ling Lam Gracie Lin (Alternate)
Bank of Spain Sonsoles Gallego José M Marqués (Alternate)
Board of Governors of the Federal Reserve System Viktors Stebunovs Federal Reserve Bank of New York Jennifer Crystal
Bank for International Settlements Vladyslav Sushko (Secretary) Ingo Fender