Embed Size (px)
Citation preview

Embedding Water Risk in Corporate Bond Analysis
First steps in developing a tool to link water risks with key financial indicators
Simone Dettling Sao Paulo, 15.12.2014

Content
1. Pilot Project Overview and Rationale
2. Overview Approach
3. Valuing Water and Quantifying Water Risk Exposure
4. Integrating Water Risk in Corporate Bond Analysis
5. Conclusion and Questions for Feedback

1. Pilot Project Overview and Rationale
First steps in developing a tool to link water risks with key financial indicators

Equity Reports Credit ReportsIdentify High Growth Firms Identify Firms Vulnerable to Water Downside
Model High Growth Firms Model Firms Vulnerable to Water Downside
Model Water Exposure of Equity Index Model Water Exposure in Bond Index
This Project >>
Gaps in the Water Literature to Date

• Aim of this project: develop specific methodologies to quantify water risks in fixed-income investments.
• Outcome of this project: excel-based tool that directly links water risks with core financial indicators that analysts use to determine the value of a corporate bond.
This will enable bond analysts to quantify water metrics and incorporate water risks directly in the credit risk analysis for corporate bond valuations.
Purpose

Project Management
Team (GIZ/NCD/VfU)
Research Team(Senior Fixed Income Analyst and Natural Resource Economist)
Expert Council (18 experts from academia, IOs and initiatives, NGOs and private sector)
Guidance on development of framework and tool and feedback from testing
Financial Institution Partners
Project Partners and Structure

Timeline

2. Overview Approach
First steps in developing a tool to link water risks with key financial indicators

• Use data on location-specific water stress to determine the total economic value/shadow price of water around the world and compare with currently paid costs for water
• Overlay company data on location of operations and water extraction/use by location with the location-specific water valuations
• Model impact on companies’ financials if use of water becomes restricted or higher water price is imposed
• Compare adjusted credit ratios with those required by the rating agencies
Overview Approach

3. Valuing Water and Quantifying Water Risk Exposure
First steps in developing a tool to link water risks with key financial indicators

Now FutureM
agni
tude
of
expo
sure
$/m3
Total economic value of water
Price/private cost of water
Gap can close through:
• Limited physical availability of water
• Increase in price for water/abstraction licenses
• Quantitative restriction of access to water by regulator
Underpriced Water in Stressed Areas
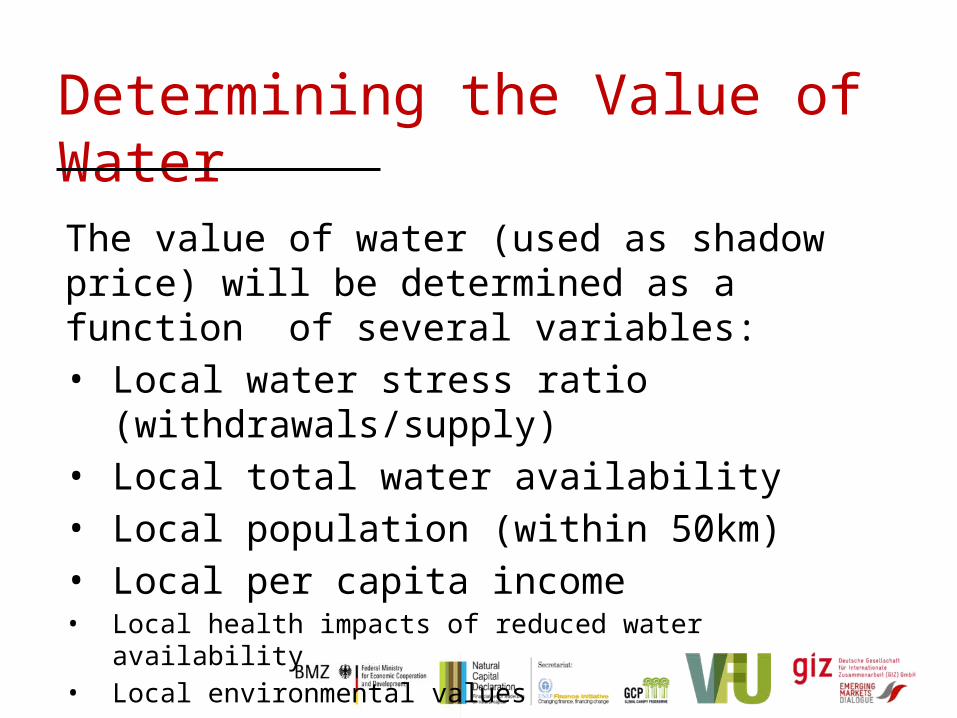
The value of water (used as shadow price) will be determined as a function of several variables:• Local water stress ratio (withdrawals/supply)• Local total water availability• Local population (within 50km)• Local per capita income• Local health impacts of reduced water availability• Local environmental values
Determining the Value of Water
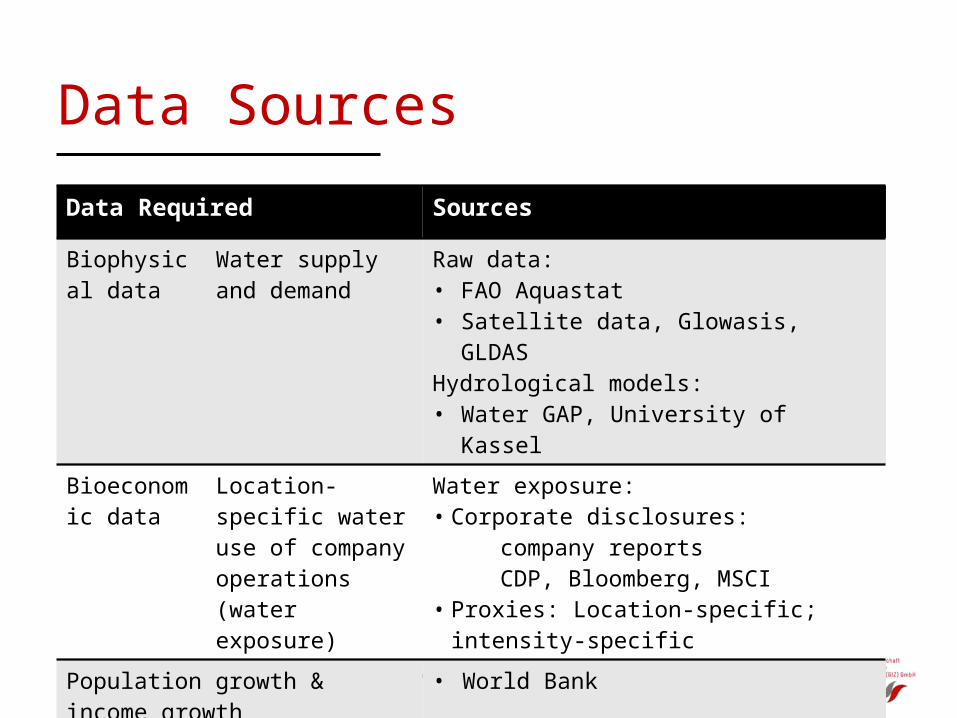
Data Required Sources
Biophysical data
Water supply and demand
Raw data:• FAO Aquastat• Satellite data, Glowasis, GLDASHydrological models:• Water GAP, University of Kassel
Bioeconomic data
Location-specific water use of company operations (water exposure)
Water exposure:• Corporate disclosures: company reports CDP, Bloomberg, MSCI• Proxies: Location-specific; intensity-specific
Population growth & income growth • World Bank
Municipal water prices • GWI annual municipal water price survey
Data Sources

• Spatial map of water values that provide shadow prices for a given location calculated as a function of water stress and other variables
• Provides a scientific basis for choosing boundaries to stress-test company revenue projections, EBITDA ratios, etc.– E.g. 30%, 60%, 100% of shadow price
• Caveats: – Validity of valuations depends on underlying assumptions – Accuracy may be reduced where using modelled data and averages
• Issues to tackle in the next two months: – Non-linearity of internalization– Different prices for consumptive and non-consumptive water use
Outcomes Shadow Pricing Work

4. Integrating Water Risk in Corporate Bond Credit Analysis
First steps in developing a tool to link water risks with key financial indicators

FT 27.07.2014“Spending by mining companies on water infrastructure amounted to almost $12bn last year, compared with $3.4bn in 2009, EY said. BHP Billiton and Rio Tinto, the two largest in the world by market capitalisation, are investing $3bn to build a desalination plant at Escondida, the Chilean copper mine that is the world’s largest by output.”
Sector Focus
1. Mining2. Power Generation3. Food & Beverage/Tech (Semiconductors)/Pulp & Paper

Example Mining
• Vedanta: high yield (leverage >3x), modest market capitalization, Emerging Market focus
• Rio Tinto: investment grade (leverage < 1.5x), larger market capitalization, diversified by metal and country of operation
• Antofagasta: very low leverage, little debt, no bond issuance and no credit rating
Antofagasta Rio Tinto VedantaHQ London London MumbaiOperations Chile Global IndiaMetals Copper Iron ore, diversified Iron ore, zinc, lead, copperMarket Capitalisation, £ bil l ion £7.1 bil l l ion £55.7 bil l ion £2.1 bil l ionEBITDA/Revenues, 2013 45.3% 44.3% 34.7%Gross debt/EBITDA, 2013 0.51 1.26 3.33Credit Rating (NR/NR) (A3/A-) (Ba1/BB)

Mine Name Primary Metal
Country Water demand 2020 optimistic
Water demand 2020 BAU
Water demand 2020 pessimistic
Water supply 2020 optimistic
Water supply 2020 BAU
Water supply 2020 pessimistic
Water Demand/Supply 2020
Bicholim Iron Ore Mine 15 Iron Ore INDIA 0.071 0.072 0.070 1.056 1.080 1.080 0.07Agnigundala Lead Mine 16 LEAD INDIA 0.245 0.249 0.248 0.156 0.161 0.161 1.54Surla Sonshi Iron Ore Mine 17 Iron Ore INDIA 0.071 0.072 0.070 1.056 1.080 1.080 0.07Chitradurga Iron Ore Mine 18 Iron Ore INDIA 0.287 0.290 0.289 0.231 0.243 0.243 1.19Colomba/Curpem Iron Ore Mines 19 Iron Ore INDIA 0.064 0.064 0.063 1.212 1.239 1.239 0.05Sonshi Iron Ore Mine 20 Iron Ore INDIA 0.071 0.072 0.070 1.056 1.080 1.080 0.07Codli Iron Ore Mines 21 Iron Ore INDIA 0.071 0.072 0.070 1.056 1.080 1.080 0.07Zawar Udaipur Lead/Z 22 LEAD INDIA 0.161 0.162 0.160 0.275 0.277 0.277 0.59Rajpura-Dariba Zinc 23 Zinc INDIA 0.206 0.208 0.207 0.154 0.143 0.143 1.45Kayar Zinc Deposit 24 Zinc INDIA 0.172 0.173 0.173 0.081 0.076 0.076 2.27Rampura-Agucha Lead 25 LEAD INDIA 0.206 0.208 0.207 0.154 0.143 0.143 1.45Mount Lyell Copper/G 26 Copper AUSTRALIA 0.000 0.000 0.000 0.712 0.743 0.743 0.00Skorpion Zinc Mine 27 Zinc NAMIBIA 0.000 0.000 0.000 0.000 0.000 0.000 0.10Nchanga Copper/Cobalt Mine 28 Copper Zambia 0.021 0.021 0.020 0.466 0.468 0.468 0.05Konkola Deep Copper Mine 29 Copper Zambia 0.021 0.021 0.020 0.466 0.468 0.468 0.05Nchanga UG Copper/Cobalt Mine 30 Copper Zambia 0.021 0.021 0.020 0.466 0.468 0.468 0.05Nchanga OP Copper/Cobalt Mine 31 Copper Zambia 0.021 0.021 0.020 0.466 0.468 0.468 0.05Konkola Copper/Cobalt Mine 32 Copper Zambia 0.021 0.021 0.020 0.466 0.468 0.468 0.05
Vedanta:
Example Mining Introducing location-specific water costs

INDIAINDIA
INDIAINDIA
INDIAINDIA
NAMIBIAINDIA
INDIAINDIA
INDIAINDIA
ZAMBIA
ZAMBIA
ZAMBIA
ZAMBIA
ZAMBIA
AUSTRALIA
0.0
0.5
1.0
1.5
2.0
2.5
Vedanta: Projected 2020 Water Demand/Supply Ratio, by Mine
Example Mining Ranking mines by demand/supply ratios

Antofagasta7 out of 21 mines 33.3% are in areas of extreme water stress (D/S>2)7 out of 21 mines 33.3% are in areas of water stress (D/S>0.5)7 out of 21 mines 33.3% are in areas of limited water stress (D/S<0.5)
Rio Tinto5 out of 92 mines 5.4% are in areas of extreme water stress (D/S>2)3 out of 92 mines 3.3% are in areas of water stress (D/S>0.5)84 out of 92 mines 91.3% are in areas of limited water stress (D/S<0.5)
Vedanta1 out of 18 mines 5.6% are in areas of extreme water stress (D/S>2)5 out of 18 mines 27.8% are in areas of water stress (D/S>0.5)12 out of 18 mines 66.7% are in areas of limited water stress (D/S<0.5)
Water cost assumptions: $10/m3 extreme stress areas; $5/m3 in stressed areas, $1/m3 in non stressed areas
Example Mining Proportion of mines in water stressed areas
Average water price: $5.28/m3
Average water price: $1.62/m3
Average water price: $2.61/m3

Antofagasta Rio Tinto Vedanta2012 2013 2012 2013 2012 2013
Revenues 6,740 5,972 50,942 51,171 14,640 12,945EBITDA 3,864 2,702 20,291 22,672 4,909 4,491Gross debt 1,889 1,374 26,904 28,551 14,158 14,950EBITDA/Revenues 57.3% 45.3% 39.8% 44.3% 33.5% 34.7%Gross debt/EBITDA 0.49 0.51 1.33 1.26 2.88 3.33
Water consumption; mil l ion m3 46 45 1,396 952 406 405
Water consumption; m3/$1,000 revenues 6.8 7.5 27.4 18.6 27.7 31.3Assumed water price 5.28 5.28 1.62 1.62 2.61 2.61Adjusted EBITDA 3,622.6 2,466.7 18,030.1 21,130.2 3,849.0 3,433.0Gross debt/adjusted EBITDA 0.52 0.56 1.49 1.35 3.68 4.35
Example Mining Introducing location-specific water costs

2012 2013 2012 2013 2012 2013Antofagasta Rio Tinto Vedanta
0.0
0.5
1.0
1.5
2.0
2.5
3.0
3.5
4.0
4.5
5.0
Water @ original price Water @ adjusted price
Gross debt/EBITDA RatiosDifferences in Water Efficiency
Antofagasta:• has higher proportion of its
mines in extreme stress regions• therefore higher average water
price (average 5.28/m³)• But: water intensity of only 7.5
m³/$1000 revenue (compare Vedanta: 31,3 m³/$1000 revenue)
Antofagasta’s ratios are still little impacted vs peers when it has to pay more for its water
Example Mining Introducing location-specific water costs

• Model introduction of shadow pricing at each location
• Obtaining location-specific corporate data for third sector
• Model how firms (by sector) are likely to respond to/internalize higher water costs:• Absorb (“eat”) the higher water costs (base model)• Cut production to avoid higher water costs or respond to
physical/regulatory limits to water withdrawals• Invest CAPEX to reduce water use (water efficiency technology) or
create water (e.g. desalination) model the technology costs
Next Steps in Developing the Model

5. Conclusions and Questions for Feedback
First steps in developing a tool to link water risks with key financial indicators

Conclusions• We use the gap between total economic/public cost of water and the prices
currently charged/private cost of water as an indicator for the magnitude of water risk.
• We derive a location-specific shadow price reflecting these total economic/public costs as a function of water stress and other variables.
• We model water risk exposure by overlaying location-specific corporate data with shadow prices.
• Result: By adjusting company financials to reflect potential costs of water stress, water risk is reflected in ratios like debt/EBITDA and enhances the credit risk analysis for corporate bonds valuation.
Next steps:• Model different adaptation responses: absorbing price, cutting production,
investing in CAPEX (water efficiency and water creation).• Differentiate shadow pricing between water for consumptive and non-
consumptive use

Thank you very much for your attention!
Contact:Simone Dettling: [email protected]
Emerging Markets Dialogue: www.emergingmarketsdialogue.de

Questions for Feedback• Complexity vs. accuracy: How exact should the modelling, e.g. of
different technology options, be for the purposes of a bond analyst?• Non-linearity/probability of internalization: So far no attempt to model
drivers for internalization (such as regulation) except water stress. Role of the bond analyst to monitor changes in regulatory framework und use this tool accordingly?
• Do you think the approach of modelling water risk through a shadow price makes sense? Other approaches you consider more valid?
• What changes would you make to the design we are planning for the tool to make it relevant for your credit risk analysis?
• Which sector focus would you choose for Brazil?


![42-200218.pdfS SURESH BABU, SAO PANAKAL DALTON THOMAS, SAO PM PILLAI, SAO M] REHMAN, SAO ANINDYA BISWAS, SAO SUDIPTA BASU, AO MANORANJAN ACHARYA, AO GE (l) (FYS) AMBAJHARI MAIN OFFICE](https://img.pdfslide.us/doc/110x75/5b0884397f8b9a520e8cc655/42-suresh-babu-sao-panakal-dalton-thomas-sao-pm-pillai-sao-m-rehman-sao-anindya.jpg)