Embed Size (px)
Citation preview
Elliott Bay/Duwamish Restoration Program:
Intertidal Habitat Projects Monitoring Report
2010 Report
Prepared for the Elliott Bay/Duwamish Restoration Program Panel
By: U.S. Fish and Wildlife Service, Washington Fish and Wildlife Office, Lacey, Washington
Elliott Bay/Duwamish Restoration Program: Intertidal Habitat Projects Monitoring Report
2010 Report
Prepared By: U.S. Fish and Wildlife Service
Washington Fish and Wildlife Office
March 2012
ii
CONTRIBUTORS The Elliott Bay/Duwamish Restoration Program: Intertidal Habitat Projects Monitoring Report, 2010 Report, was prepared by personnel at the Washington Fish and Wildlife Office, U.S. Fish and Wildlife Service, Lacey, Washington. This report was compiled and edited by Michael Carlson and incorporates the 2001, 2002, 2003, 2005, and 2007 Intertidal Habitat Projects Monitoring Reports and findings from the 2010 field season. Lead contributors for this report were Jeff Krausmann, Paco Rodriguez and Judy Lantor.
ACKNOWLEDGMENTS The contributors would like to thank those who assisted with field and data input work including Shirley Burgdorf, James Curtis, and Neil Quackenbush. Aerial photos of restoration sites courtesy of Google Earth and Microsoft Virtual Earth. Report photos provided by Michael Carlson, Jeff Krausmann, Judy Lantor, and Paco Rodriguez. Cover photo: Herring’s House Marine restoration site.
PREAMBLE
This report details the calculations and observations for the 2010 and 2011 field seasons. The details are discussed in later sections; however, the metrics of areal extent (marsh and riparian) and riparian percent survival were calculated during the 2011 field season. As such, the tables and figures are updated to correctly indicate when the information was obtained. We believe the accuracy of comparisons between seasons is still valid and relevant.
iii
TABLE OF CONTENTS
ELLIOTT BAY/DUWAMISH RESTORATION PROGRAM: ................................................ I
CONTRIBUTORS ....................................................................................................................... II
ACKNOWLEDGMENTS ........................................................................................................... II
PREAMBLE ................................................................................................................................. II
INTRODUCTION......................................................................................................................... 1
Restoration Sites........................................................................................................................ 3 Reference Sites .......................................................................................................................... 3
PHYSICAL CHARACTERISTICS ............................................................................................ 6
Intertidal Area (Physical Success Criterion 1) ....................................................................... 6 Tidal Regime (Physical Success Criterion 2) .......................................................................... 8 Slope Erosion (Physical Success Criterion 3) ......................................................................... 8 Sediment Structure (Physical Success Criterion 4) ............................................................. 11 Sediment Quality (Physical Success Criterion 5) ................................................................. 12
BIOLOGICAL CHARACTERISTICS .................................................................................... 12
Marsh Vegetation Establishment (Biological Success Criteria 1-3) ................................... 12 Riparian Vegetation (Biological Success Criteria 4 and 5) ................................................. 31 Bird Use (Biological Success Criterion 6) ............................................................................. 35 Fish Presence/Access (Biological Success Criterion 7) ........................................................ 35 Invertebrate Prey Resource Production (Biological Success Criteria 8) ........................... 35
SUMMARY ................................................................................................................................. 37
PHYSICAL CHARACTERISTICS .......................................................................................... 37
Intertidal Area (Physical Success Criterion 1) ..................................................................... 37 Tidal Regime (Physical Success Criterion 2) ........................................................................ 37 Slope Erosion (Physical Success Criterion 3) ....................................................................... 37 Sediment Structure (Physical Success Criterion 4) ............................................................. 40 Sediment Quality (Physical Success Criterion 5) ................................................................. 40
BIOLOGICAL CHARACTERISTICS .................................................................................... 40
Marsh Vegetation Establishment (Biological Success Criteria 1-3) ................................... 40 Riparian Vegetation (Biological Success Criteria 4 and 5) ................................................. 41 Bird Use (Biological Success Criterion 6) ............................................................................. 41 Fish Presence/Access (Biological Success Criterion 7) ........................................................ 42
RECOMMENDATIONS ............................................................................................................ 43
Coordination ............................................................................................................................ 43 Site Stewardship ...................................................................................................................... 43 Monitoring Changes ............................................................................................................... 43
REFERENCES ............................................................................................................................ 45
APPENDICES ............................................................................................................................. 46
iv
FIGURES
Figure 1. Location of Duwamish River restoration sites in the lower Duwamish River. ............. 2 Figure 2. Location of reference sites for Hamm Creek, Kenco Marine, and North Wind’s Weir.4 Figure 3. Current altered state of former reference sites for Hamm Creek, Kenco Marine, and
North Wind’s Weir. ...................................................................................................... 4 Figure 4. Location of invertebrate reference sites for Hamm Creek. ........................................... 5 Figure 5. Location of invertebrate reference sites for Herring’s House. ...................................... 5 Figure 6. Intertidal area measurements by survey year for restoration sites. ................................ 7 Figure 7. Sink-hole erosion located in the intertidal area at Herring’s House restoration site in 2005................................................................................................................................................. 9 Figure 8. Slight erosion located at Herrings House restoration site in 2010……………………9 Figure 9. Stream channel changes and erosion at Hamm Creek in 2007 and 2011. .................... 10 Figure 10. Shoreline erosion at Hamm Creek near transect 3 in 2010. ....................................... 11 Figure 11. Moved and stacked driftwood at Herring's House restoration site. ........................... 14 Figure 12. Placement of vegetation transects at the Hamm Creek (top figure) and North Wind’s
Weir restoration and reference (bottom figure) sites ................................................. 15 Figure 13. Placement of vegetation transects at the Herring’s House and Kenco Marine. ........ 16 Figure 14. Comparison of the total area of marsh vegetation patches (Lyngby’s sedge and bulrush) at the restoration sites and their associated reference sites by survey year. ................... 18 Figure 15. Goose excluder fencing at Kenco Marine and Canada Gees Foraging Outside. ....... 25 Figure 16. Lyngby’s sedge marsh at North Wind’s Weir. .......................................................... 26 Figure 17. Marsh plantings and goose excluder fencing at Herring’s House reference site
looking south from Herring’s House. ........................................................................ 28 Figure 18. Common reed in the upper marsh of Hamm Creek. .................................................. 28 Figure 19. Reed canarygrass growing near Transect 1 of Hamm Creek. ................................... 29 Figure 20. Yellow flag iris at Hamm Creek. ............................................................................... 29 Figure 21. Cattail near the end of transect 2 and above transect 4 in Hamm Creek. .................. 30
v
TABLES
Table 1. Physical and biological success criteria monitored at the Elliott Bay/Duwamish Restoration Program sites (EBDRP 2000). ..................................................................................... 2 Table 2. GPS intertidal area measurements by survey year for restoration sites . ......................... 7 Table 3. Total area of marsh vegetation patches (Lyngby’s sedge and bulrush) at the restoration and reference sites by survey year. ............................................................................................... 17 Table 4. Vegetation species present in marsh transects at the restoration sites and their associated reference sites (includes species of Carex and Scirpus). ............................................. 18 Table 5. Estimated mean percent cover of target species, Lyngby’s sedge (Carex lyngbyei) and bulrush (Scirpus spp.), and non-target species, including nonnative and invasive plants, at the restoration sites and their associated reference sites. .................................................................... 19 Table 6. Mean shoot heights of Lyngby’s sedge and statistical analyses for the restoration sites and their reference sites by survey year. An asterisk indicates a statistically significant larger mean shoot height for the site (Mann-Whitney test, P<0.05). ...................................................... 20 Table 7. Mean shoot heights of bulrush and statistical analyses for the restoration sites and their reference sites by survey year. An asterisk indicates a statistically significant larger mean shoot height for the site (Mann-Whitney test, P<0.05). ......................................................................... 21 Table 8. Median shoot densities of Lyngby’s sedge and statistical analyses for the restoration sites and their reference sites by survey year. An asterisk indicates a statistically significant larger mean shoot density at the site (Mann-Whitney test, P<0.05). ............................................ 22 Table 9. Median shoot densities of bulrush and statistical analyses for the restoration sites and their reference sites by survey year. An asterisk indicates a statistically significant larger mean shoot density at the site (Mann-Whitney test, P<0.05). ................................................................ 23 Table 10. Estimates of riparian areal extent at restoration sites by survey year. ......................... 32 Table 11. Independent estimates of percent cover for herbaceous, shrub, tree, and nonnative riparian vegetation layers at restoration sites by survey year. ...................................................... 33 Table 12. Survival of riparian vegetation shrubs and trees at Kenco Marine restoration site in 2007 and 2011. .............................................................................................................................. 33 Table 13. Success of Hamm Creek and Herring’s House restoration sites to meet physical and biological criteria targets by monitoring task and survey year. .................................................... 38 Table 14. Success of North Wind’s Weir and Kenco Marine restoration sites to meet physical and biological criteria targets by monitoring task and survey year. ............................................. 39
1
INTRODUCTION This report contains monitoring data collected in 2010 and 2011 and summary comparisons to data collected in 2001, 2002, 2003, 2005 and 2007 for three intertidal habitat restoration projects in the lower Duwamish River, Washington. This report also contains comparisons to data collected in 2007 for the Kenco Marine site. All of the reference sites used in prior years had been altered either through enhancement plantings or converted to other habitats, so no comparisons to reference sites were possible. These data were collected as part of the Elliott Bay/Duwamish Restoration Program (EBDRP). The EBDRP Panel was established as part of a 1991 Consent Decree between the City of Seattle, Metro (now King County Department of Natural Resources) (DNR), and natural resource trustees1. In 1990, a lawsuit was filed against the City of Seattle and Metro by the United States of America on behalf of the Department of Commerce’s National Oceanic and Atmospheric Administration (NOAA) under its authority as a natural resource trustee provided by the Comprehensive Environmental Response, Compensation and Liability Act of 1980 (CERCLA). The lawsuit was filed to recover damages “for injury to, destruction of, and loss of natural resources resulting from releases of hazardous substances… into the environment in and around the Duwamish River and Elliott Bay, for the costs of restoring, replacing or acquiring the equivalent of the affected natural resources, and for the costs of assessing the damage to the affected natural resources” (U.S. vs. City of Seattle & Metro, 1991). Rather than engage in lengthy and costly litigation, the City of Seattle and Metro, along with the natural resource trustees, negotiated a settlement agreement to establish a program to help restore and replace natural resources of Elliott Bay and the lower Duwamish River. The EBDRP Panel of Managers is comprised of the City of Seattle, King County DNR, and the natural resource trustees. The projects’ construction and monitoring are under the sponsorship and guidance of the EBDRP Panel and follow the Intertidal Habitat Projects Monitoring Program monitoring plan (EBDRP 2000). The monitoring plan describes a 10-year project with monitoring scheduled for Years 1-3, 5, 7, and 10. Physical success and biological success criteria were identified in the monitoring plan to determine if project restoration goals are being met. Five specific criteria were identified to be monitored under the physical success criteria and eight under the biological success criteria (Table 1). Data collection methods and post-construction site monitoring schedules were followed as described in the monitoring plan unless otherwise stated.
1 National Oceanic and Atmospheric Administration, U.S. Fish and Wildlife Service, Washington State Department of Ecology, the Muckleshoot Indian Tribe, and the Suquamish Tribe.
2
Table 1. Physical and biological success criteria monitored at the Elliott Bay/Duwamish Restoration Program sites (EBDRP 2000).
Physical Success Criteria Biological Success Criteria
1. Intertidal Area 2. Tidal Regime 3. Slope Erosion 4. Sediment Structure** 5. Sediment Quality*
1. Marsh Vegetation Establishment - Marsh vegetation area 2. Marsh Vegetation Establishment - Species composition 3. Marsh Vegetation Establishment - Plant vigor 4. Riparian Vegetation Establishment - Areal extent/ invasive plant coverage 5. Riparian Vegetation Establishment - Survival 6. Bird Use** - Presence/absence 7. Fish** - Access/presence 8. Invertebrate Prey Resource Production - under separate report
* for Herring’s House site only - eliminated by EBDRP as a monitoring criteria in 2003. ** discontinued after 2005.
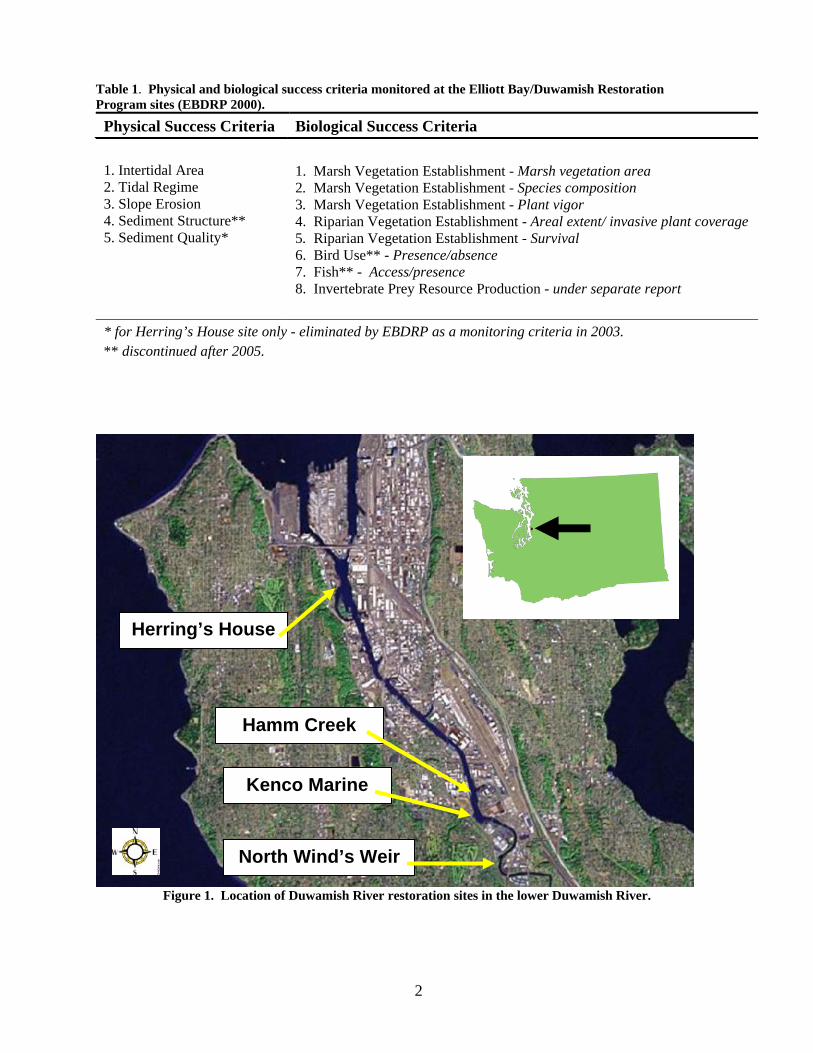
Figure 1. Location of Duwamish River restoration sites in the lower Duwamish River.
North Wind’s Weir
Herring’s House
Hamm Creek
Kenco Marine
3
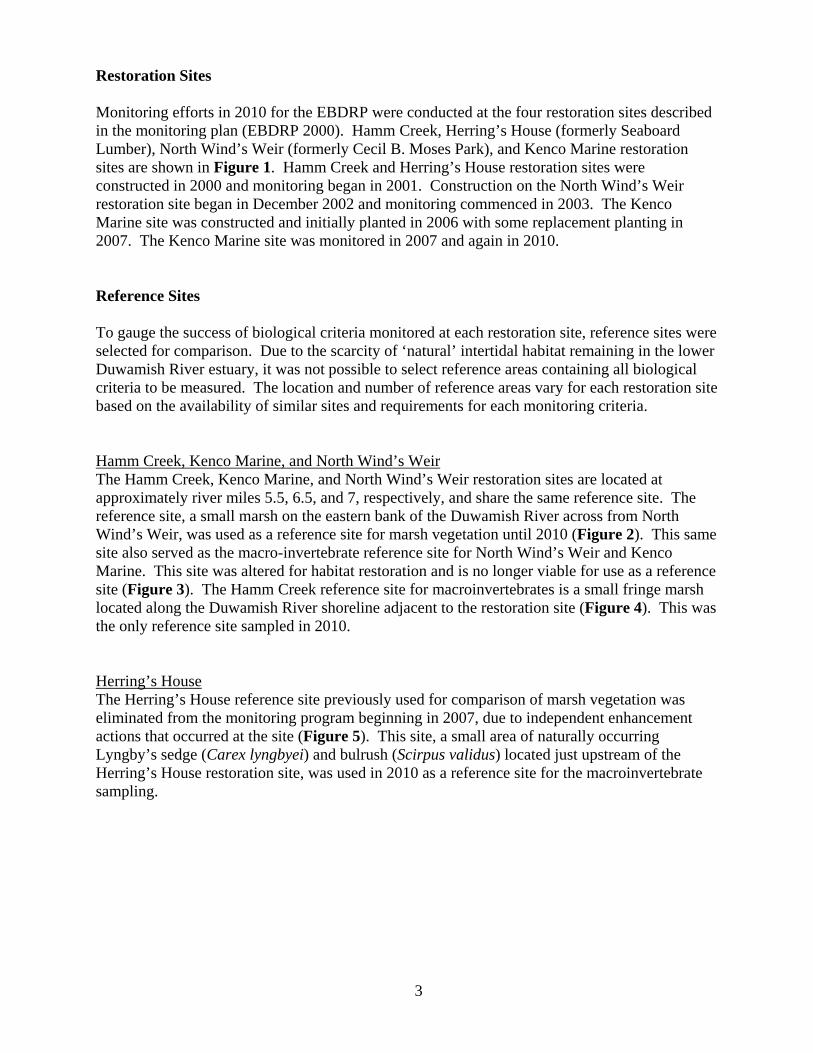
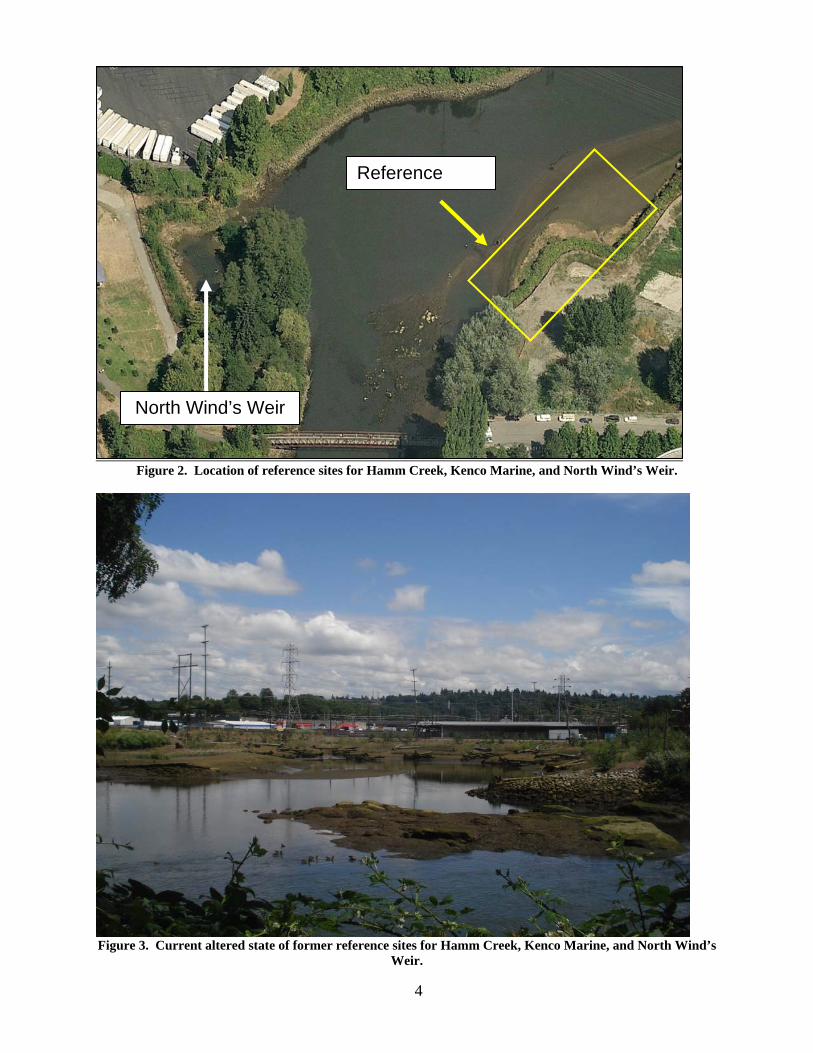
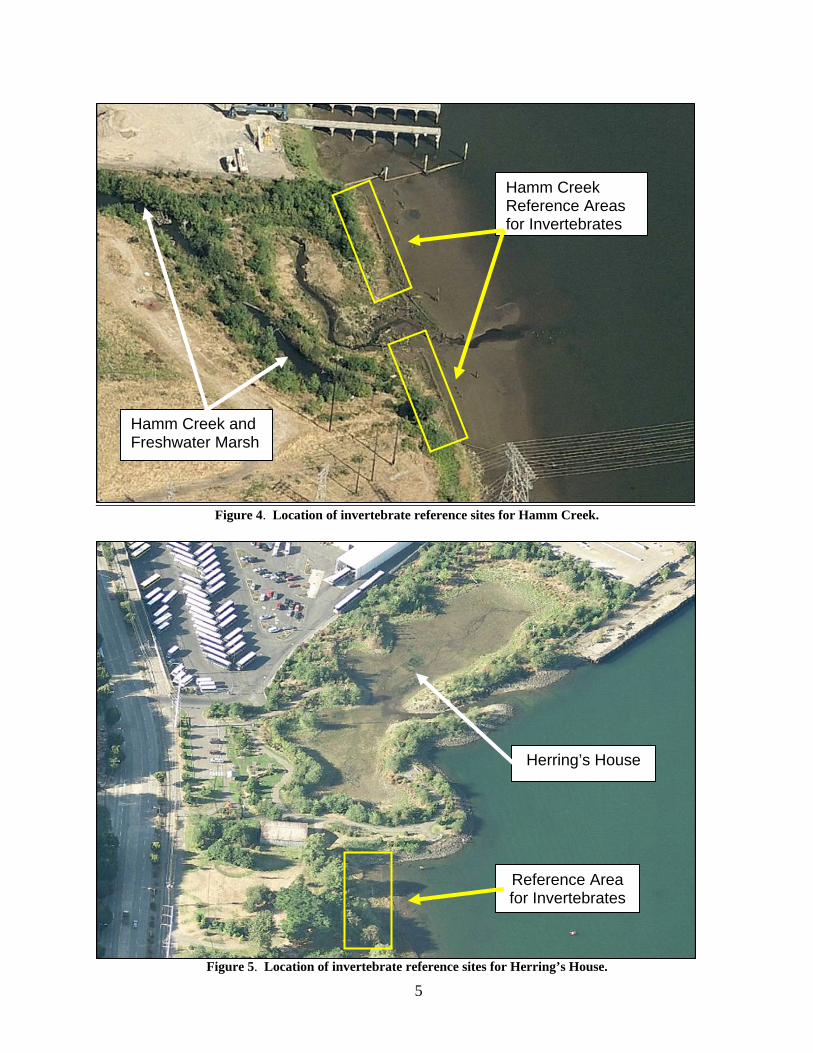
Restoration Sites Monitoring efforts in 2010 for the EBDRP were conducted at the four restoration sites described in the monitoring plan (EBDRP 2000). Hamm Creek, Herring’s House (formerly Seaboard Lumber), North Wind’s Weir (formerly Cecil B. Moses Park), and Kenco Marine restoration sites are shown in Figure 1. Hamm Creek and Herring’s House restoration sites were constructed in 2000 and monitoring began in 2001. Construction on the North Wind’s Weir restoration site began in December 2002 and monitoring commenced in 2003. The Kenco Marine site was constructed and initially planted in 2006 with some replacement planting in 2007. The Kenco Marine site was monitored in 2007 and again in 2010. Reference Sites To gauge the success of biological criteria monitored at each restoration site, reference sites were selected for comparison. Due to the scarcity of ‘natural’ intertidal habitat remaining in the lower Duwamish River estuary, it was not possible to select reference areas containing all biological criteria to be measured. The location and number of reference areas vary for each restoration site based on the availability of similar sites and requirements for each monitoring criteria. Hamm Creek, Kenco Marine, and North Wind’s Weir The Hamm Creek, Kenco Marine, and North Wind’s Weir restoration sites are located at approximately river miles 5.5, 6.5, and 7, respectively, and share the same reference site. The reference site, a small marsh on the eastern bank of the Duwamish River across from North Wind’s Weir, was used as a reference site for marsh vegetation until 2010 (Figure 2). This same site also served as the macro-invertebrate reference site for North Wind’s Weir and Kenco Marine. This site was altered for habitat restoration and is no longer viable for use as a reference site (Figure 3). The Hamm Creek reference site for macroinvertebrates is a small fringe marsh located along the Duwamish River shoreline adjacent to the restoration site (Figure 4). This was the only reference site sampled in 2010. Herring’s House The Herring’s House reference site previously used for comparison of marsh vegetation was eliminated from the monitoring program beginning in 2007, due to independent enhancement actions that occurred at the site (Figure 5). This site, a small area of naturally occurring Lyngby’s sedge (Carex lyngbyei) and bulrush (Scirpus validus) located just upstream of the Herring’s House restoration site, was used in 2010 as a reference site for the macroinvertebrate sampling.
4
Figure 2. Location of reference sites for Hamm Creek, Kenco Marine, and North Wind’s Weir.
Figure 3. Current altered state of former reference sites for Hamm Creek, Kenco Marine, and North Wind’s
Weir.
Reference
North Wind’s Weir
5
Figure 4. Location of invertebrate reference sites for Hamm Creek.
Figure 5. Location of invertebrate reference sites for Herring’s House.
Hamm Creek Reference Areas for Invertebrates
Hamm Creek and Freshwater Marsh
Reference Area for Invertebrates
Herring’s House
6
PHYSICAL CHARACTERISTICS Intertidal Area (Physical Success Criterion 1) Total restored area between an elevation of +12.0 ft. Mean Low Low Water (MLLW) and -2.0 ft. MLLW will be at least 90% of the target intertidal elevation for each site. Target intertidal area for the Hamm Creek is 4,047 m2 (1.0 acre), Herring’s House is 8,094 m2 (2.0 acres), and North Wind’s Weir is 4,047 m2 (1.0 acre) (EBDRP 2000). With the approval of the EBDRP Panel, the Hamm Creek and Herring’s House restoration sites were not monitored for intertidal area in 2010. Previously collected data indicated that these sites have been stable since construction (USFWS 2006). Intertidal area was collected at North Wind’s Weir and Kenco Marine so there would be a consistent number of years for comparison between the sites. This was the second collection of this data for the Kenco Marine restoration site. It should be noted that in all prior monitoring years the total restored area for each of the sites was measured to different low-elevation boundaries. At Herrings House and North Winds Weir, total restored area was measured to the mouth of the inlet. At Hamm Creek the site was measured to the end of the taller boundary fence. Collecting this information for Hamm Creek to -2.0 MLLW (as defined in the physical success criterion) never occurred, because of the increased cost and effort required to collect this information. This may account for some of the discrepancy in achieving the performance criteria for some of the sites. These discrepancies may be more apparent for the Hamm Creek site, where the entire length of the property boundary is adjacent to the riverbank and less so for Herring’s House and North Wind’s Weir where only a narrow channel of the site is adjacent to the riverbank. Methods In 2011 the intertidal area for the North Winds Weir and Kenco Marine sites was mapped by walking a continuous line along the perimeter of the intertidal area, outlined by flags placed at +12 ft. MLLW based on tide, using a Trimble2 GeoExplorer 3 Global Positioning System (GPS) (±1-3 meter precision for each point with differential correction). The data points were downloaded, differentially corrected, and transferred to Geographical Information System (GIS), ArcMap 9.2 software for analysis. Due to time and budget restraints, surveying the intertidal area using a Nikon Total Station was discontinued after 2003. At North Wind’s Weir, the survey area included the basin and the outlet channel to the Duwamish River. At Kenco Marine the survey area included the area between the suspected property lines (determined by the approximate location of the goose excluder fence to the north and the large sign at the southern end of the site) to approximately 10 ft. beyond the goose excluder fence. This was estimated to be an elevation of approximately 2.3 ft. MLLW.
2For informational purposes only. In all instances, use of brand names in this report does not constitute endorsement by the U.S. Government.
7
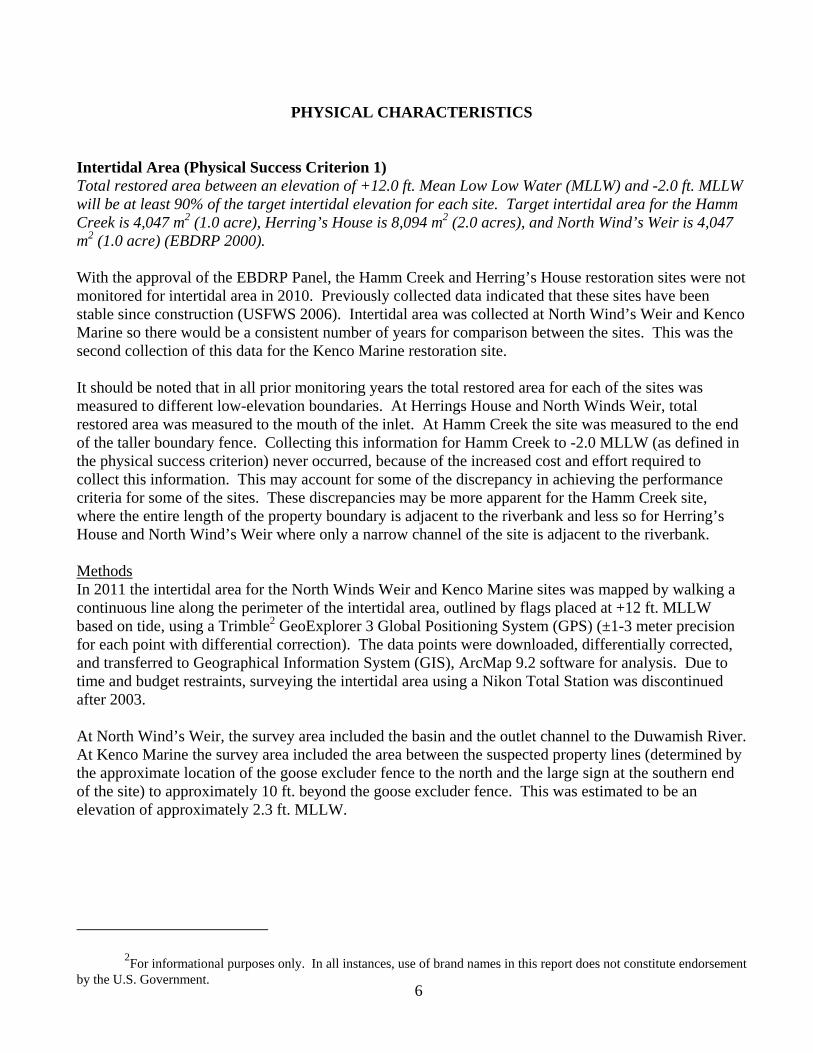
Results The intertidal area estimates for the restoration sites are provided in Figure 6 from the data in Table 2.
Figure 6. Intertidal area measurements by survey year for restoration sites.
Table 2. GPS intertidal area measurements by survey year for restoration sites in the Duwamish. River estuary.
Site
Area in m2 (acres)
2001 2002 2003 2005 2007 2011 Mean Hamm Creek 2,833 (0.7) 3,278 (0.8) 2,967 (0.7) 2,920 (0.7) -
- 3,000 (0.7)
Herring's House 8,449 (2.1) 8,737 (2.2) 8,504 (2.1) 8,782 (2.2) -
- 8,618 (2.1)
N. Wind’s Weir - - 1,278 (0.3) 1,030 (0.3) 1,232 (0.3)
1,130 (0.3) 1,168 (0.3)
Kenco Marine -
- - - 1,403 (0.3)
1,580 (0.4) 1,491 (0.4)
Discussion The intertidal area at North Wind’s Weir (NWW) has remained at 0.3 acre since construction. NWW decreased in 2011, however was within the previous years’ range of values. The small difference in estimated intertidal area from 2003 to 2011 (-248 m2) is likely due in part to random error and measurement error. From visual observations, the site continues to appear stable with no noticeable signs of erosion or deposition of sediments. The intertidal area estimate does not meet Physical Success Criterion 1 of 0.9 acre (90 percent of 1 acre) for the site. The monitoring plan (EBDRP 2000) states that the entire area of the North Wind’s Weir site is 1 acre in size. The 0.7-acre difference in intertidal area
8
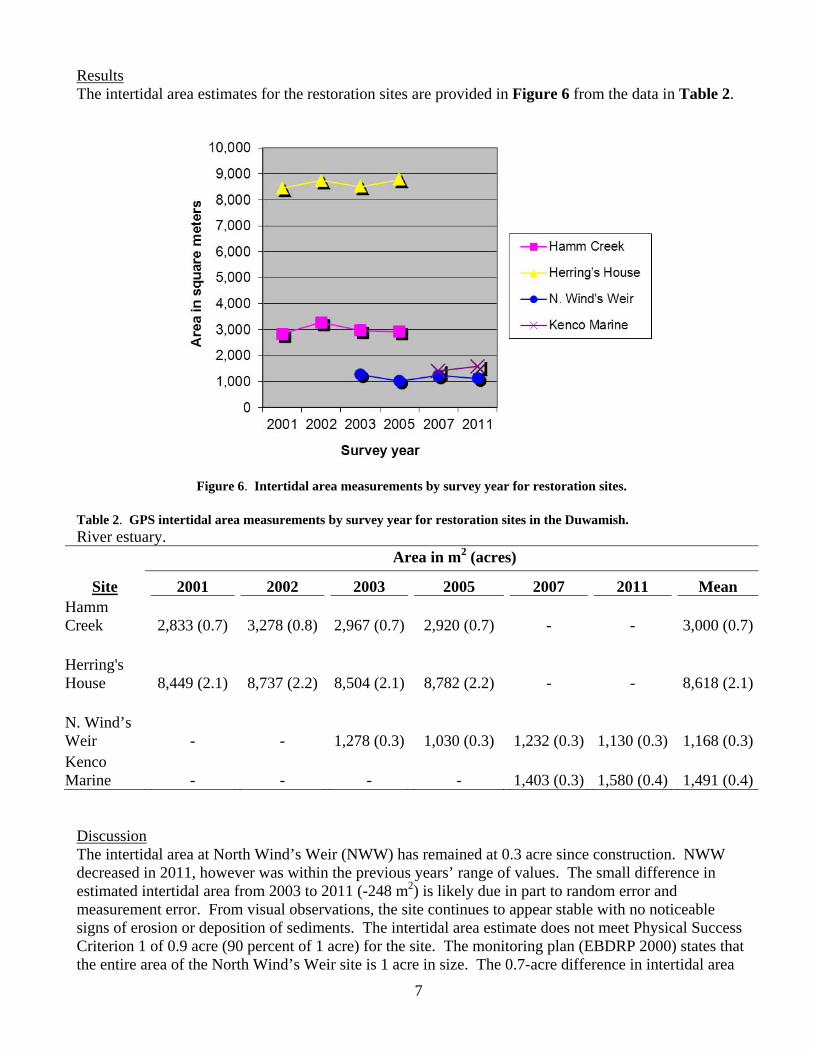
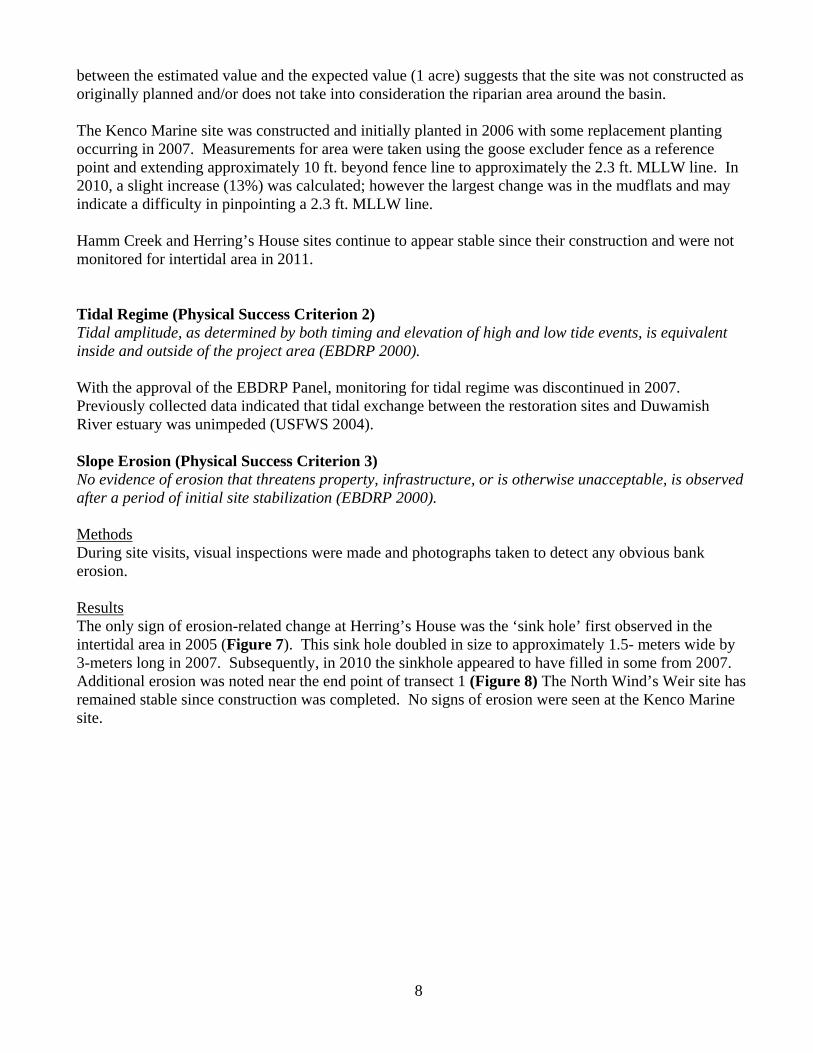
between the estimated value and the expected value (1 acre) suggests that the site was not constructed as originally planned and/or does not take into consideration the riparian area around the basin. The Kenco Marine site was constructed and initially planted in 2006 with some replacement planting occurring in 2007. Measurements for area were taken using the goose excluder fence as a reference point and extending approximately 10 ft. beyond fence line to approximately the 2.3 ft. MLLW line. In 2010, a slight increase (13%) was calculated; however the largest change was in the mudflats and may indicate a difficulty in pinpointing a 2.3 ft. MLLW line. Hamm Creek and Herring’s House sites continue to appear stable since their construction and were not monitored for intertidal area in 2011. Tidal Regime (Physical Success Criterion 2) Tidal amplitude, as determined by both timing and elevation of high and low tide events, is equivalent inside and outside of the project area (EBDRP 2000). With the approval of the EBDRP Panel, monitoring for tidal regime was discontinued in 2007. Previously collected data indicated that tidal exchange between the restoration sites and Duwamish River estuary was unimpeded (USFWS 2004). Slope Erosion (Physical Success Criterion 3) No evidence of erosion that threatens property, infrastructure, or is otherwise unacceptable, is observed after a period of initial site stabilization (EBDRP 2000). Methods During site visits, visual inspections were made and photographs taken to detect any obvious bank erosion. Results The only sign of erosion-related change at Herring’s House was the ‘sink hole’ first observed in the intertidal area in 2005 (Figure 7). This sink hole doubled in size to approximately 1.5- meters wide by 3-meters long in 2007. Subsequently, in 2010 the sinkhole appeared to have filled in some from 2007. Additional erosion was noted near the end point of transect 1 (Figure 8) The North Wind’s Weir site has remained stable since construction was completed. No signs of erosion were seen at the Kenco Marine site.
9
Figure 7. Sink-hole erosion located in the intertidal area at Herring’s House restoration site in 2005.
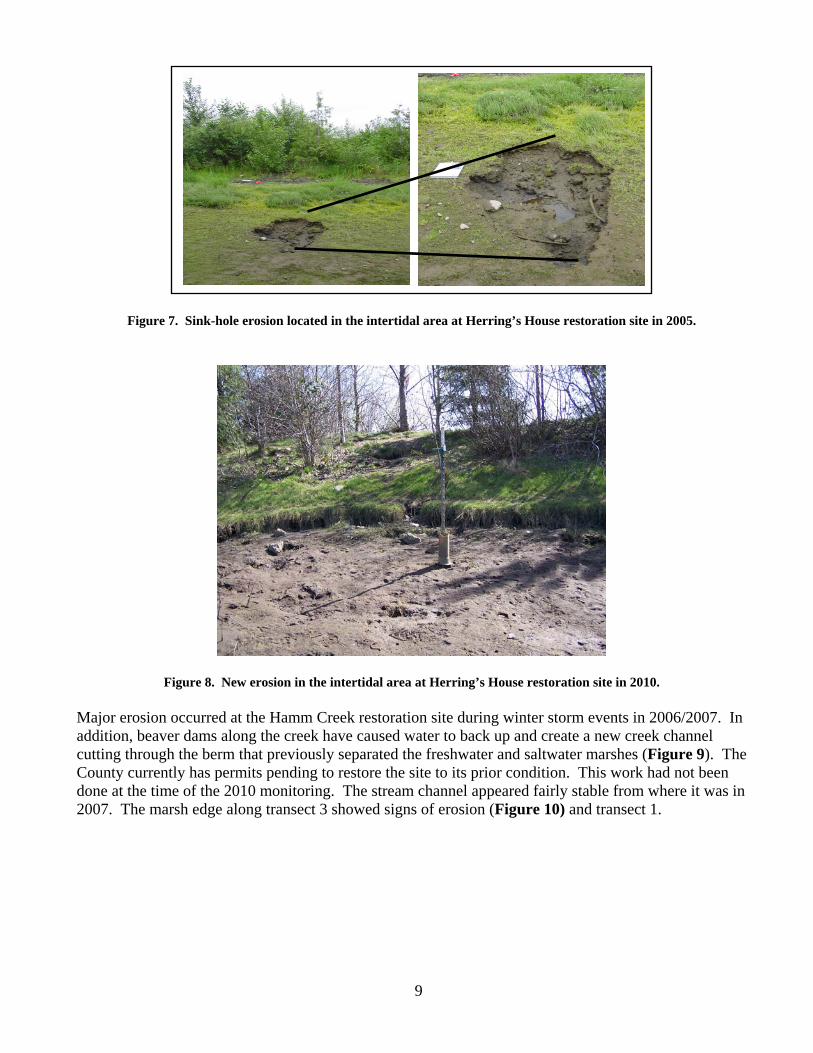
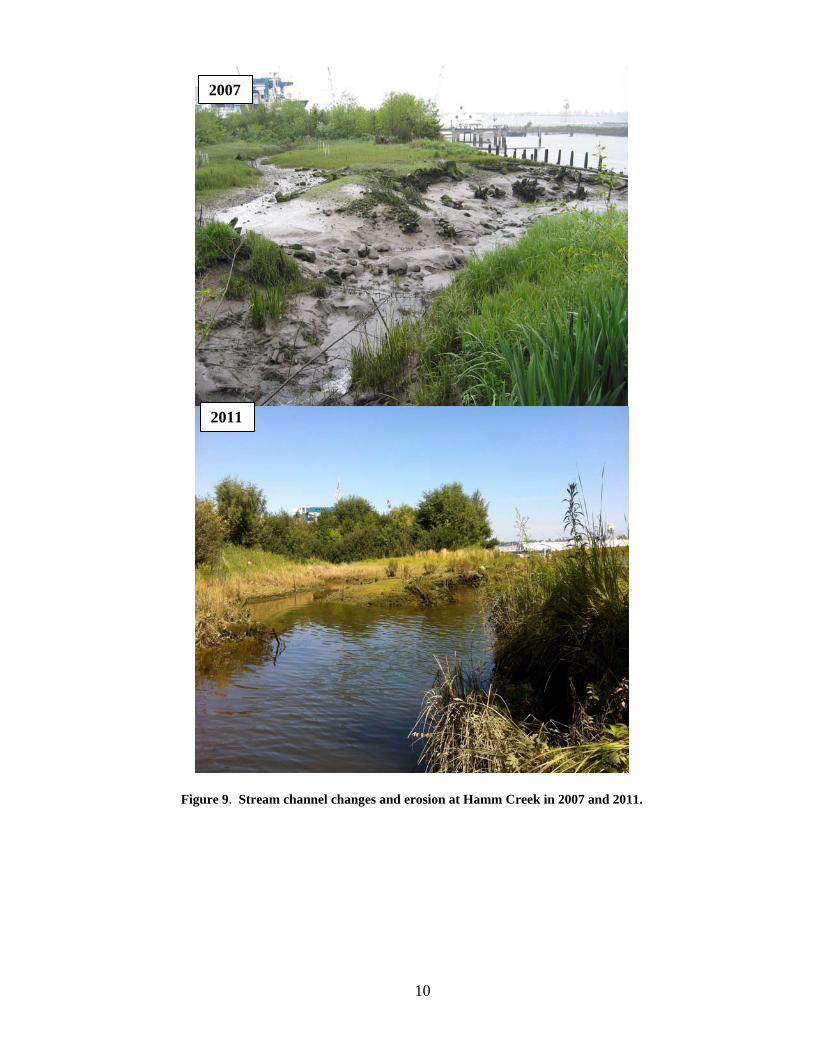
Figure 8. New erosion in the intertidal area at Herring’s House restoration site in 2010. Major erosion occurred at the Hamm Creek restoration site during winter storm events in 2006/2007. In addition, beaver dams along the creek have caused water to back up and create a new creek channel cutting through the berm that previously separated the freshwater and saltwater marshes (Figure 9). The County currently has permits pending to restore the site to its prior condition. This work had not been done at the time of the 2010 monitoring. The stream channel appeared fairly stable from where it was in 2007. The marsh edge along transect 3 showed signs of erosion (Figure 10) and transect 1.
10
Figure 9. Stream channel changes and erosion at Hamm Creek in 2007 and 2011.
2007
2011
11
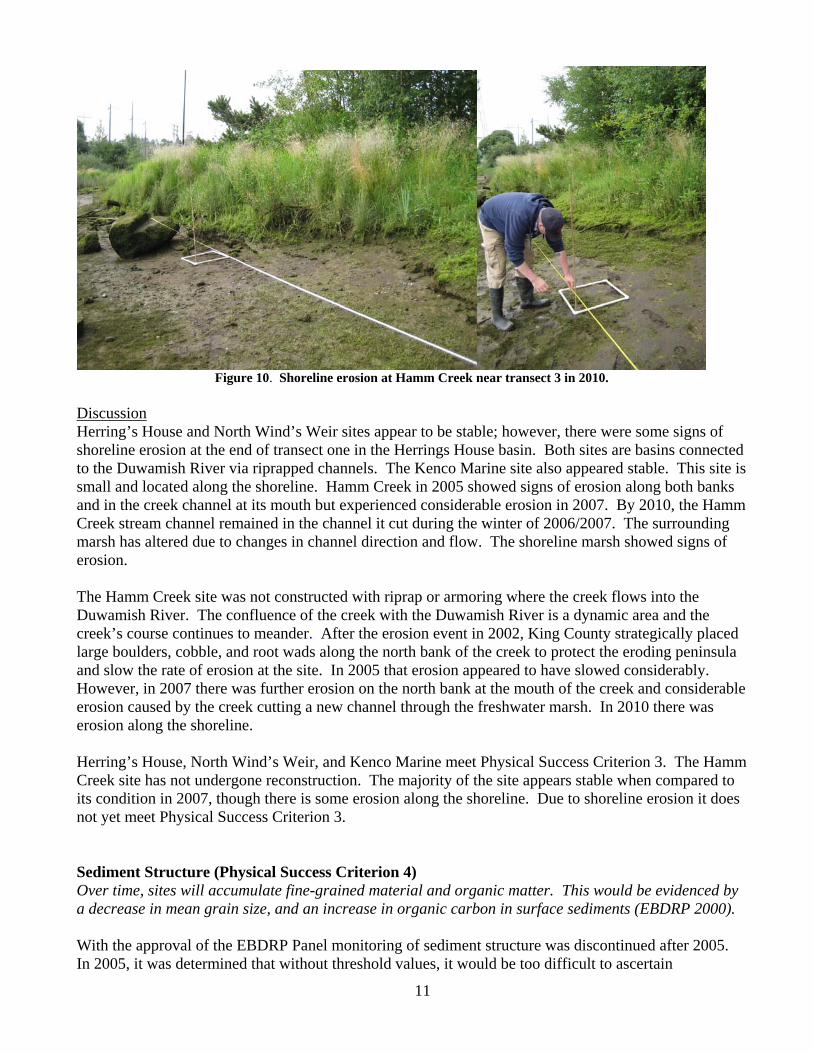
Figure 10. Shoreline erosion at Hamm Creek near transect 3 in 2010.
Discussion Herring’s House and North Wind’s Weir sites appear to be stable; however, there were some signs of shoreline erosion at the end of transect one in the Herrings House basin. Both sites are basins connected to the Duwamish River via riprapped channels. The Kenco Marine site also appeared stable. This site is small and located along the shoreline. Hamm Creek in 2005 showed signs of erosion along both banks and in the creek channel at its mouth but experienced considerable erosion in 2007. By 2010, the Hamm Creek stream channel remained in the channel it cut during the winter of 2006/2007. The surrounding marsh has altered due to changes in channel direction and flow. The shoreline marsh showed signs of erosion. The Hamm Creek site was not constructed with riprap or armoring where the creek flows into the Duwamish River. The confluence of the creek with the Duwamish River is a dynamic area and the creek’s course continues to meander. After the erosion event in 2002, King County strategically placed large boulders, cobble, and root wads along the north bank of the creek to protect the eroding peninsula and slow the rate of erosion at the site. In 2005 that erosion appeared to have slowed considerably. However, in 2007 there was further erosion on the north bank at the mouth of the creek and considerable erosion caused by the creek cutting a new channel through the freshwater marsh. In 2010 there was erosion along the shoreline. Herring’s House, North Wind’s Weir, and Kenco Marine meet Physical Success Criterion 3. The Hamm Creek site has not undergone reconstruction. The majority of the site appears stable when compared to its condition in 2007, though there is some erosion along the shoreline. Due to shoreline erosion it does not yet meet Physical Success Criterion 3. Sediment Structure (Physical Success Criterion 4) Over time, sites will accumulate fine-grained material and organic matter. This would be evidenced by a decrease in mean grain size, and an increase in organic carbon in surface sediments (EBDRP 2000). With the approval of the EBDRP Panel monitoring of sediment structure was discontinued after 2005. In 2005, it was determined that without threshold values, it would be too difficult to ascertain
12
statistically whether the restoration projects have or will successfully meet Physical Success Criterion 4 as listed in the monitoring plan (EBDRP 2000). Sediment Quality (Physical Success Criterion 5) No evidence of contamination due to sediment transport or on-site migration of upland contaminants to groundwater or aquatic areas (Herring’s House only) (EBDRP 2000). Originally, the monitoring plan allocated funds for the installation of three groundwater monitoring wells at the Herring’s House site to evaluate the success of Criterion 5. Following discussions with their cooperators in 2003, the EBDRP Panel decided not to install monitoring wells at the Herring’s House site; therefore, this criterion was not implemented.
BIOLOGICAL CHARACTERISTICS
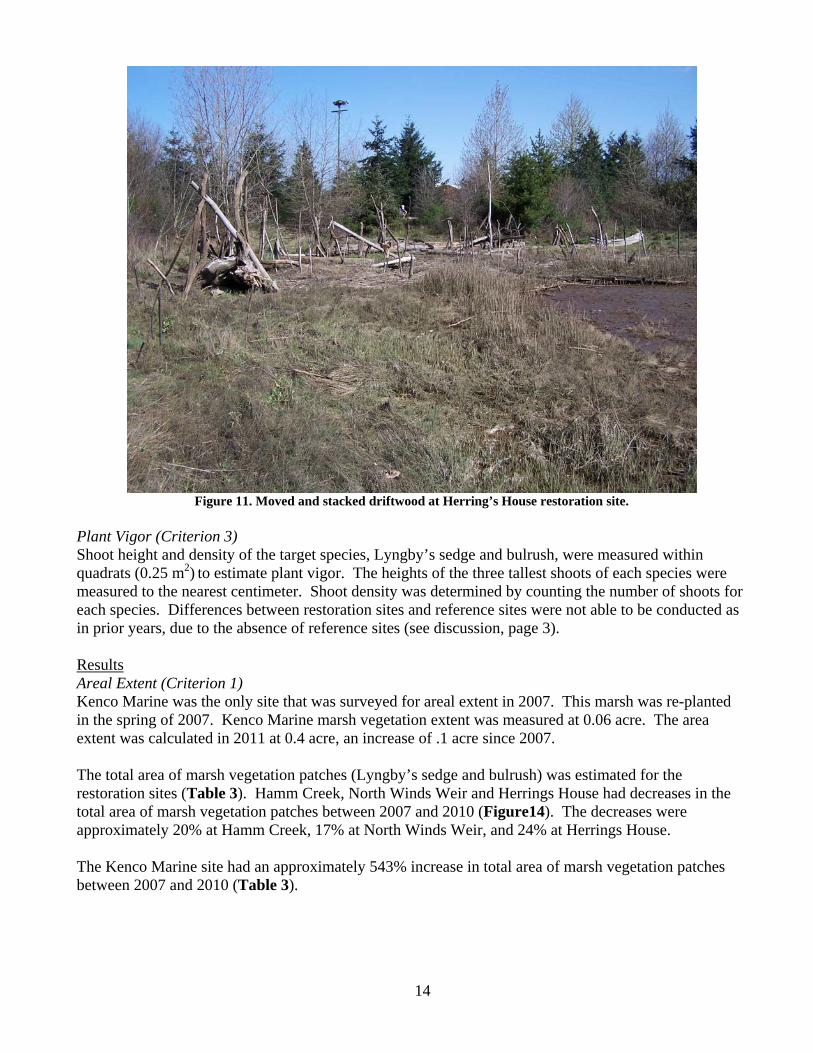
Marsh Vegetation Establishment (Biological Success Criteria 1-3) The areal extent of vegetation should be stable or increasing (Criterion 1), species composition of native wetland plants should be comparable to appropriate reference sites (Criterion 2) and plant vigor should be comparable to appropriate reference sites (Criterion 3) (EBDRP 2000). Methods Areal Extent (Criterion 1) Areal extent of marsh vegetation was surveyed at only the Kenco Marine and North Winds Weir restoration sites in 2011. Following the border between riparian and marsh vegetation, the extent of marsh vegetation was mapped by walking a continuous line along the perimeter of the marsh vegetation area using GPS (±1-3 meter precision for each point with differential correction). The area of the resulting polygon was calculated using GIS/ArcView software. The Hamm Creek and Herring’s House restoration sites met Biological Success Criterion 1 for areal extent in 2005. With the approval of the EBDRP Panel, monitoring of these restoration and associated reference sites for this criterion were discontinued. For 2010, individual marsh vegetation patches (Lyngby’s sedge and bulrush) were measured for each site to the nearest 0.1 meter using a measuring tape to determine total area. This method differed from 2001 when GPS was used to estimate the area of individual marsh vegetation patches. Because the areas of some vegetation patches were too small to be effectively measured with GPS equipment due to resolution limitations, the direct measurement method was deemed to be a better technique for this parameter. The difference in sampling methodology does not allow a direct comparison of 2001 marsh vegetation measurements with those from subsequent years. The measuring tape methodology was used in 2002, 2003, 2005, 2007, and 2010 and patch area can be compared for those years. Species Composition (Criterion 2) Vegetation surveys for species composition occurred along previously established transects at the Hamm Creek, Herring’s House, North Wind’s Weir, and Kenco Marine restoration sites (Figures 12 and 13). Hamm Creek marsh transect 2 was compromised by the newly cut creek channel in 2006/2007. The new creek channel cut through transect 2 just above its turning point and removed plots 2-5 and 2-6. The marsh at Herrings House was compromised in 2010 by human activity (see Figure 11). Driftwood at the site was moved sometime prior to March. In March, all of the transect posts were still in place. However, the metal post indicating the start point of transect 1 had been removed prior to sampling in
13
July. The start point was reestablished at the correct distance from the next turning point. However, there was no way to determine the correct position in relation to intertidal elevation and therefore, the first plot on transect 1 may not be in the correct location. Species composition was determined by identifying and estimating the percent coverage of plant species within a 0.25 m2 quadrat placed at points along each transect. Percent coverage for the target species, Lyngby’s sedge (Carex lyngbyei) and bulrush (Scirpus spp.), were estimated separately from non-target species. Non-target species included all native, nonnative, and invasive plant species except Lyngby’s sedge and bulrush. The EBDRP monitoring plan lists four species as invasive species of special concern: cordgrass (Spartina spp.), purple loosestrife (Lythrum salicaria), reed canarygrass (Phalaris arundinacea), and common reed (Phragmites communis). Besides the four plant species listed in the EBDRP monitoring plan as invasive species of special concern, other invasive species were noted during monitoring events. These species included yellow flag iris (Iris pseudacorus) and perennial pepperweed (Lepidium latifolium). Yellow flag iris is listed as a Class C noxious weed and perennial pepperweed is listed as a Class B weed in Washington State (WSNWCB 2006). While narrowleaf cattail (Typha angustifolia), is not a state-listed weed, its prior range was restricted to the Atlantic Coast, west to Colorado, Nebraska, Missouri and occasionally into Wyoming, Montana, and Eastern Washington. It is currently migrating into the Southwest and along the Pacific Coast (Cooke, 1997). Unlike broadleaf cattail (Typha latifolia), Typha angustifolia grows in brackish waters. Cotula coronopifolia (brassbuttons), an invasive colonizer of mudflats, also is not a state-listed weed. It occurs in estuarine salt marshes and on tidal mudflats. It is a native of South Africa but is now widespread around the world. In the Pacific Northwest it is found from the coast of British Columbia, south to California (Cooke, 1997).
14
Figure 11. Moved and stacked driftwood at Herring’s House restoration site.
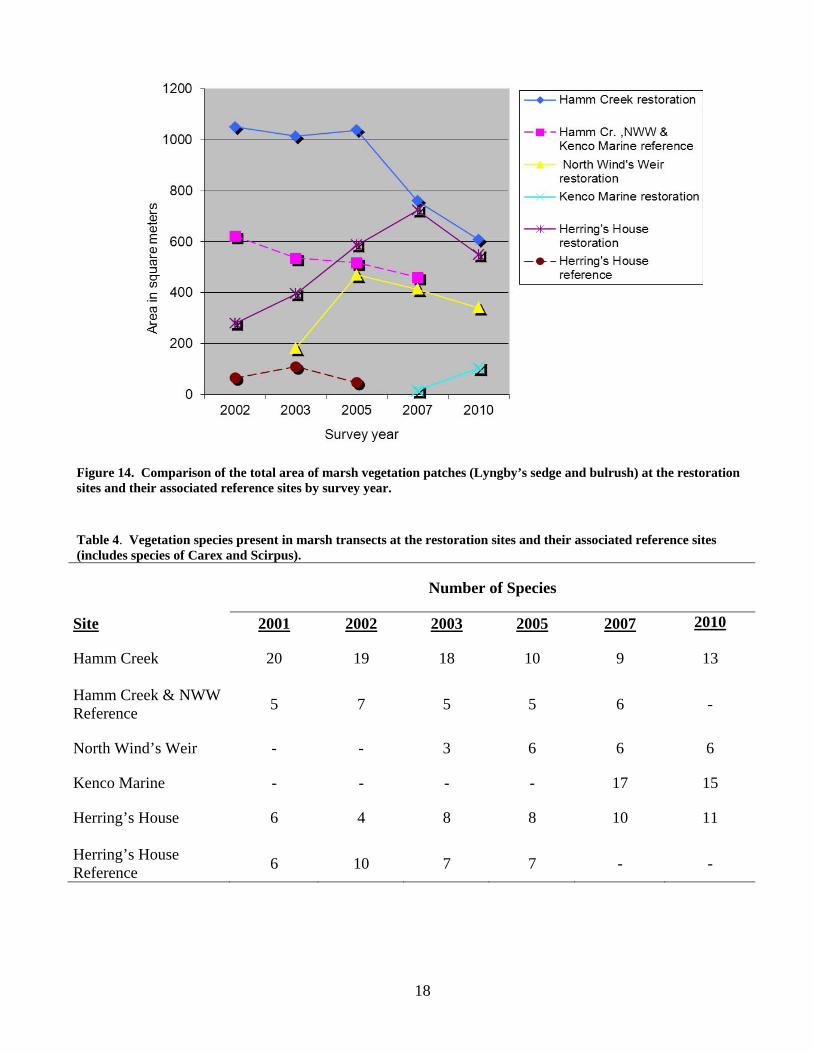
Plant Vigor (Criterion 3) Shoot height and density of the target species, Lyngby’s sedge and bulrush, were measured within quadrats (0.25 m2) to estimate plant vigor. The heights of the three tallest shoots of each species were measured to the nearest centimeter. Shoot density was determined by counting the number of shoots for each species. Differences between restoration sites and reference sites were not able to be conducted as in prior years, due to the absence of reference sites (see discussion, page 3). Results Areal Extent (Criterion 1) Kenco Marine was the only site that was surveyed for areal extent in 2007. This marsh was re-planted in the spring of 2007. Kenco Marine marsh vegetation extent was measured at 0.06 acre. The area extent was calculated in 2011 at 0.4 acre, an increase of .1 acre since 2007. The total area of marsh vegetation patches (Lyngby’s sedge and bulrush) was estimated for the restoration sites (Table 3). Hamm Creek, North Winds Weir and Herrings House had decreases in the total area of marsh vegetation patches between 2007 and 2010 (Figure14). The decreases were approximately 20% at Hamm Creek, 17% at North Winds Weir, and 24% at Herrings House. The Kenco Marine site had an approximately 543% increase in total area of marsh vegetation patches between 2007 and 2010 (Table 3).
15
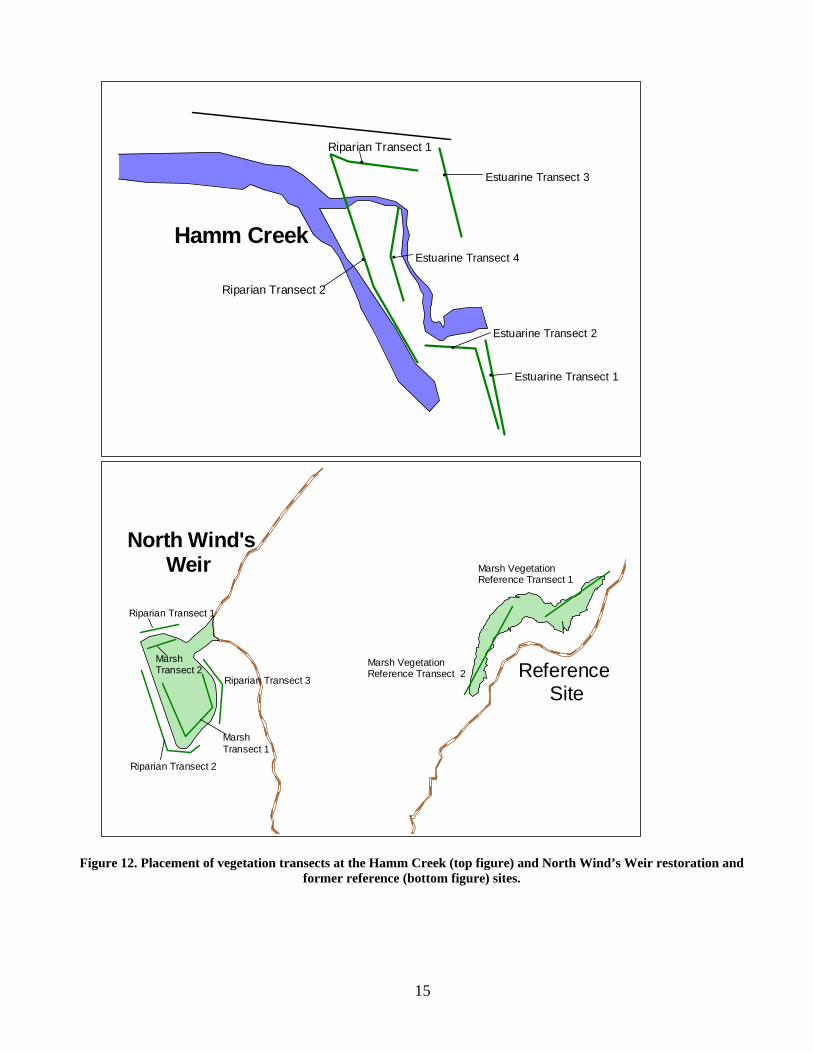
North Wind'sWeir
Marsh Transect 1
Marsh Transect 2
Riparian Transect 1
Marsh Vegetation Reference Transect 1
Marsh Vegetation Reference Transect 2 Reference
Site
Riparian Transect 2
Riparian Transect 3
Hamm Creek
#
Riparian Transect 1
# Estuarine Transect 3
# Estuarine Transect 4
#
Estuarine Transect 2
# Estuarine Transect 1
#
Riparian Transect 2
Figure 12. Placement of vegetation transects at the Hamm Creek (top figure) and North Wind’s Weir restoration and
former reference (bottom figure) sites.
16
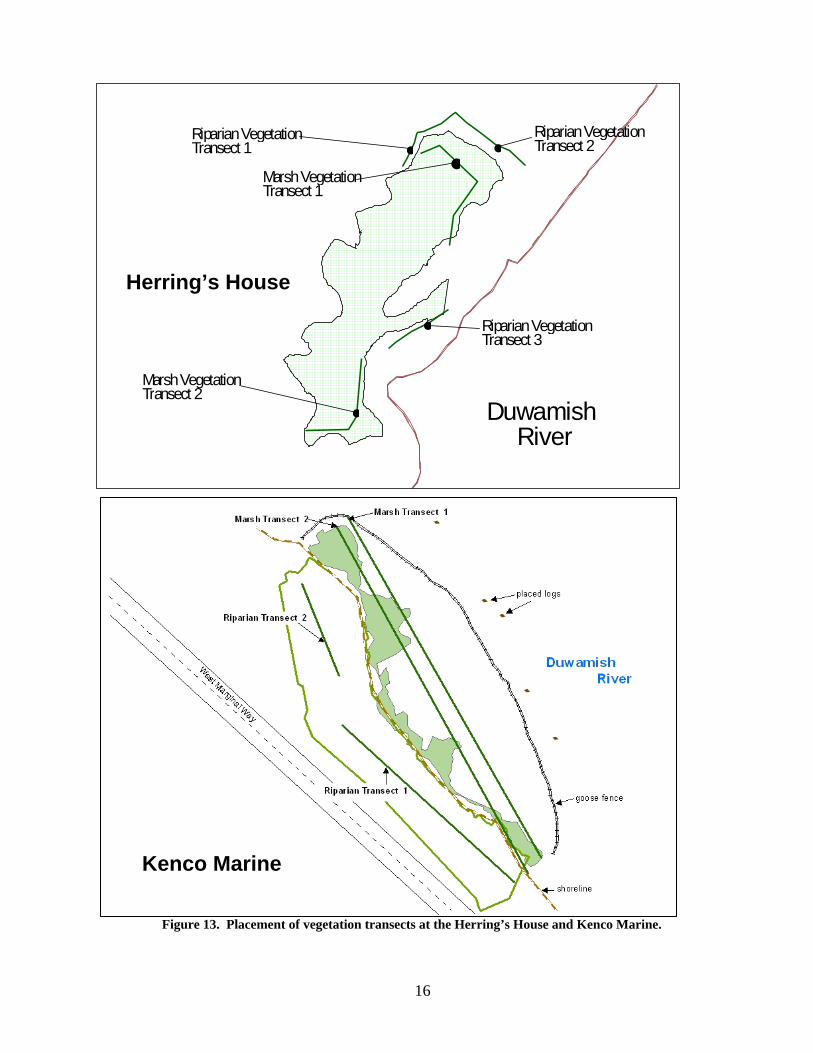
Figure 13. Placement of vegetation transects at the Herring’s House and Kenco Marine.
Duwami s h
River
#
R i p a r i a n V e g e ta t i o n T r a n s e c t 1
#
M a r s h V e g e ta t i o n T ra n s e c t 2
#M a r s h V e g etationT ra n s e c t 1
#
Riparia n V e g e t a ti o n Transe c t 2
# RiparianVegeta t i o n Transect 3
Herring’s House
Kenco Marine
17
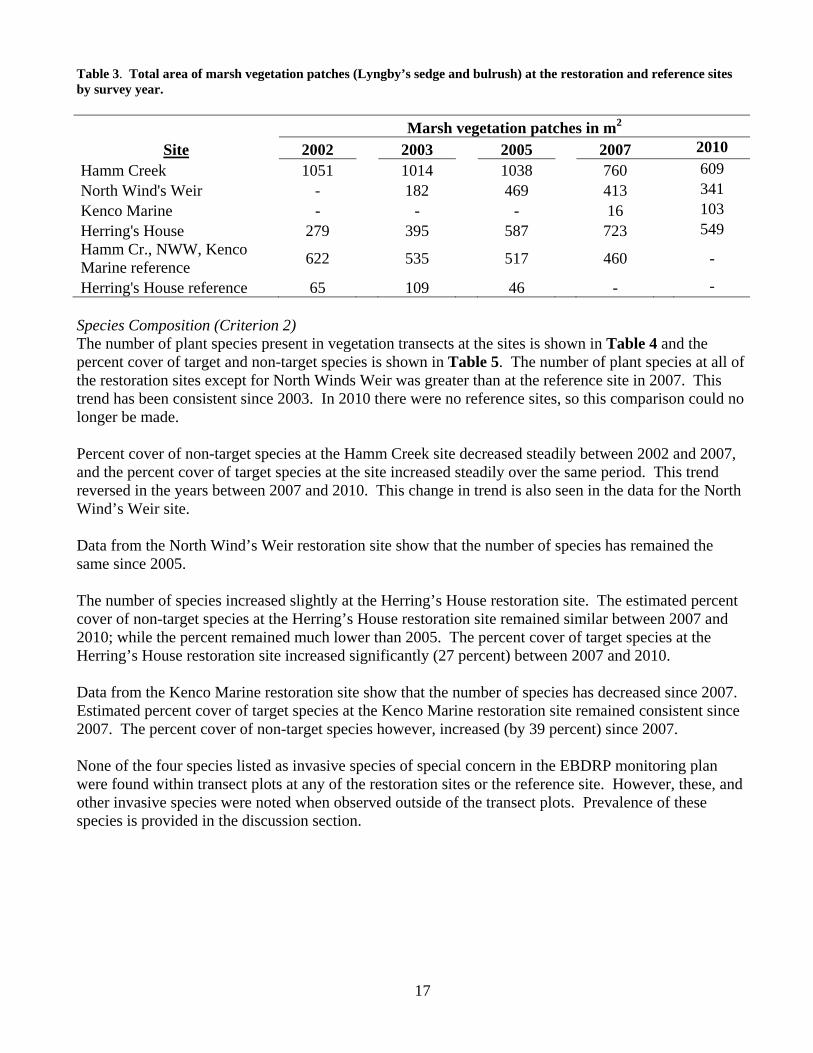
Table 3. Total area of marsh vegetation patches (Lyngby’s sedge and bulrush) at the restoration and reference sites by survey year.
Marsh vegetation patches in m2 Site 2002 2003 2005 2007 2010
Hamm Creek 1051 1014 1038 760 609 North Wind's Weir - 182 469 413 341 Kenco Marine - - - 16 103 Herring's House 279 395 587 723 549 Hamm Cr., NWW, Kenco Marine reference
622 535 517 460 -
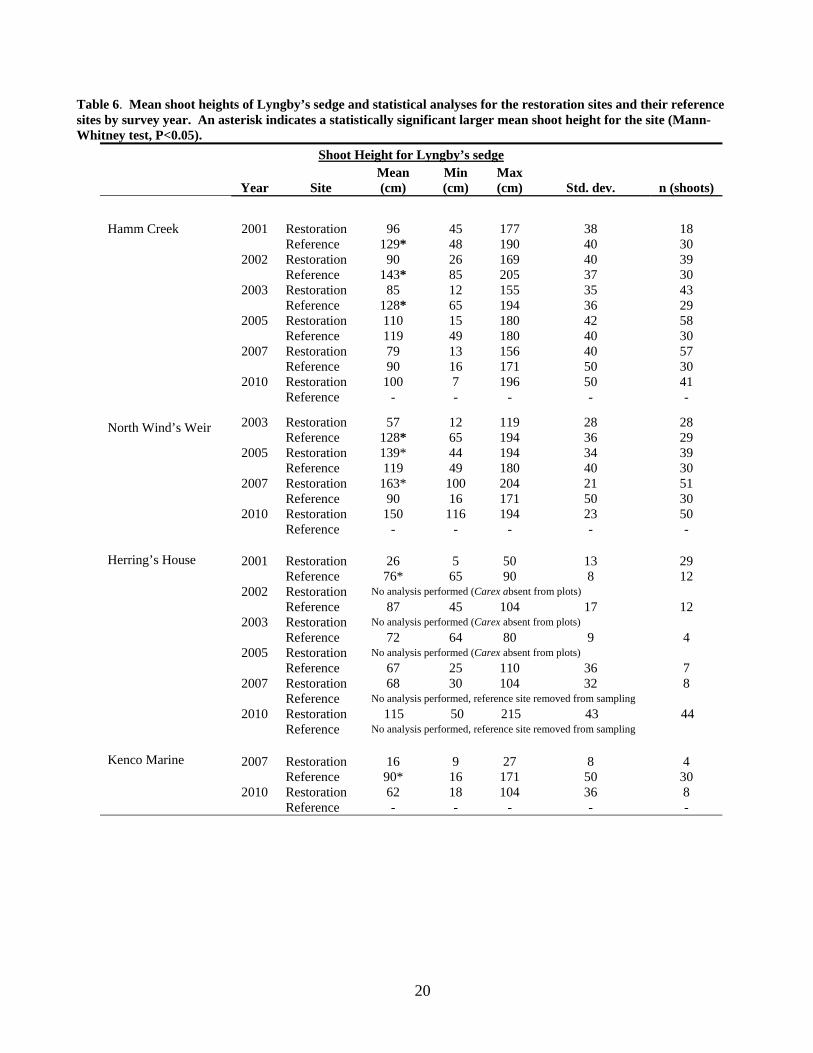
Herring's House reference 65 109 46 - - Species Composition (Criterion 2) The number of plant species present in vegetation transects at the sites is shown in Table 4 and the percent cover of target and non-target species is shown in Table 5. The number of plant species at all of the restoration sites except for North Winds Weir was greater than at the reference site in 2007. This trend has been consistent since 2003. In 2010 there were no reference sites, so this comparison could no longer be made. Percent cover of non-target species at the Hamm Creek site decreased steadily between 2002 and 2007, and the percent cover of target species at the site increased steadily over the same period. This trend reversed in the years between 2007 and 2010. This change in trend is also seen in the data for the North Wind’s Weir site. Data from the North Wind’s Weir restoration site show that the number of species has remained the same since 2005. The number of species increased slightly at the Herring’s House restoration site. The estimated percent cover of non-target species at the Herring’s House restoration site remained similar between 2007 and 2010; while the percent remained much lower than 2005. The percent cover of target species at the Herring’s House restoration site increased significantly (27 percent) between 2007 and 2010. Data from the Kenco Marine restoration site show that the number of species has decreased since 2007. Estimated percent cover of target species at the Kenco Marine restoration site remained consistent since 2007. The percent cover of non-target species however, increased (by 39 percent) since 2007. None of the four species listed as invasive species of special concern in the EBDRP monitoring plan were found within transect plots at any of the restoration sites or the reference site. However, these, and other invasive species were noted when observed outside of the transect plots. Prevalence of these species is provided in the discussion section.
18
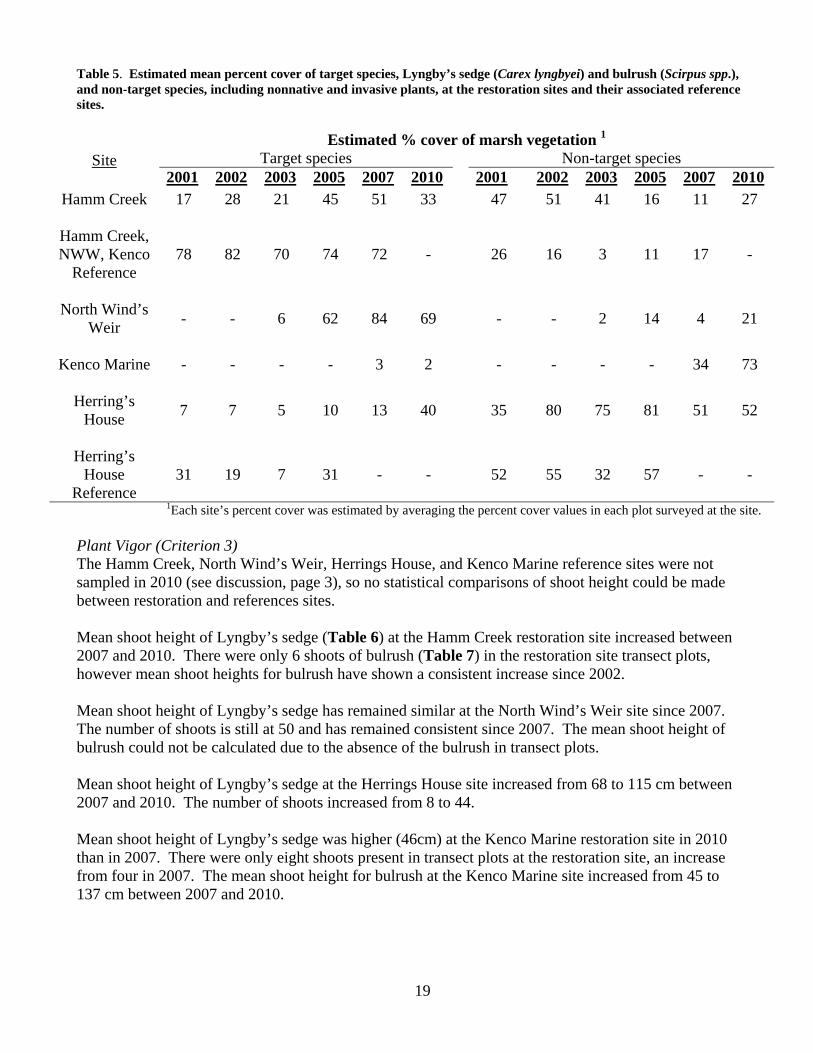
Figure 14. Comparison of the total area of marsh vegetation patches (Lyngby’s sedge and bulrush) at the restoration sites and their associated reference sites by survey year. Table 4. Vegetation species present in marsh transects at the restoration sites and their associated reference sites (includes species of Carex and Scirpus).
Site
Number of Species
2001 2002 2003 2005 2007 2010
Hamm Creek 20 19 18 10 9 13 Hamm Creek & NWW Reference
5 7 5 5 6 -
North Wind’s Weir - - 3 6 6 6
Kenco Marine - - - - 17 15
Herring’s House 6 4 8 8 10 11 Herring’s House Reference
6 10 7 7 - -
19
Table 5. Estimated mean percent cover of target species, Lyngby’s sedge (Carex lyngbyei) and bulrush (Scirpus spp.), and non-target species, including nonnative and invasive plants, at the restoration sites and their associated reference sites.
Site Estimated % cover of marsh vegetation 1
Target species Non-target species 2001 2002 2003 2005 2007 2010 2001 2002 2003 2005 2007 2010
Hamm Creek 17 28 21 45 51 33 47 51 41 16 11 27
Hamm Creek, NWW, Kenco
Reference 78 82 70 74 72 - 26 16 3 11 17 -
North Wind’s
Weir - - 6 62 84 69 - - 2 14 4 21
Kenco Marine - - - - 3 2 - - - - 34 73
Herring’s
House 7 7 5 10 13 40 35 80 75 81 51 52
Herring’s
House Reference
31 19 7 31 - - 52 55 32 57 - -
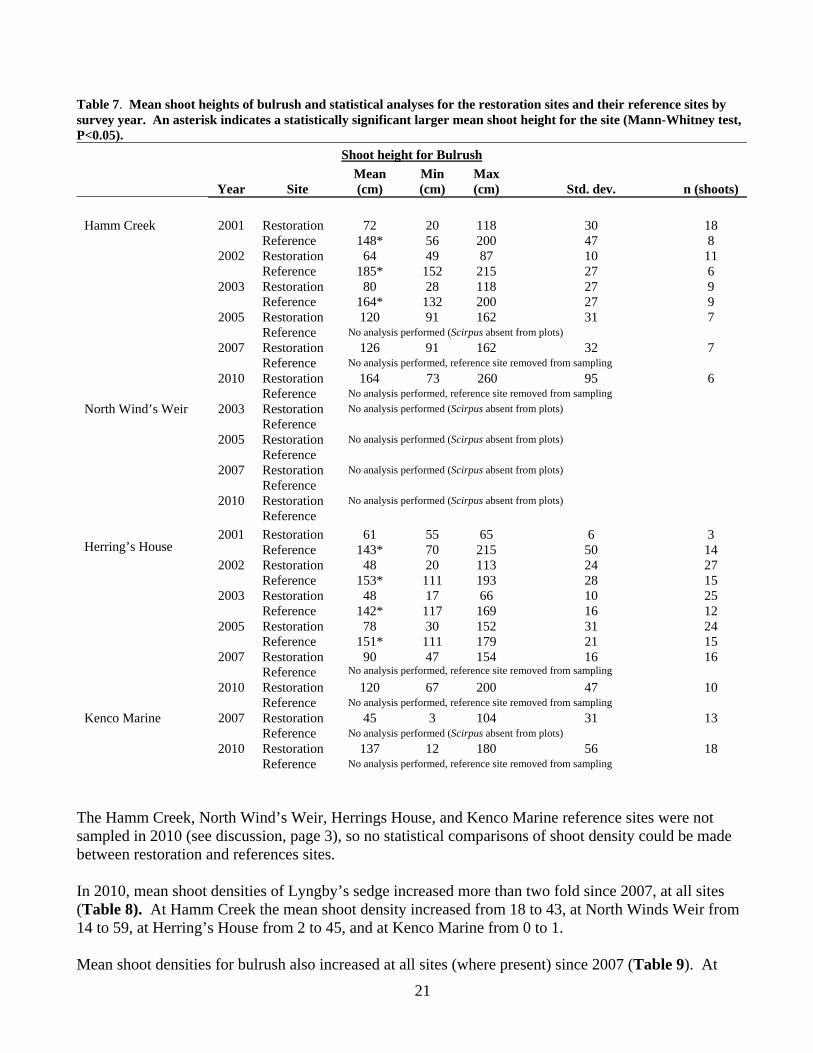
1Each site’s percent cover was estimated by averaging the percent cover values in each plot surveyed at the site. Plant Vigor (Criterion 3) The Hamm Creek, North Wind’s Weir, Herrings House, and Kenco Marine reference sites were not sampled in 2010 (see discussion, page 3), so no statistical comparisons of shoot height could be made between restoration and references sites. Mean shoot height of Lyngby’s sedge (Table 6) at the Hamm Creek restoration site increased between 2007 and 2010. There were only 6 shoots of bulrush (Table 7) in the restoration site transect plots, however mean shoot heights for bulrush have shown a consistent increase since 2002. Mean shoot height of Lyngby’s sedge has remained similar at the North Wind’s Weir site since 2007. The number of shoots is still at 50 and has remained consistent since 2007. The mean shoot height of bulrush could not be calculated due to the absence of the bulrush in transect plots. Mean shoot height of Lyngby’s sedge at the Herrings House site increased from 68 to 115 cm between 2007 and 2010. The number of shoots increased from 8 to 44. Mean shoot height of Lyngby’s sedge was higher (46cm) at the Kenco Marine restoration site in 2010 than in 2007. There were only eight shoots present in transect plots at the restoration site, an increase from four in 2007. The mean shoot height for bulrush at the Kenco Marine site increased from 45 to 137 cm between 2007 and 2010.
20
Table 6. Mean shoot heights of Lyngby’s sedge and statistical analyses for the restoration sites and their reference sites by survey year. An asterisk indicates a statistically significant larger mean shoot height for the site (Mann-Whitney test, P<0.05).
Shoot Height for Lyngby’s sedge
Year Site Mean (cm)
Min (cm)
Max (cm) Std. dev. n (shoots)
Hamm Creek 2001 Restoration 96 45 177 38 18
Reference 129* 48 190 40 30 2002 Restoration 90 26 169 40 39
Reference 143* 85 205 37 30 2003 Restoration 85 12 155 35 43
Reference 128* 65 194 36 29 2005 Restoration 110 15 180 42 58
Reference 119 49 180 40 30 2007 Restoration 79 13 156 40 57
Reference 90 16 171 50 30 2010 Restoration 100 7 196 50 41
Reference - - - - - North Wind’s Weir 2003 Restoration 57 12 119 28 28
Reference 128* 65 194 36 29 2005 Restoration 139* 44 194 34 39
Reference 119 49 180 40 30 2007 Restoration 163* 100 204 21 51
Reference 90 16 171 50 30 2010 Restoration 150 116 194 23 50
Reference - - - - - Herring’s House 2001 Restoration 26 5 50 13 29
Reference 76* 65 90 8 12 2002 Restoration No analysis performed (Carex absent from plots)
Reference 87 45 104 17 12 2003 Restoration No analysis performed (Carex absent from plots)
Reference 72 64 80 9 4 2005 Restoration No analysis performed (Carex absent from plots)
Reference 67 25 110 36 7 2007 Restoration 68 30 104 32 8
Reference No analysis performed, reference site removed from sampling 2010 Restoration 115 50 215 43 44
Reference No analysis performed, reference site removed from sampling Kenco Marine 2007 Restoration 16 9 27 8 4
Reference 90* 16 171 50 30 2010 Restoration 62 18 104 36 8
Reference - - - - -
21
Table 7. Mean shoot heights of bulrush and statistical analyses for the restoration sites and their reference sites by survey year. An asterisk indicates a statistically significant larger mean shoot height for the site (Mann-Whitney test, P<0.05).
Shoot height for Bulrush
Year Site Mean (cm)
Min (cm)
Max (cm) Std. dev. n (shoots)
Hamm Creek 2001 Restoration 72 20 118 30 18
Reference 148* 56 200 47 8 2002 Restoration 64 49 87 10 11
Reference 185* 152 215 27 6 2003 Restoration 80 28 118 27 9
Reference 164* 132 200 27 9 2005 Restoration 120 91 162 31 7
Reference No analysis performed (Scirpus absent from plots)
2007 Restoration 126 91 162 32 7 Reference No analysis performed, reference site removed from sampling
2010 Restoration 164 73 260 95 6 Reference No analysis performed, reference site removed from sampling
North Wind’s Weir 2003 Restoration No analysis performed (Scirpus absent from plots)
Reference
2005 Restoration No analysis performed (Scirpus absent from plots)
Reference
2007 Restoration No analysis performed (Scirpus absent from plots)
Reference
2010 Restoration No analysis performed (Scirpus absent from plots)
Reference
Herring’s House
2001 Restoration 61 55 65 6 3 Reference 143* 70 215 50 14
2002 Restoration 48 20 113 24 27 Reference 153* 111 193 28 15
2003 Restoration 48 17 66 10 25 Reference 142* 117 169 16 12
2005 Restoration 78 30 152 31 24 Reference 151* 111 179 21 15
2007 Restoration 90 47 154 16 16 Reference No analysis performed, reference site removed from sampling
2010 Restoration 120 67 200 47 10 Reference No analysis performed, reference site removed from sampling
Kenco Marine 2007 Restoration 45 3 104 31 13 Reference No analysis performed (Scirpus absent from plots)
2010 Restoration 137 12 180 56 18 Reference No analysis performed, reference site removed from sampling
The Hamm Creek, North Wind’s Weir, Herrings House, and Kenco Marine reference sites were not sampled in 2010 (see discussion, page 3), so no statistical comparisons of shoot density could be made between restoration and references sites. In 2010, mean shoot densities of Lyngby’s sedge increased more than two fold since 2007, at all sites (Table 8). At Hamm Creek the mean shoot density increased from 18 to 43, at North Winds Weir from 14 to 59, at Herring’s House from 2 to 45, and at Kenco Marine from 0 to 1. Mean shoot densities for bulrush also increased at all sites (where present) since 2007 (Table 9). At
22
Hamm Creek the mean shoot density increased from 0 to 4, at Herring’s House from 5 to 10, and at Kenco Marine from 1 to 4. 3 Table 8. Mean shoot densities of Lyngby’s sedge and statistical analyses for the restoration sites and their reference sites by survey year. An asterisk indicates a statistically significant larger mean shoot density at the site (Mann-Whitney test, P<0.05).
Shoot Density for Lyngby’s sedge 1 N Year Site Mean Min Max Shoots Plots Hamm Creek 2001 Restoration 5 0 39 130 24
Reference 14* 0 30 155 11
2002 Restoration 9 0 57 218 24 Reference 23* 0 42 251 11
2003 Restoration 11 0 51 267 24 Reference 26* 0 56 281 11
2005 Restoration 14 0 39 317 23 Reference 27* 0 51 298 11
2007 Restoration 18 0 58 375 21 Reference 36* 0 71 398 11
2010 Restoration 43 0 154 907 21 Reference - - - - -
North Wind’s Weir 2003 Restoration 2 0 7 38 17
Reference 26* 0 56 281 11
2005 Restoration 16 0 32 272 17 Reference 27* 0 51 298 11
2007 Restoration 14 6 26 236 17 Reference 36* 0 71 398 11
2010 Restoration 59 26 121 996 17 Reference - - - - -
Herring’s House 2001 Restoration 4 0 19 70 20
Reference 6 0 17 57 10
2002 Restoration 0 0 0 0 20 Reference 6* 0 51 61 10
2003 Restoration 0 0 0 0 20 Reference 1 0 11 12 10
2005 Restoration 0 0 0 0 20 Reference 3 0 22 28 10
2007 Restoration 2 0 39 44 19 Reference Reference site not sampled due to enhancement actions
2010 Restoration 45 0 224 897 20 Reference - - - - -
Kenco Marine 2007 Restoration 0 0 2 4 19 Reference 36 0 71 398 11
2010 Restoration 1 0 11 24 19 Reference - - - - -
1Number of shoots/0.25m2
3 In our 2007 report, median shoot density for 2007 data was reported; whereas in this report, and in reports previous to 2007, mean shoot density is reported. As a result all numbers have been revised for the Lyngby’s sedge shoot density data for 2007. The mean shoot density for 2007 bulrush data was correctly given for everything but Kenco Marine (median=0, mean=1), although mislabeled as median shoot density. No other revisions needed to occur for either Bulrush or Lyngby’s sedge information previous to 2007.
23
Table 9. Mean shoot densities of bulrush and statistical analyses for the restoration sites and their reference sites by survey year. An asterisk indicates a statistically significant larger mean shoot density at the site (Mann-Whitney test, P<0.05).
Shoot Density for Bulrush 1 N
Year Site Mean Min Max Shoots Plots Hamm Creek 2001 Restoration 1 0 10 28 24
Reference 2 0 18 23 11
2002 Restoration 1 0 11 29 24 Reference 2 0 15 27 11
2003 Restoration 2 0 30 51 24 Reference 5 0 19 39 11
2005 Restoration 2 0 40 45 23 Reference 0 0 0 0 11
2007 Restoration 0 0 1 1 21 Reference 0 0 0 0 11
2010 Restoration 4 0 33 76 21 Reference - - - - -
North Wind’s Weir 2003 Restoration 0 0 0 0 17 Reference 5 0 19 39 11
2005 Restoration 0 0 0 0 17 Reference 0 0 0 0 11
2007 Restoration 0 0 0 0 17 Reference 0 0 0 0 11
2010 Restoration 0 0 0 0 17 Reference - - - - -
Herring’s House 2001 Restoration 0.4 0 7 7 20 Reference 6* 0 17 56 10
2002 Restoration 4 0 25 70 20 Reference 5 0 12 46 10
2003 Restoration 3 0 22 52 20 Reference 5 0 20 52 10
2005 Restoration 6 0 29 113 20 Reference 10 0 25 97 10
2007 Restoration 5 0 32 90 19 Reference Reference site not sampled due to enhancement actions
2010 Restoration 10 0 95 194 20
Reference - - - - - Kenco Marine
2007 Restoration 1 0 6 20 19 Reference 0 0 0 0 11
2010 Restoration 4 0 28 78 19 Reference - - - - -
1Number of shoots/0.25m2
24
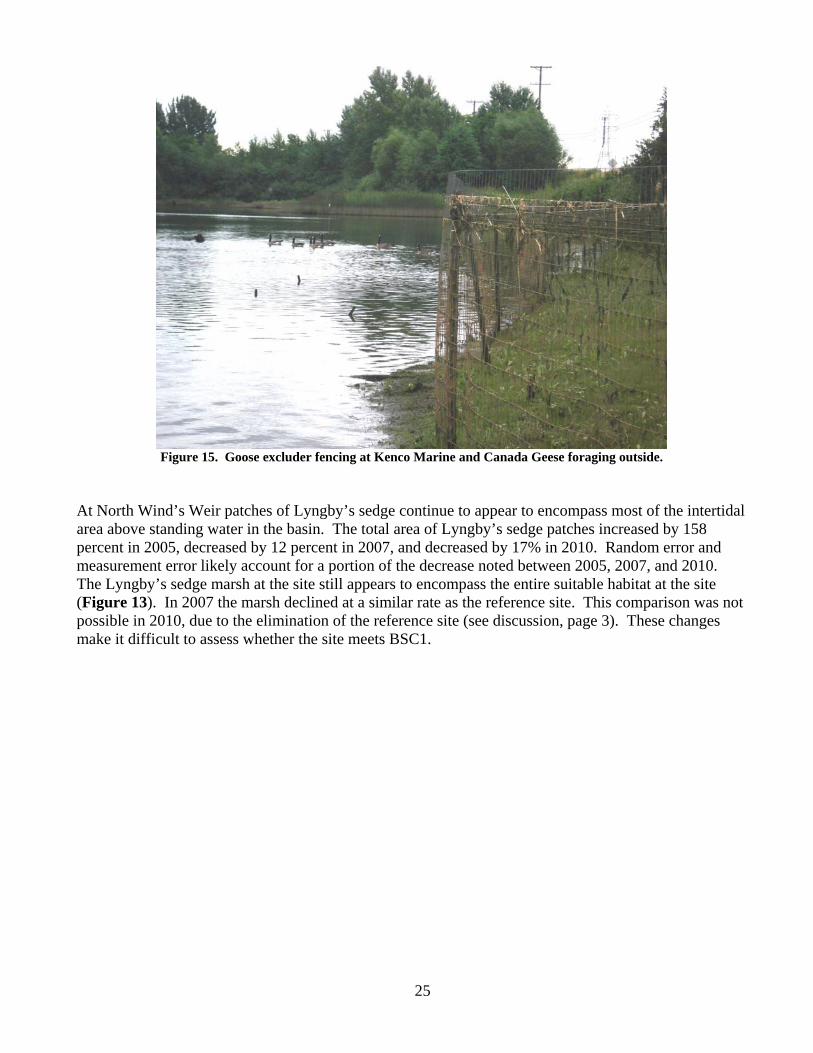
Discussion Areal Extent (Criterion 1) The areal extent of marsh vegetation at Kenco Marine restoration site was 0.06 acre. This marsh was initially planted in 2006 and re-planted in the spring of 2007. It was noted during monitoring that the goose excluder fences were not completely successful. Waterfowl were observed swimming over the outer fence at high tide and foraging within the restoration site. During site reconnaissance in March 2010, the goose exclusion was in total disrepair; however in July 2011 it had been repaired and was noted to be effective (Figure 15). The total area of marsh vegetation patches (Lyngby’s sedge and bulrush) was measured for the restoration sites (Table 3). Additionally, the same data observers were used in 2003 and 2005, but new observers collected the data in 2007 and 2010. The measurement technique using a measuring tape can be subjective from one observer to another. Vegetation patches are typically not square or rectangular in shape; therefore, a large amount of estimation occurs with this sampling technique. As a result, differences in values recorded between years may be attributable to differences in observation and estimation. In the 2007 report it was noted that at the reference site for Hamm Creek, North Wind’s Weir, and Kenco Marine, the area for the target species, Lyngby’s sedge and bulrush, had steadily declined each year. Possible causes of this steady decline were suggested to include: the erosion of soils, an increase in invasive species and public use, and random and measurement errors. The total area of Lyngby’s sedge and bulrush patches at the Hamm Creek restoration site decreased by 37 m2 (4%) in 2003, increased by 24 m2 (2%) in 2005, decreased by 278 m2 (27%) in 2007, and decreased by 151 m2 in 2010. The greater decrease noted in 2007 was suggested to have been partially due to physical changes to the site. Hamm Creek rerouted through the freshwater marsh and broke though the berm that previously separated the freshwater and saltwater marshes. Some marsh was lost when this occurred. In 2010, there was evidence of erosion along the shoreline. The measurement technique utilizing estimation and differences in estimation may account for some of the difference noted in patch areas. The observed shoreline erosion may also account for some of the decrease in patch areas. From these observed changes, the Hamm Creek restoration site still no longer meets Biological Success Criterion 1.
25
Figure 15. Goose excluder fencing at Kenco Marine and Canada Geese foraging outside.
At North Wind’s Weir patches of Lyngby’s sedge continue to appear to encompass most of the intertidal area above standing water in the basin. The total area of Lyngby’s sedge patches increased by 158 percent in 2005, decreased by 12 percent in 2007, and decreased by 17% in 2010. Random error and measurement error likely account for a portion of the decrease noted between 2005, 2007, and 2010. The Lyngby’s sedge marsh at the site still appears to encompass the entire suitable habitat at the site (Figure 13). In 2007 the marsh declined at a similar rate as the reference site. This comparison was not possible in 2010, due to the elimination of the reference site (see discussion, page 3). These changes make it difficult to assess whether the site meets BSC1.
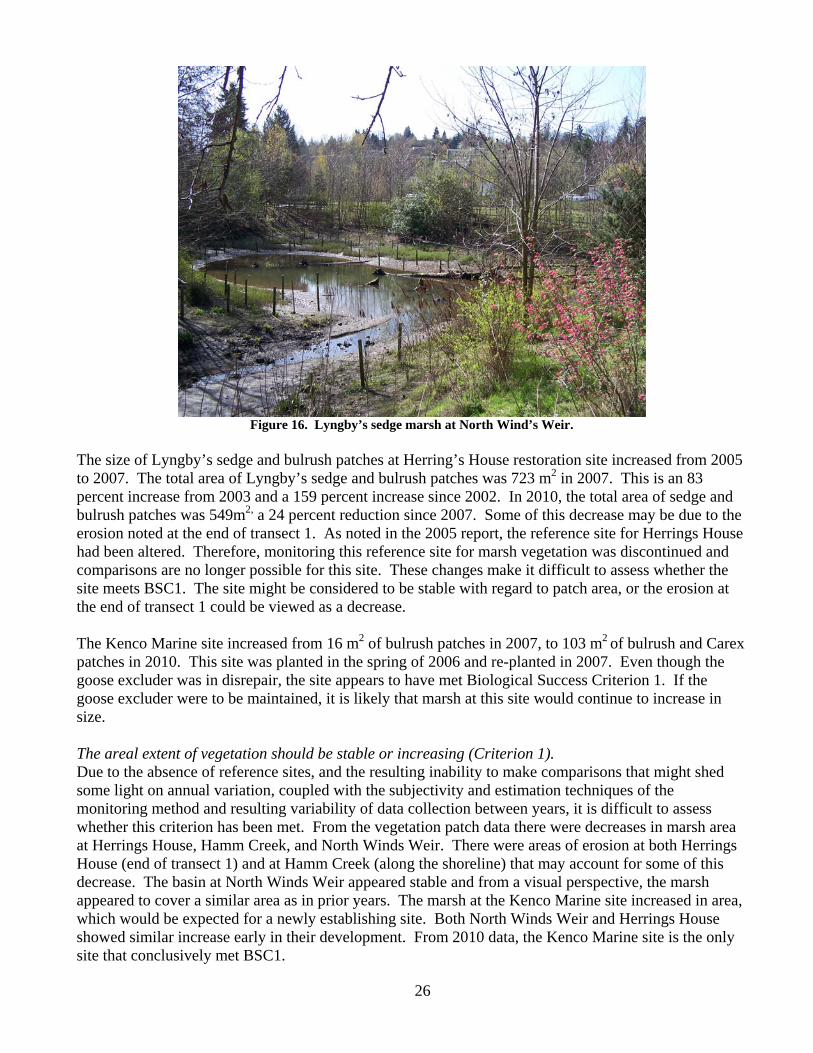
26
Figure 16. Lyngby’s sedge marsh at North Wind’s Weir.
The size of Lyngby’s sedge and bulrush patches at Herring’s House restoration site increased from 2005 to 2007. The total area of Lyngby’s sedge and bulrush patches was 723 m2 in 2007. This is an 83 percent increase from 2003 and a 159 percent increase since 2002. In 2010, the total area of sedge and bulrush patches was 549m2, a 24 percent reduction since 2007. Some of this decrease may be due to the erosion noted at the end of transect 1. As noted in the 2005 report, the reference site for Herrings House had been altered. Therefore, monitoring this reference site for marsh vegetation was discontinued and comparisons are no longer possible for this site. These changes make it difficult to assess whether the site meets BSC1. The site might be considered to be stable with regard to patch area, or the erosion at the end of transect 1 could be viewed as a decrease. The Kenco Marine site increased from 16 m2 of bulrush patches in 2007, to 103 m2 of bulrush and Carex patches in 2010. This site was planted in the spring of 2006 and re-planted in 2007. Even though the goose excluder was in disrepair, the site appears to have met Biological Success Criterion 1. If the goose excluder were to be maintained, it is likely that marsh at this site would continue to increase in size. The areal extent of vegetation should be stable or increasing (Criterion 1). Due to the absence of reference sites, and the resulting inability to make comparisons that might shed some light on annual variation, coupled with the subjectivity and estimation techniques of the monitoring method and resulting variability of data collection between years, it is difficult to assess whether this criterion has been met. From the vegetation patch data there were decreases in marsh area at Herrings House, Hamm Creek, and North Winds Weir. There were areas of erosion at both Herrings House (end of transect 1) and at Hamm Creek (along the shoreline) that may account for some of this decrease. The basin at North Winds Weir appeared stable and from a visual perspective, the marsh appeared to cover a similar area as in prior years. The marsh at the Kenco Marine site increased in area, which would be expected for a newly establishing site. Both North Winds Weir and Herrings House showed similar increase early in their development. From 2010 data, the Kenco Marine site is the only site that conclusively met BSC1.
27
Species Composition (Criterion 2) - species composition of native wetland plants should be comparable to appropriate reference sites (Criterion 2) In the absence of reference sites, it is no longer possible to determine whether or not this criterion has been met. While there have been changes in species composition at the sites, it is impossible to determine if these changes are site specific, or if they are due to landscape scale environmental effects. The number of species present at each of the sites has remained fairly stable over time. Kenco Marine likely has a larger number of species due to the location of one of the transects slightly higher in the tidal zone and due to its earlier stage in development (more recent construction). For example, Hamm Creek also had a greater number of species when first constructed. The percent cover of non-target (non-target natives, non-native, and invasive) species increased at all sites in 2010. At Herrings House the increase was minimal. At Kenco it was due to the presence of a number of higher elevation native marsh species, Potentilla anserina ( Pacific silverweed), Distichlis spicata (saltgrass), Aster subspicatus (Douglas aster) and high cover of Lilaeopsis occidentalis in the lower intertidal. At Hamm Creek the increase was due to a higher percent cover of silverweed along transects 1 and 2, and a higher percent cover of Lilaeopsis along transect 3. At NWW it was due to high percent cover in the understory of Glaux maritima. As these are all native species, their increase in cover would be considered neither positive nor negative. In most cases these are diminutive plants (Glaux, Lilaeopsis) found growing underneath the target vegetation. The percent cover of target species decreased at the Hamm Creek site. This is at least partially attributable to erosion occurring along the shoreline transects. The percent cover of target species also decreased at the North Winds Weir site. In 2007 the increase reported from 2005 to 2007 exceeded the reference site percent cover. The discussion provided in the 2007 report included: The increase in percent cover for target species at the North Wind’s Weir site may have been partially attributed to site conditions. In six of the transect plots the Lyngby’s sedge had already fallen over, beginning the decomposition process. This may have influenced the ability to accurately assess percent cover for the target species Lyngby’s sedge. If the data collected in 2007 were considered compromised, the percent cover of target species at North Winds Weir is very similar in 2005 (62) and 2010 (69) and might be considered a more accurate assessment of what appears to be a stable marsh at the site. The percent cover of target species increased at the Herrings House site. This may be partially due to the vandalism of the start point of transect one. While it was possible to relocate the correct distance back from the turning point to the starting point of the transect, it was not possible to relocate the correct starting location in relation to tidal elevation. Changes in percent cover may also be partially due to the same site conditions as were noted at North Winds Weir in 2007. In three of the transect plots, the Lyngby’s sedge and the Scirpus were noted as having fallen over. These two elements may partially account for the noted increase in target species at the Herrings House site.
28
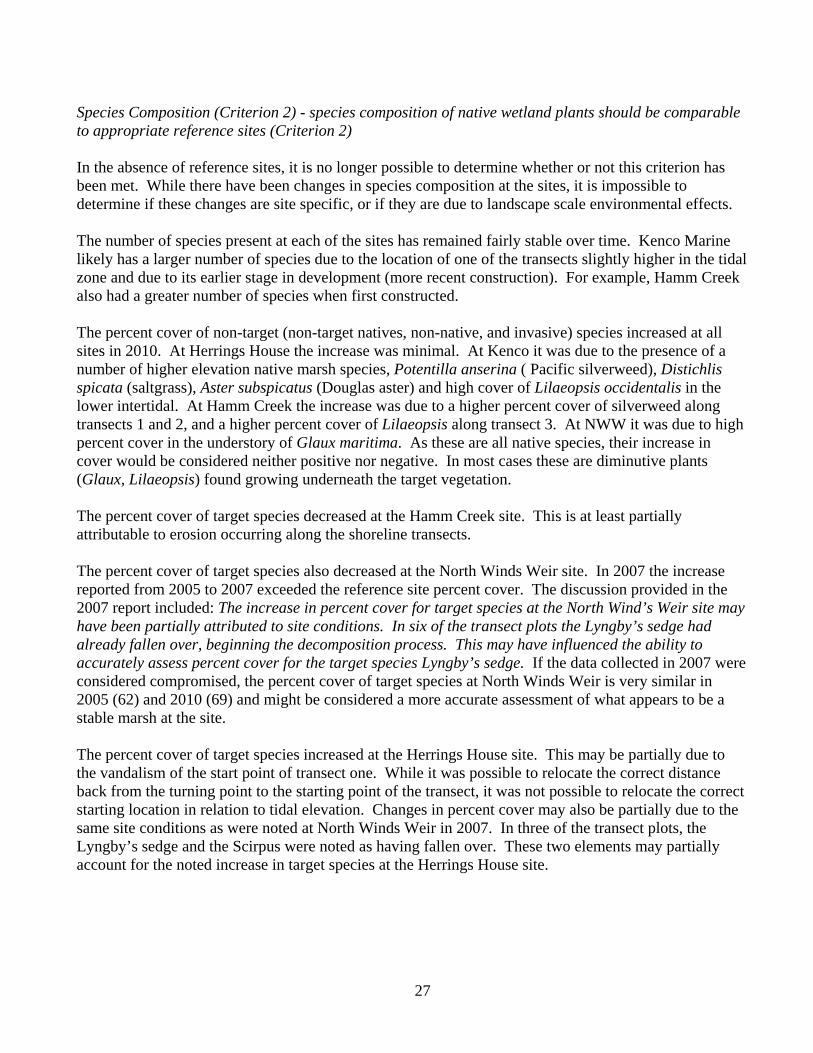
Figure 17. Marsh plantings and goose excluder fencing at Herring’s House reference site looking south from
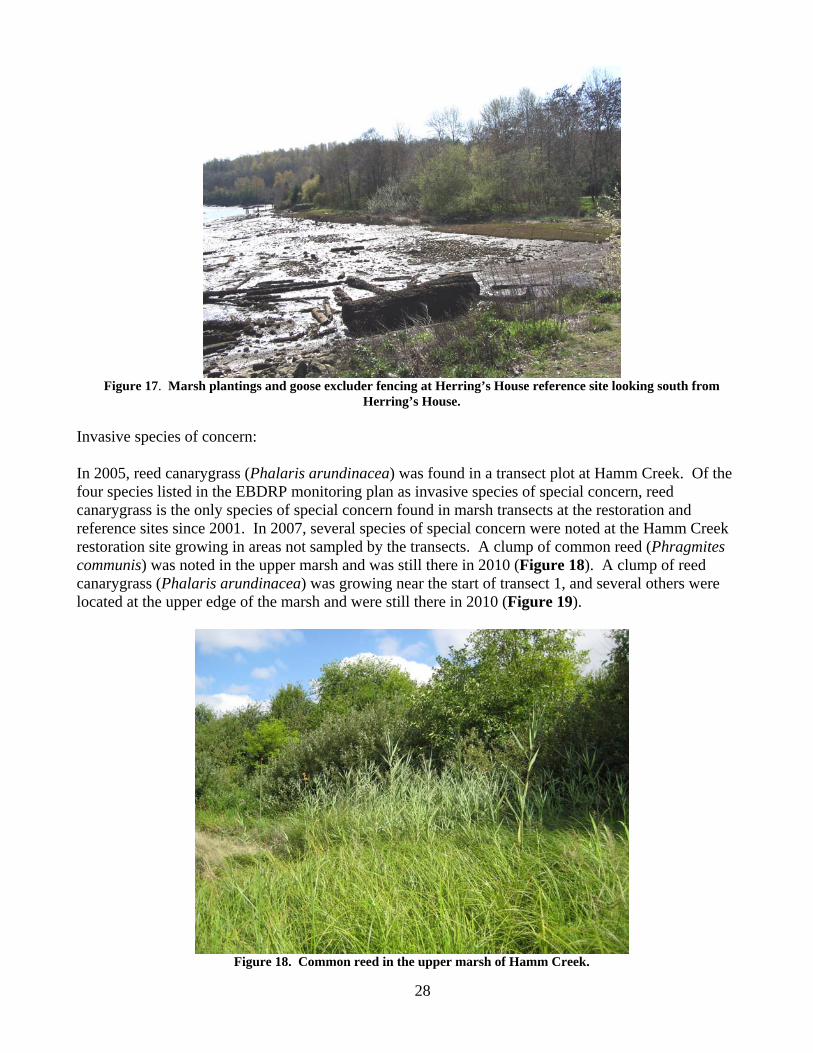
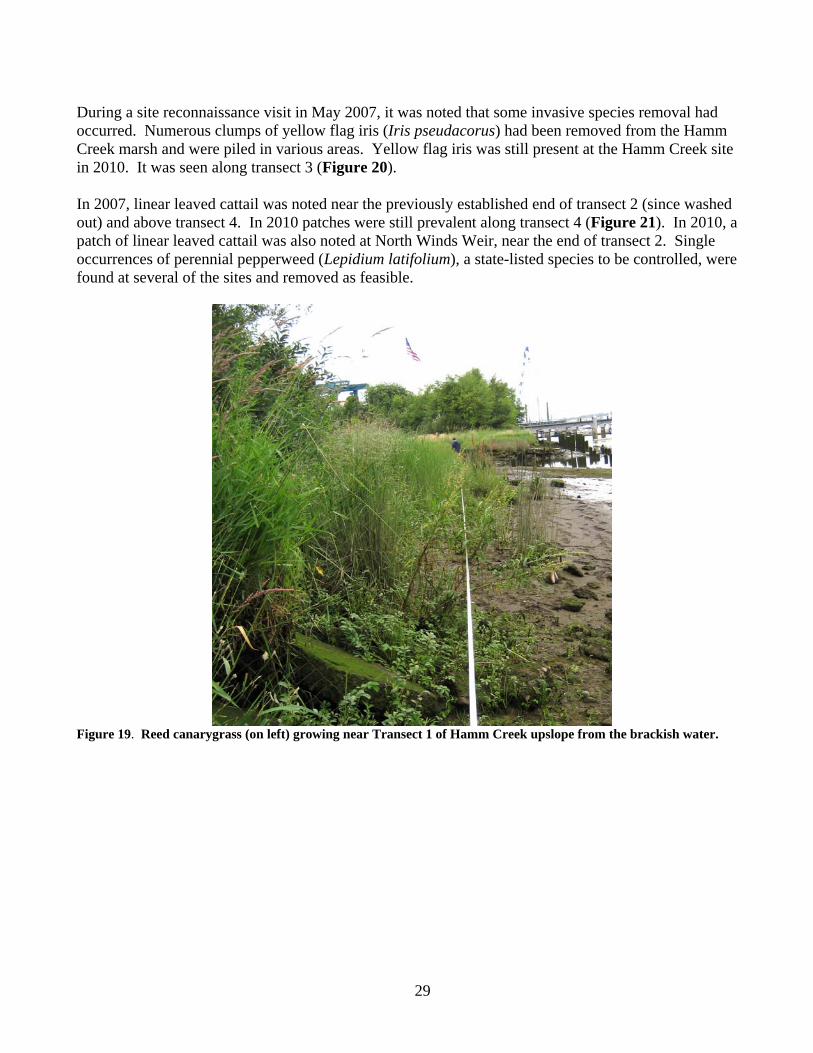
Herring’s House. Invasive species of concern: In 2005, reed canarygrass (Phalaris arundinacea) was found in a transect plot at Hamm Creek. Of the four species listed in the EBDRP monitoring plan as invasive species of special concern, reed canarygrass is the only species of special concern found in marsh transects at the restoration and reference sites since 2001. In 2007, several species of special concern were noted at the Hamm Creek restoration site growing in areas not sampled by the transects. A clump of common reed (Phragmites communis) was noted in the upper marsh and was still there in 2010 (Figure 18). A clump of reed canarygrass (Phalaris arundinacea) was growing near the start of transect 1, and several others were located at the upper edge of the marsh and were still there in 2010 (Figure 19).
Figure 18. Common reed in the upper marsh of Hamm Creek.
29
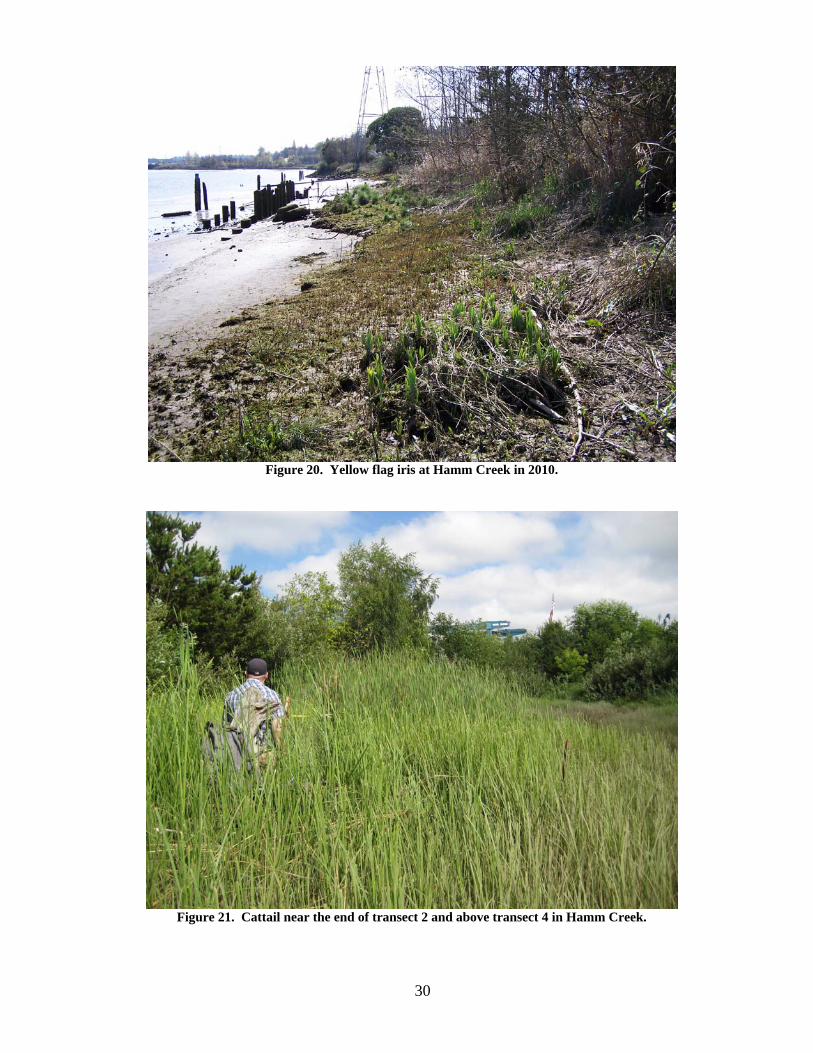
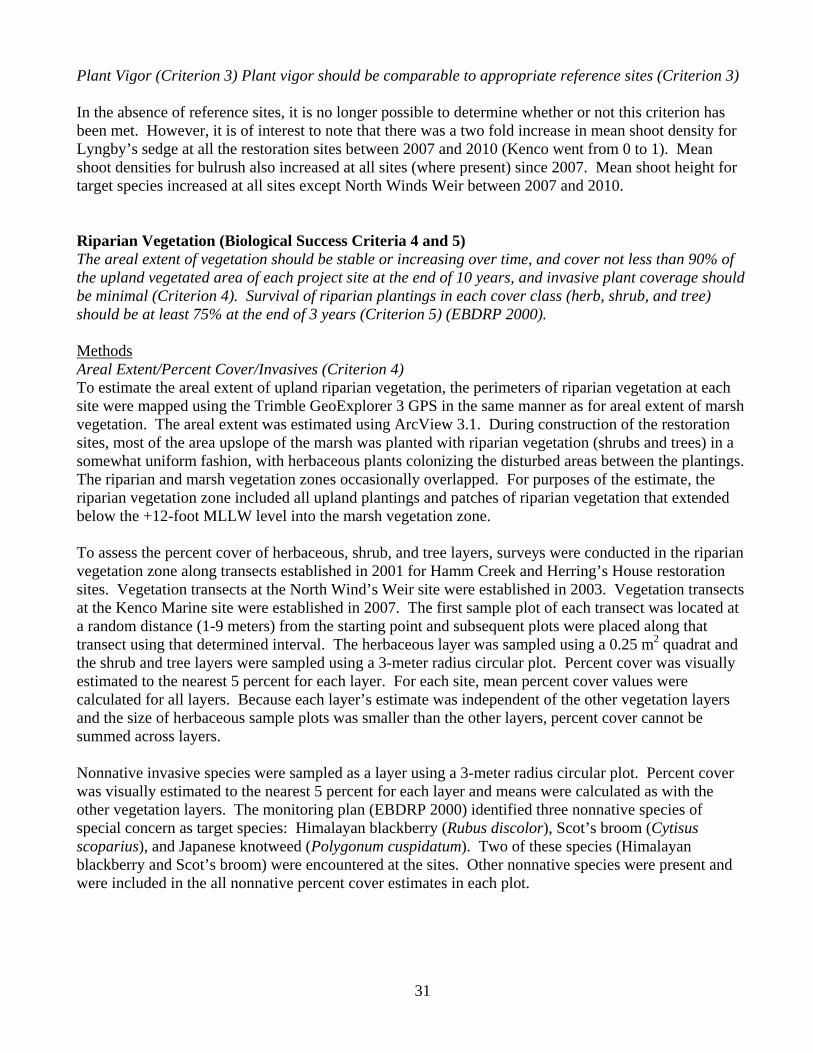
During a site reconnaissance visit in May 2007, it was noted that some invasive species removal had occurred. Numerous clumps of yellow flag iris (Iris pseudacorus) had been removed from the Hamm Creek marsh and were piled in various areas. Yellow flag iris was still present at the Hamm Creek site in 2010. It was seen along transect 3 (Figure 20). In 2007, linear leaved cattail was noted near the previously established end of transect 2 (since washed out) and above transect 4. In 2010 patches were still prevalent along transect 4 (Figure 21). In 2010, a patch of linear leaved cattail was also noted at North Winds Weir, near the end of transect 2. Single occurrences of perennial pepperweed (Lepidium latifolium), a state-listed species to be controlled, were found at several of the sites and removed as feasible.
Figure 19. Reed canarygrass (on left) growing near Transect 1 of Hamm Creek upslope from the brackish water.
30
Figure 20. Yellow flag iris at Hamm Creek in 2010.
Figure 21. Cattail near the end of transect 2 and above transect 4 in Hamm Creek.
31
Plant Vigor (Criterion 3) Plant vigor should be comparable to appropriate reference sites (Criterion 3) In the absence of reference sites, it is no longer possible to determine whether or not this criterion has been met. However, it is of interest to note that there was a two fold increase in mean shoot density for Lyngby’s sedge at all the restoration sites between 2007 and 2010 (Kenco went from 0 to 1). Mean shoot densities for bulrush also increased at all sites (where present) since 2007. Mean shoot height for target species increased at all sites except North Winds Weir between 2007 and 2010. Riparian Vegetation (Biological Success Criteria 4 and 5) The areal extent of vegetation should be stable or increasing over time, and cover not less than 90% of the upland vegetated area of each project site at the end of 10 years, and invasive plant coverage should be minimal (Criterion 4). Survival of riparian plantings in each cover class (herb, shrub, and tree) should be at least 75% at the end of 3 years (Criterion 5) (EBDRP 2000). Methods Areal Extent/Percent Cover/Invasives (Criterion 4) To estimate the areal extent of upland riparian vegetation, the perimeters of riparian vegetation at each site were mapped using the Trimble GeoExplorer 3 GPS in the same manner as for areal extent of marsh vegetation. The areal extent was estimated using ArcView 3.1. During construction of the restoration sites, most of the area upslope of the marsh was planted with riparian vegetation (shrubs and trees) in a somewhat uniform fashion, with herbaceous plants colonizing the disturbed areas between the plantings. The riparian and marsh vegetation zones occasionally overlapped. For purposes of the estimate, the riparian vegetation zone included all upland plantings and patches of riparian vegetation that extended below the +12-foot MLLW level into the marsh vegetation zone. To assess the percent cover of herbaceous, shrub, and tree layers, surveys were conducted in the riparian vegetation zone along transects established in 2001 for Hamm Creek and Herring’s House restoration sites. Vegetation transects at the North Wind’s Weir site were established in 2003. Vegetation transects at the Kenco Marine site were established in 2007. The first sample plot of each transect was located at a random distance (1-9 meters) from the starting point and subsequent plots were placed along that transect using that determined interval. The herbaceous layer was sampled using a 0.25 m2 quadrat and the shrub and tree layers were sampled using a 3-meter radius circular plot. Percent cover was visually estimated to the nearest 5 percent for each layer. For each site, mean percent cover values were calculated for all layers. Because each layer’s estimate was independent of the other vegetation layers and the size of herbaceous sample plots was smaller than the other layers, percent cover cannot be summed across layers. Nonnative invasive species were sampled as a layer using a 3-meter radius circular plot. Percent cover was visually estimated to the nearest 5 percent for each layer and means were calculated as with the other vegetation layers. The monitoring plan (EBDRP 2000) identified three nonnative species of special concern as target species: Himalayan blackberry (Rubus discolor), Scot’s broom (Cytisus scoparius), and Japanese knotweed (Polygonum cuspidatum). Two of these species (Himalayan blackberry and Scot’s broom) were encountered at the sites. Other nonnative species were present and were included in the all nonnative percent cover estimates in each plot.
32
Survival (Criterion 5) Survival of shrubs and trees at Kenco Marine was determined by comparing the number of dead individuals to the total number of individuals (shrubs and trees) in the percent cover survey plots at each site. The monitoring plan (EBDRP 2000) calls for collecting shrub and tree survival data in years 1 to 3; therefore, survival data was not collected for Hamm Creek, Herring’s House, and North Wind’s Weir after 2003. However, Kenco Marine, being a relatively new site planted in 2006 and re-planted in 2007, was to be considered for collection of these data. This information was not tallied in 2010 and was collected in 2011. Results Areal Extent/Percent Cover/Invasives (Criterion 4) The total areal extent of riparian vegetation at each restoration site was estimated and is provided in Table 10. The areal extent of riparian vegetation increased at all four restoration sites when compared to 2007 and Mean data. Because of routine maintenance and invasive and nonnative species control at the restoration sites, interpretation of vegetation coverage data must be considered carefully. Other entities (e.g., King County Parks, Seattle City Parks, and People for Puget Sound) have spent much effort controlling nonnative plants, removing dead trees and shrubs, and planting new vegetation in the riparian areas. These actions are beneficial and necessary to the long-term health of the site. However, it is important to consider these actions when interpreting our results. The results show the status of the restoration sites at a single point in time and are not a measure of natural succession over time. Table 10. Estimates of riparian areal extent at restoration sites by survey year.
Riparian areal extent in m2 (acres)
Site Name
2001 2002 2003 2005 2007
2011
Mean Hamm Creek
2,104 (0.5)
2,648 (0.7)
3,049 (0.8)
3,237 (0.8)
2,478 (0.6)
3,260 (0.8)
2,796 (0.7)
North Wind’s Weir
- - 1,285 (0.3)
1,261 (0.3)
1,176 (0.3)
1,383 (0.3)
1,276 (0.3)
Herring’s House
9,598 (2.4)
8,706 (2.2)
9,705 (2.4)
8,912 (2.2)
8,685 (2.2)
10,056 (2.5)
9,277 (2.3)
Kenco Marine
- - - -
854
(0.2)
920 (0.2)
887 (0.2)
At Hamm Creek, percent cover decreased for two layers (herbaceous and shrub) and increased for one layer (tree) from 2007 to 2010. At North Wind’s Weir, percent cover increased at the herbaceous layer but decreased at the shrub and tree layers. At Herring’s House, percent cover increased at the shrub layer but decreased at the herbaceous and tree layers. At Kenco Marine, percent cover decreased at the herbaceous layer but increased at the shrub and tree layers. Riparian vegetation species observed at Hamm Creek, North Wind’s Weir, and Herring’s House restoration sites from 2001 to 2005 are included in Appendix 3. Himalayan blackberry and Scot’s broom were observed in the transect plots and are two of the three nonnative invasive plant species designated as target species. To date, none of the known knotweed
33
species has been observed at any of the restoration sites. Other nonnative plant species were also observed in the transect plots. The percent cover of target species was estimated separately and also combined with other non-target species for an estimate of all nonnative species in each plot. Percent cover of the non-native target species more than doubled at Hamm Creek, increased by about 166 percent at North Wind’s Weir, increased by about 160 percent at Herring’s House, and remained the same at Kenco Marine. The percent cover for all nonnatives increased at Hamm Creek and Herring’s House and decreased at North Wind’s Weir and Kenco Marine (Table 11). Table 11. Independent estimates of percent cover for herbaceous, shrub, tree, and nonnative riparian vegetation layers at restoration sites by survey year.
Percent Cover of Riparian Vegetation Layers Nonnative
Site Year Herbaceous (0.25m2 quadrat)
Shrub (3m radius plot)
Tree (3m radius plot)
Target spp (3m radius plot)
All species (3m radius plot)
Hamm Creek 2001 28 7 11 1.5 4
2002 71 15 25 6 18 2003 76 8 30 5 21 2005 63 20 26 5 14 2007 71 85 47 10 12 2010 26 44 48 22 24
North Wind’s Weir 2003 36 30 38 3 21
2005 55 14 78 2 16 2007 36 35 73 3 8 2010 60 33 52 5 5
Herring’s House 2001 44 27 26 2 5
2002 50 16 35 4 17 2003 56 16 57 3 18 2005 51 11 35 8 17 2007 75 7 54 5 6 2010 22 15 38 8 10
Kenco Marine 2007 82 7 19
2 7
2010 8 20 86 2 4 Survival (Criterion 5) At Kenco Marine survival was high (81 and 88%) for both shrub and tree layers. Table 12. Survival of riparian vegetation shrubs and trees at Kenco Marine restoration site in 2007 and 2011.
# Plants # Dead %
Survival
Site Name Layer 2007 2010 2007 2010 2007 2010 Kenco Marine
Shrub 77 62 - 15 - 81%
Kenco Marine
Tree 147 130 - 17 - 88%
34
Discussion Areal Extent/Percent Cover/Invasives (Criterion 4) As previously noted, the areal extent of riparian vegetation increased at all restoration sites. Areal extent of riparian vegetation is expected to continue fluctuating over time as riparian and marsh vegetation becomes more interwoven. Vegetation coverage goals for Year 10 are given in the monitoring plan (EBDRP 2000). The herbaceous layer goal is for greater than 70 percent for year 3 and not more than 10 percent bare ground after year 5. The shrub layer is expected to be greater than 30 percent by year 3, 50 percent by year 5, and 70 percent by year 10. The projected goal for the tree layer is 25 percent by year 3, 40 percent by Year 5, and 70 percent coverage by Year 10. All restoration sites, except Herring’s House have less than 10 percent bare ground in the herbaceous layer. However, Kenco Marine has less than 70 percent cover of the herbaceous layer and does not meet the criterion this year (although this is only because the site is transitioning quicker than predicted to tree coverage). The shrub layers at all sites do not meet the Biological Success Criterion 4. The percent cover of trees at Hamm Creek (48%) and Herring’s House (38%) do not meet Biological Success Criterion 4 for year 10. North Wind’s Weir (52%) is above the 40 percent coverage for year 5 and meets Biological Success Criterion 4. Kenco Marine (86%) is substantially above the 25 percent coverage for year 5 and meets Biological Success Criterion 4. At NWW, the data also may be influenced by the loss of a third transect in 2010. In previous years this transects had higher coverage of trees and lower coverage of herbaceous vegetation. Nonetheless, based on the difference between 2007 and 2010, it is unlikely that NWW would have met Criterion 4 for Herbaceous or Shrub layers. Two of the three nonnative invasive species identified as target species, Himalayan blackberry and Scot’s broom, were present at the sites. The percent coverage of these target species at the sites ranged from 2 to 22 percent. Many other nonnative species are also present at the sites. When all nonnative species in the surveys are included, the estimated percent cover of nonnative species at the restoration sites ranges between 4 and 24 percent. This is probably due to the important and extensive work done by other entities to remove nonnative and invasive species at the sites. The extensive work to control nonnative species provides evidence that continued maintenance of the sites is important to preserve and provide the best habitat possible. All restoration sites, excluding the Hamm Creek site (22 percent), meet the Biological Success Criterion 4 goal of less than 20 percent nonnative species by Year 10. Survival (Criterion 5) At the Kenco Marine restoration site, the survival of riparian plantings in each cover class category (shrubs and trees) met the Biological Success Criterion 5 of at least 75% survival at the end of 3 years. The survival of trees and shrubs at the Kenco Marine site was high as estimated from transect plots. Although the monitoring plan (EBDRP 2000) calls for collecting shrub and tree survival data in years 1 to 3, survival data for Kenco Marine was collected in 2011, during year five. During the 2010 field data collection (year four), the coverage for plantings was only collected and survival data were not. As a result this information was instead collected in 2011. Indications from riparian data collections were that very little visually changed in riparian survival between 2010 and 2011 besides vegetation removal from beavers.
35
Bird Use (Biological Success Criterion 6) Use of the restoration sites and the area within 50 meters of the site by indigenous/native bird species should be comparable to that of the appropriate reference sites (EBDRP 2000). With the approval of the EBDRP Panel, none of the sites were monitored for bird use starting in 2007. However, from the data collected in previous years, the number of bird species observed at the restoration sites appeared to be more comparable to numbers seen at the reference sites with each successive year. Therefore, the restoration sites meet Biological Success Criterion 6. Fish Presence/Access (Biological Success Criterion 7) Estuarine fishes will access the project sites. Juvenile salmonid presence within the project sites should be comparable to that of appropriate reference sites at the end of ten years (EBDRP 2000). With the approval of the EBDRP Panel, none of the sites were monitored for fish presence/access starting in 2007. The capture of salmonids and non-salmonids in all years indicates that the restoration sites are accessible to these fishes and juvenile salmonid presence is comparable to the appropriate reference sites. Therefore, the restoration sites meet Biological Success Criterion 7. Invertebrate Prey Resource Production (Biological Success Criteria 8) Production of invertebrate prey taxa known to be important to juvenile salmonids should be comparable to that of appropriate reference sites at the end of ten years (EBDRP 2000). Background This part of the monitoring project is part of an ongoing research effort to understand how invertebrate prey resources colonize and use restored wetland habitats in the Duwamish River estuary. In collaboration with the USFWS and the EBDRP, researchers at the University of Washington have monitored invertebrate populations at the restoration sites three times since their construction. The Kenco Marine site was added in 2007 totaling 4 restoration sites and 2 reference sites on the Duwamish to be sampled once per month from April through June. Specific tasks performed were as follows: (1) deploy and collect five fallout insect traps (tubs and platforms) in the estuary at each restoration site and respective reference site; (2) collect core samples in the estuaries at all restoration sites and their respective reference sites; and (3) identify invertebrates from the samples. Taxa known to be important to juvenile salmonids are identified to species and enumerated with the remainder identified to order level. Methods Sampling for fallout insects from riparian areas and benthic invertebrates from intertidal areas, collectively described as invertebrate prey resources produced, was conducted using the protocols described by Cordell et al. (1994, 1999). Invertebrate sampling occurred once a month in March, April, May, and June. Two types of invertebrate samples were collected: (1) fallout insect traps for terrestrial insects, and (2) core samples for aquatic invertebrates. The numbers of traps deployed varied by site and habitat strata present at each site. Fallout insects were sampled using floating plastic tubs distributed throughout a project site and left out for four days (e.g. placed on Monday, retrieved on Thursday). Benthic invertebrates were sampled with
36
cores taken to a depth of 10 cm with a minimum of 10 replicates in each stratum; including areas of mud, sand flats and areas of marsh vegetation. At the Hamm Creek restoration and reference sites, monthly invertebrate sampling included placement of five fallout insect traps in the restoration site and five in the reference site. Ten core samples for macroinvertebrates were taken in the intertidal area at the site, but the samples were not stratified in vegetated and unvegetated areas. At the Hamm Creek site, the creek runs through the lower intertidal area, significantly affecting the estuarine invertebrate community of the mudflat. With the freshwater creek flowing over this area during low tide, the invertebrate community is substantially different from the brackish community of the reference area. For this reason, no samples were taken in the mudflat stratum of Hamm Creek restoration and reference sites. At the Herring’s House and North Wind’s Weir restoration and reference sites, five fallout insect traps were placed in the estuary at each site. In addition to the fallout insect traps, 10 invertebrate core samples were taken from each of the following habitats: (1) macrofauna in the vegetated region of the higher intertidal zone, (2) macrofauna in the mudflat area of the lower intertidal zone, and (3) meiofauna in the mudflat area of the lower intertidal zone. Results The 2010 monthly invertebrate sampling and analysis report by Jeff Cordell of the University of Washington School of Aquatic and Fisheries Sciences is expected to be available by March of 2012.
37
SUMMARY The status of restoration sites in meeting the Physical and Biological Success Criteria are summarized by criterion and the status by survey year is shown in Table 13 and Table 14. The monitoring plan, EBDRP (2000), allows for adaptive management of monitoring at the sites as outlined in the following statements: “Elimination of Monitoring Tasks. It is possible that in the future, the Elliott Bay / Duwamish Restoration Program Panel might reach consensus that specific success criteria have been met, and that associated monitoring tasks could cease. Similarly, it could be determined that a monitoring task was not returning useful information, and therefore not worth the expense of continuation.” Monitoring tasks and results were evaluated based on these statements and options are given for adapting monitoring activities to reflect the current status of the sites. PHYSICAL CHARACTERISTICS Intertidal Area (Physical Success Criterion 1) Total restored area between an elevation of +12.0 ft. Mean Low Low Water (MLLW) and -2.0 ft. MLLW will be at least 90% of the target intertidal elevation for each site. Target intertidal area for the Hamm Creek is 4,047 m2 (1.0 acre), Herring’s House is 8,094 m2 (2.0 acres), and North Wind’s Weir is 4,047 m2 (1.0 acre) (EBDRP 2000). With the approval of the EBDRP Panel, the Hamm Creek and Herring’s House restoration sites were not monitored for intertidal area in 2007. Previously collected data indicated that these sites have been stable since construction (USFWS 2006). Previously collected data also indicated that the North Winds Weir site was stable. This site was monitored in 2007 and again in 2010 so there were consistent years of data for the sites. Baseline data was collected for the Kenco Marine site in 2007. Since construction of the restoration sites, intertidal area estimates varied by ± 0.1 acre indicating the restoration sites have remained stable over time. Herring’s House exceeds the target intertidal area. Hamm Creek and North Wind’s Weir do not meet the target intertidal area of Physical Criterion 1 because they were not constructed as planned but have remained stable over time. Tidal Regime (Physical Success Criterion 2) Tidal amplitude, as determined by both timing and elevation of high and low tide events, is equivalent inside and outside of the project area (EBDRP 2000). With the approval of the EBDRP Panel, monitoring for tidal regime was discontinued in 2007 and therefore not collected in 2010. Previously collected data indicate that tidal exchange between the restoration sites and Duwamish River estuary was unimpeded (USFWS 2004). Slope Erosion (Physical Success Criterion 3) No evidence of erosion that threatens property, infrastructure, or is otherwise unacceptable, is observed after a period of initial site stabilization (EBDRP 2000). Extreme erosion occurred at the Hamm Creek restoration site during the winter of 2006/2007. The Hamm Creek site does not meet Physical Success Criterion 3. Herring’s House and North Wind’s Weir have met Physical Success Criterion 3. The Kenco Marine was assessed in 2010 and meets Criterion 3.
38
Table 13. Success of Hamm Creek and Herring’s House restoration sites to meet physical and biological criteria targets by monitoring task and survey year. Hamm Creek Herring's House Task Target 2001 2002 2003 2005 2007 2010 2001 2002 2003 2005 2007 2010
Physical Criteria (1-3)
1 Intertidal area numerical target N N N N . . Y Y Y Y . .
2 Tidal Regime (years 1 & 5 only)
site equivalent with river
Y Y . . . . Y Y . . . .
3 Slope Erosion minimal erosion N1 N N N N N N1 Y Y Y Y Y
Biological Criteria (1-8) Marsh
1 areal extent stable or increasing size
. N1 N Y . . . N1 Y Y . .
1 patch size stable or increasing size
. N1 Y Y N N . N1 Y Y Y N
2 species composition
compare to reference site
N N N2 N2 Y . N N N2 N2 N2 .
3 plant vigor / shoot height
compare to reference site
N N N2 N2 N . N N N2 N2 N2 .
3 plant vigor / shoot density
compare to reference site
N N N2 N2 N . N N N2 N2 N2 .
Riparian
4 areal extent stable or increasing size
Y Y Y Y N Y Y Y Y Y Y Y
4 % cover by layer numerical target / layer
N1 N N N Y Y4 N1 N N N Y3 N
5 survival (yrs. 1-3 only)
> 75% survival Y Y Y . . . Y Y Y . . .
Birds
6 presence/absence
compare to reference site
Y Y Y Y . . Y Y Y Y . .
Fish
7 presence/absence
compare to reference site
Y Y Y Y . . Y Y Y Y . .
Inverts
8 presence/absence
compare to reference site
N N N N Y . N N N N N3 .
N1 First year of data; no comparison possible N2 Reference site compromised by disturbance Y3 Yes for herbaceous and tree (No for shrub layer) Y4 Yes for herbaceous (No for shrub and tree layers) N3 Herring’s House site does have an abundance of nereid polychaetes, a known prey of juvenile Chinook salmon.
39
Table 14. Success of North Wind’s Weir4 and Kenco Marine5 restoration sites to meet physical and biological criteria targets by monitoring task and survey year.
North Wind’s Weir Kenco Marine Task Target 2001 2002 2003 2005 2007 2010 2001 2002 2003 2005 2007 2010 Physical Criteria (1-3)
1 Intertidal area
numerical target . . N N . . . . . . N
2
Tidal Regime (years 1 & 5 only)
site equivalent with river
. . Y . . . . . . . . .
3 Slope Erosion
minimal erosion . . N1 Y Y Y . . . . Y Y
Biological Criteria (1-8) Marsh
1 areal extent
stable or increasing size
. . N1 Y Y Y . . . . N1 Y
1 patch size stable or increasing size
. . N1 Y Y N . . . . N1 Y
2 species composition
compare to reference site . . N2 N2 Y . . . . . N1 .
3
plant vigor / shoot height
compare to reference site . . N2 N2 N . . . . . N1 .
3
plant vigor / shoot density
compare to reference site . . N2 N2 N . . . . . N1 .
Riparian
4 areal extent
stable or increasing size
. . Y Y N Y . . . . N1 Y
4 % cover by layer
numerical target / layer . . N1 N Y Y3 . . . . N1 Y5
5 survival (yrs. 1-3 only)
> 75% survival . . Y . . . . . . . N1 Y
Birds
6 presence/absence
compare to reference site . . Y Y . . . . . . . .
Fish
7 presence/absence
compare to reference site . . Y Y . . . . . . . .
Inverts
8 presence/absence
compare to reference site . . N N Y . . . . . Y .
N1 First year of data; no comparison possible N2 Reference site compromised by disturbance
4 The report in 2007 reported that NWW in 2007 did not meet the criterion for the % cover of the herbaceous layer. However, in compiling this report in 2011 it is noted that NWW had in fact met the criterion for all vegetative layers in 2007.
5 Percent survival at Kenco Marine was calculated in 2011.
40
Y3 Yes for herbaceous and tree (No for shrub) Y5 Yes for tree (No for herbaceous and shrub)
Sediment Structure (Physical Success Criterion 4) Over time, sites will accumulate fine-grained material and organic matter. This would be evidenced by a decrease in mean grain size, and an increase in organic carbon in surface sediments (EBDRP 2000). With the approval of the EBDRP Panel, monitoring for sediment structure was discontinued in 2007 and therefore not collected in 2010. In 2005, it was determined that without threshold values, it would be too difficult to ascertain statistically whether the restoration projects have or will successfully meet Physical Success Criterion 4 as listed in the monitoring plan (EBDRP 2000). Sediment Quality (Physical Success Criterion 5) No evidence of contamination due to sediment transport or on-site migration of upland contaminants to groundwater or aquatic areas (Herring’s House only) (EBDRP 2000). Originally, the monitoring plan allocated funds for the installation of three groundwater monitoring wells at the Herring’s House site to evaluate the success of Physical Success Criterion 5. Following discussions with their cooperators in 2003, the EBDRP Panel decided not to install monitoring wells at the Herring’s House site; therefore, this criterion was not implemented. BIOLOGICAL CHARACTERISTICS Marsh Vegetation Establishment (Biological Success Criteria 1-3) The areal extent of vegetation should be stable or increasing (Criterion 1), species composition of native wetland plants should be comparable to appropriate reference sites (Criterion 2) and plant vigor should be comparable to appropriate reference sites (Criterion 3) (EBDRP 2000). Due to the absence of reference sites it is difficult to assess whether criterion 2 and 3 has been met in 2010. Areal Extent – (Criterion 1) This criterion had been met for the Hamm Creek and Herring’s House sites in 2005. With the approval of the EBDRP Panel, areal extent of marsh vegetation was only collected for the Kenco Marine and NWW sites and both sites met this criterion. Total area of marsh vegetation patches has varied over the years of sampling. Due to the methodology, some of this variation is likely due to changes in observers and random error. Erosion at the Hamm Creek site in 2007 reduced the extent of marsh vegetation. Species Composition – (Criterion 2) As a result of the absence of reference sites, species composition was only recorded at restoration sites. Therefore, Criterion 2 was impossible to assess; however, some guidance regarding nonnatives found at the restorations sites is possible. A clump of reed canarygrass detected in 2005 at Hamm Creek was the only occurrence (within a transect) of an invasive species of special concern at the restoration and reference sites since monitoring began. Additional invasive species of concern were noted at the sites. Yellow flag iris and Phragmites remain a concern at the Hamm Creek restoration site. Yellow flag iris is a Class C noxious weed. It likely will not be a problem at other sites due to the absence of freshwater
41
inputs. Phragmites forms monotypic stands if allowed to establish at a site. Perennial pepperweed was found at low levels at all of the sites. This species is a Class B noxious weed. It appears to be well controlled. Linear leaved cattail was found at Hamm Creek and North Winds Weir in 2010. Plant Vigor – (Criterion 3) As a result of the absence of absence of reference sites, plant vigor was only recorded at restoration sites. Criterion 3 was therefore impossible to assess. Riparian Vegetation (Biological Success Criteria 4 and 5) The areal extent of vegetation should be stable or increasing over time, and cover not less than 90% of the upland vegetated area of each project site at the end of 10 years, and invasive plant coverage should be minimal (Criterion 4). Survival of riparian plantings in each cover class (herb, shrub, and tree) should be at least 75% at the end of 3 years (Criterion 5) (EBDRP 2000). Areal Extent/Percent Cover/Invasives – (Criterion 4) The total areal extent of riparian vegetation at the restoration sites increased in 2011. Also, the entire upland area remains covered and only Hamm Creek has more than 20 percent cover of nonnative species (22 percent). All restoration sites, except Herring’s House meet Criterion 4 for the herbaceous layer (less than 10 percent bare ground) and all sites meet the shrub layer (greater than 50 percent shrub cover). Also, only Kenco Marine and North Wind’s Weir have greater than 40 percent tree cover. Because of the removal of nonnative species and the addition of supplemental plantings by other entities, the value of our sampling data to monitor the natural succession at the sites is low. The data show the current condition of the site after an unknown amount of riparian vegetation manipulation at the site. The restoration sites in 2010 met Biological Success Criterion 4 only in part since total areal extent of riparian vegetation increased overall and percent cover at two of the four sites met only a portion of the three cover classes. Percent cover of vegetation layers can no longer be accurately assessed due to undocumented plant maintenance work at some of the sites. Biological Success Criterion 4 no longer appears to be returning useful information on the natural succession at the sites and it is unknown if meeting this criterion is ultimately obtainable under the current circumstances. If an estimate of current conditions of the sites undergoing vegetation maintenance is still desired, then continued monitoring may provide some useful information. Survival – (Criterion 5) Riparian plant survival surveys were scheduled for Years 1-3 only. Monitoring during the first 3 years indicated all restoration sites had at least 75 percent survival plantings in each cover class (herb, shrub, trees). Biological Success Criteria 5 has been met and monitoring tasks ceased after Year 3 for all sites with the exception of the Kenco Marine site which met Criterion 5 and was high as estimated from transect plots. Bird Use (Biological Success Criterion 6) Use of the restoration sites and the area within 50 meters of the site by indigenous/native bird species should be comparable to that of the appropriate reference sites (EBDRP 2000).
42
Numbers of bird species were comparable between the Hamm Creek, Herring’s House, and North Wind’s Weir restoration sites and their respective reference sites in 2005. With the approval of the EBDRP Panel, it was agreed that biological Success Criterion 6 for bird use had been met and bird use monitoring was concluded following the 2005 monitoring. Fish Presence/Access (Biological Success Criterion 7) Estuarine fishes will access the project sites. Juvenile salmonid presence within the project sites should be comparable to that of appropriate reference sites at the end of ten years (EBDRP 2000). Biological Success Criterion 7 for fish access / presence was determined to have been met following the 2005 monitoring season, and with the approval of the EBDRP Panel fish access/presence monitoring was concluded following the 2005 monitoring season. Invertebrate Prey Resource Production (Biological Success Criteria 8) Production of invertebrate prey taxa known to be important to juvenile salmonids should be comparable to that of appropriate reference sites at the end of ten years (EBDRP 2000). The 2007 invertebrate report by Jeff Cordell of the University of Washington was submitted in 2008 and indicated that for all sites, except Herring’s House, restoration sites were similarly productive as reference sites. Although Herring’s House productivity is lower than at the reference site, it does provide nereid polychaetes which are a known prey resource for juvenile Chinook salmon. The 2010 invertebrate report will be available in March of 2012. Making a determination for Biological Success Criteria 8 will be possible after receiving the 2010 report for both Hamm Creek and Herring’s House sites.
43
RECOMMENDATIONS
In conjunction with the submission and approval of this report by the EBDRP Panel, we would like to begin discussions on concluding the monitoring effort and producing a comprehensive final monitoring report in 2015. We would like the EBDRP Panel to consider the usefulness of the data currently being collected by this monitoring program and ways to best utilize remaining funds prior to the next monitoring period presently scheduled for 2015. Some new objectives to consider in 2015 are producing a final summary report of all the monitoring years since 2000, changing the monitoring protocol for the last year of data collection, and developing a stewardship program for the monitored sites. Coordination As in previous years, other activities including: monitoring and research efforts, vegetation management, restoration and construction activities on or near the four restoration sites and their associated reference sites continue to compromise, at least in part, the ability of this monitoring effort to generate the intended information originally set forth by the EBDRP Panel in 2000. For example, well-intentioned restoration and vegetation management activities on the current restoration and reference sites typically are not coordinated with this monitoring effort. As noted in previous years, effective coordination using a primary contact was recommended as one option for information exchange and to decrease the potential for overlap of effort or conflicting activities at these sites. Monitoring Changes We also continue to advocate the use of aerial photography for each site. We believe this information would contribute in a meaningful way to the overall determination of how well the sites have done from year to year both in physical and biological attributes. Photographic comparisons are often useful in determining larger scale alterations or successional progressions over time and may be useful in the transition towards a future site stewardship program. Site Stewardship We continue to recognize that the success of the restoration sites in partially meeting vegetation goals is attributable to, at least in part, the removal of nonnative and invasive species by other entities and volunteers. A significant effort is evident in controlling invasive species, planting additional vegetation, replacing dead plants, removing trash and debris, and installing erosion control measures. We believe that continued site stewardship remains a vital part of maintaining valuable restored habitats at these sites. As noted in years past, there are many different entities working on site maintenance and it remains difficult to quantify the effort and resources expended. Quantifying the effort devoted to the sites by maintenance crews, volunteer organizations, and others would be helpful in assessing the level of effort contributed toward the success of the restoration sites. We support the development of a process that improves coordination between monitoring and site stewardship activities enabling increased complementary efforts and overall site success. The capacity of the land management entities and volunteer groups to support continued site stewardship should be evaluated to identify potential stewardship gaps. As site stewardship appears important to maintaining the long-term benefits of the restoration sites, we feel a discussion regarding how to support site stewardship should be undertaken. Hamm Creek, for

44
example, should be evaluated for its extent of invasives, such as common water reed (Phragmites communis) and yellow flag iris (Iris pseudacorus), while populations of these species are still relatively small and manageable. Common water reed is listed in the EBDRP monitoring plan as an invasive species of special concern. As mentioned in the report, other invasive species were noted during the 2007 monitoring event and again in 2010, besides the four invasive plant species of special concern listed in the EBDRP monitoring plan. These species included yellow flag iris and perennial pepperweed. Yellow flag iris is listed as a Class C noxious weed and perennial pepperweed is listed as a Class B weed in Washington State. It will be critical for future success of these sites to control occurrences of these invasives while they are relatively small in number and while control methods have a negligible impact on site restoration efforts.
45
REFERENCES
Cooke, Sarah Spear, editor. 1997. A Field Guide to the Common Wetland Plants of Western
Washington and Northwestern Oregon. 415 pp. Cordell, J.R., L.M. Tear, K. Jensen, and H.A. Higgins. 1999. Duwamish River Coastal America
restoration and reference sites: results from 1997 monitoring studies. Fisheries Research Institute, School of Fisheries, University of Washington. FRI-UW-9903. 66 pp.
Cordell, J.R., L.M. Tear, C.A. Simenstad, S.M. Wenger, and W.G. Hood. 1994. Duwamish River
Coastal America restoration and reference sites: results and recommendations from year one pilot and monitoring studies. Fisheries Research Institute, School of Fisheries, University of Washington. FRI-UW-9416. 109 pp.
Cordell, J.R., J. Toft, S. Heerhartz, and B. Armbrust. 2006. 2005 Invertebrate Monitoring at Duwamish
Waterway Restoration Sites: Hamm Creek, Herring’s House, and North Wind’s Weir. Fisheries Research Institute, School of Fisheries, University of Washington. 52 pp.
EBDRP (Elliott Bay/Duwamish Restoration Program). 2000. Intertidal habitat projects monitoring
program. Panel Publication 23, U.S. Fish and Wildlife Service, Western Washington Fish and Wildlife Office, Lacey, Washington. 26 pp.
United States of America v. The City of Seattle and Municipality of Metropolitan Seattle, No. C90-
395WD, (W.D. Wash), Consent Decree, September 1991. U.S. Fish and Wildlife Service. 2004. Elliott Bay/Duwamish Restoration Program: Intertidal habitat
projects monitoring report. 2001-2003 Final Report. Western Washington Fish and Wildlife Office, Lacey, Washington. 64 p.
U.S. Fish and Wildlife Service. 2006. Elliott Bay/Duwamish Restoration Program: Intertidal habitat
projects monitoring report. 2005 Final Report. Western Washington Fish and Wildlife Office, Lacey, Washington. 59 p.
WSNWCB (Washington State Noxious Weed Control Board). 2006. 2006 Washington State noxious
weed list. Washington State Noxious Weed Control Board. Olympia, Washington. 2 p.

46
APPENDICES
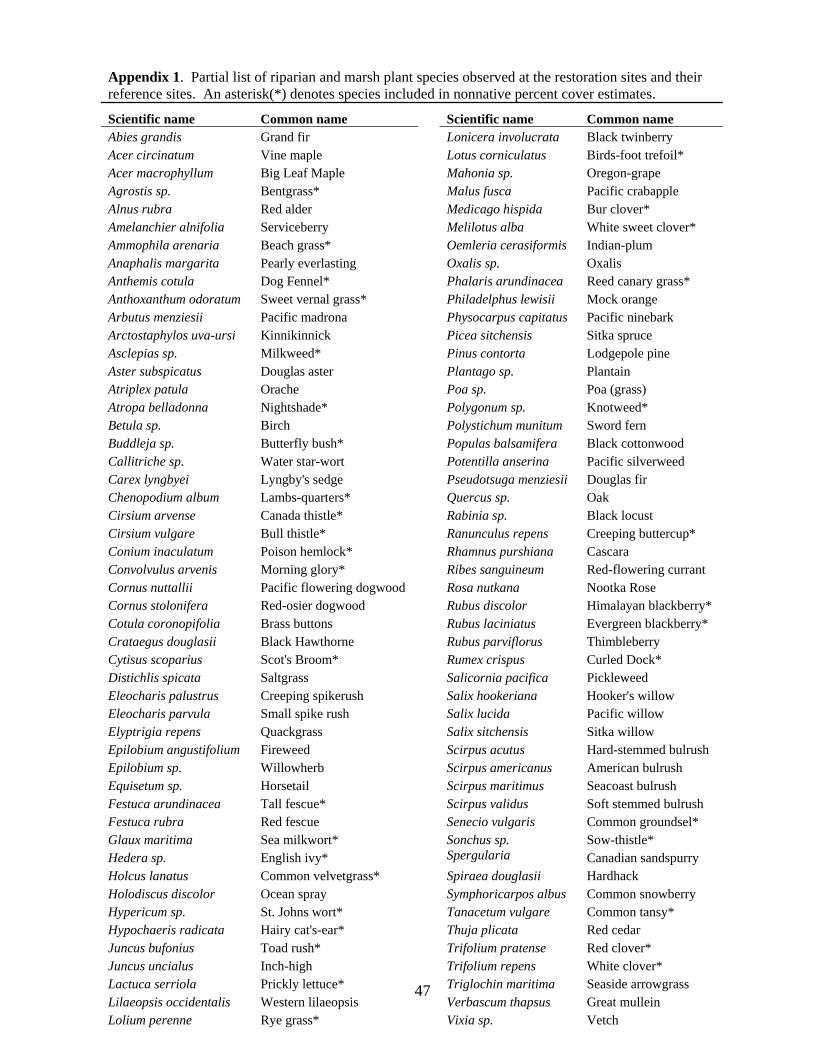
47
Appendix 1. Partial list of riparian and marsh plant species observed at the restoration sites and their reference sites. An asterisk(*) denotes species included in nonnative percent cover estimates.
Scientific name Common name Scientific name Common name Abies grandis Grand fir Lonicera involucrata Black twinberry Acer circinatum Vine maple Lotus corniculatus Birds-foot trefoil* Acer macrophyllum Big Leaf Maple Mahonia sp. Oregon-grape Agrostis sp. Bentgrass* Malus fusca Pacific crabapple Alnus rubra Red alder Medicago hispida Bur clover* Amelanchier alnifolia Serviceberry Melilotus alba White sweet clover* Ammophila arenaria Beach grass* Oemleria cerasiformis Indian-plum Anaphalis margarita Pearly everlasting Oxalis sp. Oxalis Anthemis cotula Dog Fennel* Phalaris arundinacea Reed canary grass* Anthoxanthum odoratum Sweet vernal grass* Philadelphus lewisii Mock orange Arbutus menziesii Pacific madrona Physocarpus capitatus Pacific ninebark Arctostaphylos uva-ursi Kinnikinnick Picea sitchensis Sitka spruce Asclepias sp. Milkweed* Pinus contorta Lodgepole pine Aster subspicatus Douglas aster Plantago sp. Plantain Atriplex patula Orache Poa sp. Poa (grass) Atropa belladonna Nightshade* Polygonum sp. Knotweed* Betula sp. Birch Polystichum munitum Sword fern Buddleja sp. Butterfly bush* Populas balsamifera Black cottonwood Callitriche sp. Water star-wort Potentilla anserina Pacific silverweed Carex lyngbyei Lyngby's sedge Pseudotsuga menziesii Douglas fir Chenopodium album Lambs-quarters* Quercus sp. Oak Cirsium arvense Canada thistle* Rabinia sp. Black locust Cirsium vulgare Bull thistle* Ranunculus repens Creeping buttercup* Conium inaculatum Poison hemlock* Rhamnus purshiana Cascara Convolvulus arvenis Morning glory* Ribes sanguineum Red-flowering currant Cornus nuttallii Pacific flowering dogwood Rosa nutkana Nootka Rose Cornus stolonifera Red-osier dogwood Rubus discolor Himalayan blackberry* Cotula coronopifolia Brass buttons Rubus laciniatus Evergreen blackberry* Crataegus douglasii Black Hawthorne Rubus parviflorus Thimbleberry Cytisus scoparius Scot's Broom* Rumex crispus Curled Dock* Distichlis spicata Saltgrass Salicornia pacifica Pickleweed Eleocharis palustrus Creeping spikerush Salix hookeriana Hooker's willow Eleocharis parvula Small spike rush Salix lucida Pacific willow Elyptrigia repens Quackgrass Salix sitchensis Sitka willow Epilobium angustifolium Fireweed Scirpus acutus Hard-stemmed bulrush Epilobium sp. Willowherb Scirpus americanus American bulrush Equisetum sp. Horsetail Scirpus maritimus Seacoast bulrush Festuca arundinacea Tall fescue* Scirpus validus Soft stemmed bulrush Festuca rubra Red fescue Senecio vulgaris Common groundsel* Glaux maritima Sea milkwort* Sonchus sp. Sow-thistle* Hedera sp. English ivy* Spergularia Canadian sandspurry Holcus lanatus Common velvetgrass* Spiraea douglasii Hardhack Holodiscus discolor Ocean spray Symphoricarpos albus Common snowberry Hypericum sp. St. Johns wort* Tanacetum vulgare Common tansy* Hypochaeris radicata Hairy cat's-ear* Thuja plicata Red cedar Juncus bufonius Toad rush* Trifolium pratense Red clover* Juncus uncialus Inch-high Trifolium repens White clover* Lactuca serriola Prickly lettuce* Triglochin maritima Seaside arrowgrass Lilaeopsis occidentalis Western lilaeopsis Verbascum thapsus Great mullein Lolium perenne Rye grass* Vixia sp. Vetch

48