Embed Size (px)
Citation preview
FORMATION, MOVEMENT, AND RESTORATION OF DEAD INTERTIDAL OYSTER REEFS
IN CANAVERAL NATIONAL SEASHORE AND MOSQUITO LAGOON, FLORIDA
STEPHANIE K. GARVIS,* PAUL E. SACKS AND LINDA J. WALTERS
Department of Biology, University of Central Florida, 4000 Central Florida Boulevard, Orlando, FL32816-2386
ABSTRACT Globally, 85% of shellfish reefs have been lost during the past century. The severe loss of the eastern oyster
Crassostrea virginica has encouraged different types of restoration efforts in the United States. In Mosquito Lagoon (ML),
a shallow-water estuary on the east coast of central Florida, restoration focuses on providing additional substrate for larval
recruitment via deployment of stabilized oyster shell. To assess the current number and area of natural, dead, and restored oyster
reefs within ML, aerial photographs from 2009 were digitized using ArcGIS software. All reefs were screen digitized using a reef
‘‘signature’’ to estimate the surface area of each reef type. The maps from 2009 were then used as a guide to digitizing the historical
aerial photographs (1943, 1951, 1967, 1971, 1984, 1995, and 2006). Oyster habitat within ML has decreased by almost 15 hectares
between 1943 and 2009, which constitutes 24% of the 1943 lagoon-wide coverage. The impacts were greater in Canaveral National
Seashore, which covers the southernML; 40%of the oyster coverage within the park has been lost since 1943.Dead reefs were found
adjacent to important boating channels. Tracked dead reefs exhibited a continuous migration into the mangrove islands located
landward of the original live reefs, with some dead reefs completely washing up into the marsh. Restoration of dead reefs with
stabilized oyster shells has added nearly 1 hectare of live oyster habitat to ML as of January 2009. This research demonstrates that
dead reefs are increasing in number and coverage within ML, but this trend can be reversed with restoration.
KEYWORDS: Crassostrea virginica, eastern oyster, estuary, aerial photography, remote sensing, geospatial analysis, National
Park Service
INTRODUCTION
The eastern oyster Crassostrea virginica (Gmelin, 1791) hasbeen classified as an ecosystem engineer as well as a keystone
species because of the important benefits that oysters and oysterreefs provide to estuarine systems (Dame 1996). Because of theirthree-dimensional structure, oyster reefs are able to maintain high
levels of biodiversity (Coen & Luckenbach 2000). Many econom-ically and ecologically important species use oyster reefs as habitat,including shrimp, stone crabs, blue crabs, and spotted sea trout
(Coen & Grizzle 2007, Barber et al. 2010, Stunz et al. 2010).Research has demonstrated that oysters can have ecosystem-wide,positive effects on water quality and clarity (Newell 1988, Newell&Koch 2004).Oysters also act as soft armor andwave attenuators
for shoreline stabilization (Scyphers et al. 2011,Manis et al. 2015).It has been estimated that 85%of shellfish reefs have been lost
worldwide (Beck et al. 2011). Global oyster coverage has de-
creased for several reasons: habitat destruction, disease, over-harvesting, and reduced water quality (Wenner et al. 1996, Coenet al. 1999, Kirby 2004, Johnson et al. 2009). The severe loss of
Crassostrea virginica has encouraged restoration efforts through-out its native range, which includes the eastern andGulf coasts ofNorth America. Restoration focuses on providing substrate for
larval settlement and, if warranted, increasing larval abundancesby introducing additional larvae or spat, either wild or cultivated.The simplest form of restoration is dumping the new substratematerial directly on the seafloor (Kennedy et al. 2011). Another
technique is the use of mesh bags filled with oyster shells, whichcan result in reefs more similar to the three-dimensional structureof natural reefs (Ertel & McCall 2005, Kennedy et al. 2011).
In Mosquito Lagoon (ML), boat wakes are a primary causefor oyster reef degradation (Grizzle et al. 2002,Wall et al. 2005).
Water motion from boat wakes has caused live clusters and
oyster shells to wash up on top of one another, pushing theoyster clusters above the mean high water (Grizzle et al. 2002,Wall et al. 2005). These clusters die due to lack of inundation,
resulting in the formation of a dead reef (Grizzle et al. 2002,Wall et al. 2005, Stiner &Walters 2008).
A technique using stabilized oyster shell was developed to
restore oyster reefs in the presence of large, repetitive boat wakes.Oyster restoration mats consist of aquaculture grade meshsquares that measure 0.25 m2. Each mat has 36 disarticulatedoyster shells, which each has a hole drilled in near the umbo, and
are then firmly attached using zip ties so that the shells areperpendicular to the mesh. Themats are then deployed in a quilt-like fashion on top of a dead reef, which has been leveled to low
intertidal height. Oyster restoration mats are held in place withcement weights. Restored oyster reefs have been shown to haveequal densities of live oysters when compared with natural oyster
reefs after 3.5 y (Birch & Walters 2012).In 2002, Grizzle et al. conducted a study of the historical
changes in intertidal oyster reefs in selected areas of CanaveralNational Seashore (CANA) using year 2000 imagery. This
represents southernML. This study aims to expand on theGrizzleet al�s. study to include the entirety of ML and incorporaterecent restoration efforts that have occurred since 2007. The
goals of this project are to (1) assess the change in oyster habitatcoverage over time (1943 to 2009), (2) document the formationof dead reefs, and (3) quantify the amount of new oyster habitat
created by restoration.
MATERIALS AND METHODS
Study Site
The study site was ML, which is the northern-most estuaryin the Indian River Lagoon (IRL) system. The IRL system is
a group of estuaries that comprises ;250 km of Florida Atlantic*Corresponding author. E-mail: [email protected]
DOI: 10.2983/035.034.0206
Journal of Shellfish Research, Vol. 34, No. 2, 251–258, 2015.
251
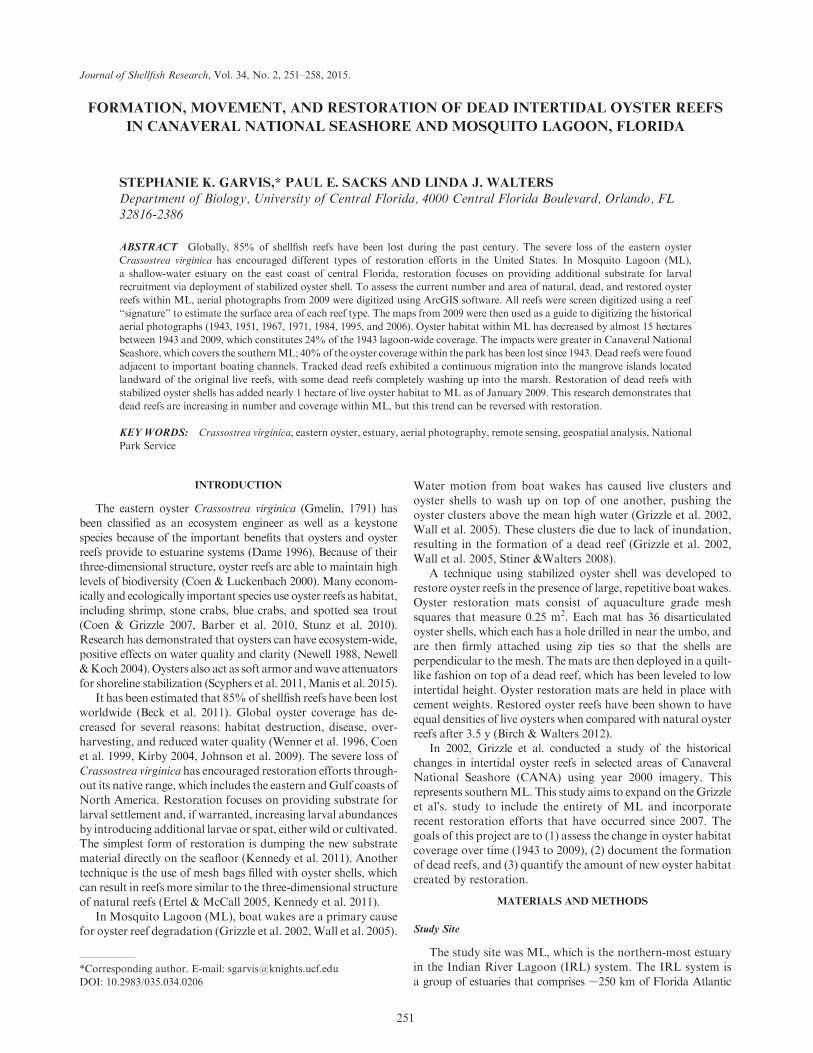
coast [St. Johns River Water Management District (SJRWMD)2006] (Fig. 1). The IRL is one of the most biologically diverse
estuaries in the world, in part because it lies in a transitional areabetween temperate and subtropical climate zones (Dybas 2002). Themajority of ML is a complex system of shallow, open water areaswith almost 100 mangrove dominated islands (Walters et al. 2001).
Mosquito Lagoon is microtidal, with a mean water depth of 1.7 m,and a tidal range of less than 1mat Ponce deLeon inlet down to lessthan 1 cm atHaulover Canal (Smith 1993, Hall et al. 2001, Steward
et al. 2006). Themost influential water movement in themajority ofthis microtidal system is a direct result of wind-driven currents;however, some locations are more influenced by tidal currents
(Dubbleday 1975, Hansell 2012, Smith 1987). Geographic infor-mation system analysis encompassed the entirety of ML, fromPonce de Leon Inlet in New Smyrna Beach in the north, to theHaulover Canal and Kennedy Space Center complex in the south.
Preliminary Field Checking
Pre-photointerpretation fieldwork was conducted in the
summer of 2010 to ensure accurate photointerpretation. This
preliminary field checking was focused on advanced signatureidentification prior to beginning digitization and was completed
to identify and classify reef signatures appearing on the 2009aerial photographs. Prior to field work, check sites wererandomly selected to represent the assumed oyster signaturespresent within the project area.
Photointerpretation Process
To assess the aerial coverage of natural, restored, and dead
oyster reefs within ML, imagery from 2009 was screen digitizedusing ArcGIS (v9.3) software. The three reef types weredigitized separately to estimate the aerial coverage of each reef
type. Each reef type had a distinct ‘‘signature’’ that was used toidentify individual oyster reefs on the aerial photograph. Afterdigitization was completed, historical aerial photography (1943to 2006) was screen digitized using the 2009 map as a reference.
Aerial photographs were predominantly free of glare and hadhigh enough contrast to detect oyster reefs. Also, the aerialphotography was captured during ideal conditions for oyster
habitat study (i.e., winter at low tides). Issues with aerial
Figure 1. Map of the extent of the study area and CANA park boundary withinML, Florida. The inset shows the location ofMLwith respect to Florida.
GARVIS ET AL.252
photography such as glare or dark areas were resolved byinterpolating reef positions between the previous and following
years, amethod also used byGrizzle et al. (2002).Narrow, fringingoyster reefs that were obscured bymangroves were not included inthis study. Scattered live clusters were also not included. Onlydense clusters of live oysters were included in the natural reef class.
Aerial photographs used in this study were obtained fromSJRWMD (2006) and Volusia County geographic informationsystem (GIS) Department (Table 1). All oyster habitats were
mapped to the level of detection (no minimum mapping unit).
Ground Truthing
A set of quality control points was independently created bya GIS Analyst at SJRWMD to avoid bias in the selection. Theobjective was to generate sample points for each class (oysters,nonoysters) using a spatially balancedmethod. A 131 km gridwas
generated for the study area (mapped oyster coverage) resulting in60 grid cells across the lagoon. Random points were generatedwithin the grid cells, across the final oyster layer (2009).A second set
of random points was generated across a nonoyster layer con-sisting of areas that were likely to be oyster habitat. A minimumdistance of 200 m was enforced between points. Ground truthing
was conducted by both University of Central Florida andSJRWMDstaff. A simple kappa coefficientwas calculated to assessthe agreement of the field data with the mapping classification.
Tracking of Individual Oyster Reefs
Dead margins and reefs in ML have narrow, distinct peakscreated by the bleached, disarticulated oyster shells (Walters
et al. 2007, Stiner & Walters 2008). Vertical reef profiles wereused to track the movement of dead margins/reefs over time bytracking the location of the peaks relative to fixed reference
points. To determine the highest point on each reef, vertical reefheights were measured at increments of 20 cm along a tapemeasure, using a stadia rod, and Johnson 9100/40–0909 laser
level secured to a tripod. Bymeasuring compass directions frompermanent stakes, the same transects were able to be measuredin multiple years. Reef height data collection began in 2006 and
was tracked through 2013.
RESULTS
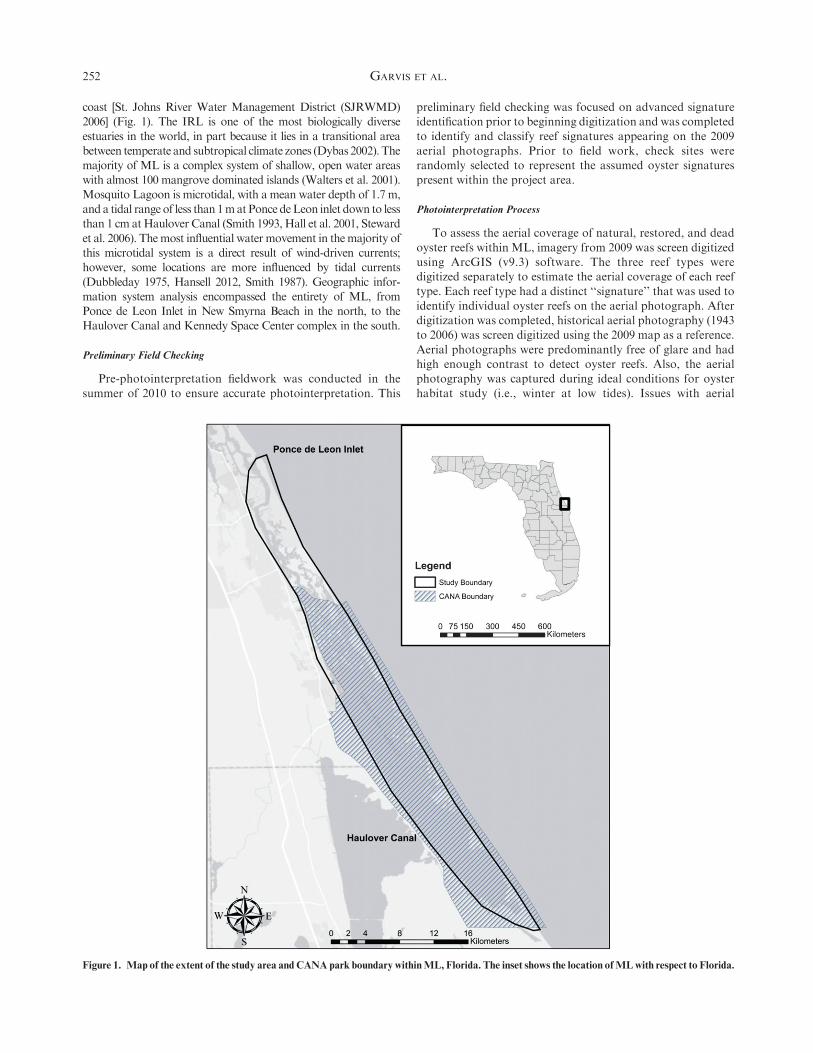
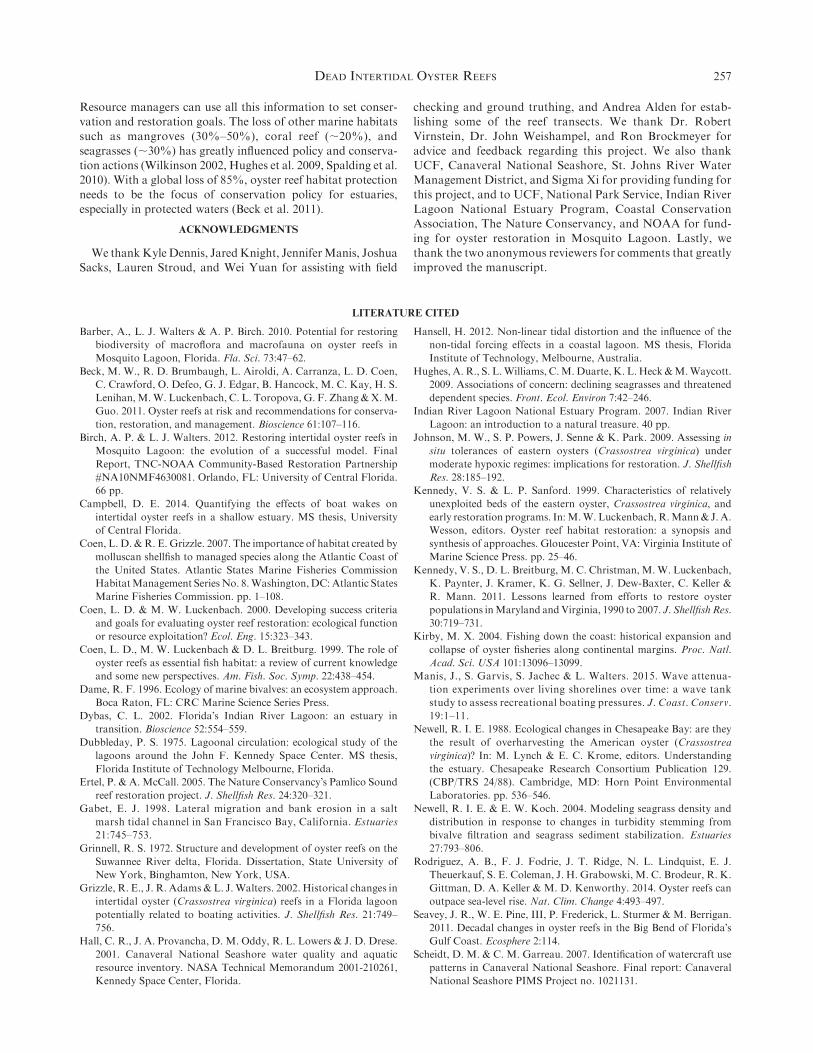
During preliminary field checking in the summer of 2010,unique reef signatures were developed for the three reef types:
natural, dead, and restored (Fig. 2). Natural oyster reefs wereidentified based on the following criteria: globular or irregularin shape, with dark margins around the edge of the reef, and
a lighter color in the center of the reef. Dead reefs were identifiedbased on the following criteria: bright white reflection due tobleached, disarticulated shells that were continuously exposed,even at high tide. Dead reefs were found either adjacent to
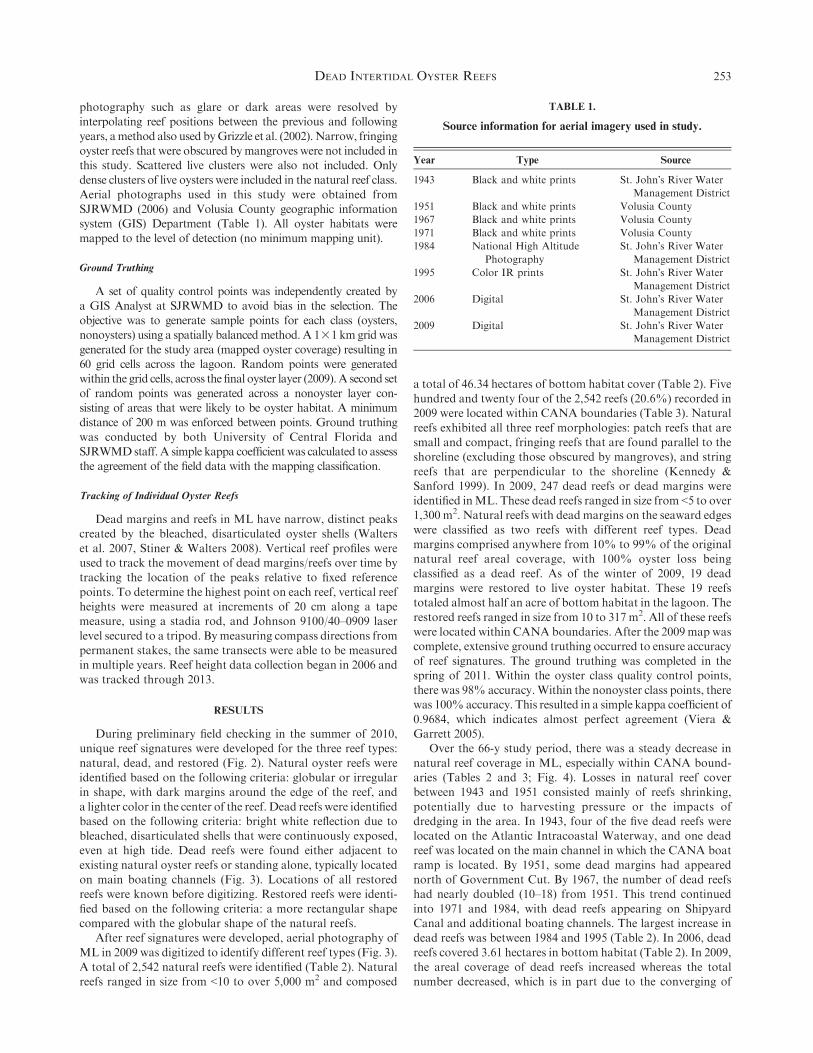
existing natural oyster reefs or standing alone, typically locatedon main boating channels (Fig. 3). Locations of all restoredreefs were known before digitizing. Restored reefs were identi-
fied based on the following criteria: a more rectangular shapecompared with the globular shape of the natural reefs.
After reef signatures were developed, aerial photography of
ML in 2009 was digitized to identify different reef types (Fig. 3).A total of 2,542 natural reefs were identified (Table 2). Naturalreefs ranged in size from <10 to over 5,000 m2 and composed
a total of 46.34 hectares of bottom habitat cover (Table 2). Fivehundred and twenty four of the 2,542 reefs (20.6%) recorded in2009 were located within CANA boundaries (Table 3). Natural
reefs exhibited all three reef morphologies: patch reefs that aresmall and compact, fringing reefs that are found parallel to theshoreline (excluding those obscured by mangroves), and string
reefs that are perpendicular to the shoreline (Kennedy &Sanford 1999). In 2009, 247 dead reefs or dead margins wereidentified inML. These dead reefs ranged in size from <5 to over1,300 m2. Natural reefs with dead margins on the seaward edges
were classified as two reefs with different reef types. Deadmargins comprised anywhere from 10% to 99% of the originalnatural reef areal coverage, with 100% oyster loss being
classified as a dead reef. As of the winter of 2009, 19 deadmargins were restored to live oyster habitat. These 19 reefstotaled almost half an acre of bottom habitat in the lagoon. The
restored reefs ranged in size from 10 to 317 m2. All of these reefswere located within CANA boundaries. After the 2009map wascomplete, extensive ground truthing occurred to ensure accuracy
of reef signatures. The ground truthing was completed in thespring of 2011. Within the oyster class quality control points,there was 98% accuracy.Within the nonoyster class points, therewas 100%accuracy. This resulted in a simple kappa coefficient of
0.9684, which indicates almost perfect agreement (Viera &Garrett 2005).
Over the 66-y study period, there was a steady decrease in
natural reef coverage in ML, especially within CANA bound-aries (Tables 2 and 3; Fig. 4). Losses in natural reef coverbetween 1943 and 1951 consisted mainly of reefs shrinking,
potentially due to harvesting pressure or the impacts ofdredging in the area. In 1943, four of the five dead reefs werelocated on the Atlantic Intracoastal Waterway, and one deadreef was located on the main channel in which the CANA boat
ramp is located. By 1951, some dead margins had appearednorth of Government Cut. By 1967, the number of dead reefshad nearly doubled (10–18) from 1951. This trend continued
into 1971 and 1984, with dead reefs appearing on ShipyardCanal and additional boating channels. The largest increase indead reefs was between 1984 and 1995 (Table 2). In 2006, dead
reefs covered 3.61 hectares in bottom habitat (Table 2). In 2009,the areal coverage of dead reefs increased whereas the totalnumber decreased, which is in part due to the converging of
TABLE 1.
Source information for aerial imagery used in study.
Year Type Source
1943 Black and white prints St. John�s River Water
Management District
1951 Black and white prints Volusia County
1967 Black and white prints Volusia County
1971 Black and white prints Volusia County
1984 National High Altitude
Photography
St. John�s River Water
Management District
1995 Color IR prints St. John�s River Water
Management District
2006 Digital St. John�s River Water
Management District
2009 Digital St. John�s River Water
Management District
DEAD INTERTIDAL OYSTER REEFS 253
several smaller dead reefs into one large dead reef. Dead reefs
also displayed a shoreward migration compared with historicalreef footprints (Fig. 5).
Because of restoration focused within CANA boundaries,
there was a decrease in number and coverage of dead reefswithin park boundaries from 2006 to 2009 (Table 3). Also,there was a small increase in natural reef acreage (<1 hectare)
behind and near restored reefs within CANA (Table 3).
Despite this gain within the park, the oyster habitat withinall of ML decreased by almost 15 hectares, which constitutes24% of the original coverage, with loss of 40% found in
CANA boundaries.The movement of 33 dead reefs was tracked for a minimum
of 1 y and a maximum of 7 y (2006 to 2013) by comparing the
Figure 3. A selected portion of ML oyster reef coverage in 2009 (enlarged for visibility). Green represents natural reefs, red represents dead reefs, and
blue represents restored reefs as of 2009. The inset shows the location of the selected portion of the study area (red) and the full extent of the study area
(teal).
Figure 2. Three reef signatures used to identify reef types during photointerpretation. Natural reefs are outlined in green (left), dead reefs are outlined in
red (center), and restored reefs are outlined in blue (right).
GARVIS ET AL.254
highest points on the dead reefs. The primary difficulty wasrelocating the metal stakes that were covered by oyster shellwashing into the marsh at some sites. Mean (±SE) dead reefmovement toward shore was 0.86 ± 0.14 m/y. The range was
0.06–3.79 m/y. The largest movement occurred on a reef justnorth of the CANA north district boat ramp.
DISCUSSION
Many studies have shown large losses in oyster reef coveragecompared with historical levels. Beck et al. (2011) created fourcategories of reef condition based on historical oyster abun-
dance indicators or changes in reef coverage as measured byGIS: good ¼ less than 50% lost; fair ¼ 50%–89% lost; poor ¼90%–99% lost, and functionally extinct¼more than 99% lost.
Of all the regions they evaluated, they found the majority ofoyster reefs to be in poor condition (Beck et al. 2011). Few of thesurveyed bays and estuaries were classified as good condition
(i.e., >50% remaining) (Beck et al. 2011).Many ecoregions havebeen deemed functionally extinct (i.e., <1% remaining), espe-cially in Europe, Australia, and North America (Beck et al.2011). In Florida, the overall condition of oyster reefs is fair.
For example, in the Big Bend region of Florida, researchersfound a decrease of 123 hectares of oyster habitat between 1982and 2010, which represented a 66% loss of the original oyster
habitat, or fair reef condition (Seavey et al. 2011). Seavey et al.(2011) found these losses to be ecologically significant becausethe oyster reefs were 2,800–4,000 y old (Grinnell 1972, Wright
et al. 2005). Thus, an important change has occurred over the last30–40 y to cause such large losses in reef habitat. The researchersattributed losses in the Big Bend region to changes in freshwaterinputs, which affected oyster spat recruitment and survival
(Seavey et al. 2011). This study found that reef condition in
ML is good, with losses of 24% within the entire lagoon andlosses of 40% within CANA compared with 1943 levels.
Most of the oyster reef losses have occurred along majorboating channels, suggesting that human impacts played a key
role in these losses (Grizzle et al. 2002). Grizzle et al. also foundlittle to no change in size or location over their 57-y study periodon oyster reefs that were protected from boating channels via
mangrove islands. Data from this study shows that dead reefformation does not perfectly mirror natural reef loss, whichsuggests that core reef area is also being lost. Figure 5 illustrates
that in addition to changes in dead reef position, there is alsocompaction of dead reef area and loss of natural reef areabehind the dead reef. This suggests that restoring these areas as
soon as possible can possibly protect the live areas behind theimpacted areas.
Mosquito Lagoon is a very popular tourist and fishingdestination for boaters (Scheidt & Garreau 2007). A 2005
survey found over 100,000 registered boats within counties thatare adjacent to ML (IRLNEP 2007). Approximately 46,000boaters frequented ML between 2006 and 2007, and 76% of
these were fishing boats (Scheidt & Garreau 2007). Advance-ment in boating technology has allowed boaters to travel intoshallower waters, which can increase the negative impacts of
boating (Scheidt & Garreau 2007). Boating traffic has beenlinked with dead reef formation as well as shoreline erosion(Gabet 1998, Grizzle et al. 2002, Wall et al. 2005). High levels ofwavemotion caused by boat wakes have been shown to dislodge
oyster shells and potentially damage spat in the process (Walterset al. 2007). In contrast, in ML, less than 1% of deployed shellsmoved when sustained winds were 79 km/h (49 m/h), and shell
movement due to wind-generated waves was less than 5 cm(Walters et al. 2007). Researchers have also found that boatwakes as small as 2 cm are capable of moving both individual
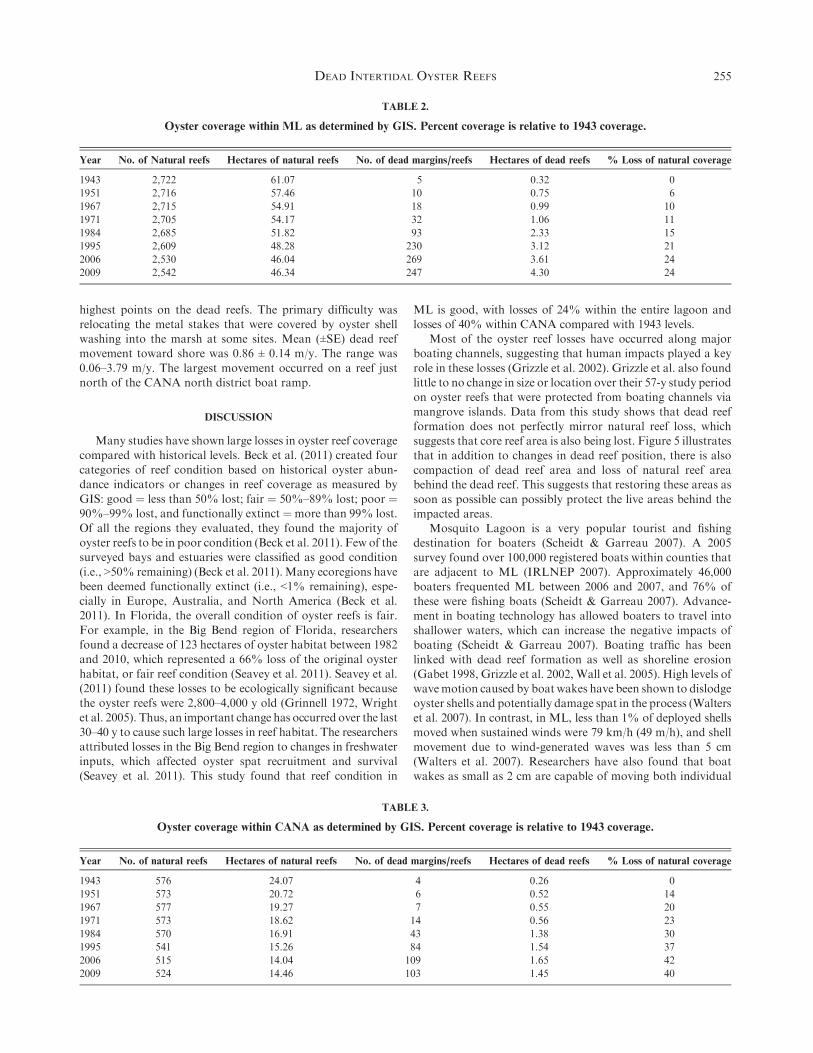
TABLE 2.
Oyster coverage within ML as determined by GIS. Percent coverage is relative to 1943 coverage.
Year No. of Natural reefs Hectares of natural reefs No. of dead margins/reefs Hectares of dead reefs % Loss of natural coverage
1943 2,722 61.07 5 0.32 0
1951 2,716 57.46 10 0.75 6
1967 2,715 54.91 18 0.99 10
1971 2,705 54.17 32 1.06 11
1984 2,685 51.82 93 2.33 15
1995 2,609 48.28 230 3.12 21
2006 2,530 46.04 269 3.61 24
2009 2,542 46.34 247 4.30 24
TABLE 3.
Oyster coverage within CANA as determined by GIS. Percent coverage is relative to 1943 coverage.
Year No. of natural reefs Hectares of natural reefs No. of dead margins/reefs Hectares of dead reefs % Loss of natural coverage
1943 576 24.07 4 0.26 0
1951 573 20.72 6 0.52 14
1967 577 19.27 7 0.55 20
1971 573 18.62 14 0.56 23
1984 570 16.91 43 1.38 30
1995 541 15.26 84 1.54 37
2006 515 14.04 109 1.65 42
2009 524 14.46 103 1.45 40
DEAD INTERTIDAL OYSTER REEFS 255
oysters as well as oyster clusters (Campbell 2014). Walters et al.
(2007) additionally found that the highest points on natural anddead reefs did not significantly change when three hurricanespassed over the lagoon in the fall of 2004. Sites included in the
multiyear reef monitoring have been repeatedly subjected towakes from over 50 boats per hour (Walters, unpublished data).
It is possible that formation of dead areas could be related toother negative disturbance beyond recreational boat wakes. Sealevel rise, overharvesting, and disease prevalence could poten-tially impact oyster reefs in this area. Recent studies, however,
have found that intertidal oyster reefs were capable of accretingreef height in response to sea level rise (Rodriguez et al. 2014,Walles et al. 2015). Rodriguez et al. (2014) found thatCrassostrea
virginica could potentially outpace future-accelerated level of sealevel rise. Walles et al. (2015) also found vertical reef growth thatis in excess of local sea level rise rates forCrassostrea gigas. If sea
level rise was affecting the formation of dead areas, one wouldexpect a uniform distribution of dead areas within the lagoon.Within this study, however, there is a very strong correlationbetween dead areas and boat channels. Oyster reefs that are
protected from boat wakes (via mangrove islands) are almostcompletely unchanged throughout the study period. In addition,catch logs from ML suggest limited harvesting pressure within
CANA park boundaries (Kneifl personal communication) andlow levels of disease (Walters et al. 2007).
When assessing reef conditions, it is important to under-
stand the underlying mechanisms responsible for causing therapid loss of reef habitat to guide future conservation planning.This study, as well as Grizzle et al. (2002), provides evidence
that boat wakes are playing a major role in oyster reef declinesin this shallow estuary. Understanding trends in oyster reef losscould help minimize the impact of boat wakes by implementingno wake zones in key areas. In addition, using the historical
coverage data, natural resource managers can establish a base-line for oyster reef coverage in the area and demonstrate howoyster restoration is improving the current oyster coverage.
Figure 4. Change in natural reef coverage (top) and dead reef coverage
(bottom) through the study period (1943 to 2009). The solid black lines
represent coverage within CANA boundaries and the dashed black lines
represent coverage within ML.
Figure 5. Selected dead reef footprints in CANA. Different colors correspond to the reef footprints within each mapped year in the study period (1943 to
2009). Panels A and B represent an enlarged view of selected areas within Panel C.
GARVIS ET AL.256
Resource managers can use all this information to set conser-vation and restoration goals. The loss of other marine habitats
such as mangroves (30%–50%), coral reef (;20%), andseagrasses (;30%) has greatly influenced policy and conserva-tion actions (Wilkinson 2002, Hughes et al. 2009, Spalding et al.2010). With a global loss of 85%, oyster reef habitat protection
needs to be the focus of conservation policy for estuaries,especially in protected waters (Beck et al. 2011).
ACKNOWLEDGMENTS
We thankKyleDennis, JaredKnight, JenniferManis, JoshuaSacks, Lauren Stroud, and Wei Yuan for assisting with field
checking and ground truthing, and Andrea Alden for estab-lishing some of the reef transects. We thank Dr. Robert
Virnstein, Dr. John Weishampel, and Ron Brockmeyer foradvice and feedback regarding this project. We also thankUCF, Canaveral National Seashore, St. Johns River WaterManagement District, and Sigma Xi for providing funding for
this project, and to UCF, National Park Service, Indian RiverLagoon National Estuary Program, Coastal ConservationAssociation, The Nature Conservancy, and NOAA for fund-
ing for oyster restoration in Mosquito Lagoon. Lastly, wethank the two anonymous reviewers for comments that greatlyimproved the manuscript.
LITERATURE CITED
Barber, A., L. J. Walters & A. P. Birch. 2010. Potential for restoring
biodiversity of macroflora and macrofauna on oyster reefs in
Mosquito Lagoon, Florida. Fla. Sci. 73:47–62.
Beck, M. W., R. D. Brumbaugh, L. Airoldi, A. Carranza, L. D. Coen,
C. Crawford, O. Defeo, G. J. Edgar, B. Hancock, M. C. Kay, H. S.
Lenihan,M.W. Luckenbach, C. L. Toropova, G. F. Zhang &X.M.
Guo. 2011. Oyster reefs at risk and recommendations for conserva-
tion, restoration, and management. Bioscience 61:107–116.
Birch, A. P. & L. J. Walters. 2012. Restoring intertidal oyster reefs in
Mosquito Lagoon: the evolution of a successful model. Final
Report, TNC-NOAA Community-Based Restoration Partnership
#NA10NMF4630081. Orlando, FL: University of Central Florida.
66 pp.
Campbell, D. E. 2014. Quantifying the effects of boat wakes on
intertidal oyster reefs in a shallow estuary. MS thesis, University
of Central Florida.
Coen, L. D. &R. E. Grizzle. 2007. The importance of habitat created by
molluscan shellfish to managed species along the Atlantic Coast of
the United States. Atlantic States Marine Fisheries Commission
HabitatManagement SeriesNo. 8.Washington,DC:Atlantic States
Marine Fisheries Commission. pp. 1–108.
Coen, L. D. & M. W. Luckenbach. 2000. Developing success criteria
and goals for evaluating oyster reef restoration: ecological function
or resource exploitation? Ecol. Eng. 15:323–343.
Coen, L. D., M. W. Luckenbach & D. L. Breitburg. 1999. The role of
oyster reefs as essential fish habitat: a review of current knowledge
and some new perspectives. Am. Fish. Soc. Symp. 22:438–454.
Dame, R. F. 1996. Ecology of marine bivalves: an ecosystem approach.
Boca Raton, FL: CRC Marine Science Series Press.
Dybas, C. L. 2002. Florida�s Indian River Lagoon: an estuary in
transition. Bioscience 52:554–559.
Dubbleday, P. S. 1975. Lagoonal circulation: ecological study of the
lagoons around the John F. Kennedy Space Center. MS thesis,
Florida Institute of Technology Melbourne, Florida.
Ertel, P. & A. McCall. 2005. The Nature Conservancy�s Pamlico Sound
reef restoration project. J. Shellfish Res. 24:320–321.
Gabet, E. J. 1998. Lateral migration and bank erosion in a salt
marsh tidal channel in San Francisco Bay, California. Estuaries
21:745–753.
Grinnell, R. S. 1972. Structure and development of oyster reefs on the
Suwannee River delta, Florida. Dissertation, State University of
New York, Binghamton, New York, USA.
Grizzle, R. E., J. R. Adams &L. J.Walters. 2002. Historical changes in
intertidal oyster (Crassostrea virginica) reefs in a Florida lagoon
potentially related to boating activities. J. Shellfish Res. 21:749–
756.
Hall, C. R., J. A. Provancha, D. M. Oddy, R. L. Lowers & J. D. Drese.
2001. Canaveral National Seashore water quality and aquatic
resource inventory. NASA Technical Memorandum 2001-210261,
Kennedy Space Center, Florida.
Hansell, H. 2012. Non-linear tidal distortion and the influence of the
non-tidal forcing effects in a coastal lagoon. MS thesis, Florida
Institute of Technology, Melbourne, Australia.
Hughes, A. R., S. L.Williams, C.M.Duarte, K. L. Heck&M.Waycott.
2009. Associations of concern: declining seagrasses and threatened
dependent species. Front. Ecol. Environ 7:42–246.
Indian River Lagoon National Estuary Program. 2007. Indian River
Lagoon: an introduction to a natural treasure. 40 pp.
Johnson, M. W., S. P. Powers, J. Senne & K. Park. 2009. Assessing in
situ tolerances of eastern oysters (Crassostrea virginica) under
moderate hypoxic regimes: implications for restoration. J. Shellfish
Res. 28:185–192.
Kennedy, V. S. & L. P. Sanford. 1999. Characteristics of relatively
unexploited beds of the eastern oyster, Crassostrea virginica, and
early restoration programs. In:M.W. Luckenbach, R.Mann& J. A.
Wesson, editors. Oyster reef habitat restoration: a synopsis and
synthesis of approaches. Gloucester Point, VA: Virginia Institute of
Marine Science Press. pp. 25–46.
Kennedy, V. S., D. L. Breitburg, M. C. Christman, M.W. Luckenbach,
K. Paynter, J. Kramer, K. G. Sellner, J. Dew-Baxter, C. Keller &
R. Mann. 2011. Lessons learned from efforts to restore oyster
populations inMaryland andVirginia, 1990 to 2007. J. ShellfishRes.
30:719–731.
Kirby, M. X. 2004. Fishing down the coast: historical expansion and
collapse of oyster fisheries along continental margins. Proc. Natl.
Acad. Sci. USA 101:13096–13099.
Manis, J., S. Garvis, S. Jachec & L. Walters. 2015. Wave attenua-
tion experiments over living shorelines over time: a wave tank
study to assess recreational boating pressures. J. Coast. Conserv.
19:1–11.
Newell, R. I. E. 1988. Ecological changes in Chesapeake Bay: are they
the result of overharvesting the American oyster (Crassostrea
virginica)? In: M. Lynch & E. C. Krome, editors. Understanding
the estuary. Chesapeake Research Consortium Publication 129.
(CBP/TRS 24/88). Cambridge, MD: Horn Point Environmental
Laboratories. pp. 536–546.
Newell, R. I. E. & E. W. Koch. 2004. Modeling seagrass density and
distribution in response to changes in turbidity stemming from
bivalve filtration and seagrass sediment stabilization. Estuaries
27:793–806.
Rodriguez, A. B., F. J. Fodrie, J. T. Ridge, N. L. Lindquist, E. J.
Theuerkauf, S. E. Coleman, J. H. Grabowski, M. C. Brodeur, R. K.
Gittman, D. A. Keller & M. D. Kenworthy. 2014. Oyster reefs can
outpace sea-level rise. Nat. Clim. Change 4:493–497.
Seavey, J. R., W. E. Pine, III, P. Frederick, L. Sturmer & M. Berrigan.
2011. Decadal changes in oyster reefs in the Big Bend of Florida�sGulf Coast. Ecosphere 2:114.
Scheidt, D. M. & C. M. Garreau. 2007. Identification of watercraft use
patterns in Canaveral National Seashore. Final report: Canaveral
National Seashore PIMS Project no. 1021131.
DEAD INTERTIDAL OYSTER REEFS 257
Scyphers, S. B., S. P. Powers, K. L. Heck &D. Byron. 2011. Oyster reefs
as natural breakwaters mitigate shoreline loss and facilitate
fisheries. PLoS One 6:e22396.
Smith, N. P. 1987. An introduction to the tides of Florida�s Indian River
Lagoon. I. Water levels. Fla. Sci. 50:49–61.
Smith, N. P. 1993. Tidal and nontidal flushing of the Florida�s IndianRiver Lagoon. Estuaries 16:739–746.
Spalding, M. D., M. Kainuma & L. Collins. 2010. World Atlas of
mangroves. London, UK: Earthscan. 336 pp.
St. Johns River Water Management District. 2006. Water supply
assessment: 2003. Technical Publication SJ2006-1. Palatka, FL: St.
Johns River Water Management District.
Steward, J. S., R. V. Virnstein, M. A. Lasi, L. J. Morris, J. D. Miller,
L. M. Hall & W. A. Tweedale. 2006. The impacts of the 2004
hurricanes on hydrology, water quality, and seagrass in the central
Indian River Lagoon, Florida. Estuaries Coasts 29:954–956.
Stiner, J. L. & L. J. Walters. 2008. Effects of recreational boating on
oyster reef architecture and species interactions. Fla. Sci. 71:31–44.
Stunz, G.W., T. J.Minello & L. P. Rozas. 2010. Relative value of oyster
reef as habitat for estuarine nekten in Galveston Bay, Texas. Mar.
Ecol. Prog. Ser. 406:147–159.
Viera, A. J. & J. M. Garrett. 2005. Understanding interobserver
agreement: the kappa statistic. Fam. Med. 37:360–363.
Wall, L. M., L. J. Walters, R. E. Grizzle & P. E. Sacks. 2005.
Recreational boating activity and its impact on the recruitment
and survival of the oyster Crassostrea virginica on intertidal reefs in
Mosquito Lagoon, Florida. J. Shellfish Res. 24:965–973.
Walles, B., R. Mann, T. Ysebaert, K. Troost, P. M. J. Herman & A. C.
Smaal. 2015. Demography of the ecosystem engineer Crassostrea
gigas, related to vertical reef accretion and reef persistence. Estuar.
Coast. Shelf Sci. 154:224–233.
Walters, L. J., A. Roman, J. Stiner & D.Weeks. 2001. Water Resources
Management Plan: Canaveral National Seashore, Florida. Titusville,
FL: National Park Service, Canaveral National Seashore. 224 pp.
Walters, L. J., P. E. Sacks, Y. Bobo, D. Richardson & L. D. Coen. 2007.
Impact of hurricanes on intertidal oyster reefs in Florida: reef
profiles and disease prevalence. Fla. Sci. 70:506–521.
Wenner, E., H. R. Beatty & L. D. Coen. 1996. A method for
quantitatively sampling nekton on intertidal oyster reefs. J. Shellfish
Res. 15:769–775.
Wilkinson, C. 2002. Status of coral reefs of the world: 2002. Townsville,
Australia: Australian Institute of Marine Science.
Wright, E. E., A. C. Hine, S. L. Goodbred & S. D. Locker. 2005. The
effect of sea-level and climate change on the development of a mixed
siliciclastic carbonate, deltaic coastline: Suwannee River, Florida,
USA. J. Sediment. Res. 75:621–635.
GARVIS ET AL.258
![Restoration of Central Programmed Movement Pattern … thepeaksofpremovementfacilitatedMEPsintheagonistand antagonistmusclesandthatthedelaywaswellcorrelatedwith thetimecourseoftriphasicEMGactivation[20].Therefore,](https://img.pdfslide.us/doc/110x75/5ad9f9757f8b9add658bfbeb/restoration-of-central-programmed-movement-pattern-thepeaksofpremovementfacilitatedmepsintheagonistand.jpg)