Embed Size (px)
DESCRIPTION
MTF Correction for Optimizing Softcopy Display of Digital Mammograms: Use of a Vision Model for Predicting Observer Performance. Elizabeth Krupinski, PhD 1 Jeffrey Johnson, PhD 2 Hans Roehrig, PhD 1 Jeffrey Lubin, PhD 2 Michael Engstrom, BS 1 - PowerPoint PPT Presentation
Citation preview
MTF Correction for Optimizing Softcopy Display of Digital
Mammograms: Use of a Vision Model for Predicting Observer
Performance
Elizabeth Krupinski, PhD1 Jeffrey Johnson, PhD2
Hans Roehrig, PhD1 Jeffrey Lubin, PhD2
Michael Engstrom, BS1
1University of Arizona 2Sarnoff CorporationThis work was supported by a grant from the
NIH R01 CA 87816-01.
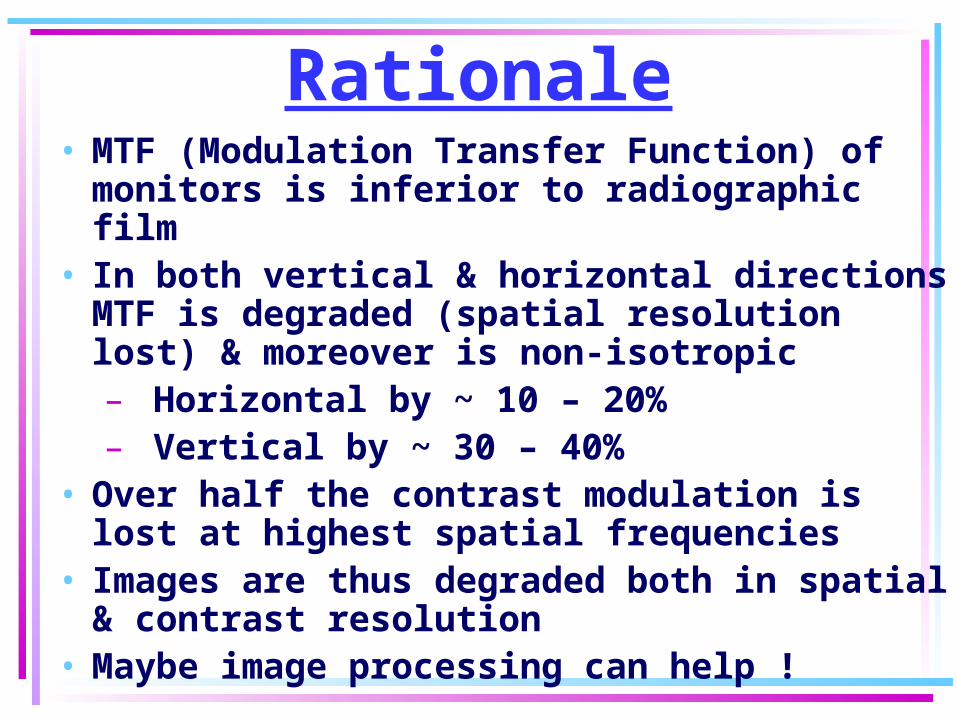
Rationale• MTF (Modulation Transfer Function) of
monitors is inferior to radiographic film• In both vertical & horizontal directions
MTF is degraded (spatial resolution lost) & moreover is non-isotropic– Horizontal by ~ 10 – 20%– Vertical by ~ 30 – 40%
• Over half the contrast modulation is lost at highest spatial frequencies
• Images are thus degraded both in spatial & contrast resolution
• Maybe image processing can help !
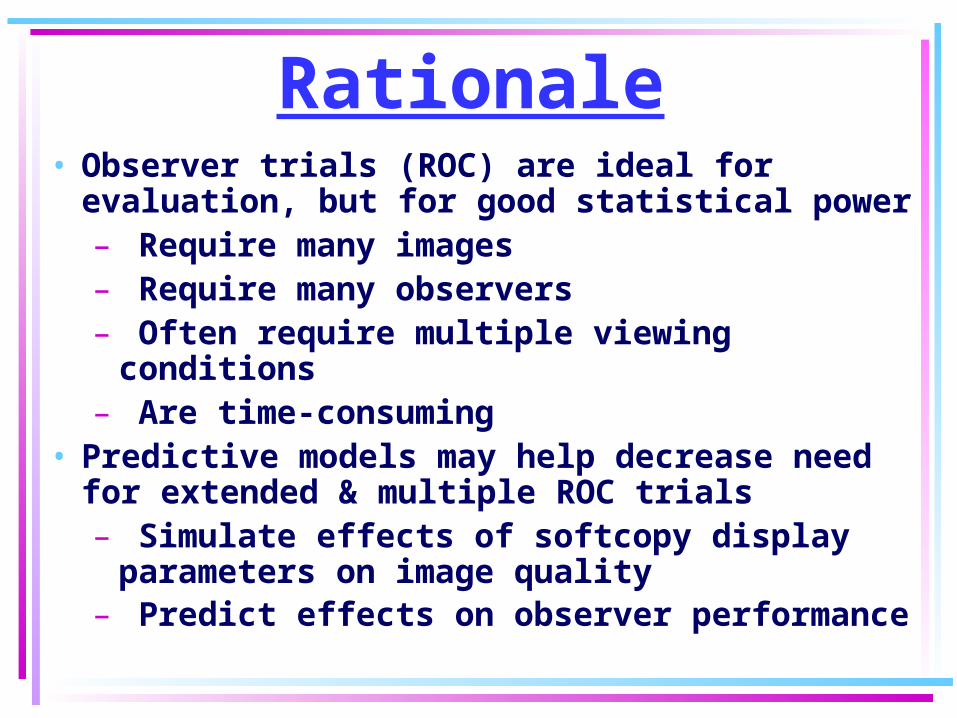
Rationale• Observer trials (ROC) are ideal for
evaluation, but for good statistical power– Require many images – Require many observers – Often require multiple viewing
conditions– Are time-consuming
• Predictive models may help decrease need for extended & multiple ROC trials– Simulate effects of softcopy display
parameters on image quality– Predict effects on observer performance
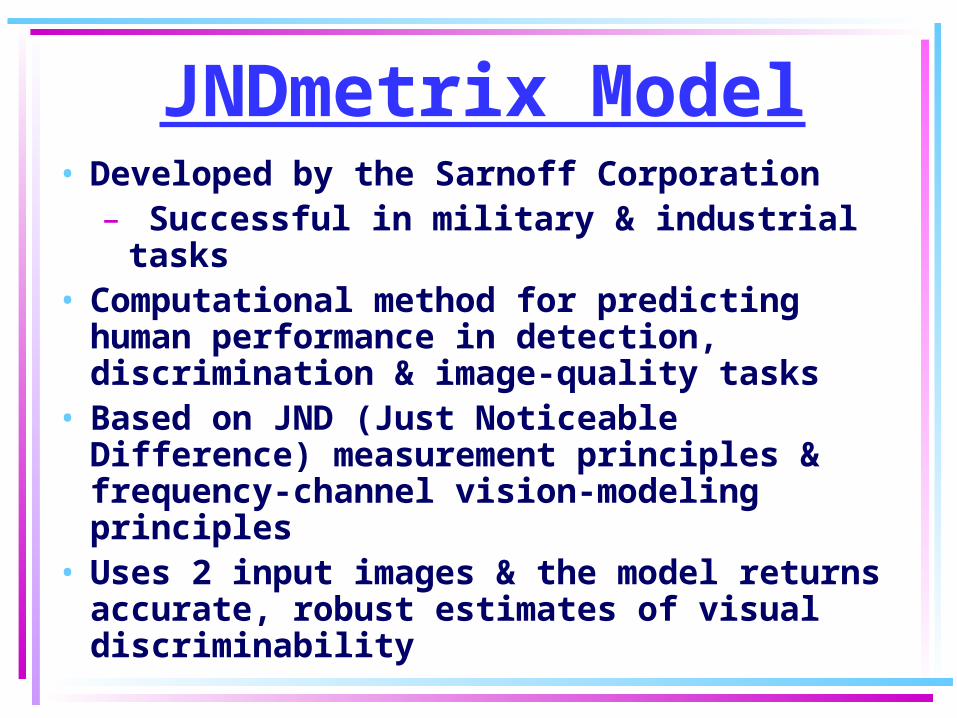
JNDmetrix Model• Developed by the Sarnoff Corporation
– Successful in military & industrial tasks
• Computational method for predicting human performance in detection, discrimination & image-quality tasks
• Based on JND (Just Noticeable Difference) measurement principles & frequency-channel vision-modeling principles
• Uses 2 input images & the model returns accurate, robust estimates of visual discriminability
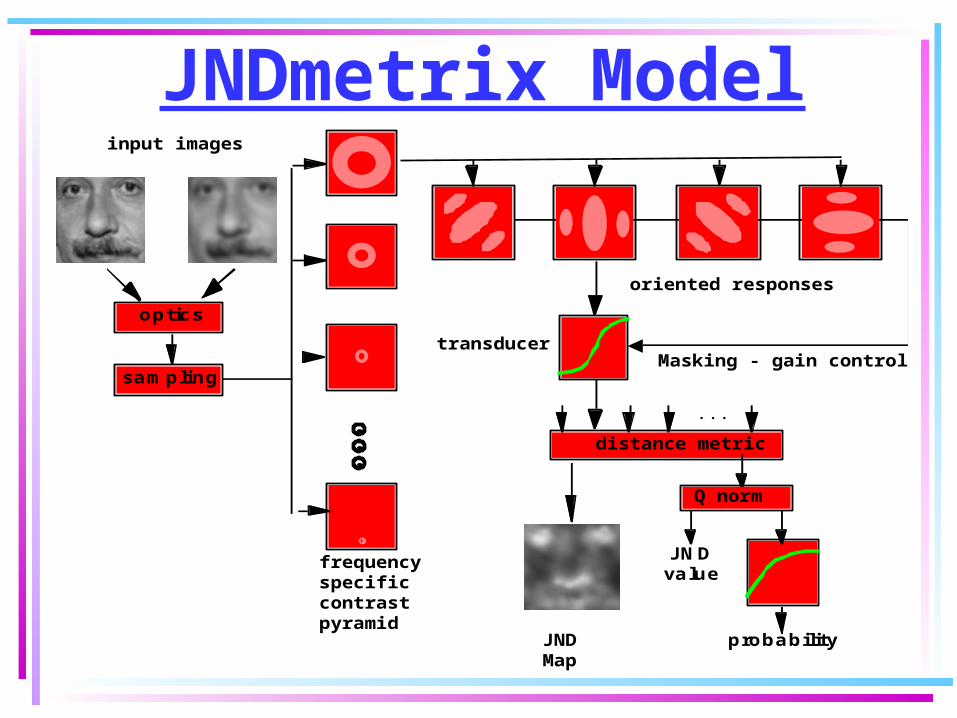
JNDmetrix Model
sa mpling
proba bility
distance metric
optic s
Q norm
JN Dva lue
input images
frequency specificcontrastpyramid
oriented responses
transducerMasking - gain control
JNDMap
...
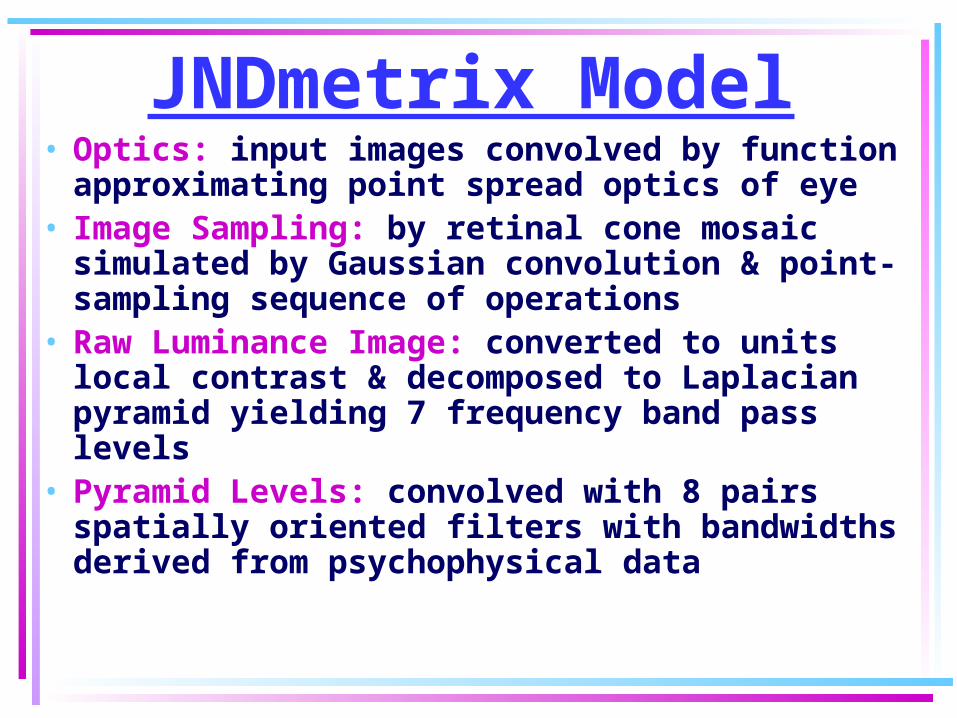
JNDmetrix Model• Optics: input images convolved by
function approximating point spread optics of eye
• Image Sampling: by retinal cone mosaic simulated by Gaussian convolution & point-sampling sequence of operations
• Raw Luminance Image: converted to units local contrast & decomposed to Laplacian pyramid yielding 7 frequency band pass levels
• Pyramid Levels: convolved with 8 pairs spatially oriented filters with bandwidths derived from psychophysical data
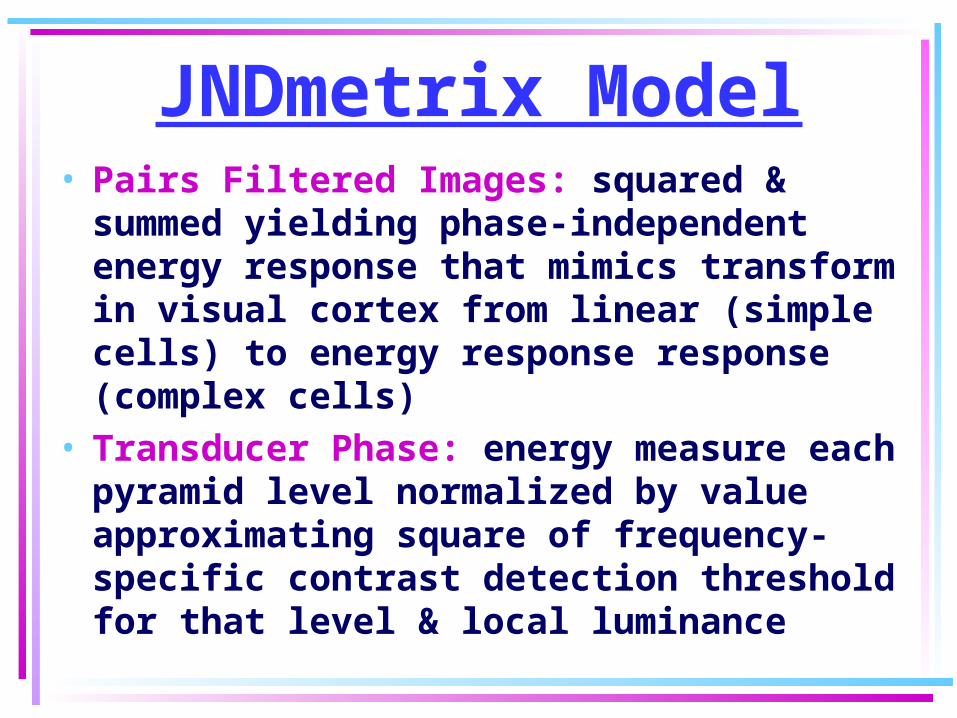
JNDmetrix Model• Pairs Filtered Images: squared &
summed yielding phase-independent energy response that mimics transform in visual cortex from linear (simple cells) to energy response response (complex cells)
• Transducer Phase: energy measure each pyramid level normalized by value approximating square of frequency-specific contrast detection threshold for that level & local luminance
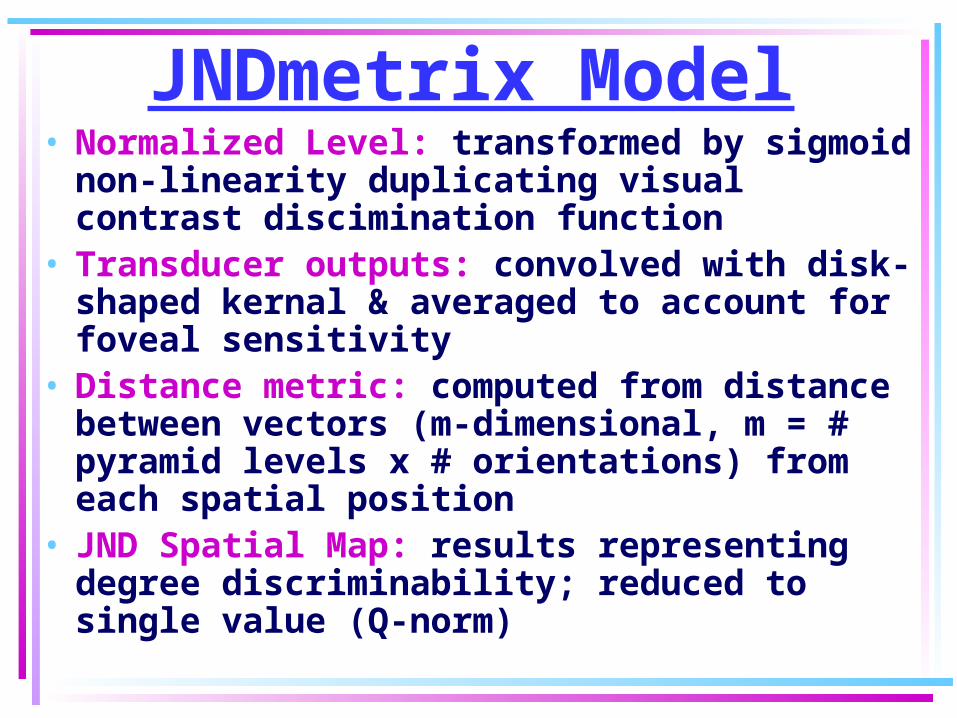
JNDmetrix Model• Normalized Level: transformed by
sigmoid non-linearity duplicating visual contrast discimination function
• Transducer outputs: convolved with disk-shaped kernal & averaged to account for foveal sensitivity
• Distance metric: computed from distance between vectors (m-dimensional, m = # pyramid levels x # orientations) from each spatial position
• JND Spatial Map: results representing degree discriminability; reduced to single value (Q-norm)
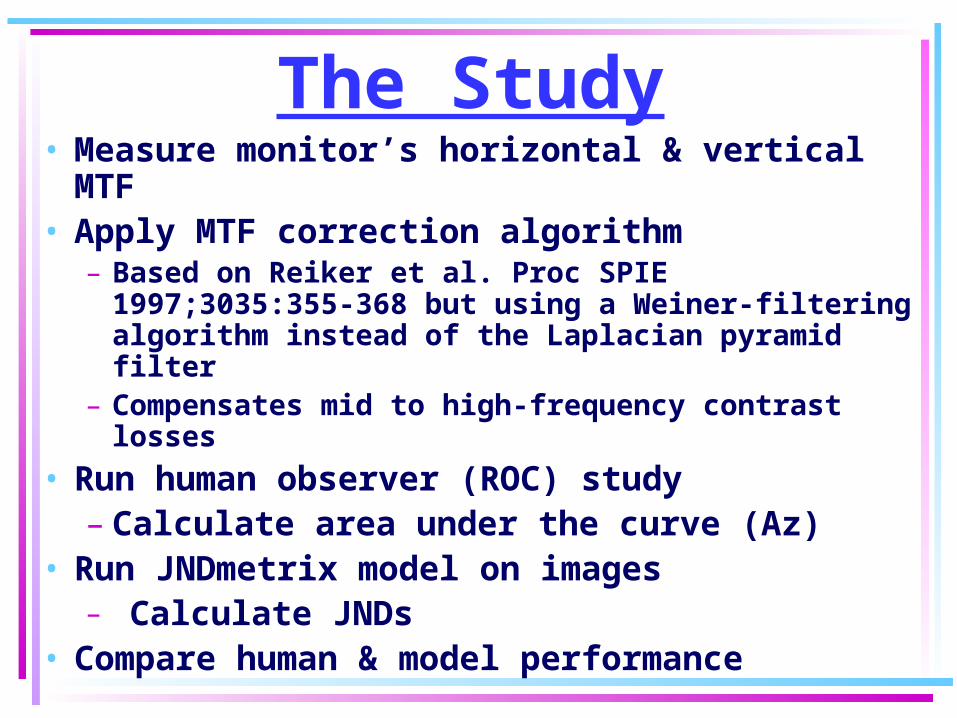
The Study• Measure monitor’s horizontal & vertical
MTF• Apply MTF correction algorithm
– Based on Reiker et al. Proc SPIE 1997;3035:355-368 but using a Weiner-filtering algorithm instead of the Laplacian pyramid filter
– Compensates mid to high-frequency contrast losses
• Run human observer (ROC) study– Calculate area under the curve (Az)
• Run JNDmetrix model on images– Calculate JNDs
• Compare human & model performance
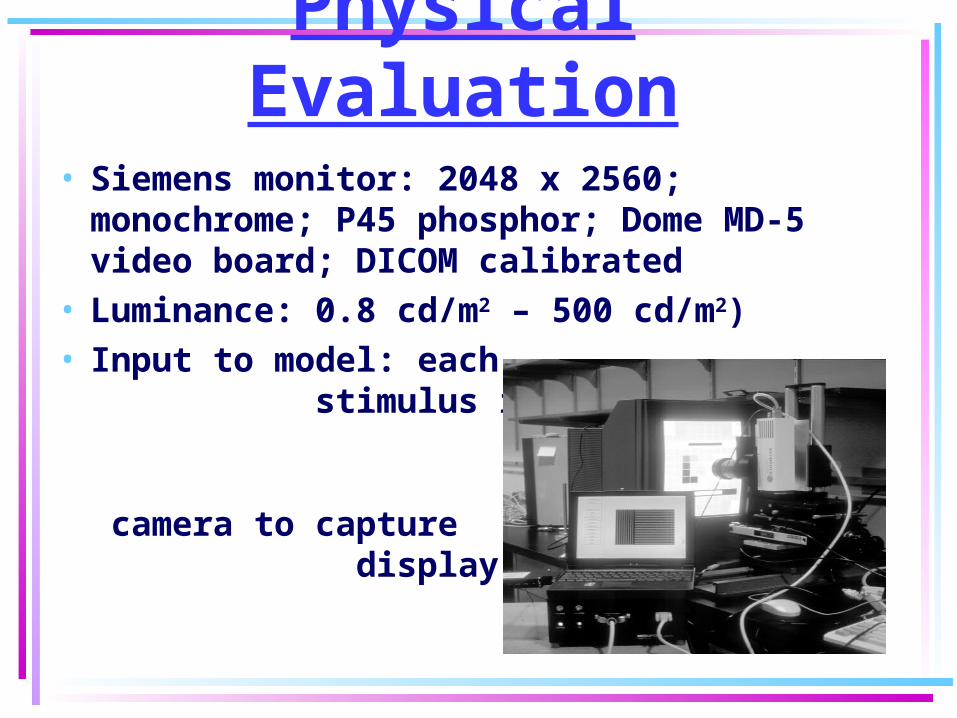
Physical Evaluation• Siemens monitor: 2048 x 2560;
monochrome; P45 phosphor; Dome MD-5 video board; DICOM calibrated
• Luminance: 0.8 cd/m2 – 500 cd/m2)• Input to model: each
stimulus imaged on monitor by CCD camera to capture display effects
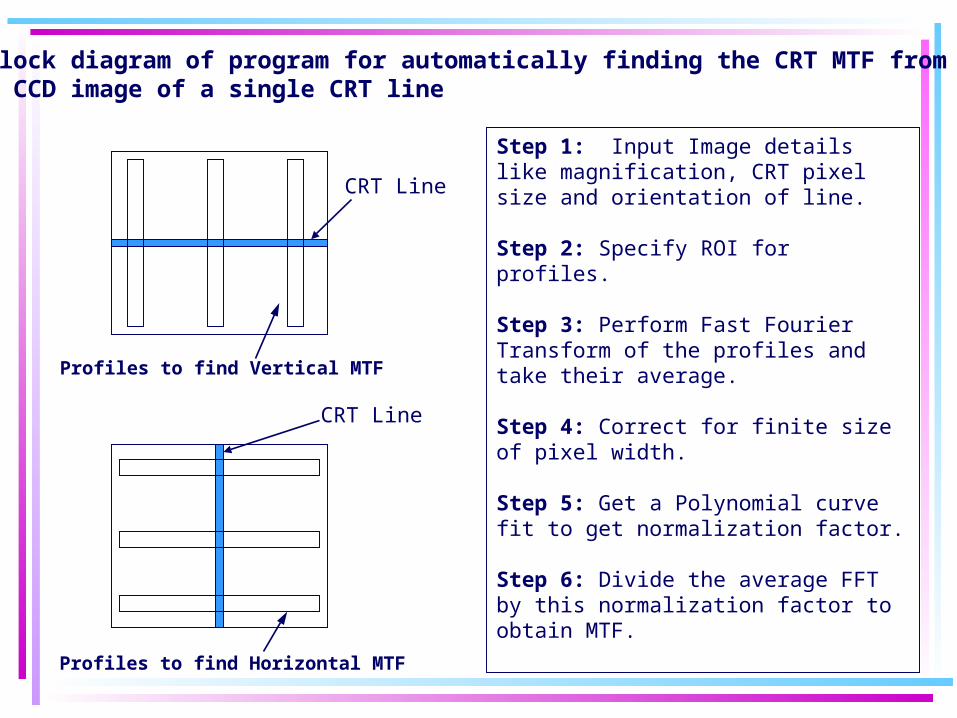
Block diagram of program for automatically finding the CRT MTF from a CCD image of a single CRT line
Profiles to find Vertical MTF
Profiles to find Horizontal MTF
Step 1: Input Image details like magnification, CRT pixel size and orientation of line.
Step 2: Specify ROI for profiles.
Step 3: Perform Fast Fourier Transform of the profiles and take their average.
Step 4: Correct for finite size of pixel width.
Step 5: Get a Polynomial curve fit to get normalization factor.
Step 6: Divide the average FFT by this normalization factor to obtain MTF.
CRT Line
CRT Line
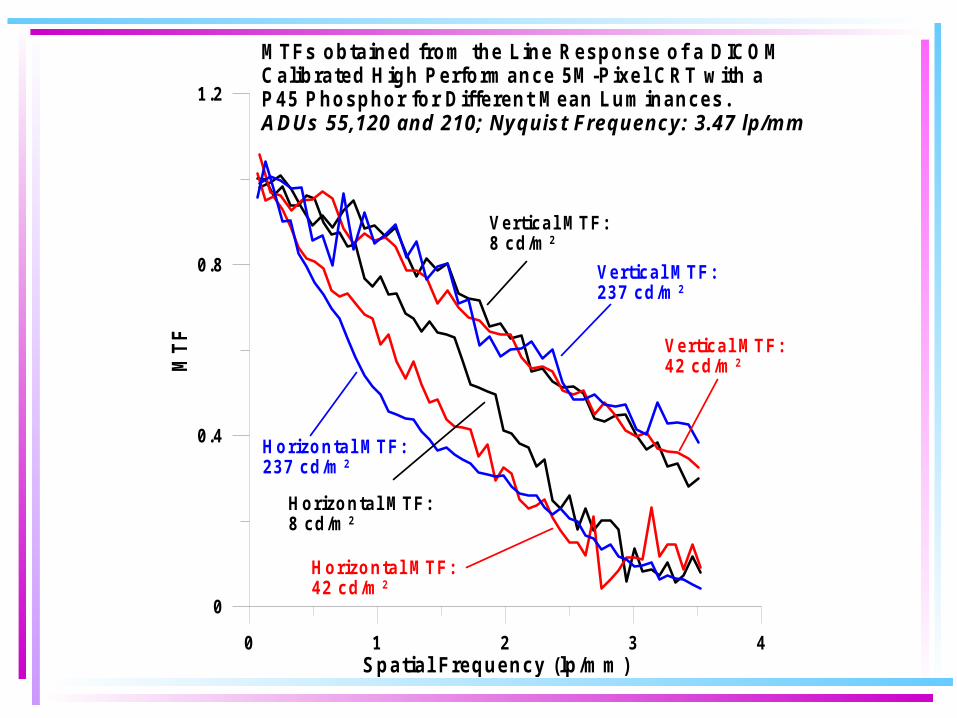
0 1 2 3 4
Spatial Frequency (lp/m m)
0
0.4
0.8
1.2
MT
F
Vertical MTF:8 cd/m 2
Vertical MTF:42 cd/m 2
Vertical MTF:237 cd/m 2
Horizontal MTF:237 cd/m 2
Horizontal MTF:42 cd/m 2
Horizontal MTF:8 cd/m 2
MTFs obtained from the Line Response of a DICOMCalibrated High Performance 5M-Pixel CRT with aP45 Phosphor for Different Mean Luminances.ADUs 55,120 and 210; Nyquist Frequency: 3.47 lp/m m
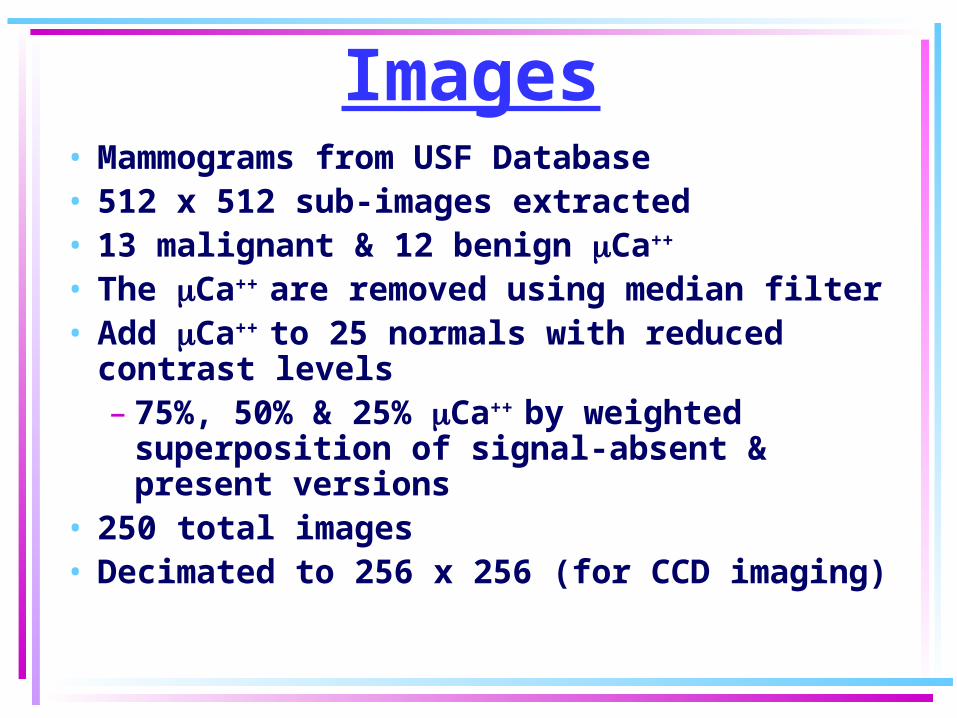
Images• Mammograms from USF Database • 512 x 512 sub-images extracted• 13 malignant & 12 benign Ca++
• The Ca++ are removed using median filter • Add Ca++ to 25 normals with reduced
contrast levels– 75%, 50% & 25% Ca++ by weighted
superposition of signal-absent & present versions
• 250 total images • Decimated to 256 x 256 (for CCD imaging)
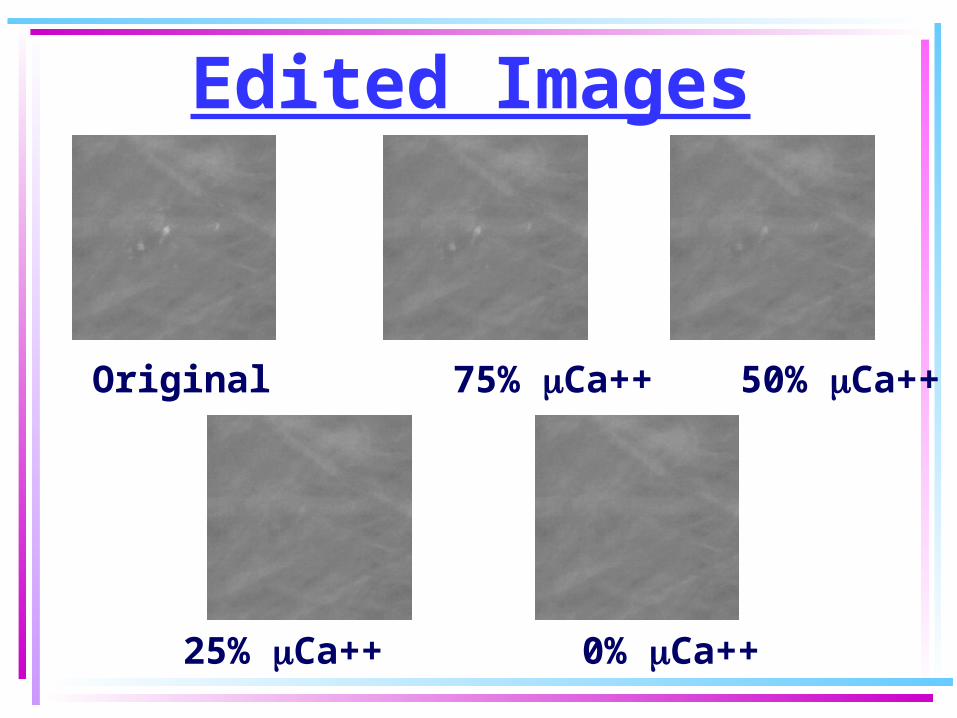
Edited Images
Original 75% Ca++ 50% Ca++
25% Ca++ 0% Ca++
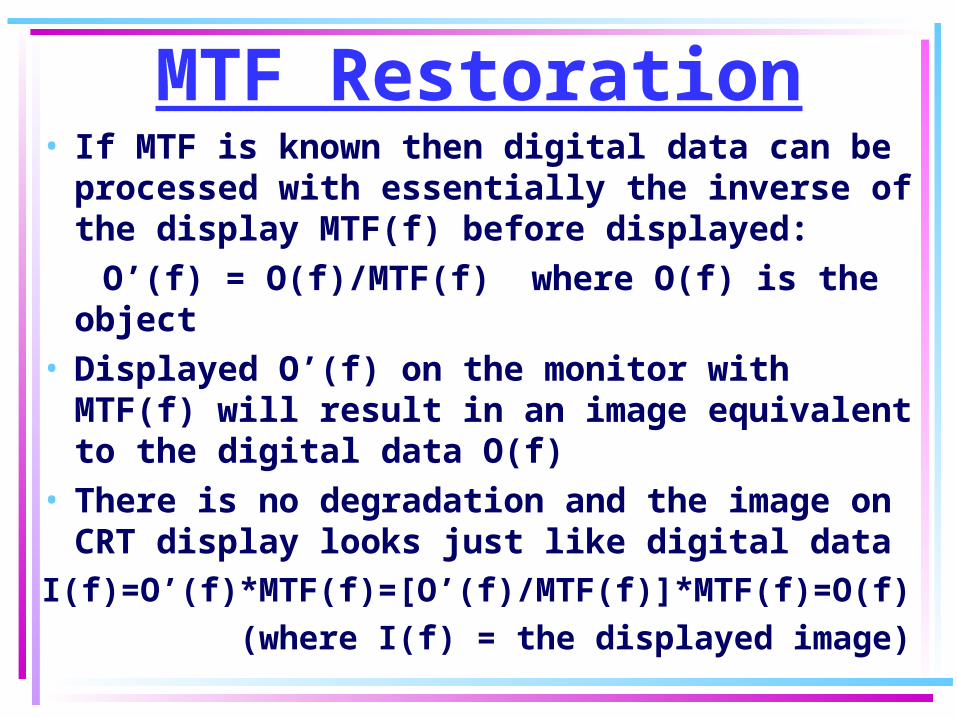
MTF Restoration• If MTF is known then digital data can be
processed with essentially the inverse of the display MTF(f) before displayed:
O’(f) = O(f)/MTF(f) where O(f) is the object
• Displayed O’(f) on the monitor with MTF(f) will result in an image equivalent to the digital data O(f)
• There is no degradation and the image on CRT display looks just like digital data
I(f)=O’(f)*MTF(f)=[O’(f)/MTF(f)]*MTF(f)=O(f) (where I(f) = the displayed image)
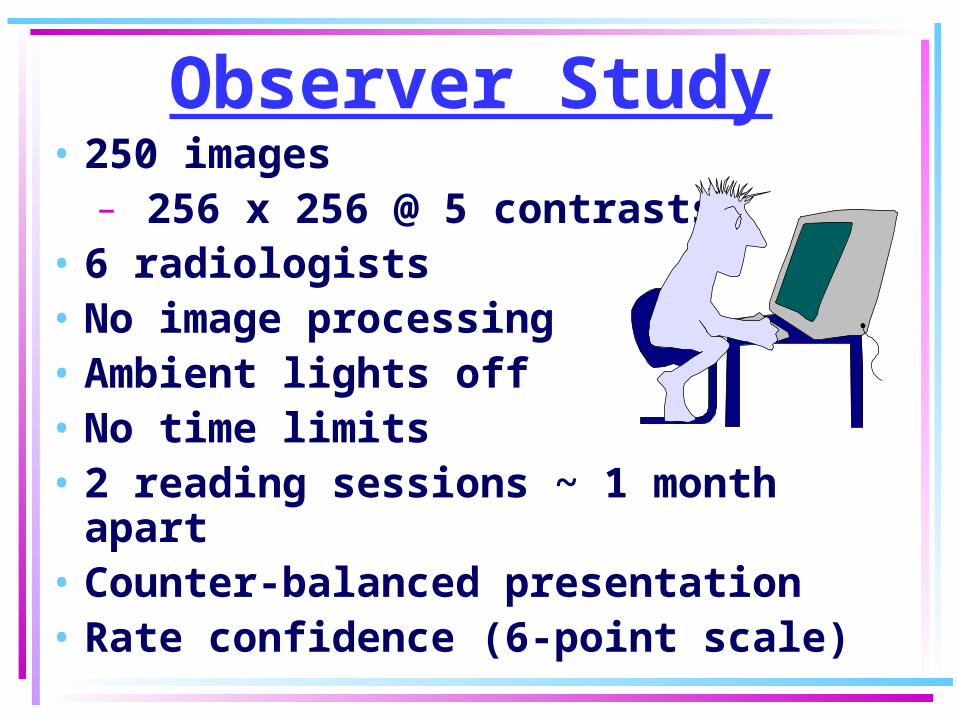
Observer Study• 250 images
– 256 x 256 @ 5 contrasts• 6 radiologists • No image processing • Ambient lights off• No time limits• 2 reading sessions ~ 1 month
apart• Counter-balanced presentation• Rate confidence (6-point scale)
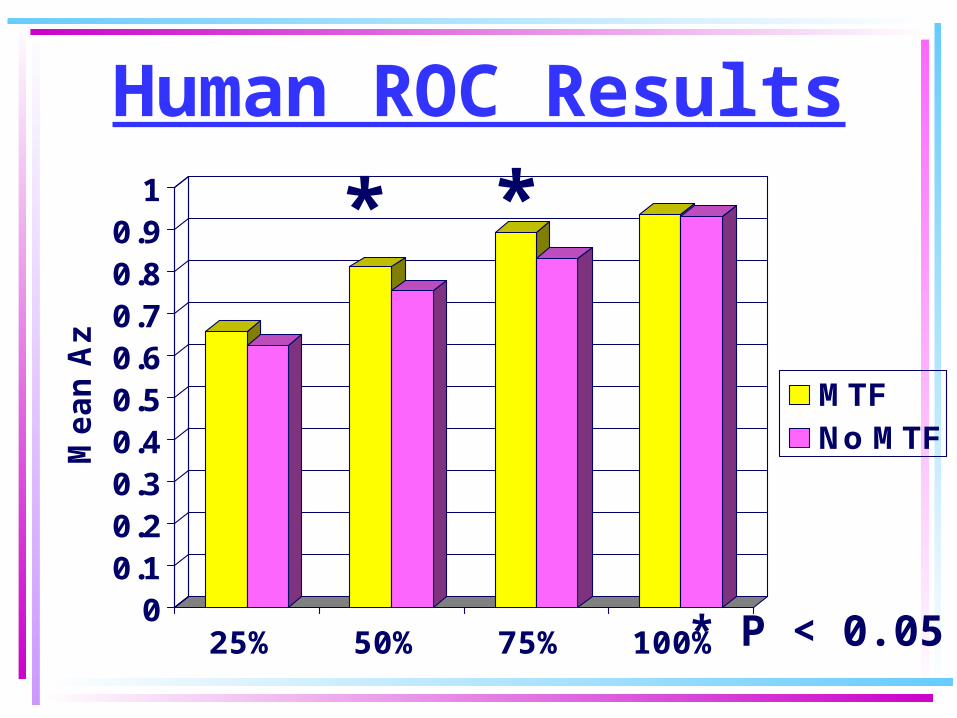
Human ROC Results
00.10.20.30.40.50.60.70.80.9
1
Mean A
z
25% 50% 75% 100%
MTFNo MTF
* *
* P < 0.05
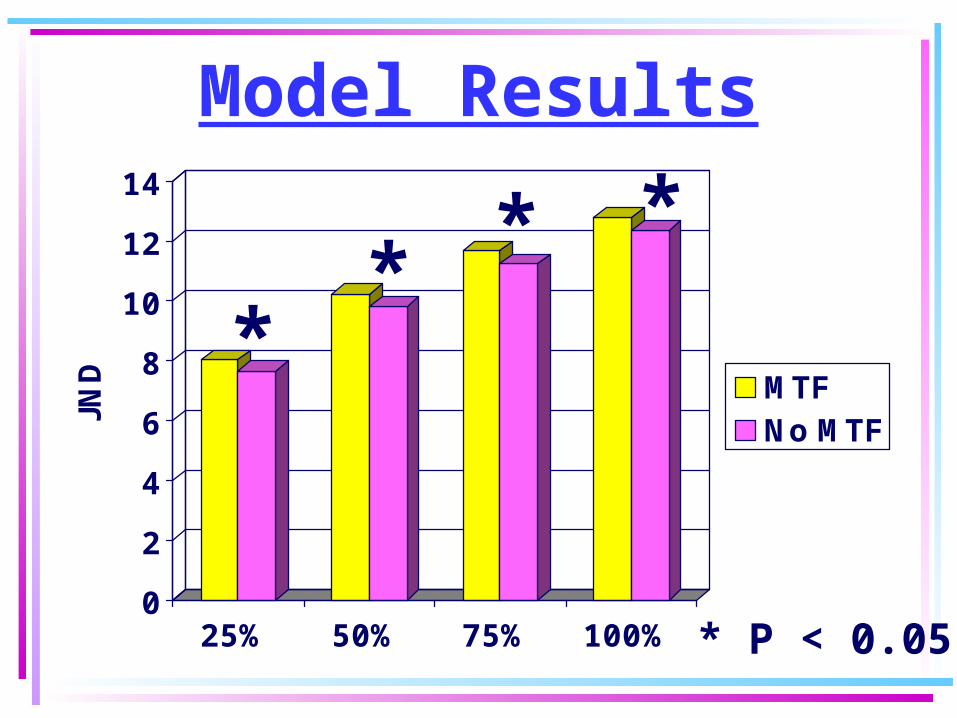
Model Results
0
2
4
6
8
10
12
14
JND
25% 50% 75% 100%
MTFNo MTF
* P < 0.05
**
* *
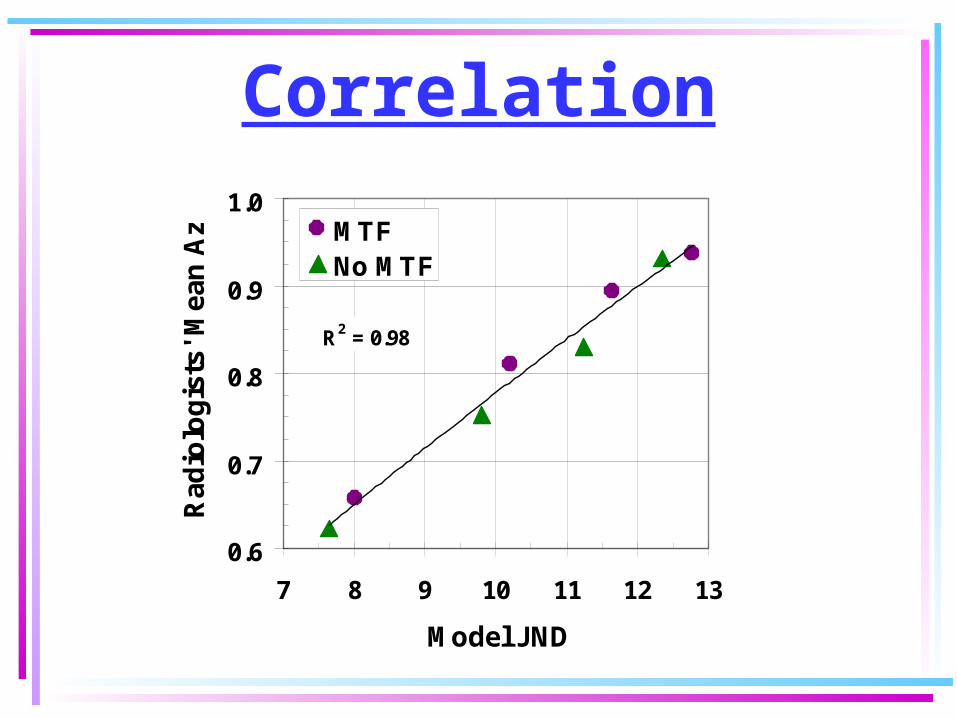
Correlation
0.6
0.7
0.8
0.9
1.0
7 8 9 10 11 12 13
Model JND
Rad
iolo
gis
ts' M
ean
Az MTF
No MTF
R2 = 0.98
Summary• MTF compensation improves
detection performance significantly• JNDmetrix model predicted human
performance well• High correlation between human &
model results• Future improvements to model may
include attention component derived from eye-position data
Model Results• Model predicted same pattern of
results as human observers– MTF processing yields higher
performance than without– At all lesion contrast levels
• Correlation between human Az and model JND is quite high